
 Open Access Article
 This Open Access Article is licensed under a Creative Commons Attribution-Non Commercial 3.0 Unported Licence
Facile preparation of fluorescent water-soluble non-conjugated polymer dots and fabricating an acetylcholinesterase biosensor†
Cai-Hong Liab,
Wei-Feng Wanga,
Nsanzamahoro Stanislasab and
Jun-Li Yang *a
*a
aCAS Key Laboratory of Chemistry of Northwestern Plant Resources, Key Laboratory for Natural Medicine of Gansu Province, Lanzhou Institute of Chemical Physics, Chinese Academy of Sciences (CAS), Lanzhou 730000, P. R. China. E-mail: yangjl@licp.cas.cn; Fax: +86-931-4968385; Tel: +86-931-4968385
bUniversity of Chinese Academy of Sciences, Beijing 100049, P. R. China
First published on 10th March 2022
Abstract
Acetylcholinesterase (AChE) has been demonstrated as a crucial enzyme in the development and treatment of Alzheimer's disease (AD). The present work reported the preparation of high fluorescence emission, water-soluble, non-conjugated polymer dots (NCPDs) via Schiff base reaction, and its self-assembly between hyperbranched poly(ethylenimine) (PEI) and pyrogallol in aqueous solutions. A one-pot method was introduced, which made the preparation process of the NCPDs more convenient, energy-efficient, and environmentally friendly. The mechanism of the inherent fluorescence of NCPDs and its fluorescence properties were investigated. This study, for the first time, explored the application of NCPDs to a nanoquencher biosensing system, discovering the reversible quenching effect of MnO2 nanosheets for NCPDs. Furthermore, the quenching mechanism of MnO2 for NCPDs was demonstrated to be an inner filter effect (IFE). The NCPDs–MnO2 biosensing system showed a broader detection range from 12.3 to 3675 U L−1 for AChE and the limit of detection (LOD) was as low as 4.9 U L−1. The sensing system has been applied to screen AChE inhibitors, and the result of the positive drug was highly consistent with previous studies. The established method showed a promising prospect in screening for leading compounds in new drug discoveries for AD.
Introduction
Acetylcholinesterase (AChE), a crucial enzyme for the treatment of Alzheimer's diseases (AD), can catalyze the hydrolysis of acetylcholine (ACh) into choline and acetic acid,1,2 leading to the termination of neurotransmission such as ACh at the cholinergic synapse in the neurological system. Meanwhile, a low level of ACh in the brain assumes responsibility for the symptom of AD,3 which affects approximately 44 million people worldwide.4 Up to now, the FDA (Food and Drug Administration) has approved five drugs for the treatment of AD, among which four drugs are AChE inhibitors. However, these drugs can only improve the cognitive function and AD patients still cannot fully recover.5 Even though a myriad of efforts and investments were made in the pharmaceutical industry and academia, no new drugs for curing AD have been developed in recent decades. Several treatment strategies were explored to treat AD in recent decades, among which enhancing cholinergic neurotransmission through inhibiting the AChE is one of the mainstream treatment options for AD. Despite the large number of AChE biosensors developed for screening its inhibitors, the universal assay today is still the spectrometric-based assay. Plus, the Ellman assay is the most commonly used colorimetric AChE assay.6 However, the above approach showed low sensitivity and a false-positive effect.7 Thus, developing a convenient and sensitive sensing assay is of great significance to AChE activity, as well as to screen its inhibitors for the treatment of AD.Nowadays, a large number of analytical methods have been established for the detection of AChE, including colorimetric,6–9 electrochemical,10 chemiluminescence,11 fluorescence,12–14 and others. Among them, fluorescent assays are fascinating and promising owing to their simplicity, convenience, high sensitivity, easy operation, and real-time detection.15 Fluorescent polymers and polymer nanoparticles have attracted great attention for application in biosensors and bioanalysis in recent decades.16,17 There are two types of polymer dots: conjugated polymer dots and non-conjugated polymer dots. Conjugated polymer dots (CPDs) possess distinct fluorescence emission properties. They are constructed without employing entrapment or covalent conjugation of fluorescent agents in the polymer, showing merits of high fluorescence intensities, excellent photophysical properties, multicolor fluorescence, clear luminescence mechanism, and widespread application. Nonetheless, there are still several irreplaceable drawbacks, such as complicated multistep synthesis routes, using environmentally detrimental organic solvents, insolubility, and high toxicity.18–21 Non-conjugated polymer dots (NCPDs), having aggregated polymer structures, are different from CPDs stemming from their assembly of fluorescent conjugated polymers.22 NCPDs with an aggregated or cross-linked polymer structure contain autochromophores or unconventional chromophores, such as aliphatic tertiary amine, carbonyl, ester, and amide (C![[double bond, length as m-dash]](https://www.rsc.org/images/entities/char_e001.gif) O, CN, CS),23–25 and are prepared by dehydration, condensation, carbonization or assembly routes.26 At the same time, their raw materials are readily accessible, and the synthesis processes are facile and convenient. Furthermore, NCPDs display distinct photostability, good water solubility, low toxicity, good biocompatibility, and they use eco-friendly materials. Due to their distinct structures and ample terminal groups, NCPDs are of great promise as novel fluorescent materials in the chemical and biological fields. As the study of NCPDs is still in the infant stage, the synthesis of new NCPDs and investigation of their essential properties are significantly meaningful.
O, CN, CS),23–25 and are prepared by dehydration, condensation, carbonization or assembly routes.26 At the same time, their raw materials are readily accessible, and the synthesis processes are facile and convenient. Furthermore, NCPDs display distinct photostability, good water solubility, low toxicity, good biocompatibility, and they use eco-friendly materials. Due to their distinct structures and ample terminal groups, NCPDs are of great promise as novel fluorescent materials in the chemical and biological fields. As the study of NCPDs is still in the infant stage, the synthesis of new NCPDs and investigation of their essential properties are significantly meaningful.
MnO2 nanosheets are a kind of two-dimensional nanomaterial that has drawn great attention due to their special advantages, such as high specific surface area, rich structural diversity, and catalytic properties.27 They show good biocompatibility and low toxicity in biosensor detection, such as the detection of H2O2, GSH, and glucose.28,29 In addition, MnO2 nanosheets possess outstanding quenching ability for the luminescent nanomaterials' fluorescence, playing a pivotal role in fluorescence sensing and bioimaging. MnO2 nanosheets have been employed to suppress the fluorescent emission of organic fluorescent particles, such as AuNCs and UCNPs.30,31 Such a property can be employed to constitute a sensing strategy for practical applications.32 Nonetheless, there are few studies in the literature to investigate the issues of whether MnO2 nanosheets can quench the fluorescence of NCPDs. Herein, the present work explored the abovementioned issues and developed a deeper understanding of the quenching mechanism of MnO2 nanosheets to as-synthesized NCPDs, as well as fabricated AChE sensor for the detection of AChE and its inhibitor.
The present work designed and developed a new strategy for the detection of AChE and screening AChE inhibitors. For the first time, we synthesized primarily novel NCPDs with high fluorescence intensity through a one-pot reaction at room temperature (Scheme 1). Secondly, MnO2 nanosheets were employed to suppress the fluorescence of NCPDs and construct an NCPDs–MnO2 biosensor system. Thirdly, in the absence of inhibitors, AChE catalyzed the conversion of ATCh to TCh, which led to the reduction of MnO2 nanosheets to Mn2+, triggering the restoration of the quenched fluorescence of NCPDs. Furthermore, in the presence of inhibitors, AChE activity was restrained and few TCh were generated, resulting in a low level of fluorescence recovery of NCPDs. Hence, a sensitive and selective fluorescent sensing method was established for the detection of AChE and its inhibitors in the aqueous solution. Finally, we hope that the NCPDs (with their easy preparation methods) and the NCPDs–MnO2 system (with its ultrasensitive response for AChE and its inhibitors) may hold a brilliant future in chemical sensing, biological imaging, material science fields, and drug screening system.
 | ||
| Scheme 1 Illustration of the MnO2–NCPDs sensor system for the detection of AChE and the screening of their inhibitors. | ||
Materials and methods
Chemicals and materials
AChE, ATCh, alkaline phosphatase (ALP), and tetramethylammonium hydroxide pentahydrate (TMA) were purchased from Sigma-Aldrich (St. Louis, MO, USA). IgG, quinine sulfate, and bovine serum albumin (BSA) were purchased from Shanghai Ryon Biological Technology (Shanghai, China). α-Glucosidase (α-Glu) was obtained from Beijing Solar Biotechnology (Beijing, China). Polyetherimide (PEI, Mw = 600, 1800, and 10![[thin space (1/6-em)]](https://www.rsc.org/images/entities/char_2009.gif) 000) was purchased from Yuan Ye Biotechnology Co., Ltd. (Shanghai, China). The dialysis bags (molecular weight cutoff is 1000 Da) and tyrosinase (Tyr) were obtained from Solarbio Technology Co., Ltd. (Beijing, China). Pyrogallol was obtained from Sa'en Chemical Technology Co., Ltd. (Shanghai, China). NH4HCO3, H2O2 (30%), and MnCl2·4H2O were purchased from Tianjin Kemiou Chemical Reagent Co., Ltd. (Tianjin, China). The ultrapure-water was purified by a Lakecore, ultrapure-water system (Shanghai, China). All reagents were of analytical grade without any further purification.
000) was purchased from Yuan Ye Biotechnology Co., Ltd. (Shanghai, China). The dialysis bags (molecular weight cutoff is 1000 Da) and tyrosinase (Tyr) were obtained from Solarbio Technology Co., Ltd. (Beijing, China). Pyrogallol was obtained from Sa'en Chemical Technology Co., Ltd. (Shanghai, China). NH4HCO3, H2O2 (30%), and MnCl2·4H2O were purchased from Tianjin Kemiou Chemical Reagent Co., Ltd. (Tianjin, China). The ultrapure-water was purified by a Lakecore, ultrapure-water system (Shanghai, China). All reagents were of analytical grade without any further purification.
Apparatus and characterization
The TEM images and energy dispersive X-ray spectroscopy (EDS) measurements were obtained from a transmission electron microscope (FEI Tecnai G2 TF20 USA). Fluorescence experiments were performed by a Horiba FluoroMax 4 spectrophotometer (HORIBA Scientific, Edison, NJ, USA). Absorption spectra were recorded by an UV-visible spectrophotometer (PerkinElmer Lambda 35, USA). The enzyme reaction was incubated in a SPH-2000 Shaking Incubator. Nuclear magnetic resonance (NMR) spectra of the NCPDs and PEI were employed by a Bruker AVANCE III-400 spectrometer (Bruker AXS GmbH, Karlsruhe, Germany).Preparation method for NCPDs
Pyrogallol (10 mg) was added to PEI aqueous solution (5 mL, 0.1 g mL−1). The mixture was uniformly mixed by magnetically stirring for 6 h at room temperature. The color of the mixture changed from colorless to brown. Subsequently, the prepared NCPDs aqueous solution was dialyzed with ultrapure water through a dialysis bag (molecular weight cutoff is 1000 Da) for 48 h. The solution in the dialysis bag was collected and stored at 4 °C for further study.Quantum yield measurement
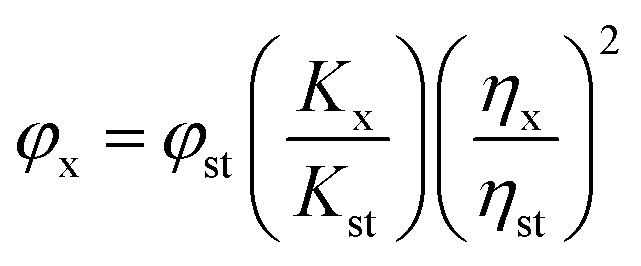
The quantum yield of the NCPDs in water was determined according to the previous method.33 Quinine sulfate in 0.1 M H2SO4 (φ = 54%) was chosen as a standard to estimate the quantum yield in this work. The following equation was used to calculate the quantum yield:
 | (1) |
The φ means the quantum yield; K presents the slope of the integrated fluorescence intensity against absorbance, and η is the refractive index. The subscript “st” refers to the standard, and “x” refers to the samples.
Preparation of the MnO2 nanosheets
The preparation method for the MnO2 nanosheets was performed according to the previous method.34 Primarily, H2O2 (30%, 2 mL) was added to TMA (1.0 M, 12 mL), and then MnCl2·.4H2O (0.3 M, 10 mL) was mixed into the above solution in the dark as soon as possible. The reaction was stirred vigorously for 8 h at room temperature. Then, the prepared MnO2 nanosheets were stored at 4 °C for further study. The concentration of the MnO2 nanosheets was calculated by the Lambert–Beer law with a molar extinction coefficient of 9.6 × 10³ M−1 cm−1.NCPDs fluorescence quenched by MnO2 nanosheets
An aqueous solution of MnO2 nanosheets (53.0 μM) at various volumes (0, 5, 10, 15, 20, 30, 40, 50, 60, 80, 100 μL) was added to 200 μL of a 40-fold dilution of NCPDs, and the fluorescence emission spectra were measured.Assays for AChE activities
First, various concentrations of AChE were mixed with ATCh (20 μL, 10 mM) (Fig. S11†). Subsequently, 20 μL of NH4HCO3 (pH = 8.2, 10 mM) was added and the mixture was incubated at 37 °C for 10 min. Then, MnO2 nanosheets (50 μL, 53.0 μM) and 100 μL of a 20-fold dilution of NCPDs were added to the microcentrifuge tubes (the final volume was 200 μL). Thereafter, the fluorescence emission spectra were measured.Specificity and interference of the AChE assays
The selectivity for the AChE assays was employed by using other nonspecific proteins, such as Aβ, IgG, Tyr, α-Glu, and BSA. AChE (20 μL, 0.01 mg mL−1) was used in the absence and presence of the control enzymes/proteins in the NCPDs–MnO2 sensing system for anti-interference capability investigation. Thereafter, the fluorescence emission spectra were monitored by a fluorescence spectrometer.AChE inhibition assay
AChE (20 μL, 0.01 mg mL−1) was first added to 10 μL of tacrine with different concentrations (50 μM–0.05 nM) and 20 μL of NH4HCO3 (10 mM, pH = 8.2). After 10 min incubation at 37 °C, ATCh (20 μL, 10 mM) was added and incubated for 10 min. Then, MnO2 nanosheets (50 μL, 53 μM) and 100 μL of a 20-fold dilution of NCPDs were added to the microcentrifuge tubes, and the fluorescence emission spectra were measured.Statistical analysis
Each experiment was performed three times. Data were statistically analyzed using Origin Pro 8.0 software.Results and discussion
Preparation and characterization of the NCPDs
The microstructure and morphology of the as-synthesized NCPDs were verified by TEM images. As shown in Fig. 1A, the novel NCPDs had a good spherical shape, and the diameter of NCPDs ranged from 1.5 to 3.5 nm with an average diameter of 2.5 nm (Fig. 1B). Previous studies reported that polymer dots with a size less than 10 nm in diameter are desirable for certain applications, e.g., biological tracing.35 In addition, we investigated the surface chemical groups of the as-synthesized NCPDs via FT-IR spectroscopy (Fig. 1D). The absorption peaks of NCPDs at 1669 and 1586 cm−1 were attributed to the vibrational modes of the amide, which was assigned to the CN bond.36 The absorption peaks of NCPDs at 877 and 934 cm−1 were ascribed to the bending vibration of aromatic rings, which indicated that the pyrogallol partly reacted with PEI. This was based on our comparison of the FT-IR spectroscopy of pyrogallol, which had the characteristic stretching of aromatic rings at 764 and 761 cm−1 (Fig. S1D†). A strong and broad band at 3419 cm−1 and a single peak located at 1410 cm−1 were ascribed to the characteristic stretching modes of the N–H bond, indicating that the amino groups in the NCPDs stemmed from the reaction between PEI and pyrogallol. There was a new proton peak at 8.00 ppm belonging to NCH protons36 in the low-field region. Meanwhile, PEI and pyrogallol showed no signal at these locations (Fig. 1C and S1C†). The ζ potential of NCPDs in water was 0.72 ± 0.2 mV, which was much lower than that of PEI at 46.5 ± 1.3 mV,37 verifying the reaction between PEI and pyrogallol. Meanwhile, there were C, N, O, and H elements in the EDS spectrum, showing that the prepared NCPDs had these four elements (Fig. S1B†). There was a new absorption peak in the UV-Vis absorption spectrum for NCPDs at 270–330 nm. However, the UV-Vis absorption spectrum of PEI and pyrogallol showed no new absorption peak at 270–330 nm (Fig. S1A†). All of the above firmly confirmed the successful preparation of NCPDs. As PEI and pyrogallol have good water solubility, the synthesis process for the NCPDs is performed in an aqueous solution at room temperature. Hence, the preparation of NCPDs reported here demonstrated very facile, energy-efficient, and eco-friendly characteristics compared with other methods, such as nanoprecipitation and emulsion polymerization, which are sophisticated and usually conducted in organic solvents.38,39
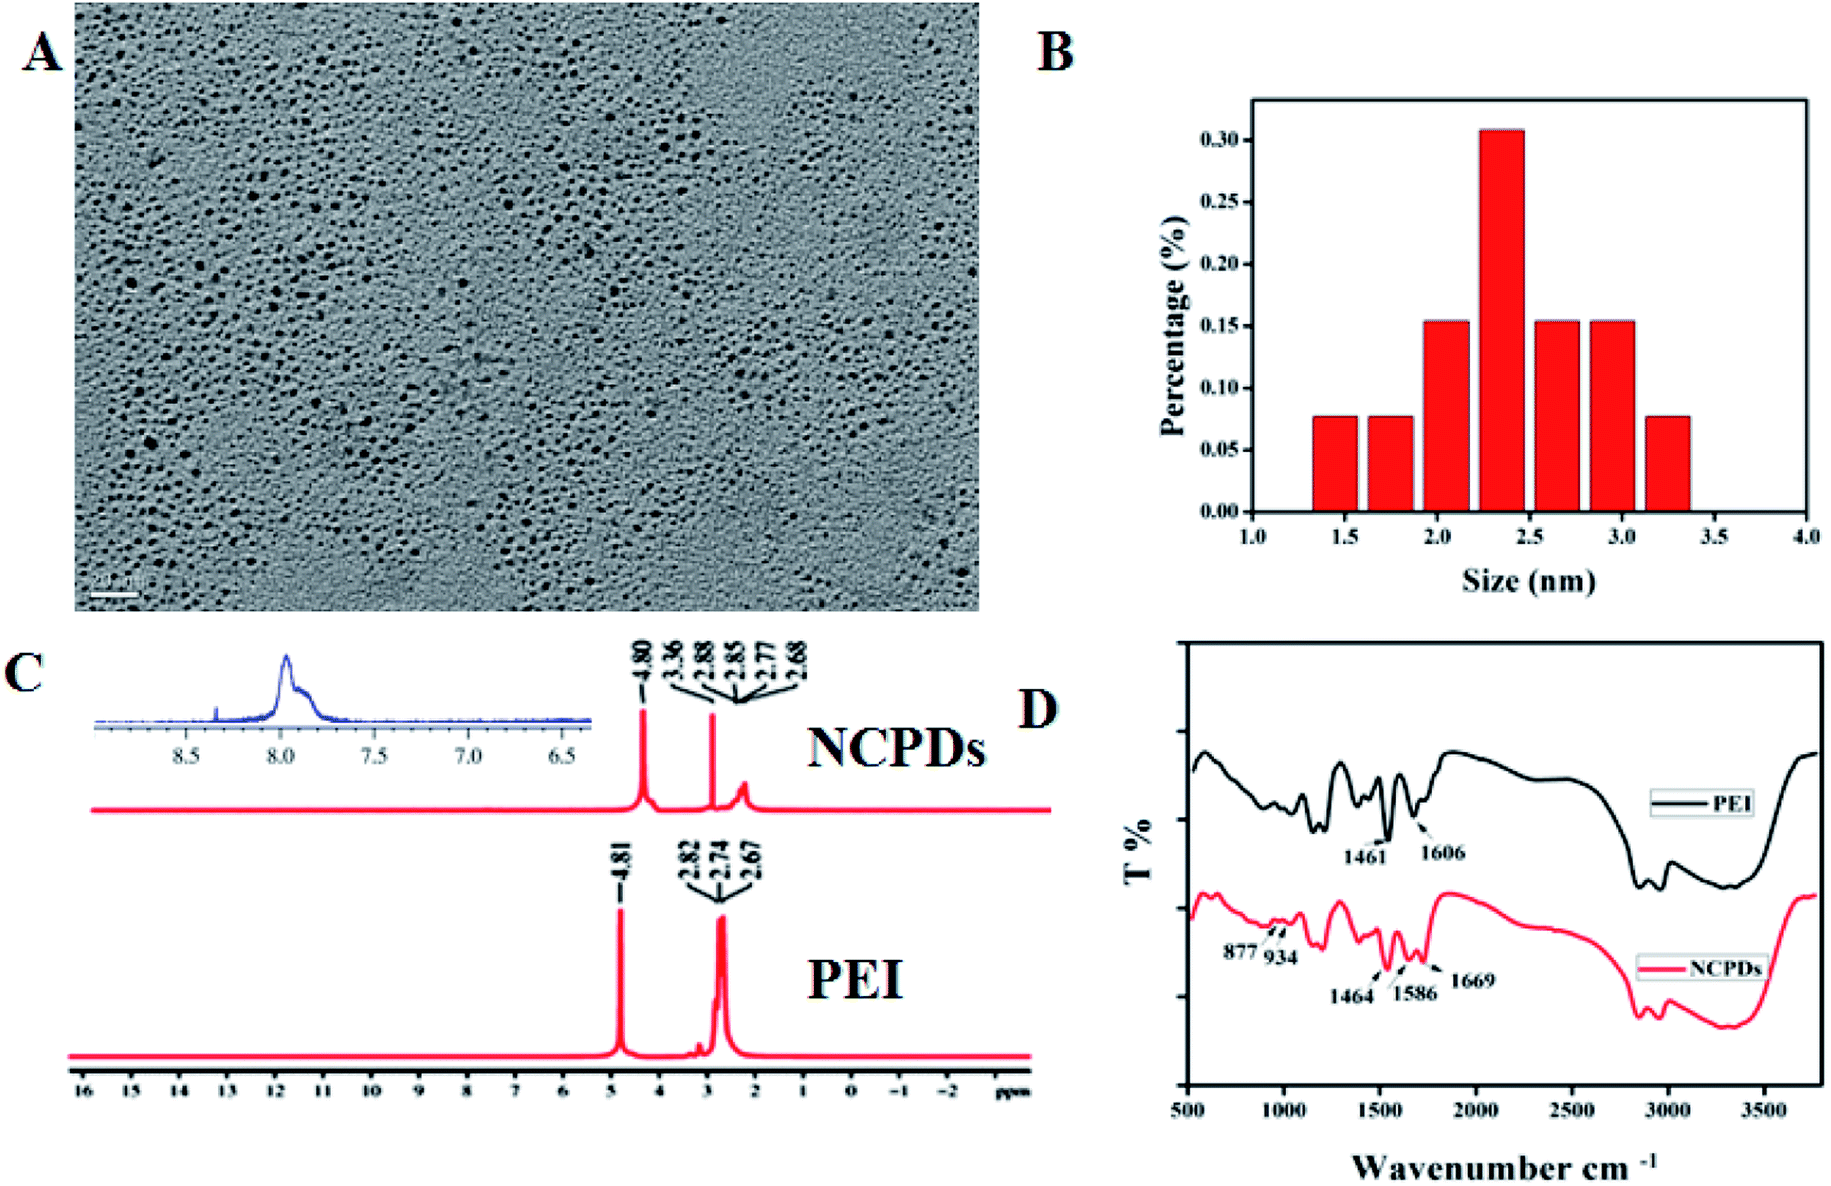 | ||
| Fig. 1 (A) TEM image of NCPDs. (B) Size distribution histogram of NCPDs. (C) NMR spectra of PEI and NCPDs. (D) FT-IR spectra of PEI and NCPDs. | ||
Fluorescent properties of the NCPDs
The aqueous solution of 20-fold diluted NCPDs showed a faint yellow color, emitting bright green fluorescence under a 365 nm UV lamp (inset of Fig. 2A), while commercial PEI or pyrogallol alone has insignificant fluorescence (Fig. 3C). As shown in Fig. 2A, the optimal excitation wavelength was 396 nm, and the maximum emission wavelength was 507 nm. As shown in Fig. 2B, the excitation wavelength of NCPDs changed from 310 to 396 nm, but the emission peak position was stable, indicating no excitation wavelength dependence. That was completely different from the typical red emission phenomenon of carbon dots,40 suggesting NCPDs with a stable chromophore, which was different from the carbon dots that were synthesized by PEI. When the NCPDs were diluted to different concentrations, the fluorescence emission intensity of the NCPDs decreased nonlinearly (Fig. S3†). The reason for this nonlinear concentration-dependent phenomenon may be due to the internal filtration effect.41 The fluorescence quantum yield of the NCPDs aqueous solution was calculated to be 0.88% using quinine sulfate as a standard reference. In addition, the fluorescence stability of the as-prepared NCPDs was investigated. As shown in Fig. S4A,† the relative fluorescence intensity (F/F0) of the NCPDs preserved for 120 days at 4 °C remained almost stable. Moreover, we compared the difference of the newly prepared NCPDs with NCPDs preserved for 6 months at 4 °C. The results showed that the fluorescence intensities of these two samples were almost similar, suggesting desirable long-term storage stability of NCPDs (the inset picture shows the color of the newly prepared NCPDs and NCPDs preserved for 6 months under UV light at 365 nm, Fig. S4B†). Subsequently, the stability of NCPDs in various pH values was also investigated. The results showed that the fluorescence intensity of the NCPDs exhibited no obvious change with pH values varying from 3 to 12. This demonstrated that the chromophore on the surface of the NCPDs was not impacted by the pH changes, which is pivotal for biosensor analysis (Fig. S5†). | ||
| Fig. 2 (A) Excitation and emission spectra of NCPDs, and UV-Vis absorption spectra of NCPDs. The inset shows the photographs of NCPDs under room light and UV light. (B) Fluorescence emission spectra of NCPDs under different excitations. (C) Fluorescence emission spectra of NCPDs prepared from PEI with different molecular weights. (D) Fluorescence emission spectra of NCPDs before (a) and after (b) reduction by NaBH4. | ||
 | ||
| Fig. 3 (A) TEM image of the MnO2 nanosheets. (B) UV-Vis absorption spectra of MnO2 nanosheets. (C) UV-Vis absorption spectra of different substances added to the NCPDs solution. (D) The fluorescence quenching efficiency with increased concentrations of MnO2 nanosheets. | ||
According to previous studies, researchers demonstrated that the fluorescence stemming from particles and gels formed by PEI and formaldehyde was derived from radiative decay through excited Schiff base bonds.42 Therefore, in this work, the inherent fluorescence of NCPDs also may stem from the n ← π* transitions of Schiff base bonds. Even though the NCPDs lack a continuous conjugated chain, its formation of a compact and rigid structure may restrain the intramolecular rotations of Schiff base bonds. This way further confines the nonradiative pathways and results in radiative decay, facilitating the fluorescence emission of NCPDs. To confirm the fluorescence mechanism of NCPDs, we employed PEI with different molecular weights to react with pyrogallol. PEI with various molecular weights (Mw = 600, 1800, and 10000) was used for reaction with pyrogallol. The fluorescence intensity of NCPDs was enhanced with the increasing molecular weight of PEI, and the maximum emission wavelength was constant (Fig. 2C). This result indicated that with increasing hyperbranched macromolecular PEI, there was a greater formation of Schiff bases on the surface of NCPDs.
Generally, imine bonds can be easily reduced by a strong reducing agent, such as sodium borohydride (NaBH4), to secondary amines.43 However, the aromatic nuclei are unable to be reduced by NaBH4.
 | (2) |
We performed an experiment where the NCPDs were treated with NaBH4. As shown in Fig. 2D, the fluorescence of NCPDs at 507 nm decreased since –NCH– was reduced to –R–NH–, resulting in a fluorescence decrease. The reduction emission spectrum of NCPDs was blue-shifted from 507 to 493 nm because of the formation of a new bond, which was different from the old bonds on the surface of NCPDs. This result confirmed the existence of Schiff base bonds in NCPDs, which mainly explained the principle of the inherent fluorescence of NCPDs.
Verification of the interaction between NCPDs and MnO2 nanosheets
As shown in Fig. 3A, the TEM pictures showed the morphology of the newly prepared MnO2 nanosheets. They exhibited an obvious two-dimensional sheet-like morphology, and a broad UV-Vis absorption ranging from 200 to 700 nm with a peak centered at 380 nm (Fig. 3B). The FT-IR absorption peak of the as-prepared MnO2 nanosheets was located at 515 cm−1, which was attributed to the stretching vibration mode of the Mn–O bond. At the same time, there were M and O elements for the EDS (Fig. S2A and B†), indicating the successful preparation of the MnO2 nanosheets.As displayed in Fig. 3C, the fluorescence intensity of NCPDs at 507 nm clearly decreased with the addition of the MnO2 nanosheets. When the Mn2+, pyrogallol, and PEI were each added to the NCPDs solution, the fluorescence intensity of the NCPDs remained the same. This indicated that these compounds could not interact with the NCPDs. Furthermore, the UV-Vis spectra of the NCPDs with added PEI, MnO2 and pyrogallol remained the same: no new absorption peaks occurred, meaning there is no new substance generated (Fig. S6†). As shown in Fig. 3D, the quenching efficiency E% (the formula seen in ESI†) improved with enhancing concentrations of MnO2 nanosheets. When the concentration of the MnO2 nanosheets increased to 8.3 μM, the E% increased slowly and gradually exhibited equilibrium. The E% was up to 95% when the MnO2 nanosheet concentration increased to 12.3 μM. In addition, we studied the reaction time of the fluorescence quenching process. The MnO2 nanosheets were added to the NCPDs solution. The fluorescence quenching procedure rapidly and quickly achieved a stable stage, indicating that the NCPDs–MnO2 sensor system formed quickly and readily (Fig. S7†). Hence, 2 min was chosen as the reaction time of the fluorescence quenching procedure.
Quenching mechanism of NCPDs by MnO2 nanosheets
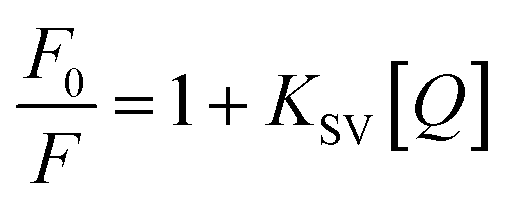
Generally, fluorescence resonance energy transfer technology (FRET), inner filter effect (IFE), dynamic quenching effect (DQE), and static quenching effect (SQE) account for the MnO2 nanosheets quenching the fluorescence for nanoparticles.44,45 To understand the exact mechanism of the fluorescence of NCPDs quenched by MnO2 nanosheets, the following experiments were carried out.In DQE, the excited-state fluorophore is nonradiative and deactivated upon collision with the quencher.45 DQE can be explained by the Stern–Volmer equation:
 | (3) |
The [Q] means the concentration of the quencher, such as MnO2 nanosheets in this system. F0 and F are the fluorescence intensities of NCPDs in the absence and presence of the MnO2 nanosheets, respectively. According to DQE, we plotted the fluorescence intensity ratio (F0/F) as a function for the concentrations of the MnO2 nanosheets. As shown in Fig. 4A, the relationship of F0/F between the concentrations of the MnO2 nanosheets was exponential, and there was no linear relationship between F0/F and the concentrations of the MnO2 nanosheets. Therefore, DQE cannot explain the mechanism of this fluorescence quenching process.
 | ||
| Fig. 4 (A) The exponential fitting curve of the relationship between F0/F and the concentrations of the MnO2 nanosheets. (B) UV-Vis absorption spectra of different substances, such as NCPDs, MnO2, and NCPDs–MnO2. (C) FT-IR spectra of MnO2 nanosheets (black curve), NCPDs (red curve), and NCPDs–MnO2 (green curve). (D) The observed quenching efficiency (black curve) and the corrected quenching efficiency by removing the contribution of IFE (red curve) of NCPDs toward different concentrations of MnO2 nanosheets. | ||
Moreover, according to SQE, the fluorophore forms a nonfluorescent complex with the quencher in a static quenching process. When this complex absorbs light, it immediately returns to the ground state without photon emission.46 On this basis, we discovered that no new absorption peaks were appearing in the NCPDs–MnO2 nanocomposites according to the FT-IR spectrum (Fig. 4C). Furthermore, the UV-Vis spectrum indicated that there were no fluorescent quencher complexes formed in this quenching system either (Fig. 4B). Thus, the SQE also might not account for the fluorescence quenching process.
There was a large overlap between the absorbance spectrum of the MnO2 nanosheets from 200 to 700 nm and the excitation spectrum of NCPDs ranging from 300 to 500 nm (Fig. S8†). We measured the decay time of NCPDs in the absence and presence of MnO2 nanosheets. The results indicated that the decay time of NCPDs and NCPDs–MnO2 were both 5.86 ns, meaning that there was no obvious change for the decay time after the addition of the MnO2 nanosheets (Fig. S9†). Therefore, the quenching mechanism of NCPDs by the MnO2 nanosheets was first considered to stem from IFE.47,48 Therefore, the IFE in the quenching process was also studied. Given the cuvette geometry used in our fluorescence measurements, the quenching efficiency from IFE was carefully calculated (Table S1†). The observed quenching efficiency and the corrected quenching efficiency (by removing the contribution of IFE) were figured out with the addition of different concentrations of MnO2 nanosheets to the NCPDs solution. The correction factor (CF) of IFE concerning each concentration of MnO2 nanosheets was estimated. As shown in Fig. 4D, we found that there was a remarkable difference between the observed and corrected fluorescence quenching efficiencies. We also found that approximately 50% of the suppressed effect was derived from the IFE, suggesting that IFE mainly accounted for the fluorescence quenching process.48 Additionally, fluorescence resonance energy transfer technology (FRET) is energy produced between two fluorescent molecules in a proximity transfer phenomenon.49 Energy transfer can happen when (1) the donor and fluorophore acceptor have sufficient spectral overlap, and (2) the donor and fluorophore acceptor are near one another (a few nanometers).50 As shown in Fig. S10,† there is no spectral overlap between the excitation spectrum of NCPDs and emission spectrum of MnO2 nanosheets. The MnO2 nanosheets are non-fluorescent nanoparticles. Thus, FRET may have no contributions to the fluorescence quenching process.
Detection of AChE activity
As shown in Fig. 5A, in the presence of AChE and ATCh in the NCPDs solution, the fluorescence intensity of the NCPDs showed no obvious change. This suggested that AChE and ATCh could not influence the fluorescence intensity of the NCPDs. Furthermore, when the MnO2 nanosheets were added to the NCPDs solution, there was a remarkable fluorescence decrease. However, when AChE and ACTh were added to the NCPDs–MnO2 biosensing system, the fluorescence of the NCPDs was recovered. AChE catalyzed ATCh to produce TCh, leading to the reduction of the MnO2 nanosheets to Mn2+, which triggered the restoration of the quenched fluorescence. The linearity and limit of detection were investigated. As shown in Fig. 5B, with the concentration of AChE increasing from 0 to 3675 U L−1, the fluorescence intensities of the ATCh–NCPDs–MnO2 system continuously increased. The NCPDs–MnO2 sensor system for detecting AChE showed a broad linear relationship from 12.3 to 3675 U L−1. With the concentration of AChE from 12.3 to 3675 U L−1, the regression equation was F/F0 = 0.528 + 0.121logCAChE with a correlation coefficient (R2) of 0.973. The detection limit (LOD) was down to 4.9 U L−1 (Fig. 5C). The broader detection range is comparable or even better than those of previous strategies, and the detection method takes less time and is easier to perform than previous methods (Table 1). This demonstrates that the proposed method is sensitive, time-efficient, as well as energy-efficient for the detection of AChE in vivo.
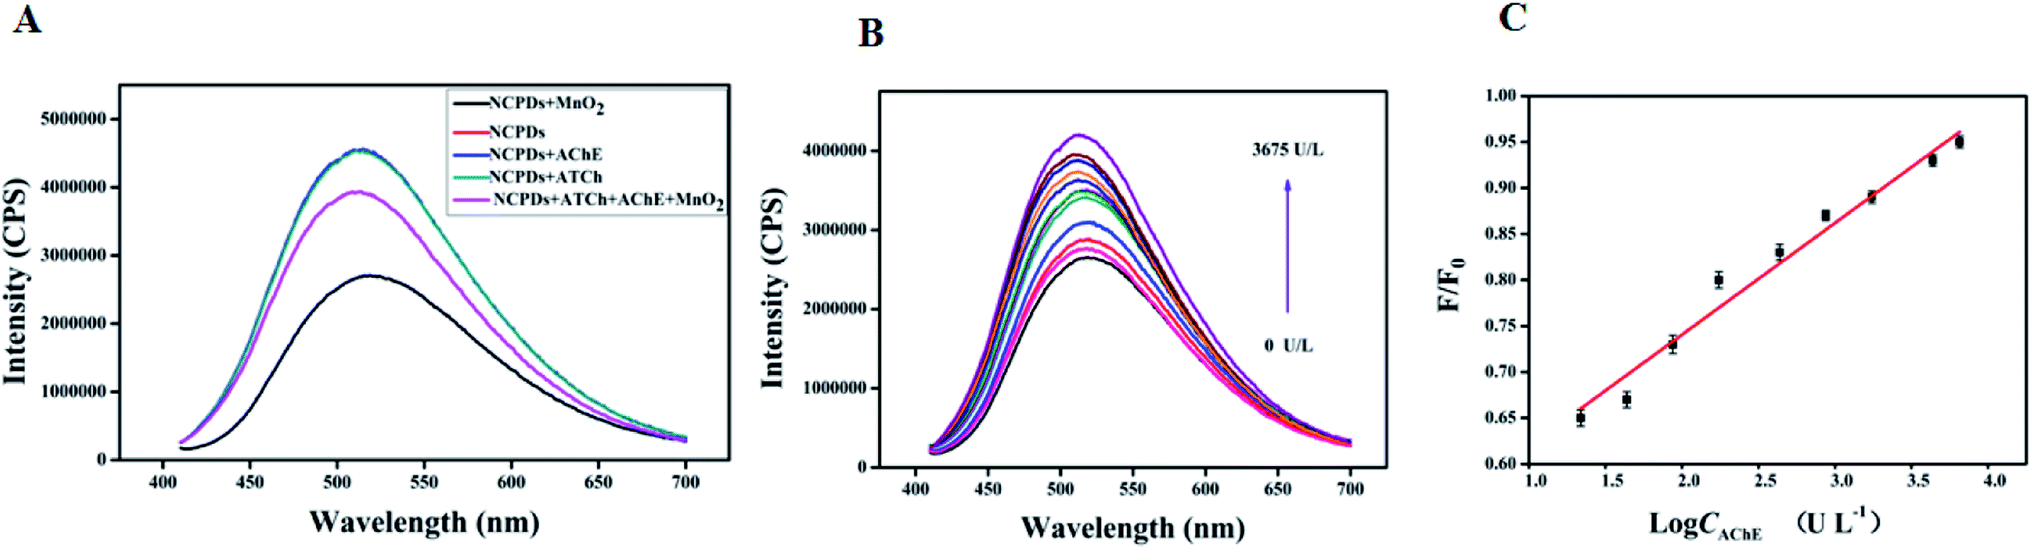 | ||
| Fig. 5 (A) Fluorescence emission spectra of NCPDs added into substances, including AChE and ATCh. (B) Fluorescence emission spectra of the NCPDs–MnO2 system added to different concentrations of AChE, ranging from 0 to 3675 U L−1. (C) The linear relationship of the concentrations of AChE and relative fluorescence intensity. | ||
| Materials | Methods | Conditions | Linear range U L−1 | Reference |
|---|---|---|---|---|
| a RT: room temperature. | ||||
| C3N4 nanodots | Fluorometric | pH 7.0, RT, 35 min | 0.01–3 | 54 |
| Resurfaced fluorescent protein | Fluorometric | pH 7.0, RT, 35 min | 0.025–2 | 55 |
| AuNCs | Fluorometric | pH 8.0, 37 °C, 40 min | 5–150 | 56 |
| DNA–CuNCs/AgNCs | Fluorometric | pH 8.0, 37 °C, 40 min | 0.05–2.0 | 57 |
| PEI–CuNCs | Fluorometric | pH 7.0, 37 °C, 25 min | 3.0–200 | 58 |
| Ag+–TMB | Colorimetric | pH 8.0, 35 °C, 45 min | 0–0.03 | 59 |
| I−–H2O2–TMB | Colorimetric | pH 8.0, 37 °C, 35 min | 0.05–5 | 60 |
| NCPDs–MnO2 | Fluorometric | pH 8.0, RT, 22 min | 12.3–3675 | This work |
Specificity of the sensing system
The selectivity and anti-interference ability of the NCPDs–MnO2 sensor system were analyzed in the presence of AChE and non-specific proteins. As shown in Fig. 6A, none of the interferences could induce a remarkable fluorescence change in the NCPDs–MnO2 sensor system since AChE catalyzed ATCh to TCh, triggering the decomposition of the MnO2 nanosheets. In Fig. 6B, when IgG, α-Glu, BSA, Tyr, and Aβ were each added to the AChE–NCPDs–MnO2 system, the F/F0 remained constant. This meant that the explored system had good tolerance. Subsequently, the AChE–NCPDs–MnO2 system was applied to screen the AChE inhibitors. | ||
| Fig. 6 (A) The selectivity for the NCPDs–MnO2 biosystem. (B) The anti-interference ability for the AChE–NCPDs–MnO2 biosystem. | ||
AChE inhibitor study
Several reports suggested that inhibition of AChE activity was a desirable strategy for the treatment of AD.51 We employed the AChE–NCPDs–MnO2 sensing system to screen AChE inhibitors with tacrine as the positive control. When various concentrations of tacrine were added to the AChE–NCPDs–MnO2 system, the enzyme hydrolysis reaction was suppressed and a small amount of TCh was generated, causing MnO2 to partly reduce to Mn2+ (Fig. 7A). The inhibition efficiency formula (IE) of AChE was used for the analysis of tacrine (the formula seen in ESI†).52 The IC50 value of tacrine was calculated to be 0.31 μM (Fig. 7B), which was consistent with the reported data with an IC50 value of 0.50 μM.53 Meanwhile, this study also investigated the IC50 value of the tacrine based on the traditional Ellman's assay, whose IC50 value was 0.79 μM (Fig. 7C), which was close to our methods. Additionally, the fluorescence emission of NCPDs at 507 nm avoided the false-positive effect in Ellman's assays since flavonoid compounds showed strong absorption at 405 nm, meaning that the proposed method for the screening of AChE inhibitors is practical. The above AChE inhibitors screening system will provide promising application in discovering the leading compound for the treatment of AD.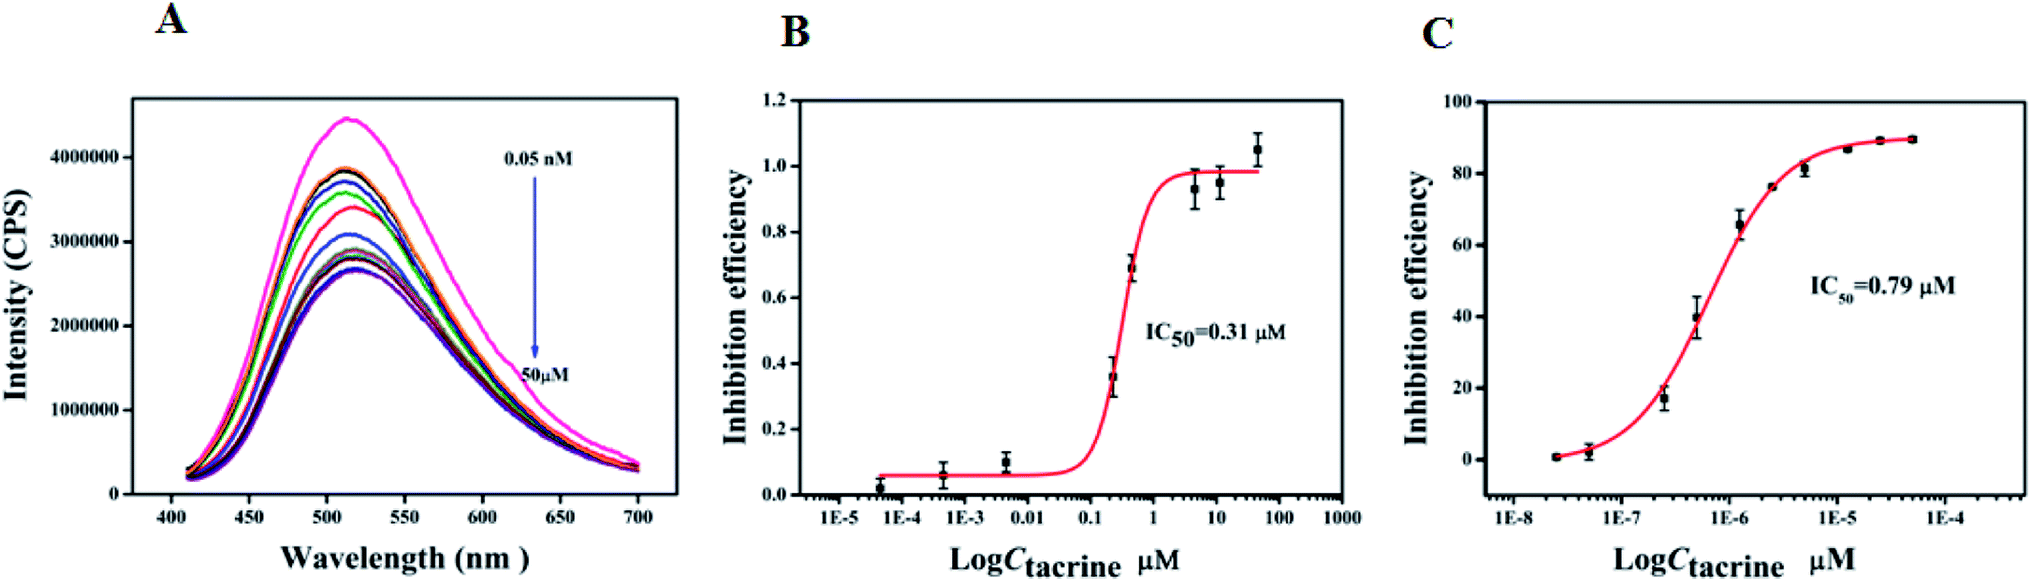 | ||
| Fig. 7 (A) Fluorescence emission spectra of AChE–NCPDs–MnO2 with different concentrations of tacrine from 0.05 nM to 50 μM. (B) IC50 value of tacrine obtained by the method. (C) IC50 value of tacrine employed by Ellman assays. | ||
Conclusions
In this study, the novel strong fluorescence emission of NCPDs was created by universal commercial raw materials: PEI and pyrogallol via Schiff base reaction and self-assembly at room temperature, which was very facile and ecologically friendly in comparison with most reported methods for fluorescent polymer dots. The fundamental properties of the NCPDs were studied, and the possible mechanism of fluorescence were discussed. The NCPDs exhibited excellent water solubility and long-term storage stability, as well as outstanding pH tolerance. We have employed NCPDs to develop a fluorescent sensor for the detection of AChE based on the fluorescence of NCPDs quenched by MnO2 nanosheets due to the inner filter effect. This sensor system provided ultrasensitive detection of AChE with the detection from 12.3 to 3675 U L−1, and also presented excellent selectivity and anti-interference ability. This sensing system was successfully used to screen AChE inhibitors. Finally, we hope that NCPDs (with their ease of preparation)s and the NCPDs–MnO2 system (with its ultrasensitive response for AChE and its inhibitors) may hold a brilliant future for widespread applications in chemical sensing, biological imaging, material science fields, and drug screening system.Ethical approval
This article does not contain any studies with human subjects.Conflicts of interest
The authors declare that they have no known competing financial interests or personal relationships that could have appeared to influence the work reported in this paper.Acknowledgements
This work was financially supported by the National Key Research and Development Project (2018YFE0182500), National Natural Science Foundation of China (No. 81673325), CAS “Light of West China” Program, and CAS Pioneer Hundred Talents Program.References
- T. Tian, X. Li, J. Cui, J. Li, Y. Lan, C. Wang, M. Zhang, H. Wang and G. Li, ACS Appl. Mater. Interfaces, 2014, 6, 15456–15465 CrossRef CAS PubMed.
- L. Lu and Y. Xia, Anal. Chem., 2015, 87, 8584–8591 CrossRef CAS PubMed.
- E. Gniazdowska, P. A. Ko. Miński, M. Wasek, M. Bajda, J. Sikora, E. B. Mikiciuk-Olasik and P. Szymański, Bioorg. Med. Chem., 2017, 25, 912–920 CrossRef CAS PubMed.
- M. Prince, E. Albanese, M. Guerchet and M. Prina, Alzheimer's Dementia, 2014, 11, 837–841 Search PubMed.
- Y. Wu, Z. Li, Y.-Y. Huang, D. Wu and H.-B. Luo, J. Med. Chem., 2018, 61, 5467–5483 CrossRef CAS PubMed.
- G. L. Ellman, K. D. Courtney, V. Andres and R. M. Featherstone, Biochem. Pharmacol., 1961, 7, 88–95 CrossRef CAS PubMed.
- S. Liao, W. Han, H. Ding, D. Xie, H. Tan, S. Yang, Z. Wu, G. Shen and R. Yu, Anal. Chem., 2013, 85, 4968–4973 CrossRef CAS PubMed.
- B. Wang, H. Wang, F. Wang, G. Zhou, Y. Wang, S. Kambam and X. Chen, Bioorg. Med. Chem. Lett., 2014, 24, 552–555 CrossRef CAS PubMed.
- P. Ni, Y. Sun, H. Dai, S. Jiang, W. Lu, Y. Wang, Z. Li and Z. Li, Microchim. Acta, 2016, 183, 2589–2595 CrossRef CAS.
- C. Ye, M.-Q. Wang, X. Zhong, S. Chen and Y. Chai, Biosens. Bioelectron., 2016, 79, 34–40 CrossRef CAS PubMed.
- S. Sabelle, P. Y. Renard, K. Pecorella, S. De Suzzoni-Dézard, C. Créminon, J. Grassi and C. Mioskowski, J. Am. Chem. Soc., 2002, 124, 4874–4880 CrossRef CAS PubMed.
- H. C. Chang and J. A. A. Ho, Anal. Chem., 2015, 87, 10362–10367 CrossRef CAS PubMed.
- D. Zhao, C. Chen, J. Sun and X. Yang, Analyst, 2016, 141, 3280–3288 RSC.
- Y. Li, M. Yang, H. Zhou, J. Chen and S. Shahzad, J. Mater. Chem. C, 2017, 5, 4691–4694 RSC.
- T. Xiao, J. Sun, J. Zhao, S. Wang, G. Liu and X. Yang, ACS Appl. Mater. Interfaces, 2018, 10, 6560–6569 CrossRef CAS PubMed.
- N. Ha, Z. Kim, W. Guo, J. Zhu and H. Yoon, Chem. Soc. Rev., 2011, 40, 79–93 RSC.
- J. Yao, M. Yang and Y. Duan, Chem. Rev., 2014, 114, 6130–6178 CrossRef CAS PubMed.
- D. Kim and T. S. Lee, ACS Appl. Mater. Interfaces, 2016, 8, 34770–34776 CrossRef CAS PubMed.
- C. Kim, S. Y. Kim, Y. T. Lim and T. S. Lee, Macromol. Res., 2017, 25, 572–577 CrossRef CAS.
- L. Feng, C. Zhu, H. Yuan, L. Liu, F. Lv and S. Wang, Cheminform, 2013, 42, 6620–6633 CAS.
- J. Kim and T. S. Lee, Macromol. Rapid Commun., 2016, 37, 303–310 CrossRef CAS PubMed.
- C. Wu and D. T. Chiu, Cheminform, 2013, 52, 3086–3109 CAS.
- S. Zhu, Y. Song, J. Shao, X. Zhao and B. Yang, Angew. Chem., Int. Ed., 2015, 47, 14626–14637 CrossRef PubMed.
- D. Wang, T. Imae and M. Miki, J. Colloid Interface Sci., 2007, 306, 222–227 CrossRef CAS PubMed.
- Z. Hao, N. Chen, W. Jiahui, G. Ruifang and C. Duxia, Talanta, 2019, 195, 713–719 CrossRef PubMed.
- S. Zhu, L. Wang, N. Zhou, X. Zhao, Y. Song, S. Maharjan, J. Zhang, L. Lu, H. Wang and B. Yang, Chem. Commun., 2014, 50, 13845–13848 RSC.
- D. Yang, Z. Lu, X. Rui, X. Huang, H. Li, J. Zhu, W. Zhang, Y. M. Lam, H. H. Hng and H. Zhang, Angew. Chem., Int. Ed., 2014, 53, 9352–9355 CrossRef CAS PubMed.
- J. Yuan, Y. Cen, X. J. Kong, S. Wu and X. Chu, ACS Appl. Mater. Interfaces, 2015, 7, 10548–10555 CrossRef CAS PubMed.
- C. Peng, H. Xing, X. Fan, Y. Xue, J. Li and E. Wang, Anal. Chem., 2019, 91, 5762–5767 CrossRef CAS PubMed.
- D. He, X. He, K. Wang, X. Yang, X. Yang, X. Li and Z. Zou, Chem. Commun., 2014, 50, 11049–11052 RSC.
- R. Deng, X. Xie, M. Vendrell, Y.-T. Chang and X. Liu, J. Am. Chem. Soc., 2011, 133, 20168–20171 CrossRef CAS PubMed.
- J. Wang, Q. Lu, C. Weng, X. Li, X. Yan, W. Yang, B. Li and X. Zhou, ACS Biomater. Sci. Eng., 2020, 6, 3132–3138 CrossRef CAS PubMed.
- S. Zhu, Q. Meng, L. Wang, J. Zhang, Y. Song, H. Jin, K. Zhang, H. Sun, H. Wang and B. Yang, Angew. Chem., Int. Ed., 2013, 125, 4045–4049 CrossRef.
- K. Kai, Y. Yoshida, H. Kageyama, G. Saito, T. Ishigaki, Y. Furukawa and J. Kawamata, J. Am. Chem. Soc., 2008, 130, 15938–15943 CrossRef CAS PubMed.
- F. Ye, C. Wu, W. Sun, J. Yu, X. Zhang, Y. Rong, Y. Zhang, I. C. Wu, Y. H. Chan and D. T. Chiu, Chem. Commun., 2014, 50, 5604–5607 RSC.
- L. Guo, S. Wu, F. Zeng and J. Zhao, Eur. Polym. J., 2006, 42, 1670–1675 CrossRef CAS.
- S. G. Liu, D. Luo, N. Li, W. Zhang, J. Lei, N. B. Li and H. Q. Luo, ACS Appl. Mater. Interfaces, 2016, 33, 21700–21709 CrossRef PubMed.
- X. Mei, G. Wen, J. Wang, H. Yao, Y. Zhao, Z. Lin and Q. Ling, J. Mater. Chem. C, 2015, 3, 7267–7271 RSC.
- S. Zhu, Q. Meng, L. Wang, J. Zhang, Y. Song, H. Jin, K. Zhang, H. Sun, H. Wang and B. Yang, Angew. Chem., Int. Ed., 2013, 125, 4045–4049 CrossRef.
- S. Y. Lim, W. Shen and Z. Gao, Chem. Soc. Rev., 2015, 44, 362–381 RSC.
- T. Larsson, M. Wedborg and D. Turner, Anal. Chim. Acta, 2007, 583, 357–363 CrossRef CAS PubMed.
- S. G. Liu, N. Li, Y. Ling, K. B. Hua, S. Geng, N. B. Li and H. Q. Luo, Langmuir, 2016, 32, 1881–1889 CrossRef CAS PubMed.
- J. H. Billman and A. C. Diesing, J. Org. Chem., 1957, 22, 1068–1070 CrossRef CAS.
- C. Zhijiang and H. hengwei, Study on the electrochemical properties of zinc/polyindole secondary battery, J. Power Sources, 2011, 196, 10731–10736 CrossRef.
- W. Zhai, C. Wang, P. Yu, Y. Wang and L. Mao, Anal. Chem., 2014, 86, 12206–12213 CrossRef CAS PubMed.
- L. Lin, Y. Liu, X. Zhao and J. Li, Anal. Chem., 2011, 83, 8396–8402 CrossRef CAS PubMed.
- C. Wang, W. Zhai, Y. Wang, P. Yu and L. Mao, Analyst, 2015, 140, 4021–4030 RSC.
- J. Liu, Y. Chen, W. Wang, J. Feng, M. Liang, S. Ma and X. Chen, J. Agric. Food Chem., 2016, 64, 371–380 CrossRef CAS PubMed.
- K. Quan, J. Huang, X. Yang, Y. Yang, L. Ying, H. Wang, N. Xie, M. Ou and K. Wang, Anal. Chem., 2016, 88, 5857–5864 CrossRef CAS PubMed.
- W. R. Algar and U. J. Krull, Langmuir, 2009, 25, 633–638 CrossRef CAS PubMed.
- A. M. Bondžić, T. D. Lazarević-Pašti, A. R. Leskovac, S. Ž. Petrović, M. B. Čolović, T. N. Parac-Vogt and G. V. Janjić, Eur. J. Pharm. Sci., 2020, 151, 105376–105384 CrossRef PubMed.
- Y. Zhang, T. Hei, Y. Cai, Q. Gao and Q. Zhang, Anal. Chem., 2012, 84, 2830–2836 CrossRef CAS PubMed.
- S. Hamulakova, L. Janovec, M. Hrabinova, K. Spilovska, J. Korabecny, P. Kristian, K. Kuca and J. Imrich, J. Med. Chem., 2014, 57, 7073–7084 CrossRef CAS PubMed.
- M. C. Rong, X. H. Song, T. Ting and X. Zhao, J. Mater. Chem. C, 2015, 3, 10916–10924 RSC.
- C. Lei, Z. Wang, Z. Nie, H. Deng, H. Hu, Y. Huang and S. Yao, Anal. Chem., 2015, 87, 1974–1980 CrossRef CAS PubMed.
- H. Li, Y. Guo, L. Xiao and B. Chen, Analyst, 2014, 139, 285–289 RSC.
- W. Li, W. Li, Y. Hu, Y. Xia, Q. Shen, Z. Nie, Y. Huang and S. Yao, Biosens. Bioelectron., 2013, 47, 345–349 CrossRef CAS PubMed.
- J. Yang, N. Song, X. Lv and Q. Jia, Sens. Actuators, B, 2018, 15, 226–232 Search PubMed.
- P. Ni, Y. Sun, H. Dai, S. Jiang, W. Lu, Y. Wang, Z. Li and Z. Li, Sens. Actuators, B, 2015, 226, 104–109 CrossRef.
- P. Ni, Y. Sun, H. Dai, S. Jiang, W. Lu, Y. Wang, Z. Li and Z. Li, Microchim. Acta, 2016, 183, 2589–2595 CrossRef CAS.
Footnote |
| † Electronic supplementary information (ESI) available: Fig. S1: UV-Vis spectra and EDS image of NCPDs, and UV-Vis and NMR spectra of pyrogallol; Fig. S2: EDS image and FT-IR spectra of MnO2 nanosheets; Fig. S3–S6: diluted plot of NCPDs; NCPDs reserved time; stability of NCPDs at various pH values; UV-Vis spectra of NCPDs with added MnO2 nanosheets, PEI and pyrogallol; Fig. S7: reaction time of the NCPDs–MnO2 biosystem; Fig. S8: overlap spectra of NCPDs and MnO2 nanosheets; Fig. S9: decay curves of NCPDs; Fig. S10: excitation spectra of NCPDs and emission spectra of the MnO2 nanosheets; Fig. S11: optimization of the substrate concentration; Fig. S12: cuvette geometry and parameters used in the IFE equation; Table S1: calculation of the IFE mechanism. See DOI: 10.1039/d1ra07854b |
| This journal is © The Royal Society of Chemistry 2022 |