 Open Access Article
Analysis of grain size and five-fold twins during rapid solidification processes inTi3Al alloy
Lianxin Li ,
Tinghong Gao
 *,
Quan Xie
 and
Zean Tian
Guizhou Provincial Key Laboratory of Public Big Data, Institute of New Type Optoelectronic Materials and Technology, College of Big Data and Information Engineering, Guizhou University, Guiyang, 550025, China. E-mail: gaotinghong@sina.com
First published on 24th February 2022
Abstract
The wide application of titanium aluminum (Ti–Al) intermetallic compounds for aerospace and automotive fields has accelerated the research and development of Ti3Al alloy. In this study, simulation is adopted to investigate the crystallization behavior during rapid solidification of Ti3Al alloys using molecular dynamics at different cooling rates of 1010 K s−1, 1011 K s−1, 1012 K s−1, and 1013 K s−1. The evolution of microstructures is characterized by taking advantage of the average potential energy, the pair distribution function and visualization. The results show that the system has formed a microstructural configuration with the face-centered cubic structure as the main structure and the hexagonal close-packed structure as the supplement. An increase in the cooling rate will reduce the grain size of the alloy, which in turn will increase the number of grains. At the cooling rate at which the alloy can crystallize, the system forms five-fold twin structures. Meanwhile, we obtain a deeper insight into the properties of five-fold twins in terms of atoms on different sites, and establish a standard model of the same specification for comparison to get the commonality and differences of the five-fold twins between the standard and the solidified. In addition, the evolution of dislocation densities and distribution of dislocation lines in the system under different conditions are analyzed. This study further explores crystallization behavior on the atomic scale and it is hoped that this research will contribute to expanding the understanding of Ti3Al alloy during the growth process.
1. Introduction
Ti–Al intermetallic compounds, as a new generation of high-temperature structural materials with great development prospects, are essential for a wide range of aerospace and automotive fields.1–3 Among them, Ti3Al alloy plays a key role in Ti–Al intermetallic compounds for its excellent heat resistance, low specific weight and good oxidation resistance. Recent developments in the field of Ti–Al intermetallic compounds have put forward higher requests for its quality in applications. Since the microstructure of a material plays a decisive role in its macroscopic properties, it is significant for us to have an in-depth understanding of Ti–Al alloy, especially its microstructure changes and defect formation during the growth process.The main investigations in Ti–Al intermetallic compounds are the ordered phases of γ-TiAl phase (L10) and α2-Ti3Al phase (D019).4,5 Earlier Shimono and Onodera6 investigated liquid-to-amorphous transition and amorphous-to-crystal transition processes of Ti–Al alloys. Then Pei7,8 obtained an atomistic description of glass formation and crystallization behavior during isothermal annealing in liquid Ti3Al alloy, and the simulation results suggested that there were transformations from a metastable crystal phase to a more stable crystal phase during the crystallization. Xie et al.9 investigated the characteristics of the interpenetrating connections of icosahedra networks in TiAl3 and TiAl alloys obtained from rapid solidification based on MD simulations. Soon afterwards, they studied lamellar grains formation of liquid Ti3Al alloy during rapid solidification and deformation behavior of the lamellar grains under tensile loading.10 Li et al. described the effects of cooling rates on the amorphous structure formation and crystallization of liquid TiAl11 and the formation of nanocrystals from undercooling TiAl melt and deformation behavior of nanocrystalline TiAl alloy under tensile loading conditions.12 Recently, Gao et al.13 researched the evolution of dislocation and twin structures in Ti3Al during solidification. In addition, some studies on Ti3Al structural changes were carried out under high pressure conditions.14,15 Though the above studies have enriched the research of Ti–Al alloy, the grain size distribution, special defect structure and the microstructural evolution need to be further supplemented. The lack of detailed knowledge about growth is due to the fact that growth occurs at the nanoscale so that the solution provides valuable details on the atomic scale for crystal growth by using the computer simulation method.
Analysis was conducted by the molecular dynamics (MD) based on the embedded-atom-method (EAM) interatomic potential to simulate the solidification process of Ti3Al alloy. EAM was prepared by Zope16 which obtained numerous research results on Ti–Al intermetallic compounds.17–22 Afterwards, the average potential energy curve, pair distribution function (RDF or g(r)) curve,23 visualization technology24 and tracing method were used to investigate the microstructural configuration and the evolution of microstructure during solidification. The characteristics on the atomic scale are important for our increased understanding of growth behavior during the entire process of solidification of Ti3Al alloy.
2. Simulation conditions and methods
MD simulations of rapid solidification for liquid Ti3Al alloys were conducted using the large scale atomic molecular massively parallel simulator (LAMMPS)25 package at different cooling rates of 1010 K s−1, 1011 K s−1, 1012 K s−1 and 1013 K s−1. The simulations were conducted in a cubic periodic boundary box containing 32, 000 atoms (24, 000 Ti and 8, 000 Al atoms) at NPT (with constant atom number, system pressure, and temperature) ensemble, zero pressure conditions, and a time step of 1 fs, using the EAM potential adopt for Ti–Al based materials. The initial temperature was set 2000 K which is higher than the melting temperature in the experiment (Tm ∼1933 K);26 and the process of isothermal relaxation lasted for 500![[thin space (1/6-em)]](https://www.rsc.org/images/entities/char_2009.gif) 000 steps leading the liquid Ti3Al system to an equilibrium state. Then the solidification process was performed, and the velocity and coordinate of all the atoms were recorded at an interval of 10 K to acquire microcosmic information.
000 steps leading the liquid Ti3Al system to an equilibrium state. Then the solidification process was performed, and the velocity and coordinate of all the atoms were recorded at an interval of 10 K to acquire microcosmic information.
3. Results and discussions
3.1. Average potential energy
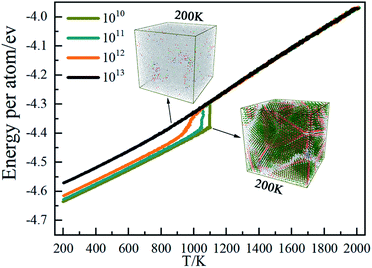
The marked change of the average atomic potential energy curve can be used to initially discover the phase transition of the system during the solidification process. As shown in Fig. 1, at 1010 K s−1, there is an obvious jump in the average energy curve around 1100 K, indicating that this temperature is the crystallization temperature at this cooling rate. The system begins to form a large number of crystalline structures causing the average energy of the atoms in the system to drop. As the temperature is lower than 1100 K, affected by the kinetic energy of the atoms, the average atomic energy curve decreases linearly, and the system is basically crystalline. Except that the crystallization temperature is close to 1050 K, the curve change properties at 1011 K S−1 are basically the same as those at 1010 K s−1. Rising cooling rate to 1012 K s−1, the crystallization point is about 1000 K and the jump degree of the curve is slower than that of the previous two cooling rates resulting from that the fast temperature change due to the high cooling rate limits the atom movement. At 1013 K s−1, the average energy curve of the atoms is generally linear, indicating that the system is amorphous and the average atomic energy is only related to the kinetic energy of the atoms.3.2. Radial distribution function (RDF)
RDF, also called g(r), is widely used to reveal the structural characteristics of crystalline and amorphous structures. In order to study the effect of cooling rate on the solidification of Ti3Al, g(r)s at different cooling rates at 200 K is shown in Fig. 2. It can be seen from the figure that the gTi–Al(r) curves have many peaks at 1010 K s−1, 1011 K s−1 and 1012 K s−1, which are typical characteristics of the crystal structure. The gTi–Al(r) curve shows typical amorphous characteristics at 1013 K s−1 because the system lacks of long-range order. But its second peak split into two small peaks, indicating that the system has formed a short-range order. Therefore, as the cooling rate increases, the final state gradually changes from the crystalline state to the amorphous state. Among gTi–Al(r), gTi–Ti(r) and gAl–Al(r), gTi–Al(r) has the highest peak, indicating that the distribution of distance between Ti and Al atoms is the most concentrated.3.3. Grain size analysis
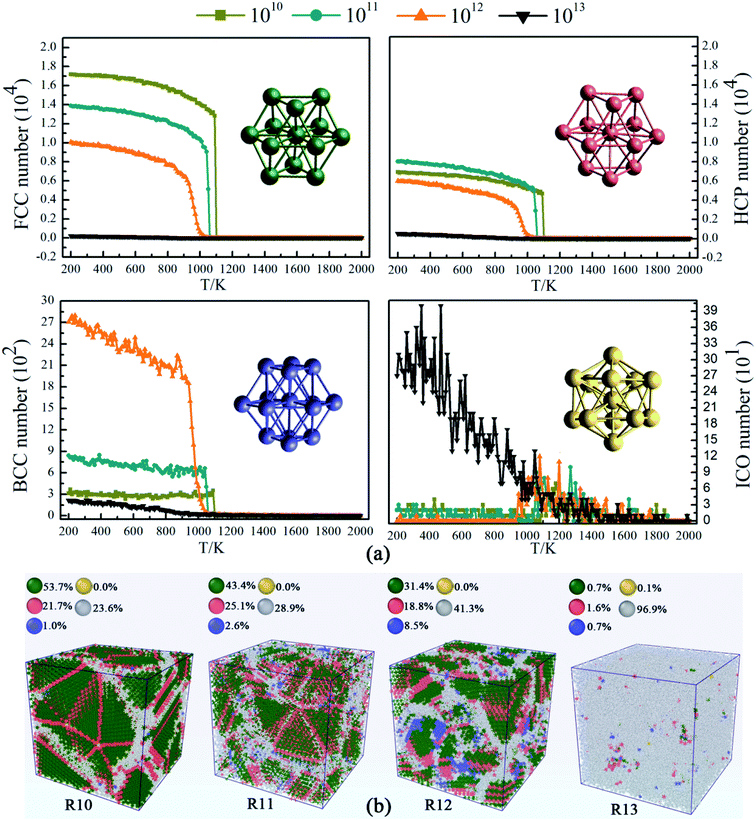
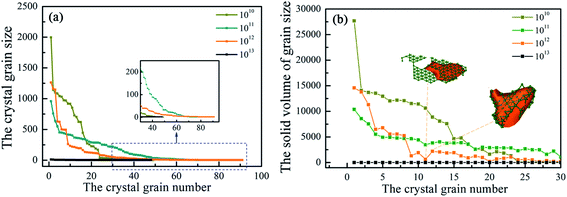
For further investigation on the detailed formation of microstructure in Ti3Al alloy, we base our analysis on structural types as shown in Fig. 3. Common Neighbor Analysis (CNA) can obtain atomic structure information through atomic coordinate information and assign a structure type to each particle, which is a common method for structural analysis. The atoms in the face-centered cubic (FCC), the hexagonal close-packed (HCP), the body-centered cubic (BCC), the icosahedral (ICO) structures are regarded as FCC, HCP, BCC, ICO atoms in this system, and their evolution is shown in Fig. 3(a), respectively. At temperatures above 1100 K, the atoms are randomly distributed in all four systems. The system at 1010 K S−1 begins to crystallize at 1100 K, and the atoms of FCC and HCP structures increase rapidly, while the systems at 1011 K s−1 and 1012 K s−1 crystallize at 1050 K and 1000 K, respectively. With the decrease of temperature, the system becomes more ordered, and the atoms of FCC and HCP structures continue to increase. BCC metastable structure atoms and typical amorphous icosahedral structures exist in the system, but in small amounts. Fig. 3(b) shows four snapshots after simulated quenching to 200 K. At a cooling rate of 1010 K s−1, a mixed system composed of up to 53.7% FCC atoms and 21.7% HCP atoms, accounting for 75% of the total. The rest of the atoms are randomly distributed into the available space, forming disordered boundaries. At the cooling rate of 1011 K s−1, the proportion of the crystal structure in Ti3Al is 68% which is lower than the cooling rate of 1010 K s−1. When the cooling rate rises to 1012 K s−1, the degree of crystallization decreases significantly, which is manifested as the number of other atoms increases to nearly half of the total in the system. At a cooling rate of 1013 K s−1, only a small part of the atoms forms crystalline structures in the system. Meanwhile, it is observed that although the number of other atoms of the two systems is almost the same at the cooling rate of 1010 K s−1 and 1011 K s−1, the latter is more widely distributed. At this time, the number of crystal grains and their size need to be measured, which have an impact on the application and performance of the material.Fig. 4(a) shows the grain information in the system after growth under different conditions. The abscissa is the number of crystal grains sorted by size from large to small, and the ordinate is the number of atoms of the grain under that number. At the same time, the volume size of grain was calculated in Fig. 4(b). At the end of solidification, Ti3Al alloy does not contain coarse grains at 1013 K s−1, but contains obvious large grains at low cooling rates. Comparing the grain size, it is found that the average grain size at 1010 K s−1 cooling rate is the largest, followed by 1011 K s−1. Among these coarse grains, the largest grain appears at 1010 K s−1 and consists of 1996 atoms. The grain size is approximately 2.91 nm × 4.33 nm × 3.74 nm. The maximum grain size at 1012 K s−1 is greater than that at 1011 K s−1, and the average grain size of the former is greater than the latter, so the cooling rate has an overall effect on the grain size. The increase in cooling rate makes the system more inclined to form small-sized crystal grains. The change in the size of the crystal grains is the same as the change in the number of atoms. The jump in volume from high to low and then to high indicates that the crystal grain has a flaky part.
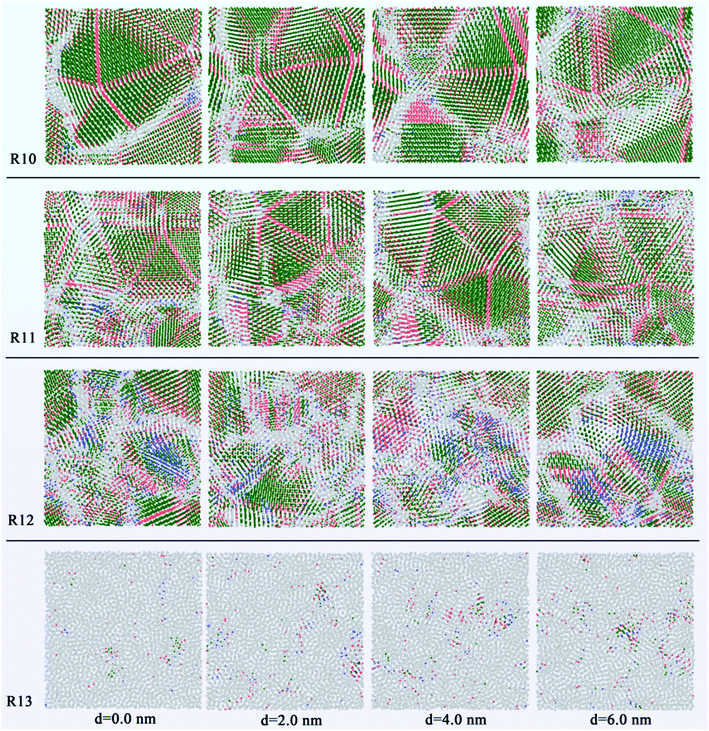
In addition, in order to study the grain morphology and distribution of the liquid Ti3Al alloy at the atomic scale, we obtain the system through rapid solidification at different cooling rates for slice analysis, and show cross-sectional views of different positions, as shown in Fig. 5. Set the distance from the left to the right of the box to d. Slices were performed at 2.0 nm intervals with a thickness of 2.0 nm. When the cooling rate is 1010 K s−1, the five-fold twins composed of the coherent twin boundaries and the FCC atoms can be clearly seen, and the thickness of the five-fold twin is the largest on the left side of d = 0.0 nm, which is about 6 nm. In its upper right corner, there is a structure similar to a five-fold twin, but in fact it is not because its grain boundaries are misaligned. Another five-fold twin is found on the right side at d = 4.0 nm, the thickness of which is about 2.6 nm. Similarly, at 1011 K s−1, five-fold twins are also observed in the system, and the maximum thickness is 2.4 nm. When the cooling rate rises to the 1012 K s−1, the disorder of the solidified system increases significantly, other atoms are widely distributed, and the metastable BCC structure is observed at different slice positions, which are located near large grains. When the cooling rate is 1013 K s−1, the system is directly amorphous.
3.4 Five-fold twin analysis
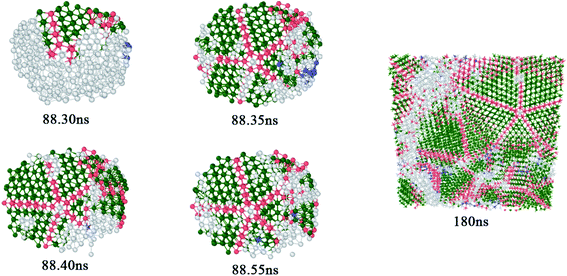
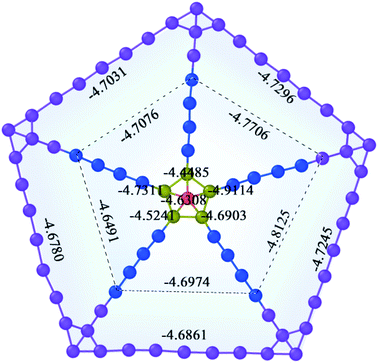
Five-fold twins are usually observed in nanowires,27,28 thin films29,30 and ball milling.31,32 Related studies show that the formation of the five-fold twin is related to the orientation change of applied stresses.33,34 In our study, five-fold twins are obtained from the solidification process in MD simulations as shown in Fig. 6. At 88.30 ns, a layer of twin occurred in the FCC structure and a five-fold ring containing the central atom is formed at the end of the twin. Then four co-lattice twin boundaries are formed along the atoms on the five-fold ring at 88.35 ns and atoms between any two twin boundaries in fivefold twins are stacked in a manner of FCC structure. A large five-fold twin crystal has initially formed when the time reaches 88.40 ns and next, the five-fold twin continues to expand after 88.55 ns. As time increases, the system spontaneously develops in the direction of low energy and the atoms are arranged nearby according to the rules. The potential energy is an important parameter to assess the stability of a structure, which is determined by the state and position of atoms. In the same structure, the lower the potential energy, the more stable the structure. Fig. 7 reveals the average potential energy of the five-fold twin atoms at different sites. The center, the smallest five-fold ring and the twin boundaries are kinds of sites, which are regarded as center (red color), point (yellow color), edge (blue and purple colors); the rest are a kind of site, called block (blue and purple colors). Because too many atoms in the block area are not conducive to placing the energy value, the atoms in the block are not displayed, and the light blue background color is used to indicate the distribution of atoms. Among them, blue and purple are used to distinguish the region of atoms. Blue and purple are the regions containing four atoms and the fifth through seventh atoms, respectively, both applying for the edge and the block. It can be seen from Fig. 7 that the average potential energy of the center is −4.6308 eV, which is greater than that of any one block site atom. The average potential energy of all the bulk atoms is −4.7043 eV. The average potential energy value of the point fluctuates up and down. Averaging the average potential energy of these five points, the value is −4.6611 eV, which is smaller than the center and larger than the block average. Here is a simple statistics of average potential energy distribution of the five-fold twin atoms at different sites. However, in view of the influence that the large difference of the atomic energy between Ti atoms and Al atoms may have on energy statistics of different sites of atoms, it is necessary to create a new five-fold twin model of pure Ti atoms to eliminate this influence.Fig. 8 shows a standard five-fold twin nanocluster composed of Ti atoms. The system of a large vacuum box containing the standard five-fold twin nanocluster was relaxed for 500 ps at 200 K. Then the average potential energy of atoms at different sites of the five-fold twin nanocluster is calculated. It is found that the commonality of average atomic potential energy of five-fold twin nanoclusters between the standard and the solidified is that the average atomic potential of the central atom is the highest, because the atomic potential energy is determined by its state and position, and the inhomogeneous deformation of lattices may influence the character of the local positions of the lattice defects.35 The stress on the atom at the center of the five-fold twin is higher. When there is a shift of the pentagonal axis towards the periphery the elastic energy relaxation in five-fold twin may occur36 and the lattice distortion and the stress on the atom decrease gradually. Next, the average atomic potential energy of the atoms at the twin boundary is higher than the average potential energy of the atoms in the bulk region within the twin boundary. The presence of a disclination of the twin boundary in five-fold twin leads to inhomogeneous stresses, especially on the twinning boundary. The difference is that the average atomic energy of the smallest five-fold ring in the standard nanocluster and the five-fold twin obtained from solidification varies. The average potential energy of atoms at different sites in the standard model five-fold twin is center > edge > block > point, but it is center > point > edge > block in the five-fold twin after solidification. In the model, the average atomic potential difference of the edges and blocks in different ranges does not change much with the expansion of the atomic area, which are 0.0026 eV and 0.0003 eV, respectively. The average atomic potential energy difference between the center and the point is 0.0447 eV. Conversely, in the five-fold twin obtained during solidification, the average potential energy difference between the edges and the blocks of is severally 0.0162 eV and 0.0232 eV, and the average atomic energy difference between the center and the point is 0.0303 eV. Through comparison, it is shown that the average potential energy of the atoms on the edges and the points obtained by solidification increases, which is due to the fact that the grains that make up the five-fold twin are affected by the surrounding defects and the deflection of the twinning boundary, resulting in its lattice distortion inhomogeneity is stronger than that of the standard five-fold twin.
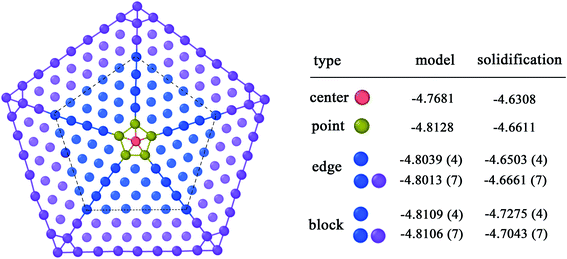 | ||
| Fig. 8 Comparison of the average potential energy of atoms at the same site on the standard five-fold twin nanocluster and the five-fold twin obtained from solidification. | ||
3.5. Defect analysis
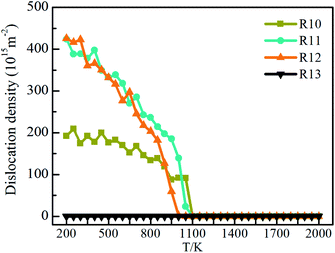
The dislocation densities of Ti3Al alloy are shown in Fig. 9 during quenching at different cooling rates. It can be seen that at the cooling rate of 1010 K s−1, the number of dislocation density has been increasing steadily, and finally stabilized at 200 K. The number is about 200, which is obviously much smaller than the dislocation densities under 1011 K s−1 and 1012 K s−1. At 1011 K s−1 and 1012 K s−1, the dislocation densities increase significantly, and its number are close to 0 at 1100 K, but after the solidification process is over, the number are close to 450. The difference is that at the cooling rate of 1011 K s−1, the dislocation density first starts to increase, and during the entire cooling process, the number of dislocation density at the cooling rate of 1011 K s−1 is mostly higher than that of 1012 K s−1. The dislocation density in the system with a higher cooling rate of 1013 K s−1 has been very small throughout the cooling process, almost zero, which is consistent with the fact that there are almost no crystal grains in the system mentioned above. Fig. 10 shows the visual distribution of the dislocation lines of the Ti3Al alloy at 200 K after the quenching process. Comparing the four cooling speeds, it can be found that the dislocation line at 1010 K s−1 is the least, and the dislocation line under 1012 K s−1 is the most, which is consistent with the number of dislocation line density in Fig. 9. In addition, at 1011 K s−1 and 1012 K s−1 dislocation line segments are shorter, which is just the opposite at 1010 K s−1, that is related to the grain size of the system. In addition, the dislocation distribution is clustered at 1010 K s−1 while they are distributed in the entire box at 1011 K s−1 and 1012 K s−1. The disordered structure formed by the misalignment of atoms leads to an increase in the energy of the system, while dislocations are related to the misalignment of atoms. Fig. 11 shows the dislocation density, crystallization rate and average atomic energy of the system at different cooling rates at 200 K, respectively. Except that at 1013 K s−1 the entire system is amorphous and the dislocation density is 0, at 1010 K s−1 the dislocation density is the lowest, and the crystallization rate is the highest, so the average atomic energy of the system is the lowest. At the cooling rates of 1011 K s−1 and 1012 K s−1, there is little difference in dislocation density between the two systems, but the crystallization rate of the system at 1011 K s−1 is higher than that of 1012 K s−1, so the average atomic energy of the former is lower than that of the latter. Due to the difference in the size of the atomic region and the number of atoms forming a dislocation, when the dislocation density is the same, the higher the crystallization rate, the lower the energy of the system.4. Conclusions
In this study, we obtain the crystallization behavior of Ti3Al alloy during rapid solidification at different cooling rates. The results show that the microstructural configuration composes of the atoms of FCC structure and HCP structure. The cooling rate has a greater impact on the grain size that an increase in the cooling rate will reduce the grain size of the alloy, which in turn will increase the number of grains. Five-fold twins are formed in the crystallization system, and the size of five-fold twins is the largest in the system with the lowest cooling rate. In order to analyze the commonality and difference of atoms at different sites of the five-fold twin, a standard five-fold twin model with the same size as the solidified five-fold twin was established and compared. It is found that their commonality is that the average atomic potential energy of the central atom is the highest. Next, the average atomic potential energy of the atoms at the twin boundary is higher than the average potential energy of the atoms in the bulk region within the twin boundary. The difference is that the average atomic energy of the smallest five-fold ring in the model and the solidified five-fold twin varies. The average atomic potential energy of atoms at different sites in the standard model five-fold twin is center > edge > block > point, but it is center > point > edge > block in the five-fold twin obtained from solidification. It is due to that the inhomogeneous deformation of lattices may influence the character of the local positions of the lattice defects, and the grains that make up the solidified five-fold twin are affected by the surrounding defects and the deflection of the twinning boundary, resulting in its lattice distortion inhomogeneity is stronger than that of the standard five-fold twin. In addition, the analysis of dislocation defects shows that as the number of crystal grains increases, the dislocation density increases. Meanwhile, the length of the dislocation line becomes shorter and the dislocation distribution increases.Conflicts of interest
There are no conflicts to declare.Acknowledgements
This work was supported by the Industry and Education Combination Innovation Platform of Intelligent Manufacturing and Graduate Joint Training Base at Guizhou University (Grant no: 2020-520000-83-01-324061), the National Natural Science Foundation of China (Grant no. 51761004, 60766002, 51661005 and 61264004), the Guizhou Province Science and Technology Fund (Grant no. ZK[2021] 051, [2017] 5788, and J[2015] 2050), and the Cooperation Project of Science and Technology of Guizhou Province (Grant no. LH [2016] 7430).References
- G. Chen, Polysynthetic twinned TiAl single crystals for high-temperature applications, Nat. Mater., 2016, 15, 876–881 CrossRef CAS PubMed.
- S. W. Kim, Development of TiAl alloys with excellent mechanical properties and oxidation resistance, Mater. Des., 2014, 54, 814–819 CrossRef CAS.
- J. Aguilar, A. Schievenbusch and O. Kättlitz, Investment casting technology for production of TiAl low pressure turbine blades-Process engineering and parameter analysis, Intermetallics, 2011, 19(6), 757–761 CrossRef CAS.
- B. J. Inkson, H. Clemens and J. Marien, γ-α2-B2 lamellar domains in rolled TiAl, Scr. Mater., 1998, 38, 1377–1380 CrossRef CAS.
- H. Clemens and H. Kestler, Processing and applications of intermetallic γ-TiAl based alloys, Adv. Eng. Mater., 2000, 2, 551–570 CrossRef CAS.
- M. Shimono and H. Onodera, Molecular dynamics study on liquid-to-amorphous transition in Ti-Al alloys, Mater. Trans., JIM, 1998, 39(1), 147–153 CrossRef CAS.
- Q. Pei, C. Lu and M. Fu, The rapid solidification of Ti3Al: a molecular dynamics study, J. Phys.: Condens. Matter, 2004, 16, 4203 CrossRef CAS.
- Q. X. Pei, C. Lu and H. P. Lee, Crystallization of amorphous alloy during isothermal annealing: a molecular dynamics study, J. Phys.: Condens. Matter, 2005, 17(10), 1493 CrossRef CAS.
- Z. C. Xie and T. H. Gao, Network connectivity in icosahedral medium-range order of metallic glass: A molecular dynamics simulation, J. Non-Cryst. Solids, 2014, 406, 31–36 CrossRef CAS.
- Z. C. Xie, T. H. Gao and X. T. Guo, Molecular dynamics simulation of nanocrystal formation and deformation behavior of Ti3Al alloy, Comput. Mater. Sci., 2015, 98, 245–251 CrossRef CAS.
- P. T. Li, Y. Q. Yang, W. Zhang, X. Luo, N. Jin and G. Liu, Structural evolution of TiAl during rapid solidification processing revealed by molecular dynamics simulations, RSC Adv., 2016, 6(60), 54763–54767 RSC.
- P. T. Li, Y. Q. Yang, Z. H. Xia, X. Luo, N. Jin, Y. Gao and G. Liu, Molecular dynamic simulation of nanocrystal formation and tensile deformation of TiAl alloy, RSC Adv., 2017, 7, 48315–48323 RSC.
- Y. Gao, T. Gao and L. Li, Evolution of dislocation and twin structures in Ti3Al during solidification, Vacuum, 2021, 194, 110525 CrossRef CAS.
- M. Rajagopalan, P. C. Sahu and N. Shekar, Structural phase stability of Ti3Al under high pressure, Int. J. Mod. Phys. B, 1999, 13(07), 841–845 CrossRef CAS.
- C. Zhang, H. Hua and Y. Zhao, First-principles study on structural, elastic and thermal properties of γ-TiAl and α2-Ti3Al phases in TiAl-based alloy under high pressure, Int. J. Mod. Phys. B, 2017, 31(11), 1750079 CrossRef CAS.
- R. R. Zope and Y. Mishin, Interatomic potentials for atomistic simulations of the Ti-Al system, Phys. Rev. B: Condens. Matter Mater. Phys., 2003, 68(2), 366–369 CrossRef.
- M. Kanani, A. Hartmaier and R. Janisch, Stacking fault based analysis of shear mechanisms at interfaces in lamellar TiAl alloys, Acta Mater., 2016, 106, 208–218 CrossRef CAS.
- K. Nie, W. P. Wu and X. L. Zhang, Molecular dynamics study on the grain size, temperature, and stress dependence of creep behavior in nanocrystalline nickel, J. Mater. Sci., 2017, 52(4), 2180–2191 CrossRef CAS.
- C. Cheng, Y. Ma and Q. Bao, Development and application of EAM potentials for Ti, Al and Nb with enhanced planar fault energy of Ti, Comput. Mater. Sci., 2019, 173, 109432 CrossRef.
- L. Zhang, Studying Stability of Atom Packing for Ti Nanoparticles on Heating by Molecular Dynamics Simulations, Adv. Eng. Mater., 2019, 21(4), 1800531 CrossRef.
- E. Pla, A. Yqy and B. Vk, Temperature-dependent deformation processes in two-phase TiAl+Ti3Al nano-polycrystalline alloys-ScienceDirect, Mater. Des., 2021, 199, 109422 CrossRef.
- H. Wang, D. S. Xu and R. Yang, The transformation of narrow dislocation dipoles in selected fcc metals and in γ-TiAl, Acta Mater., 2009, 57(13), 3725–3737 CrossRef CAS.
- B. G. Levine, J. E. Stone and A. Kohlmeyer, Fast analysis of molecular dynamics trajectories with graphics processing units—radial distribution function histogramming, J. Comput. Phys., 2011, 230(9), 3556–3569 CrossRef CAS PubMed.
- A. Stukowski, Visualization and analysis of atomistic simulation data with OVITO-the Open Visualization Tool, Mater. Sci. Eng., 2010, 18(1), 2154–2162 Search PubMed.
- W. M. Brown, A. Kohlmeyer, S. J. Plimpton and A. N. Tharrington, Implementing molecular dynamics on hybrid high performance computers-particle-particle particle mesh, Comput. Phys. Commun., 2012, 183, 449–459 CrossRef CAS.
- G. L. Chen, W. J. Zhang and Z. C. Liu. Microstructure and properties of high-Nb containing TiAl-base alloys. Symposium on gamma titanium aluminides, TMS annual meeting, 1999 Search PubMed.
- A. Cao and Y. Wei, Atomistic simulations of the mechanical behavior of fivefold twinned nanowires, Phys. Rev. B: Condens. Matter Mater. Phys., 2006, 74(21), 214108 CrossRef.
- F. Niekiel, E. Spiecker and E. Bitzek, Influence of anisotropic elasticity on the mechanical properties of fivefold twinned nanowires, J. Mech. Phys. Solids, 2015, 84, 358–379 CrossRef CAS.
- H. Hofmeister, Forty years study of fivefold twinned structures in small particles and thin films, Cryst. Res. Technol., 1998, 33(1), 3–25 CrossRef CAS.
- P. Parajuli, R. Mendoza-Cruz and J. J. Velazquez-Salazar, Fivefold annealing twin in nanocrystalline Au/Pd film, Mater. Lett., 2019, 244, 88–91 CrossRef CAS.
- J. Huang, Y. Wu and H. Ye, Deformation structures in ball milled copper, Acta Mater., 1996, 44, 1211–1221 CrossRef CAS.
- X. Z. Liao, J. Y. Huang and Y. T. Zhu, Nanostructures and deformation mechanisms in a cryogenically ball-milled Al-Mg alloy, Philos. Mag., 2003, 83(26), 3065–3075 CrossRef CAS.
- Y. T. Zhu, X. Z. Liao and R. Z. Valiev, Formation mechanism of fivefold deformation twins in nanocrystalline face-centered-cubic metals, Appl. Phys. Lett., 2005, 86, 103112 CrossRef.
- Z. Zhang, S. Huang and L. Chen, Formation mechanism of fivefold deformation twins in a face-centered cubic alloy, Rep, 2017, 7, 45405 CAS.
- V. G. Gryaznov, J. Heydenreich and A. M. Kaprelov, Pentagonal symmetry and disclinations in small particles, Cryst. Res. Technol., 1999, 34(9), 1091–1119 CrossRef CAS.
- L. D. Marks, Imaging small particles, Ultramicroscopy, 1985, 18(1–4), 445–452 CrossRef.
| This journal is © The Royal Society of Chemistry 2022 |

