DOI:
10.1039/D2RA00457G
(Paper)
RSC Adv., 2022,
12, 6433-6439
Untapped potential of 2D charge density wave chalcogenides as negative supercapacitor electrode materials
Received
22nd January 2022
, Accepted 18th February 2022
First published on 23rd February 2022
Abstract
Two-dimensional (2D) materials have opened new avenues for the fabrication of ultrathin, transparent, and flexible functional devices. However, the conventional inorganic graphene analogues are either semiconductors or insulators with low electronic conductivity, hindering their use as supercapacitor electrode materials, which require high conductivity and large surface area. Recently, 2D charge density wave (CDW) materials, such as 2D chalcogenides, have attracted extensive attention as high performance functional nanomaterials in sensors, energy conversion, and spintronic devices. Herein, TaS2 is investigated as a potential CDW material for supercapacitors. The quantum capacitance (CQ) of the different TaS2 polymorphs (1T, 2H, and 3R) was estimated using density functional theory calculations for different numbers of TaS2 layers and alkali-metal ion (Li, Na and K) intercalants. The results demonstrate the potential of 2H- and 3R-polymorphs as efficient negative electrode materials for supercapacitor devices. The intercalation of K and Na ions in 1T-TaS2 led to an increase in the CQ with the intercalation of Li ions resulting in a decrease in the CQ. In contrast, Li ions were found to be the best intercalant for the 2H-TaS2 phase (highest CQ), while K ion intercalation was the best for the 3R-TaS2 phase. Moreover, increasing the number of layers of the1T-TaS2 resulted in the highest CQ. In contrast, CQ increases upon decreasing the number of layers of 2H-TaS2. Both 1T-MoS2 and 2H-TaS2 can be combined to construct a highly performing supercapacitor device as the positive and negative electrodes, respectively.
The world energy demand is continuously increasing with time due to the growth of the population that has resulted in more than twice the energy consumption in the last fifty years. Currently, fossil fuels are the major source of energy. However, fossil fuels are associated with severe environmental impacts, such as CO2 emissions, which is the major cause of climate change and global warming.1 The energy cycle, on the big picture, can be simplified to major three phases, energy generation, storage, and consumption. Those phases can be manipulated via high-end inventions to control the consumption efficiency, energy delivery, and side effects.2 The second phase can be realized via two common ways: energy storage in the form of fuels and electrical (electronic) energy storage systems (ESSs) through batteries and supercapacitors, which are current research subjects.3,4 To this end, Li-ion batteries (LiIBs) represent the state of art technology for the ongoing rechargeable energy storage devices.5,6 On the other hand, supercapacitors store energy by different mechanisms depending on the active material, namely electrical double layer (EDL) capacitors and pseudocapacitors.7–9 The performance of ESSs is usually determined by three factors; energy density, power density, and cyclic stability. Currently, LiIBs offer high energy density, moderate cyclic stability, and moderate-to-low power density. Nevertheless, supercapacitors offer high power density, high cyclic stability, and relatively low energy density.8 Therefore, it is important to improve the energy density of supercapacitors, which can be realized by tuning the active electrode material, electrolyte, and separator.10,11
Recently, 2D charge density wave (CDW) materials are proved to be very efficient functional materials in many applications such as sensors, spintronics, and energy conversion.12 As typical CDW materials, 2D transition metal dichalcogenides (TMDs) exhibit fast charge carrier transport and high charge storage ability. TMDs are layered materials that are stacked together via van der Waals (vdW) forces, with the chemical formula XM2, where X is a transition element (such as Mo, Ta, W) and M is a chalcogenide element (such as S, Se, Te). TMDs are commonly exist in three phases/polymorphs; 1T (trigonal), 2H (hexagonal), and 3R (rhombohedral).13–16 However, little attention was devoted to the investigation of the potential of CDW materials as supercapacitor electrodes. For example, Feng et al. reported the use of ultrathin VS2 nanosheets in in-plane supercapacitors with high capacitance and outstanding cyclic stability.14 As a typical polymorphic TMD, TaS2 has been extensively studied for its charge density wave (CDW) and superconductivity characteristics,17–24 making it a prompting functional material in energy storage devices. TaS2 has also been used to fabricate efficient gas sensors based on its high conductivity.25 Therefore, herein, we investigate the potential of TaS2 polymorphs as supercapacitor electrode materials using density functional theory (DFT) calculations, which is rarely reported in the literature. To this end, quantum capacitance is modelled and analysed for different number of TaS2 layers for the different polymorphs (1T-, 2H-, 3R-TaS2). Moreover, the effect of alkali-metal intercalant cations (Li, Na, and K) on the quantum capacitance of the material was investigated and analysed. Density functional theory (DFT) allows for energy calculations of different compounds and structures and estimating the electronic density of states (DOS), which is very useful for extracting quantum related properties form the system under investigation, such as electron diffusivity, transport, conductivity, and quantum capacitance (CQ). As this work is mainly focusing on supercapacitors, CQ is estimated and analysed.26 CQ has been considered a key factor in determining the overall capacitance and storage mechanism in 2D materials, especially graphene,27 MoS2,28–30 doped graphene,23,31–33 WS2, and TaS2.18,34,35 In this work a CQ estimation is performed based on the simulated DOS and Fermi statistics, where the DOS dependence on the shift in Fermi level (applied gate voltage) is transferred to the Fermi function to extrapolate the calculations for room temperature under different applied gate voltages using eqn (1) and (2):36–40
| |
 | (1) |
| |
 | (2) |
where
FT(
E) is the Fermi function (
f) derivative with respect to
E,
E is the system energy relative to the Fermi level, which is determined as the applied gate voltage,
T is the temperature in K (300 K is used as room temperature), and
KB is the Boltzmann constant. Note that the used assumption of transferring the DOS on the external applied voltage and extending it to room temperature using Fermi statistics is valid if there is no abrupt phase change with temperature and that the external bias voltage is low (in this study the gate voltage is ±0.6 V). Further elaboration regarding these points is provided in the results and discussion section.
eqn (3) is used for the formation energy (
Ef) calculations, which compares the energy of pristine TMD to the TMD with intercalant:
41| | |
Ef = (E(TaS2) − E(Xc.ccTaS2) − mE(X)/n
| (3) |
where
E(TaS
2) is the pristine TaS
2 total energy,
E(
Xc.cc − TaS
2) is alkali metal
X with concentration c.cc TaS
2 total energy,
m number of alkali-metal (intercalant – Li/Na/K) atoms,
E(
X) is the isolated alkali metal atom energy, and
n is the number of TaS
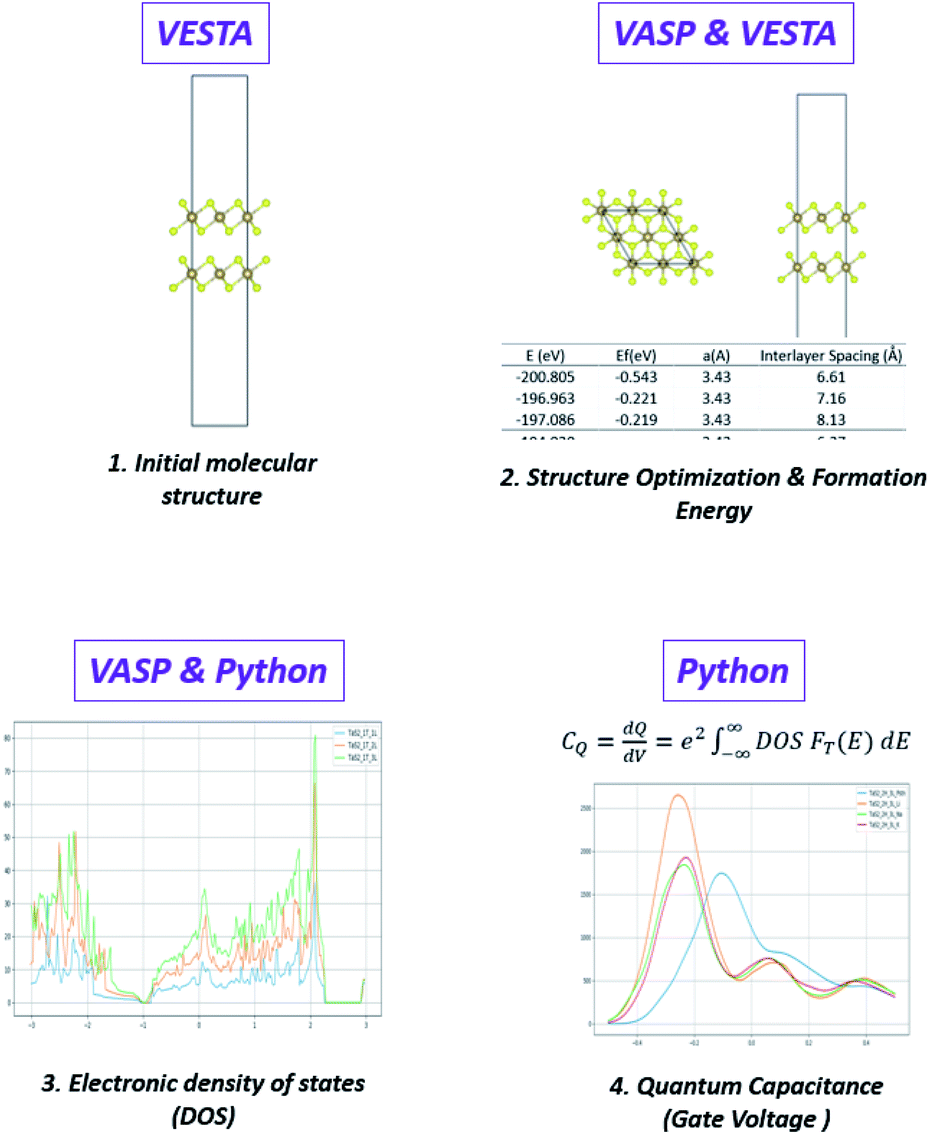
2 molecules. Three software packages were employed to achieve the best possible efficient workflow and calculations. Vienna
Ab Initio Simulation Package (VASP) 5.4.4 is used to perform geometry optimization through ionic and electronic relaxations. Electrons charge density and wavefunctions using a self-consistent field run and electronic density of states (DOS). Visualization for Electronic and Structural Analysis (VESTA) is used to build the initial atomic structure, visualizing the relaxed structure, charge distribution, molecular distance, and angles estimation. Python 3.7 is used for DOS reading and processing as well as the quantum capacitance calculation for a defined gate voltage range and increment following the same workflow as per
Fig. 1.
 |
| | Fig. 1 Quantum capacitance investigation workflow. | |
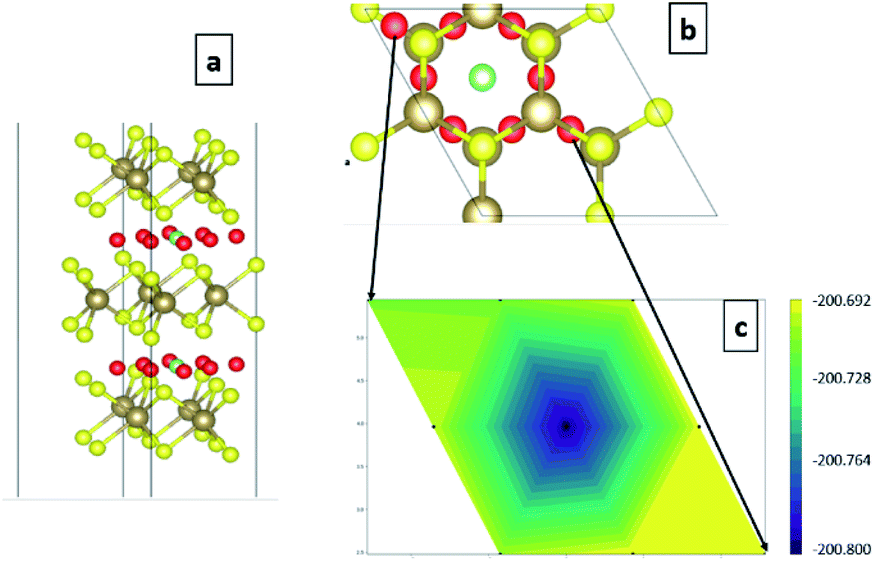
A 2 × 2 × 1 supercell is used with >30 Å of vacuum equally distributed above and below the layered structure (Fig. 2).
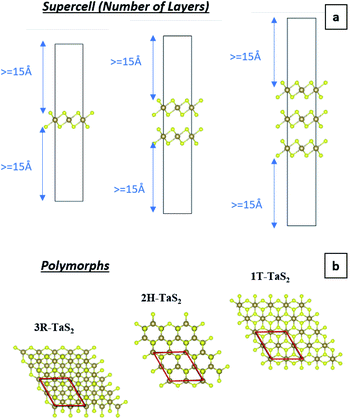 |
| | Fig. 2 (a) Pristine 1T-TaS2 supercells with different number of layers and (b) map-view of the different TaS2 polymorphs. | |
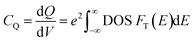
Conjugate gradient algorithm is used for ionic relaxation, cell shape and volume relaxation are enabled, 10−4 eV ionic relaxation criteria, 0.2 eV smearing (since we are dealing with metallic system), and vdW enabled using vdW-DF2,42–45 which is one of the crucial factors for the simulation of the 2D (vdW) materials. Energy cut-off of 500 eV is used to ensure the convergence of Li s valence orbit during the intercalation calculations. The maximum number of ionic relaxation iterations was 50 iterations. The electronic relaxation conversion threshold was 10−6 eV for only the self-consistent field run to generate the final charge density and wave functions. For quantum capacitance estimation, a gate voltage of −0.6 V to +0.6 V was used with step of 1.2 × 10⁻² V to ensure good sampling of the estimated CQ (V). The calculations were performed over four phases. Phase I investigates pristine TaS2 in terms of the number of layers (1–3 layers) and different polymorphs (1T, 2H and 3R). Phase II. Prior to the intercalation study it was necessary to determine the most favourable site location for the intercalant. Intercalation site selection is done through starting by the highest symmetry site (green site in Fig. 3a and b) and perturbing to other possible high symmetry sites (red sites in Fig. 3a and b) with full ionic and electronic relaxations are performed to determine the least energy (Fig. 3c). The least energy site is typically the initial guess (green site). Armed with those information phase II operated to investigate for the effect of constant concentration of alkali-metals (AM) intercalation in the 3-layered polymorphs (Fig. 4a). Phase III, performing the same experiments in phase II for 1T-MoS2 for the sake of benchmarking the 2H-TaS2 results. Phase IV, performing the calculations at different AM concentrations of 16.67%, 33.33%, 50%, and 66.67% in 2H-TaS2 with Li and Na intercalants (Fig. 4b–e).
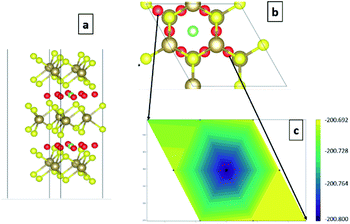 |
| | Fig. 3 (a) angle-view of the site perturbation (green original and red are the perturbed sites), (b) map-view of the site perturbation, and (c) 3D-contour map for the relaxed energies. | |
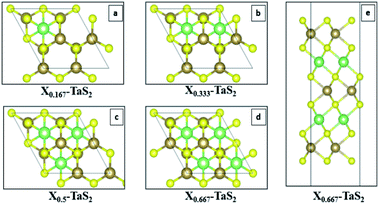 |
| | Fig. 4 Effect of different concentrations of alkali metal intercalants (a)16.67%, (b) 33.33%, (c) 50%, (d) 66.67% top-view, and (e) 66.67% – side view. | |
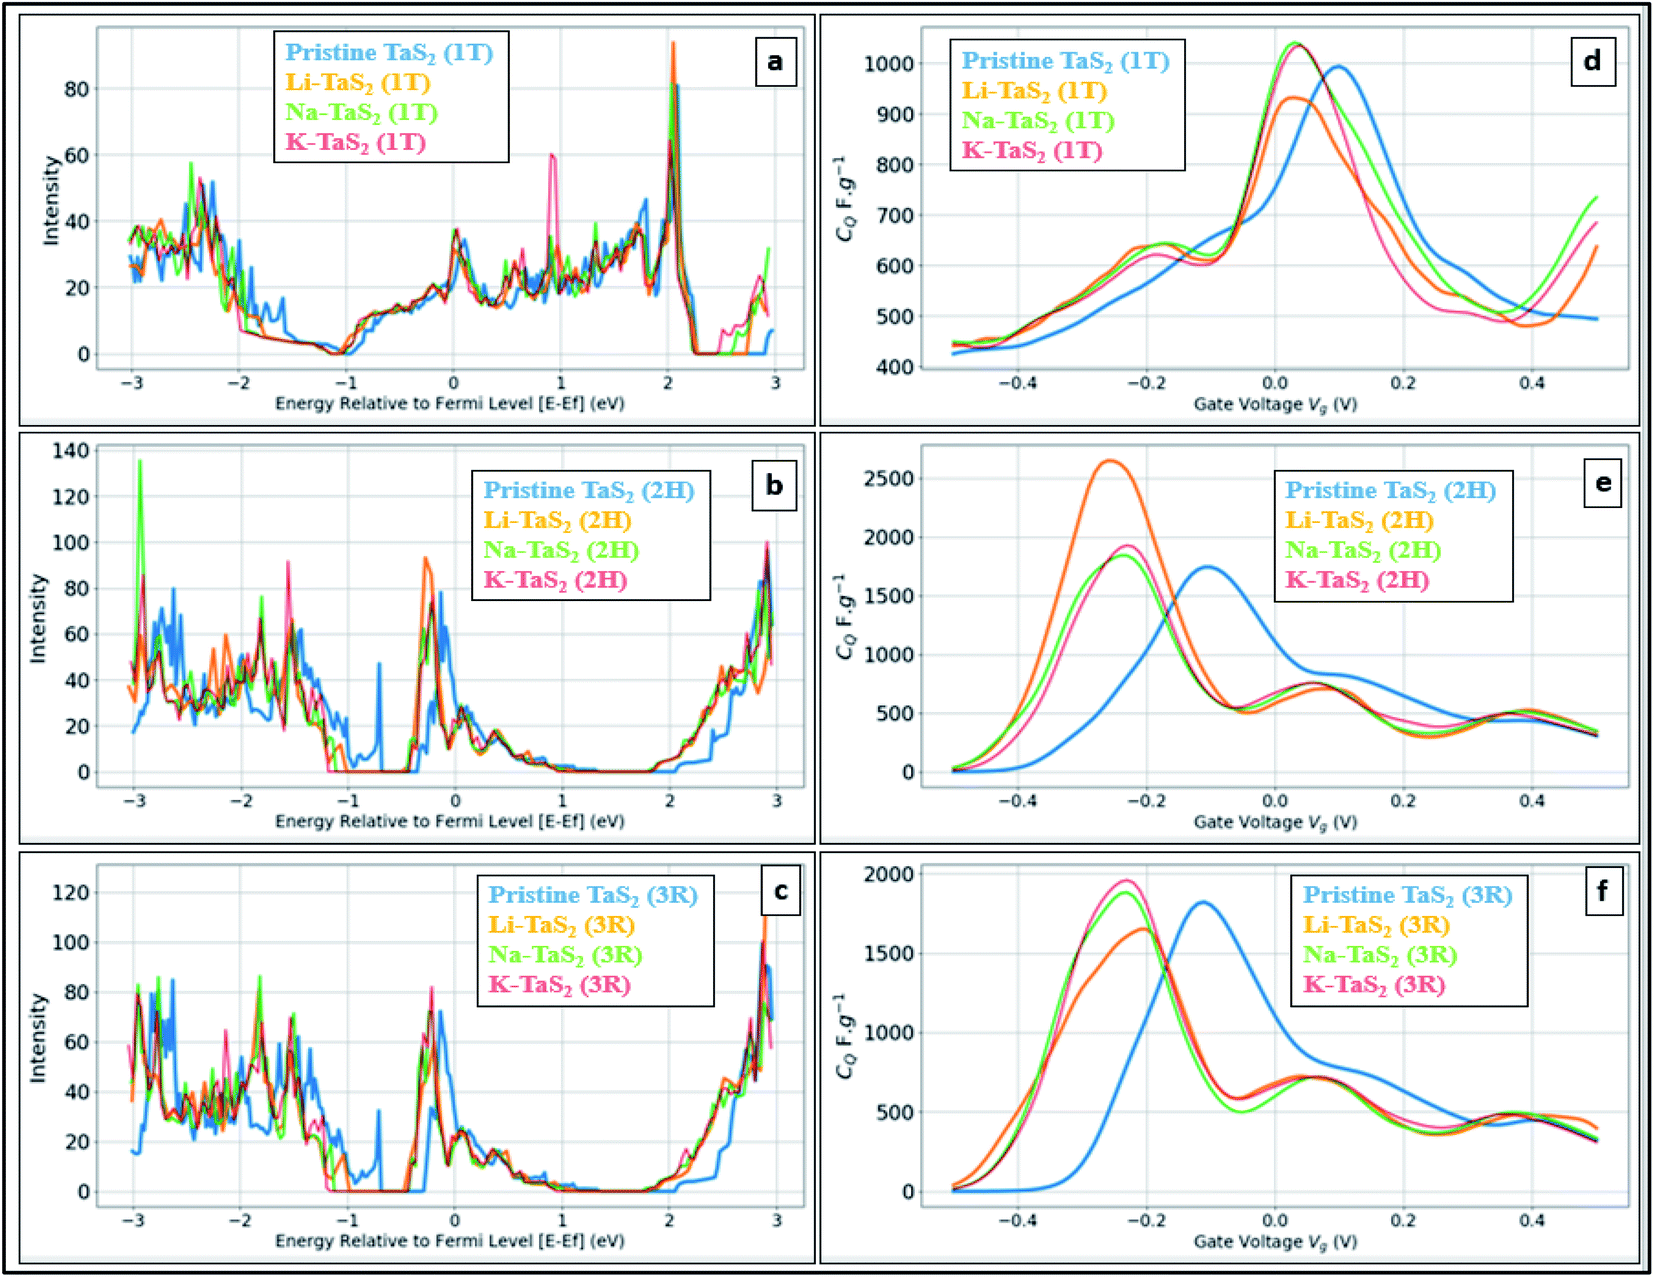
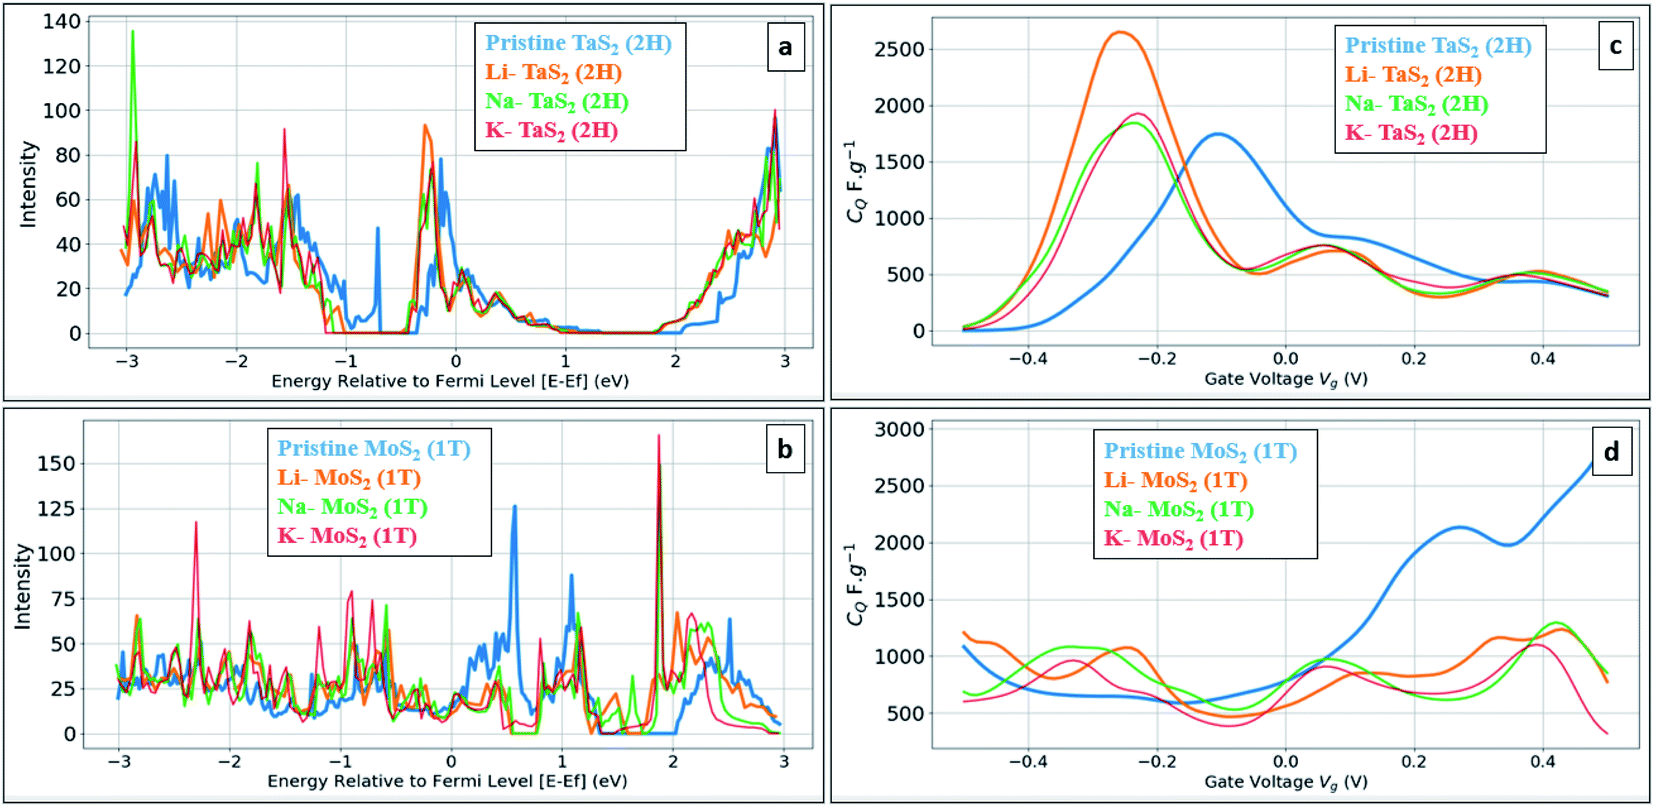
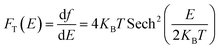
Fig. 5 shows the calculated DOS and the corresponding CQ of pristine 1T and 2H TaS2 polymorph. Note that pristine 2H-TaS2 has a better performance than the 1T-TaS2 counterpart in terms of the maximum CQ obtained. The maximum calculated CQ is 1800 F g−1 for the 2H polymorph and 900 F g−1 for the 1T polymorph. The 3R-TaS2 polymorph showed similar performance to that of the 2H counterpart as shown in Fig. 6c and f. Increasing the number of layers to 2 layers of 1T-TaS2 resulted in the highest CQ. However, in case of 2H-TaS2, the CQ increases upon decreasing the number of layers. Note that the variation in CQ with the number of layers is small (<0.3%). Alkali metal intercalation study using Li+, Na+, and K+ is conducted to determine the quantum capacitance behaviour and the total energy and structural variations associated with the intercalation process, which is crucial to determine the best intercalant ions for the energy storage devices and whether the process is thermodynamically favourable or not. Upon alkali-metal intercalation, Fig. 6, the Fermi level is shifted up for the three polymorphs (1T, 2H, 3R). While the intercalation of K and Na ions in1T-TaS2 led to an increase in the CQ, the intercalation of Li ion resulted in a decrease in the CQ. Note that the maximum CQ occurs very close to 0 V gate voltage, which limits the use of these materials in energy storage systems. In contrast, the 2H phase has an outperforming CQ upon Li ion intercalation, reaching 2650 F g−1 at gate voltage of −0.26 V, while Na and K intercalation showed CQ of 1850 and 1930 F g−1, respectively at a gate voltage of −0.23 V with a reasonable enhancement over the pristine counterpart. For 3R case (Fig. 6c and f), K ion intercalation resulted in the best CQ of 1950 F g−1 at a gate voltage of −0.23 V. A similar performance is observed for Na-intercalation with a CQ of 1880 F g−1 at the same gate voltage, while Li intercalation resulted in the least CQ. From energy point of view, pristine 2H- and 3R-TaS2 showed lower total energy than their 1T counterpart, indicating the more favourable self-assembly of those two polymorphs. Table 1 lists the calculated formation energy (Ef) for the alkali metal intercalated TaS2 polymorphs. The negative Ef for all different alkali metals intercalated TaS2 polymorphs indicates that the formation process is thermodynamically favourable, where Li intercalation.
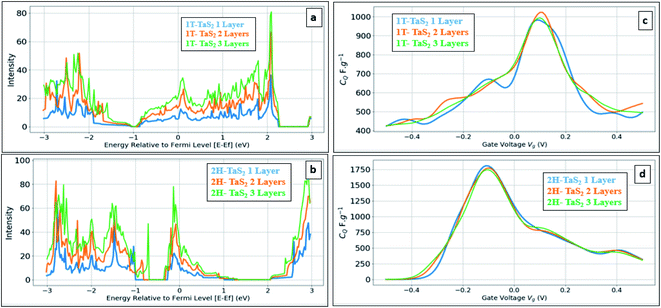 |
| | Fig. 5 Effect of the number of layers: (a) DOS of pristine 1T-TaS2, (b) DOS of pristine 2H-TaS2 (c) quantum capacitance CQ for 1T-TaS2 and (d) quantum capacitance CQ for 2H-TaS2. | |
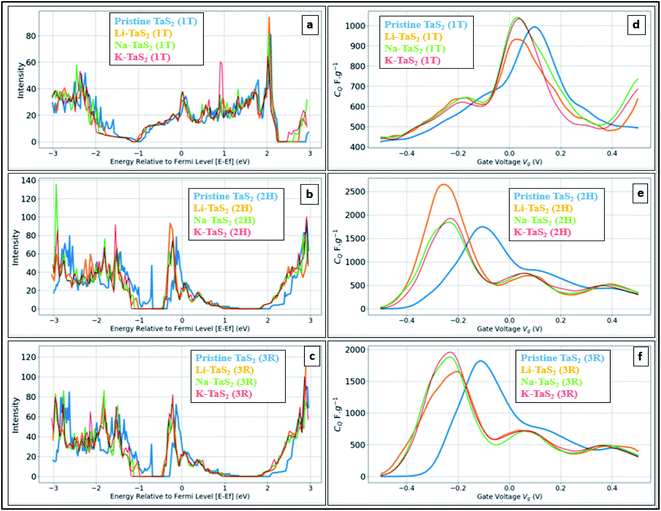 |
| | Fig. 6 Effect of different intercalants in different polymorphs. (a) DOS of the 1T-TaS2 (X = Li, Na, or K), (b) DOS of the 2H-TaS2 (X= Li, Na, or K), (c) DOS of the 3R-TaS2 (X = Li, Na, or K), (d) CQ for 1T-TaS2, (e) CQ for 2H-TaS2, and (f) CQ for 3R-TaS2 showed the most negative Ef, making it the most favourable intercalant. From molecular structure point of view, intercalating Li leads to ∼4% increase in the interlayer spacing in case of 1T and ∼3.6% in case of 2H and 3R. | |
Table 1 Calculated lattice parameter (a), interlayer spacing (L), formation energy (Ef), maximum quantum capacitance (CQ), and gate voltage of the maximum CQ (Vg) for pristine and alkali-metal intercalated TaS2 polymorphs at constant concentration of the alkali-metal
| Compound |
Layers |
Intercalant |
Concentration |
E (eV) |
Ef (eV) |
a (Å) |
L (Å) |
CQ max (F g−1) |
Vg (V) |
| 1T-TaS2 |
1 |
Pristine |
0.000 |
−64.038 |
— |
3.49 |
— |
980 |
0.090 |
| 2 |
Pristine |
0.000 |
−128.914 |
— |
3.49 |
6.15 |
1020 |
0.100 |
| 3 |
Pristine |
0.000 |
−193.808 |
— |
3.49 |
6.16 |
990 |
0.100 |
| 3 |
Li |
0.167 |
−199.273 |
−0.431 |
3.49 |
6.41 |
930 |
0.030 |
| 3 |
Na |
0.167 |
−195.192 |
−0.089 |
3.50 |
7.02 |
1040 |
0.030 |
| 3 |
K |
0.167 |
−195.271 |
−0.084 |
3.50 |
8.05 |
1030 |
0.040 |
| 2H-TaS2 |
1 |
Pristine |
0.000 |
−64.148 |
— |
3.43 |
— |
1810 |
−0.100 |
| 2 |
Pristine |
0.000 |
−129.066 |
— |
3.43 |
6.39 |
1780 |
−0.100 |
| 3 |
Pristine |
0.000 |
−193.998 |
— |
3.43 |
6.37 |
1740 |
−0.100 |
| 3 |
Li |
0.167 |
−200.805 |
−0.543 |
3.43 |
6.61 |
2650 |
−0.260 |
| 3 |
Na |
0.167 |
−196.963 |
−0.221 |
3.43 |
7.16 |
1850 |
−0.230 |
| 3 |
K |
0.167 |
−197.086 |
−0.219 |
3.43 |
8.13 |
1930 |
−0.230 |
| 3R-TaS2 |
3 |
Pristine |
0.000 |
−194.020 |
— |
3.43 |
6.37 |
1820 |
−0.110 |
| 3 |
Li |
0.167 |
−200.905 |
−0.549 |
3.43 |
6.62 |
1640 |
−0.200 |
| 3 |
Na |
0.167 |
−196.968 |
−0.219 |
3.43 |
7.23 |
1880 |
−0.230 |
| 3 |
K |
0.167 |
−197.066 |
−0.216 |
3.43 |
8.25 |
1950 |
−0.230 |
| 1T-MoS2 |
3 |
Pristine |
0.000 |
−163.480 |
— |
3.34 |
6.18 |
2361 |
0.270 |
| 3 |
Li |
0.167 |
−173.272 |
−0.792 |
3.39 |
6.44 |
1230 |
0.420 |
| 3 |
Na |
0.167 |
−169.322 |
−0.460 |
3.39 |
7.05 |
1300 |
0.420 |
| 3 |
K |
0.167 |
−169.587 |
−0.471 |
3.39 |
8.04 |
1100 |
0.390 |
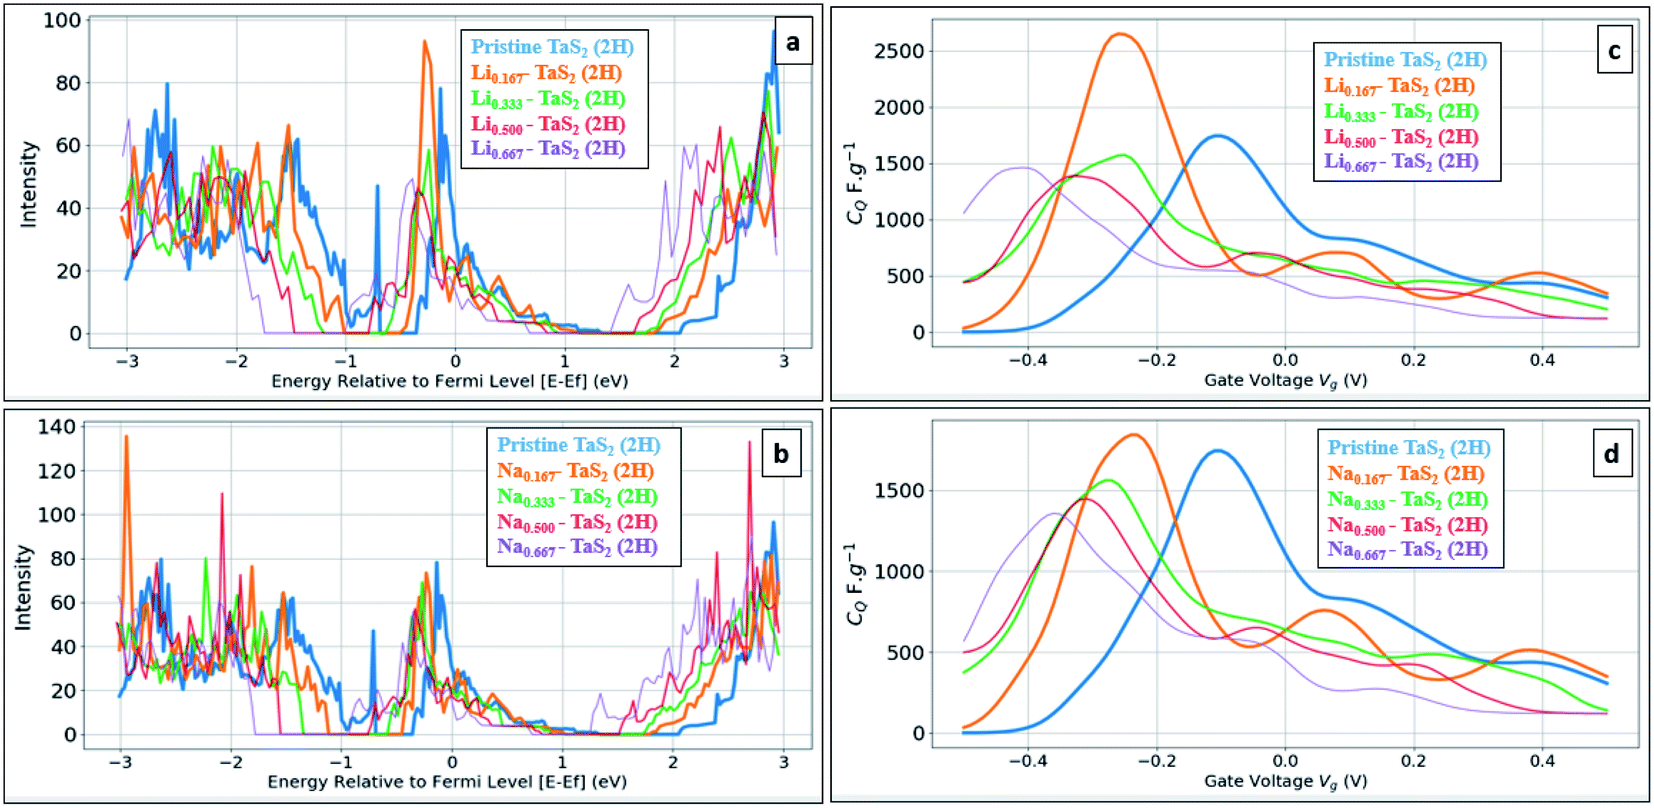
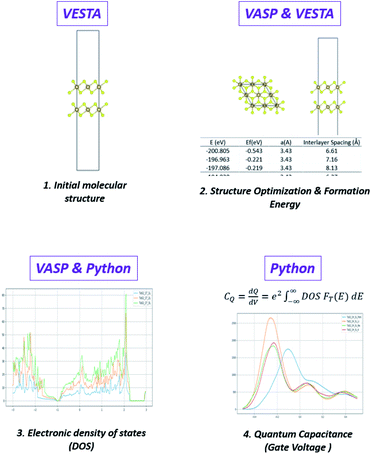
On the other hand, Na intercalation resulted in ∼13% increase in cell size and K intercalation showed 28% increase. Therefore, in general, 2H and 3R polymorphs are better performing in terms of quantum capacitance upon alkali metal ion intercalation, which qualify them to be used as negative electrodes in energy storage devices. Upon increasing the alkali-metal ion concentration, the calculations showed the CQ to decrease, see Fig. 7. For example, a drop of 55% for Li and 73% for Na was observed upon increasing the concentration from 16.67% to 66.67%. On other hand, increasing the alkali metal leads to a shift of the gate voltage of the maximum quantum capacitance towards the negative side, reaching −0.36 V in case of Na and −0.41 in case of Li. A compromise between the energy density (which favours the high quantum capacitance) and power density (which favours the high gate voltage) should be made based on the energy storage device. From formation energy point of view, high alkali metal (AM) concentration is thermodynamically favoured up to the ratio of 8AM![[thin space (1/6-em)]](https://www.rsc.org/images/entities/char_2009.gif) :12TMDs. From molecular structure point of view, a negligible variation in interlayer spacing is observed for all concentrations with slight increase in lattice parameter a (Å) with maximum variation of 1% in case of Na 0.667 concentration, see Table 2. As the calculations showed the suitability of alkali-metal ion intercalated TaS2 for use as negative electrodes, we have investigated the metallic 1T-MoS2 phase under the same framework, see Fig. 8. Note that 1T-MoS2 is better behaving as a positive electrode. Therefore, both1T-MoS2 and 2H-TaS2 can be combined to construct a supercapacitor device as the positive and negative electrodes, respectively.
:12TMDs. From molecular structure point of view, a negligible variation in interlayer spacing is observed for all concentrations with slight increase in lattice parameter a (Å) with maximum variation of 1% in case of Na 0.667 concentration, see Table 2. As the calculations showed the suitability of alkali-metal ion intercalated TaS2 for use as negative electrodes, we have investigated the metallic 1T-MoS2 phase under the same framework, see Fig. 8. Note that 1T-MoS2 is better behaving as a positive electrode. Therefore, both1T-MoS2 and 2H-TaS2 can be combined to construct a supercapacitor device as the positive and negative electrodes, respectively.
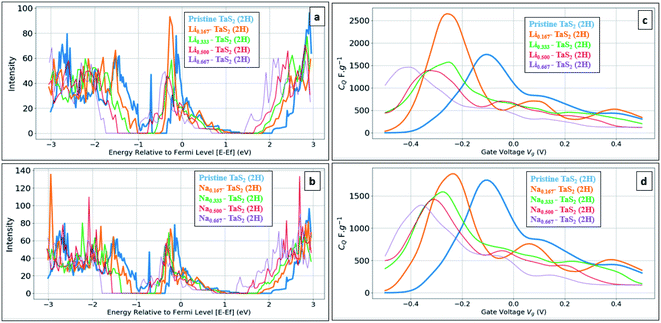 |
| | Fig. 7 Comparison of different alkali metal concentration for 2H-TaS2 (2H). (a) DOS for Lic-TaS2, C = 0.167, 0.333, 0.500, and 0.667, and (b) DOS for Nac-TaS2, C = 0.167, 0.333, 0.500, and 0.667, (c) quantum capacitance CQ for Lic-TaS2, C = 0.167, 0.333, 0.500, and 0.667, and (d) quantum capacitance CQ for Nac-TaS2, C = 0.167, 0.333, 0.500, and 0.667. | |
Table 2 Calculated lattice parameter (a), interlayer spacing (L), formation energy (Ef), maximum quantum capacitance (CQ), and gate voltage of the maximum CQ (Vg) for pristine and alkali-metal intercalated TaS2 polymorphs at different concentrations of the alkali-metal
| Compound |
Intercalant |
Concentration |
E (eV) |
Ef (eV) |
a (Å) |
L (Å) |
CQ max (F g−1) |
Vg (V) |
| 2H-TaS2 |
Pristine |
0.000 |
−193.998 |
— |
3.43 |
6.37 |
1740 |
−0.100 |
| Li |
0.167 |
−200.805 |
−0.543 |
3.43 |
6.61 |
2650 |
−0.260 |
| Li |
0.333 |
−207.043 |
−1.038 |
3.44 |
6.62 |
1750 |
−0.250 |
| Li |
0.500 |
−212.694 |
−1.485 |
3.44 |
6.62 |
1390 |
−0.330 |
| Li |
0.667 |
−217.740 |
−1.881 |
3.44 |
6.62 |
1460 |
−0.410 |
| Na |
0.167 |
−196.963 |
−0.221 |
3.43 |
7.16 |
1850 |
−0.230 |
| Na |
0.333 |
−199.388 |
−0.423 |
3.46 |
7.25 |
1560 |
−0.280 |
| Na |
0.500 |
−200.843 |
−0.544 |
3.46 |
7.21 |
1450 |
−0.310 |
| Na |
0.667 |
−201.421 |
−0.592 |
3.48 |
7.17 |
1360 |
−0.360 |
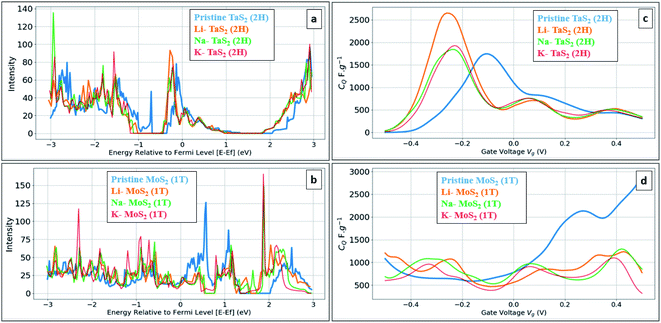 |
| | Fig. 8 Comparison between the outperforming polytypes of TaS2 and MoS2: (a) DOS of 2H-TaS2 with different alkali-metal intercalation (b) DOS of 1T-MoS2 with different alkali-metal intercalation (c) Quantum Capacitance CQ for 2H-TaS2 with different alkali-metal intercalation, and (d) Quantum Capacitance CQ for of 1T-MoS2 with different alkali-metal intercalation. | |
Conclusion
An in-depth quantum capacitance first-principles investigation is demonstrated for TaS2 with different number of layers, polymorphs, and alkali metal intercalants. The study shows that TaS2 is promising material for low bias electrical energy storage systems (ESS) such as supercapacitors. The 2H and 3R TaS2 phases are more stable and better performing (higher quantum capacitance) than the 1T phase. While Li ion was found to be the best intercalant for the 2H-TaS2 phase (highest CQ), K ion intercalation was the best for the 3R-TaS2 phase. Increasing the alkali metal ion concentration resulted in a decrease in CQ the of the 2H-TaS2 phase with a shift in the gate voltage of the peak CQ to the more negative side. Our investigation also showed the promise of combining the 2H-TaS2 as a negative electrode with the 1T-MoS2 as a positive electrode to construct a highly performing supercapacitor device. In this regard, a threshold needs to be made to ensure high energy density, which favours high quantum capacitance, and high power density, which favours high gate voltage.
Author contributions
Mahmoud M. el Attar: methodology, formal analysis, investigation, writing original draft. Nageh K. Allam: conceptualization, formal analysis, writing – review & editing, project administration, funding acquisition, supervision.
Conflicts of interest
The authors declare that they have no known competing financial interests or personal relationships that could have appeared to influence the work reported in this paper.
References
- IEA, World total final consumption by source, 1971-2019, https://www.iea.org/data-and-statistics/charts/world-total-final-consumption-by-source-1971-2019 Search PubMed.
- L. Jörissen and H. Frey, in Encyclopaedia of Electrochemical Power Sources, Elsevier, 2009, pp. 215–231 Search PubMed.
- N. K. Awad, E. A. Ashour and N. K. Allam, J. Renewable Sustainable Energy, 2014, 6, 022702 CrossRef.
- A. M. Mohamed and N. K. Allam, J. Energy Storage, 2022, 47, 103565 CrossRef.
- J. Janek and W. G. Zeier, Nat. Energy, 2016, 1, 16141 CrossRef.
- N. Mohamed and N. K. Allam, RSC Adv., 2020, 10, 21662–21685 RSC.
- I. M. Badawy, A. M. Elbanna, M. Ramadan and N. K. Allam, Electrochim. Acta, 2022, 408, 139932 CrossRef CAS.
- D. A. Miranda and P. R. Bueno, Phys. Chem. Chem. Phys., 2016, 18, 25984–25992 RSC.
- B. A. Ali, A. H. Biby and N. K. Allam, Energy Fuels, 2021, 35, 13426–13437 CrossRef CAS.
- P. Poizot, S. Laruelle, S. Grugeon, L. Dupont and J. M. Tarascon, Nature, 2000, 407, 496–499 CrossRef CAS PubMed.
- N. M. Deyab, N. Ahmed and N. K. Allam, ChemNanoMat, 2020, 6, 1513–1518 CrossRef CAS.
- Z. Xu, H. Yang, X. Song, Y. Chen, H. Yang, M. Liu, Z. Huang, Q. Zhang, J. Sun, L. Liu and Y. Wang, Nanotechnology, 2021, 32, 492001 CrossRef CAS PubMed.
- B. A. Ali, A. M. A. Omar, A. S. G. Khalil and N. K. Allam, ACS Appl. Mater. Interfaces, 2019, 11, 33955–33965 CrossRef CAS PubMed.
- J. Feng, X. Sun, C. Wu, L. Peng, C. Lin, S. Hu, J. Yang and Y. Xie, J. Am. Chem. Soc., 2011, 133, 17832–17838 CrossRef CAS PubMed.
- H. M. El Sharkawy, A. S. Dhmees, A. R. Tamman, S. M. El Sabagh, R. M. Aboushahba and N. K. Allam, J. Energy Storage, 2020, 27, 101078 CrossRef.
- M. D. Stoller, S. Park, Y. Zhu, J. An and R. S. Ruoff, Nano Lett., 2008, 8, 3498–3502 CrossRef CAS PubMed.
- M. Abdel-Hafiez, X.-M. Zhao, A. A. Kordyuk, Y.-W. Fang, B. Pan, Z. He, C.-G. Duan, J. Zhao and X.-J. Chen, Sci. Rep., 2016, 6, 31824 CrossRef CAS PubMed.
- Y.-F. Cao, K.-M. Cai, L.-J. Li, W.-J. Lu, Y.-P. Sun and K.-Y. Wang, Chin. Phys. Lett., 2014, 31, 077203 CrossRef.
- D. F. Shao, R. C. Xiao, W. J. Lu, H. Y. Lv, J. Y. Li, X. B. Zhu and Y. P. Sun, Phys. Rev. B, 2016, 94, 125126 CrossRef.
- L. J. Li, W. J. Lu, X. D. Zhu, L. S. Ling, Z. Qu and Y. P. Sun, Europhys. Lett., 2012, 98, 29902 CrossRef.
- A. K. Geremew, S. Rumyantsev, F. Kargar, B. Debnath, A. Nosek, M. A. Bloodgood, M. Bockrath, T. T. Salguero, R. K. Lake and A. A. Balandin, ACS Nano, 2019, 13, 7231–7240 CrossRef CAS PubMed.
- Y. Hu, Q. Hao, B. Zhu, B. Li, Z. Gao, Y. Wang and K. Tang, Nanoscale Res. Lett., 2018, 13, 20 CrossRef PubMed.
- J. Xia, F. Chen, J. Li and N. Tao, Nat. Nanotechnol., 2009, 4, 505–509 CrossRef CAS PubMed.
- R. V. Coleman, Z. Dai, W. W. McNairy, C. G. Slough and C. Wang, Appl. Surf. Sci., 1992, 60–61, 485–490 CrossRef CAS.
- J. Shi, W. Quan, X. Chen, X. Chen, Y. Zhang, W. Lv, J. Yang, M. Zeng, H. Wei, N. Hu, Y. Su, Z. Zhou and Z. Yang, Phys. Chem. Chem. Phys., 2021, 23, 18359–18368 RSC.
- S. Luryi, Appl. Phys. Lett., 1988, 52, 501–503 CrossRef.
- J. Vatamanu, X. Ni, F. Liu and D. Bedrov, Nanotechnology, 2015, 26, 464001 CrossRef PubMed.
- I. V. Chepkasov, M. Ghorbani-Asl, Z. I. Popov, J. H. Smet and A. V. Krasheninnikov, Nano Energy, 2020, 75, 104927 CrossRef CAS.
- A. H. Biby, B. A. Ali and N. K. Allam, Mater. Today Energy, 2021, 20, 100677 CrossRef CAS.
- M. Mortazavi, C. Wang, J. Deng, V. B. Shenoy and N. V. Medhekar, J. Power Sources, 2014, 268, 279–286 CrossRef CAS.
- P. R. Bueno and J. J. Davis, Anal. Chem., 2014, 86, 1337–1341 CrossRef CAS PubMed.
- H. Xu, Z. Zhang and L.-M. Peng, Appl. Phys. Lett., 2011, 98, 133122 CrossRef.
- P. Ramos Ferrer, A. Mace, S. N. Thomas and J.-W. Jeon, Nano Convergence, 2017, 4, 29 CrossRef PubMed.
- B. A. Ali, O. I. Metwalli, A. S. G. Khalil and N. K. Allam, ACS Omega, 2018, 3, 16301–16308 CrossRef CAS PubMed.
- M. Acerce, D. Voiry and M. Chhowalla, Nat. Nanotechnol., 2015, 10, 313–318 CrossRef CAS PubMed.
- E. Paek, A. J. Pak and G. S. Hwang, J. Electrochem. Soc., 2014, 161, X15 CrossRef CAS.
- E. Paek, A. J. Pak, K. E. Kweon and G. S. Hwang, J Phys Chem C Nanomater Interfaces, 2013, 117, 14461 CrossRef CAS.
- S. M. Mousavi-Khoshdel and E. Targholi, Carbon, 2015, 89, 148–160 CrossRef CAS.
- G. M. Yang, H. Z. Zhang, X. F. Fan and W. T. Zheng, J Phys Chem C Nanomater Interfaces, 2015, 119, 6464–6470 CrossRef CAS.
- B. A. Ali and N. K. Allam, Phys. Chem. Chem. Phys., 2019, 21, 17494–17511 RSC.
- G. Barik and S. Pal, J Phys Chem C Nanomater Interfaces, 2019, 123, 21852–21865 CrossRef CAS.
- K. Lee, É. D. Murray, L. Kong, B. I. Lundqvist and D. C. Langreth, Phys. Rev., 2010, 82, 081101 CrossRef.
- M. Dion, H. Rydberg, E. Schröder, D. C. Langreth and B. I. Lundqvist, Phys. Rev. Lett., 2005, 95, 109902 CrossRef.
- F. Tran, J. Stelzl, D. Koller, T. Ruh and P. Blaha, Phys. Rev. B, 2017, 96, 054103 CrossRef.
- J. Klimeš, D. R. Bowler and A. Michaelides, J. Phys.: Condens. Matter, 2010, 22, 022201 CrossRef PubMed.
|
| This journal is © The Royal Society of Chemistry 2022 |
Click here to see how this site uses Cookies. View our privacy policy here. 
 Open Access Article
 This Open Access Article is licensed under a
  *
*