
 Open Access Article
 This Open Access Article is licensed under a Creative Commons Attribution-Non Commercial 3.0 Unported Licence
Robocasting of 3D printed and sintered ceria scaffold structures with hierarchical porosity for solar thermochemical fuel production from the splitting of CO2
Basam A. E.
Ben-Arfa
 a,
Stéphane
Abanades
b,
Isabel M. Miranda
Salvado
a,
José M. F.
Ferreira
a and
Robert C.
Pullar
*ac
a,
Stéphane
Abanades
b,
Isabel M. Miranda
Salvado
a,
José M. F.
Ferreira
a and
Robert C.
Pullar
*ac
aDepartment of Materials and Ceramic Engineering/CICECO – Aveiro Institute of Materials, University of Aveiro, 3810-193 Aveiro, Portugal. E-mail: robertcarlyle.pullar@unive.it
bProcesses, Materials, and Solar Energy Laboratory (PROMES-CNRS), 7 Rue du Four Solaire, 66120 Font-Romeu, France
cDepartment of Molecular Sciences and Nanosystems (DSMN), Ca’ Foscari University of Venice, Scientific Campus, Via Torino 155, 30172 Venezia Mestre, VE, Italy
First published on 7th March 2022
Abstract
We report the first ever robocast (additive manufacturing/3D printing) sintered ceria scaffolds, and explore their use for the production of renewable fuels via solar thermochemical fuel production (STFP, water and carbon dioxide splitting using concentrated solar energy). CeO2 catalyst scaffolds were fabricated as 50 mm diameter discs (struts and voids ∼500 μm), sintered at 1450 °C, with specific surface area of 1.58 m2 g−1. These scaffolds have hierarchical porosity, consisting of the macroporous scaffold structure combined with nanoscale porosity within the ceria struts, with mesopores <75 Å and an average pore size of ∼4 nm, and microporosity <2 nm with a microporous surface area of 0.29 m2 g−1. The ceria grains were ≤500 nm in diameter after sintering. STFP testing was carried out via thermogravimetric analysis (TGA) with reduction between 1050–1400 °C under argon, and oxidation at 1050 °C with 50% CO2, gave rapid CO production during oxidation, with high peak CO production rates (0.436 μmol g−1 s−1, 0.586 ml g−1 min−1), for total CO yield of 78 μmol g−1 (1.747 ml g−1). 90% CO was obtained after just 10 min of oxidation, comparing well to reticulated ceria foams, this CO production rate being an order of magnitude greater than that for ceria powders when tested at similar temperatures.
Introduction
Cerium dioxide (ceria) is an extremely versatile oxide with a wide range of applications in catalysis, due to its ability to reduce to the nonstoichiometric form, CeO2−δ, containing a mixture of Ce4+ and Ce3+ ions. Pure stoichiometric CeO2 has the face centred cubic calcium fluoride (fluorite) structure, and it can tolerate a considerable degree of reduction without change of crystal phase, withstanding reduced nonstoichiometries of δ up to 0.286,1 especially at elevated temperatures.2 Cerium can also form cerium(III) oxide, Ce2O3, but this is unstable and will easily oxidise to cerium(IV) oxide (CeO2). Ceria undergoes partial and reversible reduction at high temperatures (>1000 °C) in low pO2 (10−5 atm) atmospheres, and it contains many oxygen vacancies within its structure, which is essential for improving oxygen mobility.3 CeO2 has an unusually high entropy change associated with oxygen exchange, which can result in lowered temperature swings between the reduction and oxidation steps4 compared to other non-stoichiometric redox materials. It also features rapid reaction kinetics and oxygen diffusion rates,5 and it is thermally stable and resistant to sintering even at high temperatures because of its high melting point of ∼2400 °C.6 This makes ceria an ideal material for the thermochemical production of renewable fuels, due to its redox capabilities and ability to maintain the fluorite structure during thermochemical cycling over the typical 900–1500 °C range of operating temperatures used.7Solar thermochemical fuel production (STFP) is one of the potential solutions to our current environmental and energy crisis. It enables the production of renewable fuels by utilising concentrated solar power (CSP, sunlight focused with parabolic mirrors to heat up to 2000 °C) to drive a redox reaction on a metal oxide catalyst, such as ceria.8 This oxide is reduced in a neutral atmosphere at high temperatures (1400–1500 °C) to CeO2−δ, and then cooled to around 1000 °C as either water vapour or carbon dioxide are introduced. This takes oxygen from the H2O or CO2 to re-oxidise the ceria, splitting these molecules to produce H2 or CO.9 H2 is a potential fuel in its own right, and CO can be used to produce other renewable synthetic fuels. This fuel production cycle is powered by solar energy, and can be used to mitigate CO2 emissions if the CO2 feed is taken directly from such a source. Ceria was first investigated as a material specifically for solar thermochemical water splitting in 2006 by Abanades and Flamant,10 and for the solar thermochemical splitting of CO2 in 2010 by Chueh et al.11 and Haussener and Steinfeld.12,13
Since then, many studies have investigated ceria redox materials, but as we demonstrated in a recent review paper, the morphology of the ceria can have a great effect on its thermochemical fuel production efficiency.14 Repeating 3-DOM porous structures such as reticulated foams15 or cork derived ecoceramics16–18 of ceria proved to be excellent materials because of their structure, rather than any intrinsic chemical or ionic enhancements or dopants. This led us to speculate that 3D printed or robocast ceria, with a regular but open network structure, similar to robocast bone scaffolds developed for biomedicine,19 could be a potentially superior form for such STFP applications.
There has been very little previous work on the 3D printing or robocasting of ceria. For the additive manufacturing of ceramics, alumina was 3D printed by freeze-form extrusion fabrication in 2007,20 and inkjet printing of 80 μm layers in 2008,21 followed by lithography-based ceramic manufacturing in 201422 and 3D powder bed printing in 2015.23 Alumina extruded with a polymer binder was tested for syngas reforming when coated with NiO or CeO2 in 2017,24 colloidal alumina gels and a hydrogel were robocast in 2012–201325,26 and 2016,27 respectively, and robocast alumina pastes were reported in 2017–2018.28,29 Solid 20 mol% Sm-doped ceria pellets were produced by 3D direct writing from a paraffin based slurry for solid oxide fuel cell applications (and then sintered at only 700 °C) in 2019,30 a 10 mol% ceria-stabilised-zirconia and alumina composite biomaterial was robocast from a hydrogel in 2017,31 and the 3D printing by stereo lithography of Al2O3 with 12 mol% CeO2–ZrO2 (Zr4+![[thin space (1/6-em)]](https://www.rsc.org/images/entities/char_2009.gif) :Ce4+ = molar ratio of 88:12) was reported in 2020.32 The only reports of similar porous ceria structures are those made by the replication method on extruded polymer supports for CSP applications in 2019,33 and 3D printed polymer scaffolds in 2021,34 ceria coated on 3D printed polymer supports/structures/scaffolds,35,36 CuO/CeO2 catalysts coated on 3D printed polymer scaffolds,37 Ni/CeO2–ZrO2 powder deposited on 3D printed stainless-steel honeycomb monoliths,38 CeO2–ZrO2–La2O3 nanopowder catalysts supported on robocast graphene oxide scaffolds,39 3D printed ceria/silica microsphere/boehmite (γ-AlO(OH)) particle-stabilised foams by moulding and direct ink writing,40 and robocast ceria coated with a nickel catalyst.41 All such 3D printed ceramics need to be sintered after manufacture to produce the ceria ceramic, particularly if destined for high temperature use – in nearly all of the cases above, the ceria was used unsintered as a catalyst. Ref. 33 does not state at what temperature the materials were heated/sintered after coating the polymer templates, just that they were thermochemically cycled in tests at 1450 °C, the polymer scaffold templated ceria in ref. 34 was sintered at 1400 °C, and the ceria-based foams in40 were sintered at 1500 °C. The robocast ceria in ref. 41 was intended as a support for the 10 wt% nickel catalyst, and so was not sintered, but just calcined at 450–500 °C to maintain a porous nature. The catalytic decomposition of ammonia was carried out at a maximum of 600 °C with this material.
:Ce4+ = molar ratio of 88:12) was reported in 2020.32 The only reports of similar porous ceria structures are those made by the replication method on extruded polymer supports for CSP applications in 2019,33 and 3D printed polymer scaffolds in 2021,34 ceria coated on 3D printed polymer supports/structures/scaffolds,35,36 CuO/CeO2 catalysts coated on 3D printed polymer scaffolds,37 Ni/CeO2–ZrO2 powder deposited on 3D printed stainless-steel honeycomb monoliths,38 CeO2–ZrO2–La2O3 nanopowder catalysts supported on robocast graphene oxide scaffolds,39 3D printed ceria/silica microsphere/boehmite (γ-AlO(OH)) particle-stabilised foams by moulding and direct ink writing,40 and robocast ceria coated with a nickel catalyst.41 All such 3D printed ceramics need to be sintered after manufacture to produce the ceria ceramic, particularly if destined for high temperature use – in nearly all of the cases above, the ceria was used unsintered as a catalyst. Ref. 33 does not state at what temperature the materials were heated/sintered after coating the polymer templates, just that they were thermochemically cycled in tests at 1450 °C, the polymer scaffold templated ceria in ref. 34 was sintered at 1400 °C, and the ceria-based foams in40 were sintered at 1500 °C. The robocast ceria in ref. 41 was intended as a support for the 10 wt% nickel catalyst, and so was not sintered, but just calcined at 450–500 °C to maintain a porous nature. The catalytic decomposition of ammonia was carried out at a maximum of 600 °C with this material.
In this paper we report the ever first synthesis and characterisation of sintered robocast pure ceria, and its use in STFP to split water and carbon dioxide. This 3D printed sintered ceria would also be suitable for other high temperature applications. The macroporous robocast ceria structures were in the form of “woodpile” type cylinders and discs around 50 mm in diameter after sintering, with 500 μm diameter struts and 500 μm sized voids, produced from a ceria powder printing paste/ink with 46% solids loading. They were sintered at 1450 °C, their crystal structure, microstructure, sintering behaviour and porosity characterised, and their redox properties at high temperatures investigated for potential use in renewable solar energy applications.
Experimental
Ceria powder with mean particle size ≤5 μm (99.9% purity) was used as received without further milling. Hydroxypropyl methyl cellulose (HPMC) was used as thickener, and poly(ethyleneimine) (PEI) solution, 50% (w/v) in H2O, was used as coagulant. All materials were supplied from Sigma-Aldrich, except DISPEX® A40 which was supplied from BASF, and all were used as received.Ceria suspension preparation
The ceria powder with mean particle size ≤5 μm, as shown in Fig. 1, was gradually added to the dispersing solution (0.4 wt% DISPEX® A40 in de-ionised water) in several consecutive small doses. After each addition, the powder and the dispersing solution were mixed in a planetary centrifugal mixer (ARE-250, Thinky Corp. Tokyo, Japan) to ensure a final consistent suspension.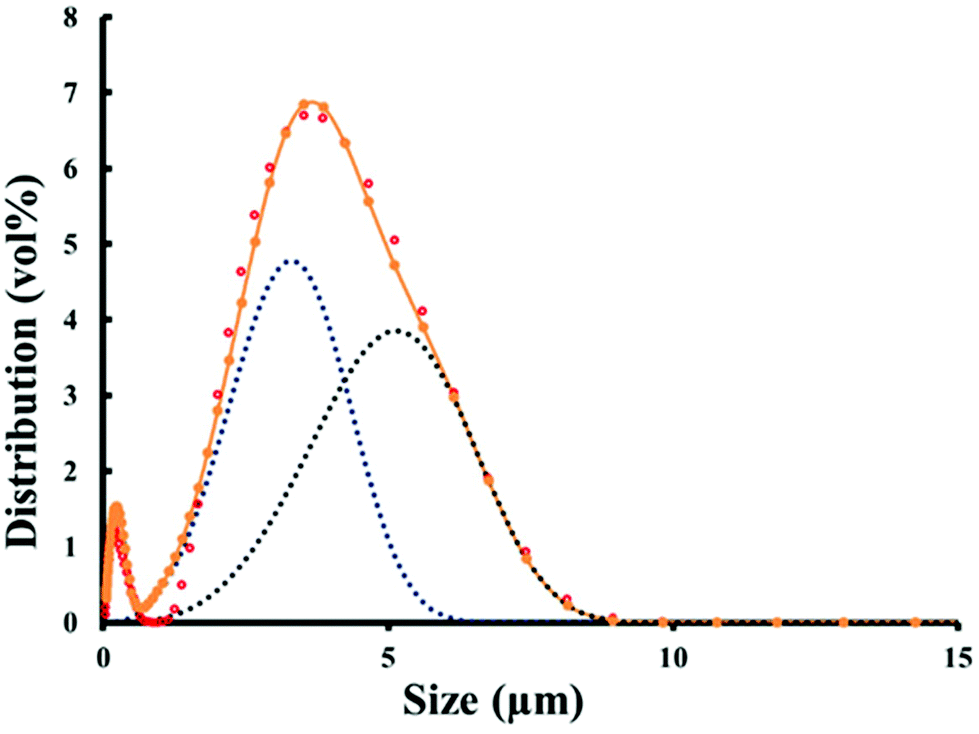 | ||
| Fig. 1 Particle size distribution for the ceria powder. The data points show the particle size distribution, and the dotted lines indicate the probable bimodal nature of this powder. | ||
After completion of powder addition, and ensuring a homogeneous suspension, 2% HPMC was added as a thickening agent to provide flowability, and to add shear thinning behaviour to the paste at applied shear, followed by centrifugal mixing for 6 minutes. 0.02% PEI was added as a coagulant, to help preserve the shape after extrusion/robocasting, and the paste was then mixed for a further 10 minutes.
Robocasting of ceria
The ceria scaffolds were deposited layer-by-layer using robocasting equipment (3-D Inks, Stillwater, OK, USA). To adapt the system to extrude large scaffold sizes, a plunger actuated by air was used instead of a stepper motor. The paste was extruded through a nozzle with a diameter of 510 μm, using a printing pressure of 6 bar. The designed scaffold consisted of a 3D log-cabin type structure made of 6 layers, with the next layer being rotated around 90° from the previous layer in the plane of the struts. Scaffolds were printed as discs (50 mm diameter after sintering) with 510 μm diameter struts and a macropore/void size (the distance between the struts) of 500 μm. The deposition was carried out in a reservoir containing paraffin oil to allow a uniform drying of the green scaffolds. Once printing was finished, the scaffolds were removed from the oil and dried at room temperature for 24 h. They were then sintered at 1450 °C for 2 h, using a heating rate of 1 °C min−1 to ensure a complete removal of the residual organics.Characterisation
The average particle size and the particle size distribution of the powder, on a volume basis, were determined using a laser diffraction particle size analyser (Coulter LS particle size analyser; Beckman Coulter, CA) with triplicate measurements. Shrinkage of the scaffold was measured on a TA Instruments DIL 801L PRO dilatometer, heated in air at a rate of 10 °C min−1. Measurements were taken in both longitudinal (parallel to the direction of the struts) and vertical (perpendicular to the direction of the struts, into the surface of the disc) directions. The samples were rectangular sections with dimensions of about 10 mm × 5 mm cut from the centre of the scaffold.X-ray diffraction (XRD) patterns were measured on a PANalytical X'PERT PRO 3 instrument (Cu Kα radiation, 10–80°, 0.01° 2θ step-scan and 200 s per step) with phase identification by HighScore Plus software. Scanning electron microscopy (SEM) images were taken with a Hitachi S-4100 microscope, on samples coated with carbon. The specific surface area (SSA) & porosity were measured by the Brunauer–Emmett–Teller (BET) method on a Micrometrics Gemini VII Surface Area Analyzer (Micrometrics Instruments Corp., Norcross, GA, USA). Adsorption/desorption isotherms were measured using N2 as the adsorbate at 77 K, and outgassing the samples at 120 °C. The geometrical density of the scaffolds was measured from their dimensions and mass. The bulk density of ceria is 7.22 g cm−3.
The thermochemical redox capability of the sintered ceria scaffold catalyst was investigated by thermogravimetric analysis (TGA) performed in controlled atmospheres on a Setaram Setsys Evo 1750. The sample was placed in a platinum crucible hung inside the furnace chamber, the chamber evacuated to eliminate residual air, and filled with argon gas flowing at 20 mL min−1 (99.999% purity). Heating and cooling rates of 20 °C min−1 were used throughout. The reduction step was carried out at 1400 °C per 45 min under Ar, and then the temperature was lowered to 1050 °C in Ar and held for 60 min for the re-oxidation step at isothermal conditions. For this a CO2 stream was injected from the auxiliary gas inlet and mixed with the Ar carrier gas (50% CO2 in Ar) at a total flow rate of 20 mL min−1. The mixture entered at the top of the furnace chamber towards the sample and then exited the chamber at the bottom.
The mass losses during thermal reduction are converted to the mole amount of O2 released per gram of ceria according to:
| nO2 = Δmloss/(MO2·mceria) | (1) |
The mass gain associated with CO2 splitting results in a CO amount (mol g−1) which can be calculated as:
| nCO = Δmgain/(MO·mceria) | (2) |
Results and discussion
Physical characterisation of the sintered robocast ceria catalyst scaffold
Photographs of the sintered robocast ceria disc are shown in Fig. 2a and b, and the surface of this disc has been polished flat to enable us to see the interior microstructure. The shrinkage of the green ceria scaffold upon heating to 1475 °C, along the longitudinal (horizontal direction, parallel to the struts) and vertical (into the surface of the disc, through the layers) directions, is shown in Fig. 2c. The small, rapid decreases in length while heating from 200 to 400 °C observed in both directions were due to failures of irregularities on the surface/edge, and the normalised plots from 400 °C onwards are shown in the insert. It can be seen that the thermal expansion/shrinkage was identical in both directions until the onset of sintering at ∼1050 °C. Beyond this temperature, the shrinkage was slightly quicker and greater in the vertical direction than the longitudinal one. This relatively small difference can be attributed to two cooperative effects: (i) the mechanical friction between the surface of the scaffold and the refractory support, which tends to mitigate the shrinkage; (ii) the gravity force that commonly adds to the driving force for shrinkage in the vertical direction. Because of this, the shrinkage tends to occur more in the diameter of the struts rather than in their length in robocast scaffolds, leading to anisotropic shrinkage, with proportionately more of this total shrinkage occurring in the vertical direction, the difference here being 1.5% more total shrinkage measured in the vertical direction (9.5% shrinkage in the longitudinal direction, 11.0% in the vertical direction). The sintered scaffolds were not fragile, and very handleable.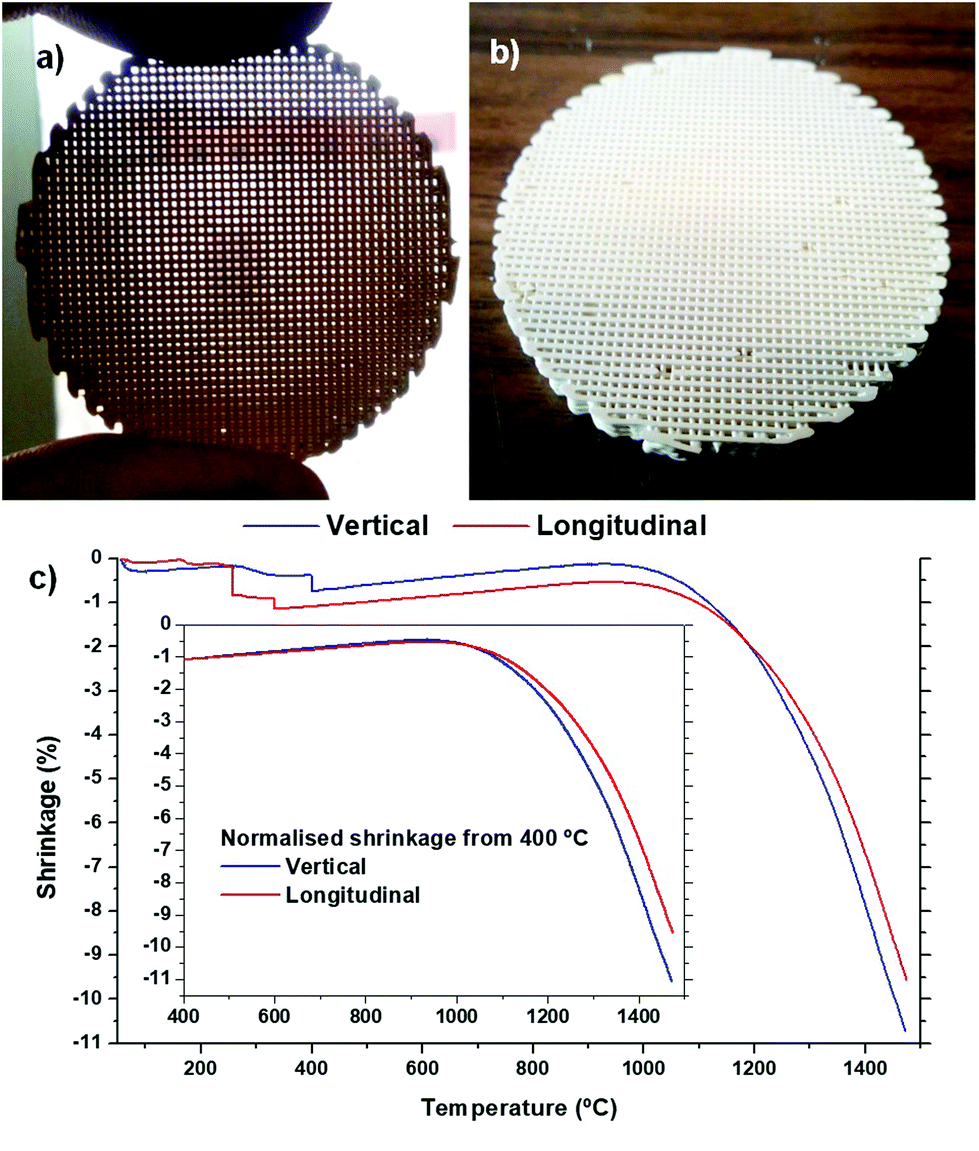 | ||
| Fig. 2 Photographs of the sintered robocast ceria scaffolds (a–b), and their shrinkage in the vertical and longitudinal directions with heating (c). | ||
The geometrical density of the green ceria scaffolds before sintering was 1.08 g cm−3, 15.0% of that of bulk ceria. The geometrical density of the ceria scaffolds after sintering at 1450 °C was 1.85 g cm−3, or 25.6% of that of bulk ceria, giving an increase in volume density of 71.3%. This indicated that as well as the shrinkage of the volume of the scaffolds, the ceria struts themselves had become significantly more dense, with probable loss of some meso- and microporosity. The density of the sintered ceria scaffolds indicated a scaffold macroporosity of around 75%.
As expected, XRD showed that the sintered scaffolds consisted of highly crystalline CeO2 with the cubic fluorite structure (Fig. 3a), matching JCPDS file 34-0394. SEM images show that the diameter of the struts had shrunk to ∼450 μm, with a noticeable narrowing to smaller diameters between the intersections where the struts cross (Fig. 3b). It was probably this increased densification between the intersections which led to the greater scaffold density than just linear shrinkage would allow for, and suggested that the struts will be more meso-/microporous near the intersections. This resulted in the formation of rhombohedral shaped voids in some cases, with dimensions up to 750 × 750 μm (Fig. 3a), larger than the intended 500 μm. The scaffold in Fig. 3 was polished on the surface, but the shrinkage does appear to be greater in the struts in lower layers. The internal microstructure can be seen in Fig. 3c, and it consists of poorly sintered submicron grains <0.5 μm in diameter, with an observable intergranular porosity. The surface of the struts was also poorly sintered (Fig. 3d), and appeared to be even more porous than the interior, although the grains were slightly larger on the exterior, up to 1 μm in diameter (Fig. 3e). The fact the surface and interior of the ceria scaffolds seems to be to some extent porous even when sintered at 1450 °C is a very promising feature for STFP applications, as it will allow the CO2 or H2O vapour to permeate into the scaffold material (inside the struts featuring submicron grains forming an interconnected macroporous network), and O2 to escape, during the solar-powered redox reactions.
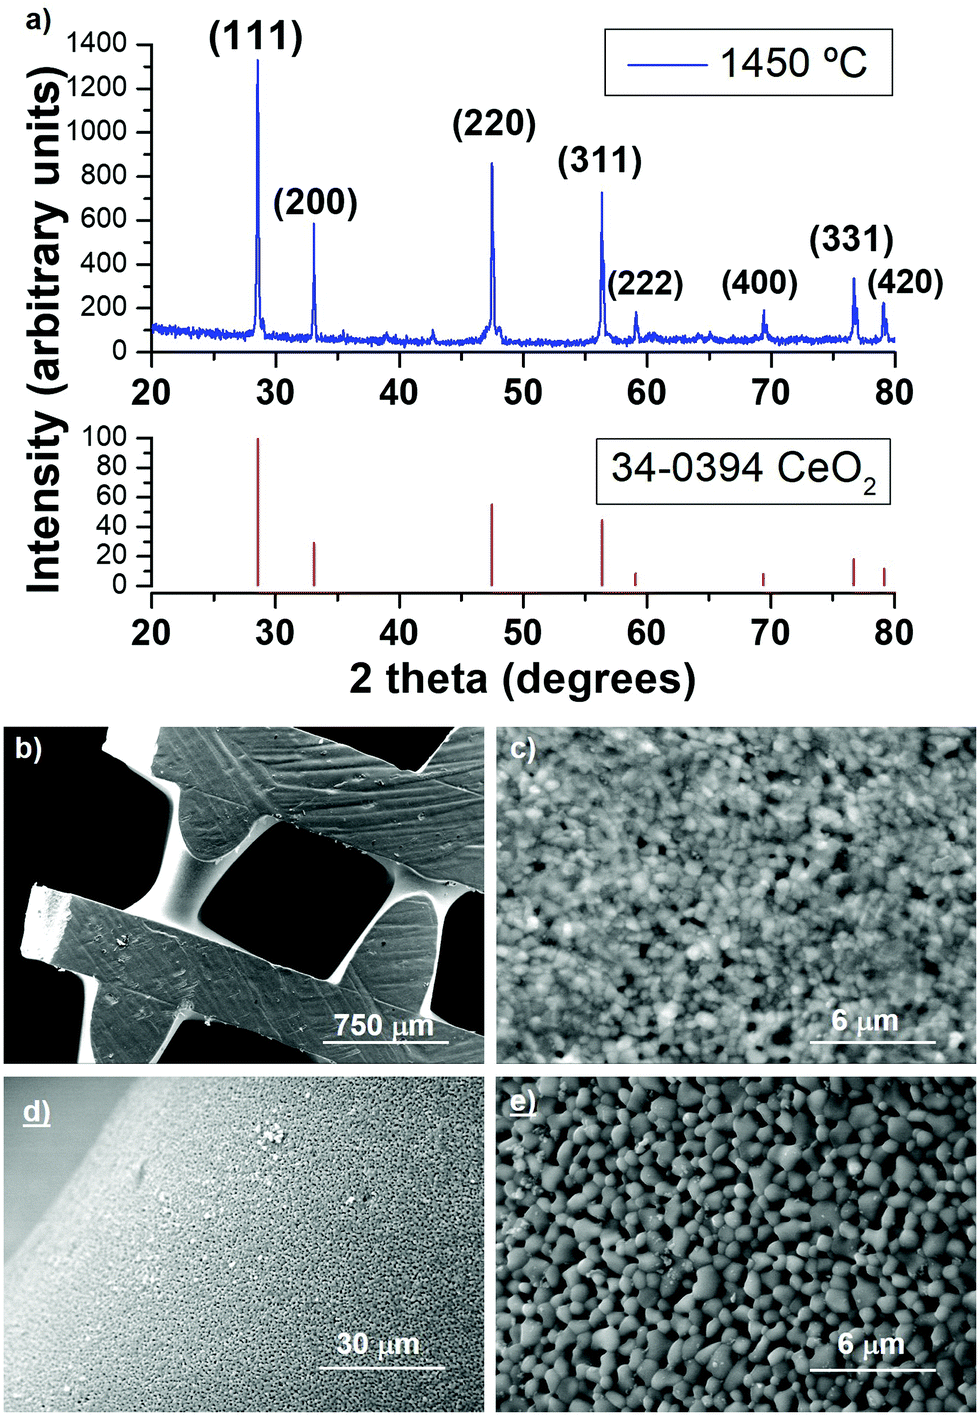 | ||
| Fig. 3 XRD pattern of the ceria scaffold sintered at 1450 °C, with the major peaks for cubic CeO2 indexed. SEM images of a sintered and polished scaffold (b) show the interior (c) and exterior (d–e) microstructure. | ||
The BET adsorption/desorption isotherm is shown in Fig. 4a, and is a type IV isotherm, indicating initial monolayer coverage, followed by multilayer coverage with the hysteresis loop suggesting that capillary condensation is taking place in mesopores (20–500 Å). The shape of the isotherm is H4, indicating particles with broad size distribution and with internal irregularly-shaped voids between them, and it is typically due to the filling of micropores and/or mesopores. The BET SSA was 1.58 m2 g−1, and the T-plot indicated that 1.29 m2 g−1 was external porosity and 0.29 m2 g−1 was due to internal microporosity (<20 Å). The BJH (Barrett, Joyner and Halenda) analysis of desorption and adsorption only accounts for meso- and macroporosity (>20 Å), and this gives an adsorption SSA of 1.14 m2 g−1 and a desorption SSA of 1.01 m2 g−1. The cumulative BJH pore area and pore volume plots are shown in Fig. 4b and c, along with details of the pore width intervals and average pore width value for each point. The overall average BJH pore size was 39.5 Å and 42.9 Å for adsorption and desorption, respectively, with most of the SSA coming from pores being in the 20–75 Å range (Fig. 4b). Larger pores contribute relatively much greater volume, so the pore volume distribution showed significant contribution from pores with width up to 250 Å, with average pore volumes of 0.001127 cm3 g−1 and 0.001079 cm3 g−1 from adsorption and desorption, respectively (Fig. 4c). Once again, this observed micro- and mesoporosity still existing in a material sintered at 1450 °C should be helpful to the STFP capabilities of the ceria scaffolds.
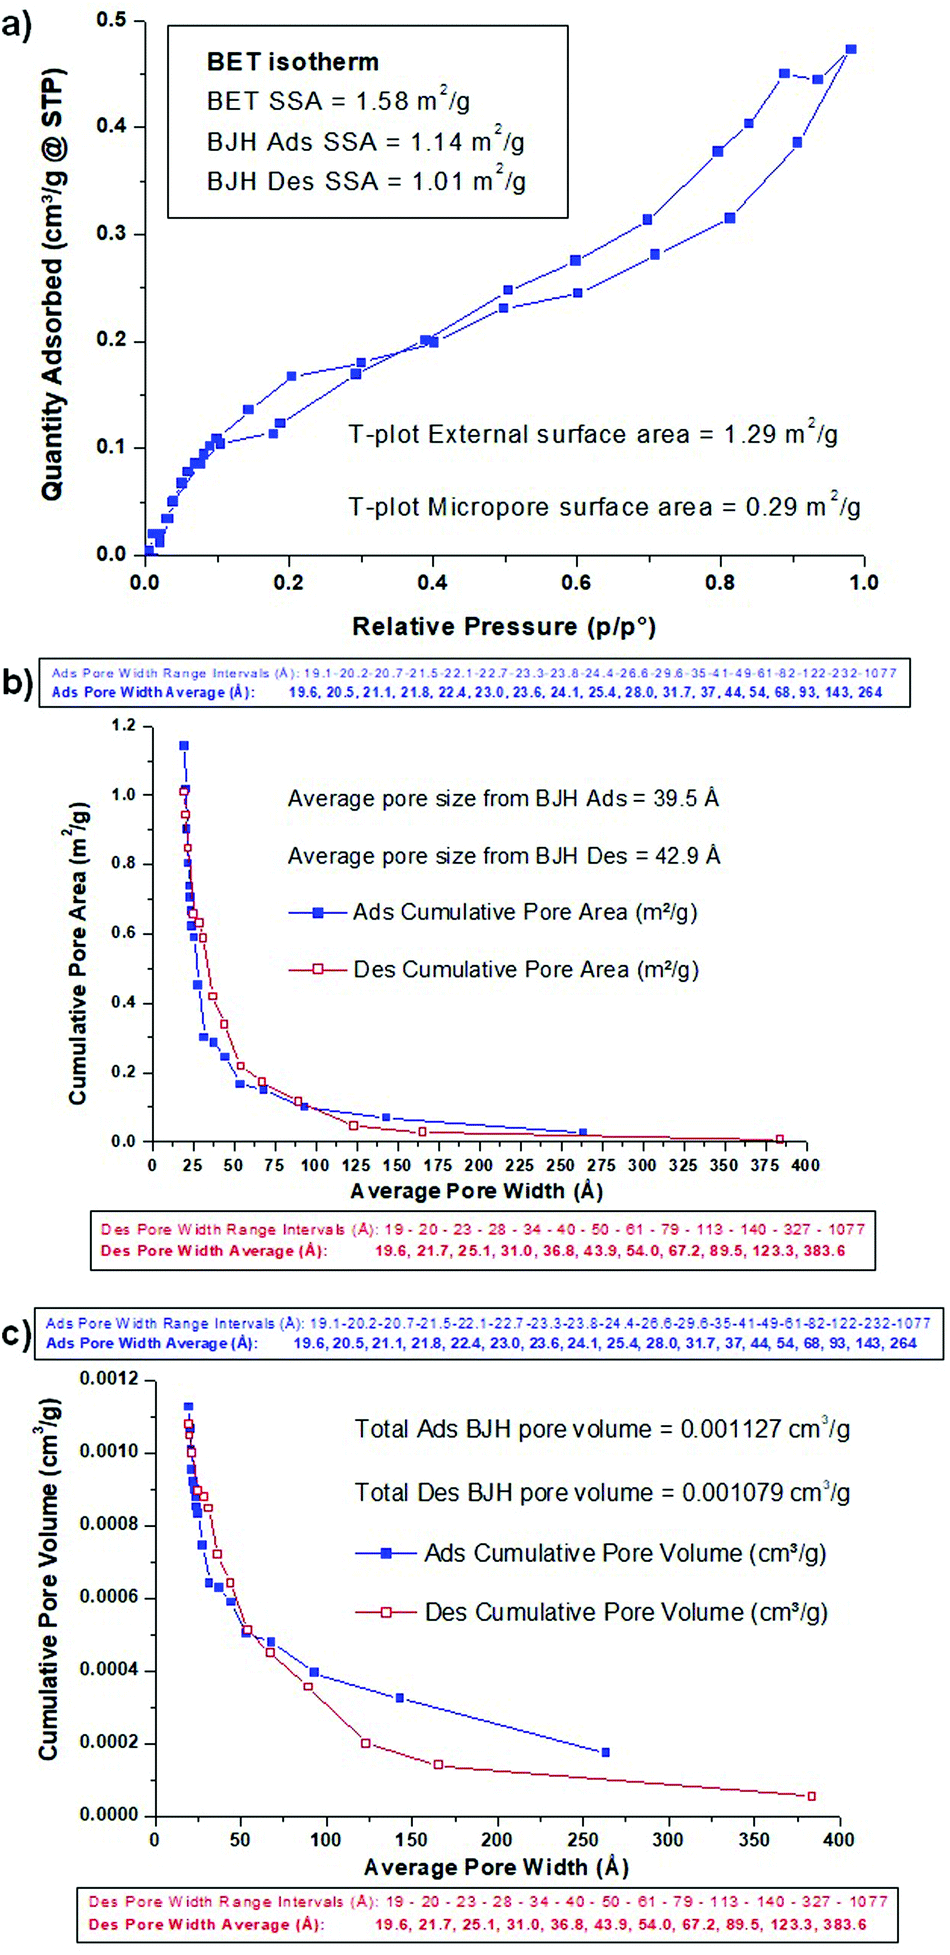 | ||
| Fig. 4 BET isotherm (a) and BJH cumulative pore area (b) and pore volume (c) plots for N2 adsorption/desorption on sintered ceria scaffolds. The boxes show the pore width range intervals and pore width average data point values for adsorption (blue) and desorption (red). | ||
Catalytic performance of the robocast ceria scaffold for the thermochemical production of CO from the splitting of CO2
The TGA measurements of the sintered ceria scaffold catalyst under thermochemical reaction conditions are shown in Fig. 5. The samples were heated to 1400 °C at 20 °C min−1 under Ar, and then put through two thermochemical cycles with the reduction step at 1400 °C per 45 min under Ar, heating/cooling at 20 °C min−1 under Ar, and the oxidation step at 1050 °C per 60 min under 50% CO2 in Ar. The entire process is shown in Fig. 5a, for a sample of the scaffold weighing 273.2 mg. The ceria began to reduce at ∼1050 °C, and in the first cycle it underwent a weight loss of 0.302 mg (0.111%) during the reduction step at 1400 °C, for a total O2 production of 35 μmol g−1 (0.784 ml g−1), which equates to a δ value (oxygen nonstoichiometry) of 0.012 for CeO2−δ. Upon cooling to 1050 °C there was a significant weight gain of ∼0.078 mg (0.029%) as the ceria partially re-oxidised, but with the injection of CO2 gas at 1050 °C there was an immediate and sudden weight gain over a few minutes for a total weight gain of 0.273 mg (0.100%). This was due to the ceria splitting some of the injected CO2 to re-oxidise, producing 63 μmol g−1 (1.411 ml g−1) of CO in this first oxidation step. In the second cycle the ceria underwent greater reduction in the high temperature step, losing 0.375 mg (0.138%) at 1400 °C, producing 43 μmol g−1 (0.963 ml g−1) of O2 (δ = 0.015). This is a commonly seen feature in these thermochemical cycles, with the ceria not becoming fully reduced in the first cycle, and requiring further cycles to stabilise.16 There was much less weight gain on cooling to 1050 °C in the second cycle, and when CO2 was injected for the oxidation step the weight gain was 0.342 mg (0.126%), with a CO yield of 78 μmol g−1 (1.747 ml g−1). These data are also summarised in Table 1.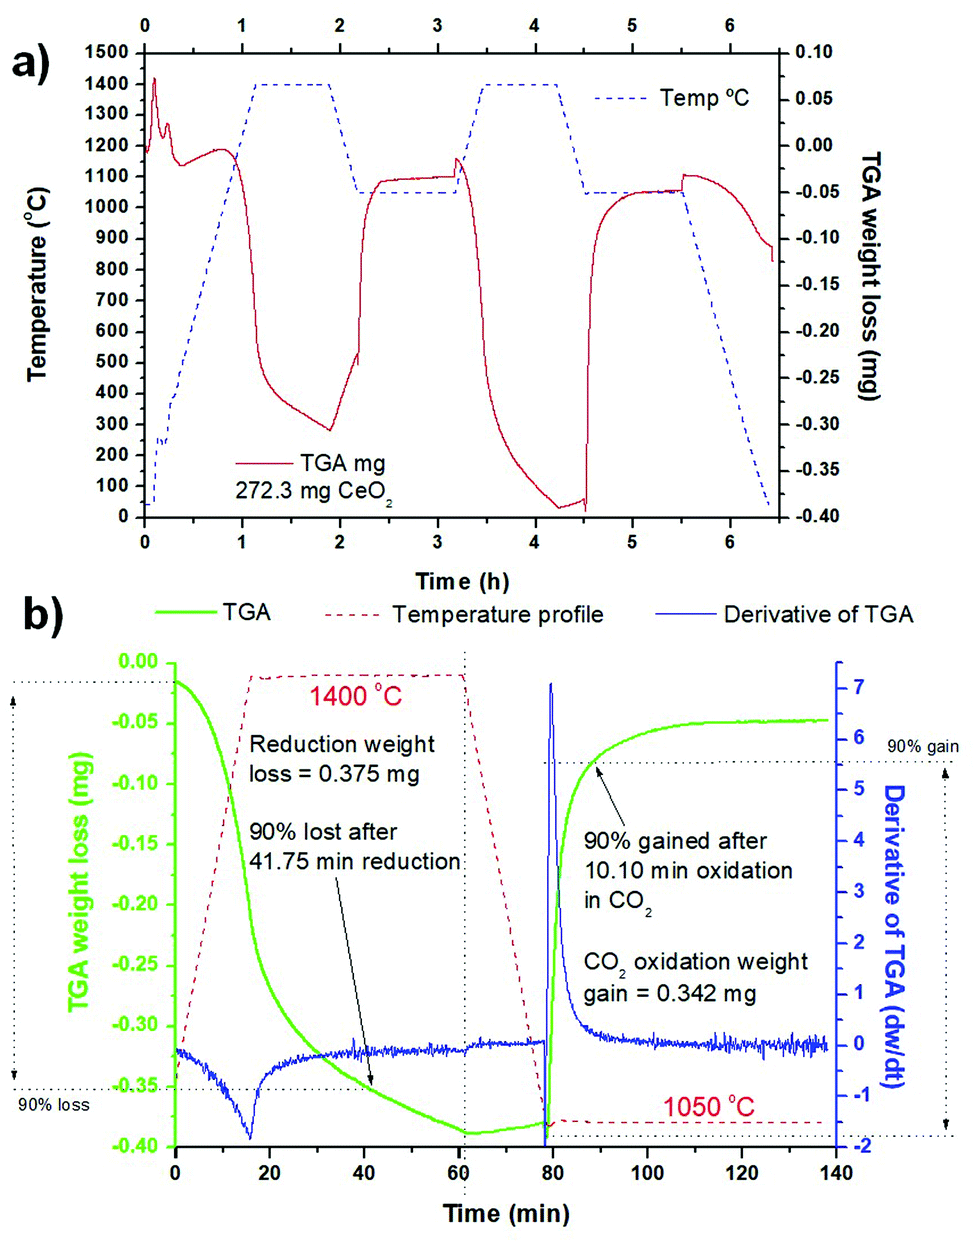 | ||
| Fig. 5 TGA plots of the redox capability of the sintered ceria scaffolds, with reduction during heating from 1050–1400 °C under Ar, and oxidation under CO2 at 1400 °C. Heating and cooling at 20 °C min−1 under Ar, dwell for 45 min at 1400 °C under Ar and for 60 min at 1400 °C under 50% CO2 in Ar. (a) Temperature profile and weight loss over time of a 273.3 mg ceria scaffold sample through two cycles. (b) Weight loss and derivative of weight loss for the second cycle – dotted lines indicate the interval to reach 90% of the maximum weight loss or gain in this cycle. | ||
| 273.2 mg sample | 1st cycle | 2nd cycle |
|---|---|---|
| Weight loss (mg) | 0.302 | 0.375 |
| Weight loss (%) | 0.111 | 0.138 |
| Weight gain (mg) | 0.273 | 0.342 |
| Weight gain (%) | 0.100 | 0.126 |
| O2 production (μmol g−1) | 35 | 43 |
| O2 production (ml g−1) | 0.784 | 0.963 |
| Peak O2 production (μmol g−1 s−1) | 0.0555 | 0.0574 |
| Peak O2 production (ml g−1 min−1) | 0.0746 | 0.0771 |
| Peak O2 production (mg min−1) | 0.029 | 0.030 |
| CO production (μmol g−1) | 63 | 78 |
| CO production (ml g−1) | 1.411 | 1.747 |
| Peak CO production (μmol g−1 s−1) | 0.2525 | 0.4361 |
| Peak CO production (ml g−1 min−1) | 0.3394 | 0.5861 |
| Peak CO production (mg min−1) | 0.066 | 0.114 |
| Peak O2 production temp (°C) | 1391 | 1394 |
| δ | 0.012 | 0.015 |
If the reduction/oxidation process is fully efficient the weight loss and weight gain should be equal, and the quantity of CO produced should be double that of the O2 released. In this case, we can see that in both cycles the oxidation was slightly incomplete (90.1% and 91.2%), and the ratio of CO:O2 was 1.80 and 1.81. The oxidation step was completed well before the end of the 60 min dwell, suggesting that it is the material morphology rather than any thermodynamic/kinetic factor that is limiting the 100% re-oxidation of the ceria.
It is also clear that the oxidation step is much more rapid than the reduction step for both cycles, and the derivative of mass change (dw/dt) is shown for the second cycle in Fig. 5b. In both cycles the reduction began as soon as the temperature increase began >1050 °C, and the peak of O2 production was actually achieved before the 1400 °C isothermal step was reached, at 1391 °C and 1394 °C in the first and second cycles. In the second, stabilised cycle, weight loss continued throughout the 45 min 1400 °C isothermal period, albeit at a lowered rate. The peak rates of O2 production were very similar, at 0.0555 μmol g−1 s−1 (0.029 mg min−1) and 0.0574 μmol g−1 s−1 (0.030 mg min−1), for the first and second cycles. 90% of the total weight loss was achieved after 41.75 min of the reduction step (Fig. 5b). On the other hand, the oxidation step is instantaneous and very rapid as soon as the CO2 is injected at 1050 °C, with a sudden peak in dw/dt. The peak CO production rates were 0.2525 μmol g−1 s−1 (0.066 mg min−1) and 0.4361 μmol g−1 s−1 (0.114 mg min−1) for the first and second cycles, more than 4.5 and 7.6 times greater than the peak O2 rates for those cycles, respectively. In the second cycle CO production is effectively over after 30 min of the oxidation step, and a 90% weight gain was achieved after only 10.10 min (Fig. 5b). This means that the oxidation step could be greatly reduced in duration, with savings in both energy and time.
Although there have been no reports on the use of sintered robocast ceria scaffolds before this, these data can be compared to other ceria STFP materials tested for CO2 splitting.14 The reduction/oxidation temperatures used are crucial, so comparison should only be made to results at similar redox temperatures of 1400 °C and ∼1000 °C. The total CO yields of 1.411 ml g−1 and 1.747 ml g−1 are lower than those reported for ceria powders (2.28 ml g−1)42 and cork derived (3.36 ml g−1)16 and pine-derived (2.1 ml g−1)43 3-DOM ecoceramics, and are comparable to those for reticulated ceria foams made by the replication method (1.68 ml g−1).16 However, the peak CO production rate in the second stabilised cycle of 0.5861 ml g−1 min−1 is an order of magnitude greater than that reported for the ceria powder (0.067 ml g−1 min−1),42 demonstrating the utility of these ordered scaffold structures. These values also compare well to the recently published results for ceria scaffolds made from coating sacrificial 3D printed polymer scaffolds with a ceria paste, which was then sintered at 1400 °C, when tested by TGA.34 Under identical reduction and oxidation conditions, these polymer-derived scaffolds produced slightly higher peak CO production rates of 0.64 and 0.72 ml g−1 min−1 in their first and second cycles, and CO yields of 93 and 100 μmol g−1. This was despite them having a much lower density of only 0.27 g cm−3 and significantly greater estimated macroporosity of 98%, compared to the values of 1.85 g cm−3 and scaffold porosity of 75% for the pure ceria robocast structures reported here, and suggest that the capability of these robocast ceria scaffolds could be significantly increased with further refinements of the scaffold structure to increase macroporosity. The peak fuel production rates are still significantly lower than those of the biomimetic ecoceramics or reticulated foams mentioned above, but again these results could be improved upon by either varying the dimensions of the struts and voids, or by incurring a level of hierarchical porosity within the struts of the ceria scaffold itself.
The relatively low δ values of 0.012–0.015 indicated that the ceria scaffold was not greatly reduced, for example being slightly lower compared to the ceria powder or cork ecoceramic.16,42 The reduction temperature of 1400 °C was chosen because it will be the nominal operation temperature of the solar reactor during actual STFP tests of these ceria scaffolds in the future. Although a higher reduction yield could be obtained at a higher temperature, the main issues would be linked to the reactant losses by sublimation and to constraints of thermal stability for the materials of the solar reactor and the reactive material itself. Furthermore, heat losses (especially radiative) are dramatically increased when increasing the reactor temperature, which in turn downgrades the solar-to-fuel energy conversion efficiency. For these reasons, measurements were not made at higher reduction temperatures.
Conclusions
50 mm diameter ceria scaffold discs were successfully fabricated by robocasting. Above 1050 °C, the shrinkage was not identical in longitudinal and vertical directions as the contact between the scaffold and the refractory support is not frictionless, tending to hinder shrinkage in the longitudinal direction, and because the gravity effect adds to the driving force exacerbating the shrinkage in the vertical direction. When heated up to 1475 °C ∼12% more total shrinkage occurs in the vertical direction (strut diameter). Sintered, but still porous (SSA = 1.58 m2 g−1), scaffolds were produced which consisted of highly crystalline CeO2 with the cubic fluorite structure. The ceria struts were shown to contain mesopores <75 Å, and have a micropore (<20 Å) surface area of 0.29 m2 g−1, after sintering. The size of the voids between the struts remained virtually unchanged at ∼500 μm, and the diameter of the struts shrank to ∼450 μm, with a noticeable narrowing to smaller diameters between the intersections where the struts cross. The fact that the surface and interior of the ceria scaffolds seems to be to some extent porous is a very promising feature for STFP applications, as the remaining porosity will allow the CO2 or H2O vapour to permeate into the scaffold material, and O2 to escape, during solar-powered redox reactions. The catalytic redox process was assessed by TGA for STFP applications, with reduction between 1050–1400 °C under Ar, and oxidation at 1050 °C under 50% CO2. The reduction was a slow process controlled by heat transfer rate, as is usually seen in ceria, needing ∼40 min to reach 90% of the maximum reduction. In contrast, CO production during oxidation was rapid, with a high peak CO production rate of 0.436 μmol g−1 s−1 (0.586 ml g−1 min−1) in the second stabilised cycle, ∼7.75 times quicker than the O2 production rate, for a total CO yield of 78 μmol g−1 (1.747 ml g−1) in the second cycle. 90% of the CO yield was obtained after just 10 min of oxidation. This CO yield compares well to reticulated ceria foams tested at similar temperatures, and the CO production rate is greatly superior to that obtained from ceria powders at the same temperatures. The total reduction yield achieved was low (δ = 0.01), and the oxidation was slightly uncomplete (90.1% and 91.2% in cycles 1 and 2), indicating that this material could be optimised and greatly improved by either varying the dimensions of the struts and voids, or by instilling a level of hierarchical porosity in the struts of the ceria scaffold.Conflicts of interest
There are no conflicts to declare.Author contributions
RCP: original concept; scaffold fabrication; XRD, SEM & BET measurement & analysis; interpretation of TGA data. BAEB-A: scaffold fabrication. IMMS: advice and laboratory facilities. JMFF: robocasting facilities and scaffold fabrication advice. SA: TGA and thermochemical cycle measurements and data analysis.Acknowledgements
R. C. Pullar wishes to thank the FCT ((Fundação para a Ciência e a Tecnologia, Portugal) Grant IF/00681/2015 for supporting this work. B. A. E. Ben-Arfa thanks FCT project H2CORK (PTDC/CTM-ENE/6762/2014) for supporting him during this work. This work was developed within the scope of the project CICECO-Aveiro Institute of Materials, UIDB/50011/2020 & UIDP/50011/2020, financed by national funds through the FCT/MEC and when appropriate co-financed by FEDER under the PT2020 Partnership AgreementReferences
- N. Knoblauch, H. Simon and M. Schmücker, Solid State Ionics, 2017, 301, 43–52 CrossRef CAS.
- R. J. Carrillo and J. R. Scheffe, Sol. Energy, 2017, 156, 3–20 CrossRef CAS.
- N. V. Skorodumova, S. I. Simak, B. I. Lundqvist, I. A. Abrikosov and B. Johansson, Phys. Rev. Lett., 2002, 89, 166601 CrossRef CAS PubMed.
- N. P. Siegel, J. E. Miller, I. Ermanoski, R. B. Diver and E. B. Stechel, Ind. Eng. Chem. Res., 2002, 52, 3276–3286 CrossRef.
- S. Ackermann, J. R. Scheffe and A. Steinfeld, J. Phys. Chem. C, 2014, 118, 5216–5225 CrossRef CAS.
- M. Mogensen, N. M. Sammes and G. A. Tompsett, Solid State Ionics, 2000, 129, 63–94 CrossRef CAS.
- W. C. Chueh and S. M. Haile, Philos. Trans. R. Soc., A, 2010, 368, 3269–3294 CrossRef CAS PubMed.
- E. Koepf, I. Alxneit, C. Wieckert and A. Meier, Appl. Energy, 2017, 188, 620–651 CrossRef CAS.
- C. Graves, S. D. Ebbesen, M. Mogensen and K. S. Lackner, Renewable Sustainable Energy Rev., 2011, 15, 1–23 CrossRef CAS.
- S. Abanades and G. Flamant, Sol. Energy, 2006, 80, 1611–1623 CrossRef CAS.
- W. C. Chueh, C. Falter, M. Abbott, D. Scipio, P. Furler, S. M. Haile and A. Steinfeld, Science, 2010, 330, 1797–1801 CrossRef CAS PubMed.
- S. Haussener and A. Steinfeld, Conference Proceedings 2010 AIChE Annual Meeting, 10AIChE, Salt Lake City, UT, United States, 7–12 November 2010, Code 83459, ISBN: 978-081691065-6.
- S. Haussener and A. Steinfeld, Materials, 2012, 5, 192–209 CrossRef CAS PubMed.
- R. C. Pullar, R. M. Novais, A. P. F. Caetano, M. A. Barreiros, S. Abanades and F. A. C. Oliveira, Front. Chem., 2019, 7, 601 CrossRef CAS PubMed.
- P. Furler, J. Scheffe, D. Marxer, M. Gorbar, A. Bonk, U. Vogt and A. Steinfeld, Phys. Chem. Chem. Phys., 2014, 16, 10503–10511 RSC.
- F. A. C. Oliveira, M. A. Barreiros, S. Abanades, A. P. F. Caetano, R. M. Novais and R. C. Pullar, J. CO2 Util., 2018, 26, 552–563 CrossRef.
- A. Haeussler, S. Abanades, F. A. C. Oliveira, M. A. Barreiros, A. P. F. Caetano, R. M. Novais and R. C. Pullar, Energy Fuels, 2020, 34, 9037–9049 CrossRef CAS.
- F. A. C. Oliveira, M. A. Barreiros, A. Haeussler, A. P. F. Caetano, A. I. Mouquinho, P. M, O. e. Silva, R. M. Novais, R. C. Pullar and S. Abanades, Sustainable Energy Fuels, 2020, 4, 3077–3089 RSC.
- B. A. E. Ben-Arfa, A. S. Neto, I. E. Palamá, I. M. Miranda Salvado, R. C. Pullar and J. M. F. Ferreira, J. Eur. Ceram. Soc., 2019, 39, 1625–1634 CrossRef CAS.
- X. Zhao, M. S. Mason, T. Huang, M. C. Leu, R. G. Landers, G. E. Hilmas, S. J. Easley and M. W. Hayes, 18th Solid Freeform Fabrication Symposium, SFF 2007, 2007, pp. 135–146 Search PubMed.
- U. Kaufmann, U. Harrysson, P. Johander and W. Bauer, Ind. Ceram., 2008, 28, 45–51 CAS.
- M. Schwentenwein and L. Homa, Int. J. Appl. Ceram. Technol., 2015, 12, 1–7 CrossRef CAS.
- C. Polzin, D. Günther and H. Seitz, J. Ceram. Sci. Technol., 2015, 6, 141–146 Search PubMed.
- N. C. Fan, Y. Y. Chen, K. Y. Chen, W. C. Wei, B. H. Liu, A. B. Wang and R. C. Luo, J. Ceram. Process. Res., 2017, 18, 676–682 Search PubMed.
- T. Schlordt, F. Keppner, N. Travitzky and P. Greil, J. Ceram. Sci. Technol., 2012, 3, 81–88 Search PubMed.
- T. Schlordt, S. Schwanke, F. Keppner, T. Fey, N. Travitzky and P. Greil, J. Eur. Ceram. Soc., 2013, 33, 3243–3248 CrossRef CAS.
- E. Feilden, E. García-Tuñón Blanca, F. Giuliani, E. Saiz and L. Vandeperre, J. Eur. Ceram. Soc., 2016, 36, 2525–2533 CrossRef CAS.
- Z. Fu, M. Freihart, L. Wahl, T. Fey, P. Greil and N. Travitzky, J. Eur. Ceram. Soc., 2017, 37, 3115–3124 CrossRef CAS.
- A.-M. Stanciuc, C. M. Sprecher, J. Adrien, L. I. Roiban, M. Alini, L. Gremillard and M. Peroglio, J. Eur. Ceram. Soc., 2018, 38, 845–853 CrossRef CAS.
- Z. Feng, L. Liu, L. Li, J. Chen, Y. Liu, Y. Li, L. Hao and Y. Wu, Int. J. Hydrogen Energy, 2019, 44, 13843–13851 CrossRef CAS.
- L. Goyos-Ball, E. García-Tuñón, E. Fernández-García, R. Díaz, A. Fernández, C. Prado, E. Saiz and R. Torrecillas, J. Eur. Ceram. Soc., 2017, 37, 3151–3158 CrossRef CAS.
- H. Wu, W. Liu, L. Lin, Y. Li, Z. Tian, G. Nie, D. An, H. Li, C. Wang, Z. Xie and S. Wu, Mater. Chem. Phys., 2020, 239, 122069 CrossRef CAS.
- M. Hoes, S. Ackermann, D. Theiler, P. Furler and A. Steinfeld, Energy Technol., 2019, 7, 1900484 CrossRef.
- A. Haeussler and S. Abanades, Chem. Eng. Sci., 2021, 246, 116999 CrossRef CAS.
- J. Choi, P. J. H. Kim, J. Seo, J. Kwon, S. Lee and T. Song, Adv. Eng. Mater., 2018, 20, 1700901 CrossRef.
- S. Morales-Planas, A. Calleja, V. R. Vlad, J. Oró-Solé, J. Minguella-Canela and J. Farjas, Thin Solid Films, 2019, 685, 75–80 CrossRef CAS.
- C. Y. Chaparro-Garnica, A. Davó-Quiñonero, E. Bailón-García, D. Lozano-Castelló and A. Bueno-López, ACS Appl. Mater. Interfaces, 2019, 11, 36763–36773 CrossRef CAS PubMed.
- F. Agueniou, H. Vida, J. de Dios López, J. C. Hernández-Garrido, M. A. Cauqui, F. J. Botana, J. J. Calvino, V. V. Galvita and J. M. Gatica, Catal. Commun., 2021, 141, 106181 CrossRef.
- V. Middelkoop, T. Slater, M. Florea, F. Neaţu, S. Danaci, V. Onyenkeadi, K. Boonen, B. Saha, I.-A. Baragau and S. Kellici, J. Cleaner Prod., 2019, 214, 606–614 CrossRef CAS.
- X. Zhang, Y. Zhang, Y. Lu, S. Zhang and J. Yang, J. Eur. Ceram. Soc., 2020, 40, 4366–4372 CrossRef CAS.
- I. Lucentini, I. Serrano, L. Soler, N. J. Divins and J. Llorca, Appl. Catal., A, 2020, 591, 117382 CrossRef CAS.
- A. Le Gal, S. Abanades and G. Flamant, Energy Fuels, 2011, 25, 4836–4845 CrossRef CAS.
- C. D. Malonzo, R. M. De Smith, S. G. Rudisill, N. D. Petkovich, J. H. Davidson and A. Stein, J. Phys. Chem. C, 2014, 118, 26172–26181 CrossRef CAS.
| This journal is © The Royal Society of Chemistry 2022 |