Reversible assembly of silica nanoparticles at water–hydrocarbon interfaces controlled by SDS surfactant†
Sohaib
Mohammed
 a,
Ivan
Kuzmenko
b and
Greeshma
Gadikota
 *a
*a
aSchool of Civil and Environmental Engineering, Cornell University, Ithaca, New York 14853, USA. E-mail: gg464@cornell.edu; Tel: +1 607-255-4796
bAdvanced Photon Source, Argonne National Laboratory, Lemont, Illinois 60439, USA
First published on 29th November 2021
Abstract
Achieving reversible and tunable assembly of silica nanoparticles at liquid–liquid interfaces is vital for a wide range of scientific and technological applications including sustainable subsurface energy applications, catalysis, drug delivery and material synthesis. In this study, we report the mechanisms controlling the assembly of silica nanoparticles (dia. 50 nm and 100 nm) at water–heptane and water–toluene interfaces using sodium dodecyl sulfate (SDS) surfactant with concentrations ranging from 0.001–0.1 wt% using operando ultrasmall/small-angle X-ray scattering, cryogenic scanning electron microscopy imaging and classical molecular dynamics simulations. The results show that the assembly of silica nanoparticles at water–hydrocarbon interfaces can be tuned by controlling the concentrations of SDS. Silica nanoparticles are found to: (a) dominate the interfaces in the absence of interfacial SDS molecules, (b) coexist with SDS at the interfaces at low surfactant concentration of 0.001 wt% and (c) migrate toward the aqueous phase at a high SDS concentration of 0.1 wt%. Energetic analyses suggest that the van der Waals and electrostatic interactions between silica nanoparticles and SDS surfactants increase with SDS concentration. However, the favorable van der Waals and electrostatic interactions between the silica nanoparticles and toluene or heptane decrease with increasing SDS concentration. As a result, the silica nanoparticles migrate away from the water–hydrocarbon interface and towards bulk water at higher SDS concentrations. These calibrated investigations reveal the mechanistic basis for tuning silica nanoparticle assembly at complex interfaces.
1. Introduction
Achieving tunable controls on the dispersion behavior of silica nanoparticles in water and hydrocarbon-bearing environments is crucial for probing their migration, precipitation and scaling behavior for emerging sustainable subsurface energy applications including CO2 storage in hydrocarbon-bearing reservoirs. The changes in the porosity and permeability in subsurface geologic environments resulting from the migration, aggregation and precipitation of fine siliceous matter remain largely unexplored in the context of harnessing reservoirs for fluid storage and recovery. While the adsorption of surfactants on mineral or rock surfaces is known to be influenced by nanoparticles,1,2 the mechanisms underlying surfactant-induced assembly of silica nanoparticles at water–hydrocarbon interfaces remain less explored. The ability to tune interfacial tension for coalescing and stabilizing oil-in-water emulsions is crucial for energy efficient water–hydrocarbon separations. Despite the presence of suspended silica nanoparticles in natural aqueous environments,3 their influence on stabilizing oil-in-water emulsions has not been studied.Furthermore, advances in the use of engineered silica nanoparticles to architect new matter for applications related to catalysis,4,5 drug delivery,6,7 materials synthesis,8,9 separation,10,11 sensors,12 adsorption,13 enhanced oil recovery14 and food processing15 motivate us to develop mechanistic insights into the assembly of silica nanoparticles at complex fluidic interfaces. For example, Pickering emulsions have been used as polymerization vessels for preparing hollow microcapsules and composites capsules.16 These materials are widely used in food, pharmaceutical and cosmetic products. Advancing fundamental insights into the interfacial behavior and the energetic interactions underlying the organization of silica nanoparticles and surfactants at complex interfaces is crucial for synthesizing novel materials. With this context, the following questions are addressed in this study: (i) What is the influence of surfactant concentrations on the organization or displacement of silica nanoparticles at water–hydrocarbon interfaces? (ii) How does the interfacial behavior of surfactants and silica nanoparticles evolve with the size of nanoparticles? (iii) What are the energetic interactions underlying the organization or displacement of silica nanoparticles away from water–hydrocarbon interfaces?
Prior experimental and computational studies utilized various techniques, including Pendant drop tensiometer and molecular dynamics simulations17–22 to probe the interfacial behavior of surfactants and nanoparticles at various water–hydrocarbon interfaces. While some studies concluded that the synergetic interactions of nanoparticles and surfactants on the interface enhance emulsion stability,22–27 others reported that the surfactant concentrations higher than the critical micelle concentration (CMC) leads to the displacement of the nanoparticles from the interface.28,29 Although it is poorly understood, the mechanism governing the displacement of nanoparticles from the interface is related to the interfacial tension of the associated emulsion and the contact angle between the nanoparticles and the liquid phases.17
The energy required to displace a nanoparticle from the interface can be quantified as E = πr2γOW(1 ± cos![[thin space (1/6-em)]](https://www.rsc.org/images/entities/char_2009.gif) φ)2 where r is the radius of the nanoparticle, γOW is the interfacial tension of the oil-water emulsion, and φ is the contact angle of the adsorbed nanoparticles at the interface.30 The extent to which the nanoparticles adsorb at the interface depends on the wettability of these nanoparticles. Nanoparticles with highly hydrophilic or hydrophobic surfaces tend to disperse in water or hydrocarbon phases, respectively. According to the equation above, the maximum energy required to displace a nanoparticle from the interface is at a contact angle of 90°. The synergetic interactions of surfactants and nanoparticles on the interface can alter the wetting properties of the assembled nanoparticles and eventually enhance or inhibit the assembly of nanoparticles on the interface. Vashisth and co-workers29 showed that adding high surfactant concentrations can completely disrupt the assembly of nanoparticles from the interface because the presence of the surfactant at the water–oil interface is energetically favored compared to nanoparticles. This displacement was also attributed to the influence of the added surfactants on the nanoparticle's contact angle at the interface,31,32 the extent of nanoparticles flocculation,33,34 the dynamics of nanoparticles at the interface35 and the competitive assembly of surfactant molecules at the interface.36 Resolving the synergetic effects of surfactant and nanoparticles enables us to tune the self-assembly behavior of nanoparticles at water–hydrocarbon interfaces in addition to the ability to control the interfacial properties of the associated emulsion including the coalescence of small drops into larger drops that facilitate the separation of water and oil phases.
φ)2 where r is the radius of the nanoparticle, γOW is the interfacial tension of the oil-water emulsion, and φ is the contact angle of the adsorbed nanoparticles at the interface.30 The extent to which the nanoparticles adsorb at the interface depends on the wettability of these nanoparticles. Nanoparticles with highly hydrophilic or hydrophobic surfaces tend to disperse in water or hydrocarbon phases, respectively. According to the equation above, the maximum energy required to displace a nanoparticle from the interface is at a contact angle of 90°. The synergetic interactions of surfactants and nanoparticles on the interface can alter the wetting properties of the assembled nanoparticles and eventually enhance or inhibit the assembly of nanoparticles on the interface. Vashisth and co-workers29 showed that adding high surfactant concentrations can completely disrupt the assembly of nanoparticles from the interface because the presence of the surfactant at the water–oil interface is energetically favored compared to nanoparticles. This displacement was also attributed to the influence of the added surfactants on the nanoparticle's contact angle at the interface,31,32 the extent of nanoparticles flocculation,33,34 the dynamics of nanoparticles at the interface35 and the competitive assembly of surfactant molecules at the interface.36 Resolving the synergetic effects of surfactant and nanoparticles enables us to tune the self-assembly behavior of nanoparticles at water–hydrocarbon interfaces in addition to the ability to control the interfacial properties of the associated emulsion including the coalescence of small drops into larger drops that facilitate the separation of water and oil phases.
In this study, we introduce an experimental and computational approach to elucidate the interfacial behavior underlying the co-existence of silica nanoparticles with diameters of 50 nm and 100 nm and sodium dodecyl sulfate (SDS) concentrations ranging from 0.001–0.1% at water–heptane and water–toluene interfaces. Ultrasmall- and Small-Angle X-Ray Scattering (USAXS/SAXS) measurements, Cryogenic Scanning Electron Microscopy (Cryo-SEM) imaging, and Molecular Dynamics (MD) simulations are harnessed to probe the coexistence of hydrophilic silica nanoparticles and SDS molecules on the interfaces and their influence on the interfacial properties of the studied emulsions. The interfacial behavior of the silica nanoparticles is investigated at SDS concentrations of 0.001, 0.01 and 0.1 wt%. The experiments and simulations are performed at 1 bar and 298 K. This experimental and simulation approach enables us to develop fundamental insights into the structure, dynamics and morphology of nanoparticles and surfactant assembled at water–hydrocarbon interfaces across spatial and temporal scales.
2. Methodology
2.1. Sample preparation
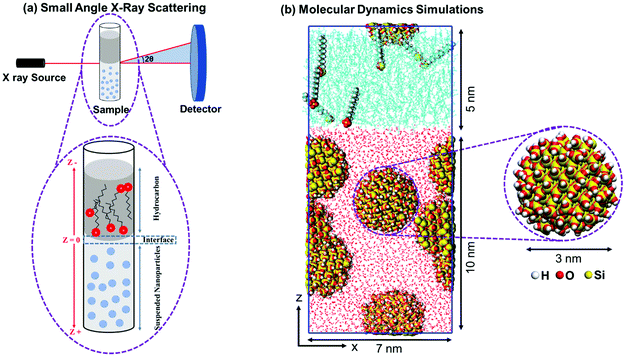
Silica nanoparticles with diameters of 50 nm and 100 nm dispersed in Milli-Q water with a concentration of 10 mg ml−1 (1 wt%) purchased from nanoComposix, Inc. are used. The sizes and the dispersion states of the nanoparticles are confirmed by measuring the USAXS/SAXS intensities of the solutions bearing nanoparticles prior to the preparation of the emulsions. The average size of the well dispersed nanoparticles is confirmed to be 51.35 ± 3.15 nm and 101.35 ± 4.17 nm using USAXS/SAXS measurements.37 The suspensions of 50 nm and 100 nm nanoparticles have a pH of 9.7 and 7.4, respectively. ζ potential of the 50 nm and 100 nm nanoparticles suspensions are −51 mV and −59 mV, respectively. SDS surfactant are purchased from Sigma-Aldrich and used without further treatment. SDS powder is dissolved in high purity (99.9%) heptane and toluene solvents to produce solutions with SDS concentrations of 0.001 wt%, 0.01 wt%, and 0.1 wt%. The SDS solutions are stirred at 800 rpm under 298 K for 2 hours to ensure complete dissolution of the added surfactant. The water–heptane and water–toluene interfaces are prepared by injecting 50 μl of the nanoparticles’ suspensions followed by 50 μl of the SDS solutions in a glass vial with a diameter of about 1 mm (see Fig. 1(a)). The emulsions were left undisturbed at 298 K for 24 hours prior to characterization.2.2. Ultra-small/small angle X-ray scattering (USAXS/SAXS) measurements
The assembly of silica nanoparticles and surfactant at the water–hydrocarbon interfaces are determined using Ultra-Small/Small Angle X-Ray Scattering (USAXS/SAXS) measurements. These measurements are performed by detecting the scattered X-ray beam from the interfaces of the water–hydrocarbon emulsions on a 2D detector (see Fig. 1(a)). The experiments are conducted at sector 9-ID-C in the Advanced Photon Source (APS) at Argonne National Laboratory.38,39 The total X-ray flux is 1013 photon/mm2s. The energy of the incident X-ray beam during the measurement is 21.0 keV that corresponds to a wavelength of 0.589 Å. The scattered USAXS data are collected using a Bonse-Hart camera and the scattered SAXS data are acquired using a pinhole camera on a Pilatus 100 K detector (Dectris Ltd, Baden Switzerland). The data acquisition times for the USAXS and SAXS measurements are 90 and 5 s, respectively. The 2D data are reduced and converted to 1D curves using the Nika (SAXS)40 and Irena (USAXS)41 macros implemented in Igor software. The background scattering from the interfaces of water–heptane and water–toluene interfaces free of surfactants and nanoparticles are collected and subtracted from the scattering data. The wavevector (Q) values (where Q = (4π/λ) sin![[thin space (1/6-em)]](https://www.rsc.org/images/entities/char_2009.gif) θ, λ is the X-ray wavelength, and θ is one half of the scattering angle) and sample-to-detector distances (and geometry) are calibrated using silver behenate. Additional information about the X-ray scattering measurements is included in a prior publication by Mohammed and co-workers.37
θ, λ is the X-ray wavelength, and θ is one half of the scattering angle) and sample-to-detector distances (and geometry) are calibrated using silver behenate. Additional information about the X-ray scattering measurements is included in a prior publication by Mohammed and co-workers.37
2.3. Cryogenic scanning electron microscopy (Cryo-SEM)
Cryo-SEM imaging is performed using the FEI Strata 400S DualBeam instrument at the Cornell Center for Materials Research (CCMR) for high-resolution and high-contrast imaging. The prepared emulsions are frozen using liquid nitrogen to avoid changes in the interfacial structure of the nanoparticles and surfactants. The freezing time of the studied emulsions is in the order of milliseconds. Different regions at the water–heptane and water–toluene interfaces and in the bulk water phase are imaged to visualize the morphology of nanoparticles at various SDS concentrations.2.4. Molecular dynamics simulations
Silica nanoparticle with a diameter of 3 nm is cleaved from a well-studied and validated β-cristobalite unit cell. The size of the simulated nanoparticles is chosen for three main reasons: (a) the ease of modifying the surface chemistry of these nanoparticles to reflect the density of hydroxyl (OH) groups on the surface of the silica nanoparticles used in the experiment, (b) using 3 nm sized nanoparticles allows us to use a concentration of 10 mg ml−1 (5 nanoparticles) in reasonably large simulation cells and (c) using 3 nm sized silica nanoparticles enables us to conduct the simulations for reasonably sufficient simulation time (50 ns) to reach equilibrated states and draw reliable conclusions. Further, simulating larger sized nanoparticles requires adopting other simulation techniques such as coarse-grained molecular dynamics (GCMD) and dissipative particles dynamics (DPD) in which the atomic scale description of molecules is not considered. For example, Yu and Zhou42 utilized CGMD to understand the curvature effect of silica nanoparticles with diameters of 2 to 10 nm on the adsorption of lysozyme enzyme. Although the size of silica nanoparticles used in the simulation is smaller than the nanoparticles used in the experiments, the interfacial behavior and trends in the energetic interactions can be accurately predicted.The nonbridging surface oxygens on the nanoparticle's surface are functionalized with OH groups with a surface density of about 7.3 OH nm−2. The rationale behind choosing this level of hydroxylation is driven by the chemistry of the nanoparticles used in the experiments which are dominated by silanol groups (Si–OH) on the surface and the typical density of OH groups on the silica surfaces used in previous studies.43–45 Further, our reactive molecular dynamics simulations (ReaxFF) shows that nonbridging oxygens on the surface of 3 nm sized silica nanoparticles undergo continuous hydroxylation when dissolved in 1 g cm−3 of water at 298 K and 1 bar (see Fig. S1 and S2†).
Five silica nanoparticles are randomly distributed in a 7 nm × 7 nm × 10 nm cell with a concentration of 1 wt% to match the experimental concentration of the silica nanoparticles suspensions. The simulation cell is extended in the z-direction by 5 nm and SDS–heptane and SDS–toluene mixtures are added with surfactant concentrations of 0 wt%, 0.001 wt%, 0.01 wt%, and 0.1 wt% (see Fig. 1(b)). The dimensions of the initial simulation cells are 7 nm × 7 nm × 15 nm in x, y and z directions, respectively. Periodic boundary conditions are used in the x, y and z directions.
Silica nanoparticles and water molecules are modeled using parameters from CLAYFF46 and TIP4P,47 respectively, while heptane, toluene and SDS molecules are modeled using the OPLS/AA forcefield48,49 (see the forcefield parameters in Table S1†). The combination of OPLS/AA and CLAYFF forcefields have been used extensively in investigating the interactions of hydrocarbons and surfactants with silica surfaces.50–52 50![[thin space (1/6-em)]](https://www.rsc.org/images/entities/char_2009.gif) 000 steps of energy minimization using “steepest descent” method are performed on the initial configurations to decrease their high energy and remove the inappropriate geometries. The minimized configurations underwent semi-isotropic compression in z-direction, the direction normal to the interface for 50 ns using the constant number of molecules, constant pressure, constant interfacial area, and constant temperature (NPAT) ensemble. The simulations are performed at 1 bar and 298 K to be consistent with the experimental conditions. Nose–Hoover thermostat53,54 with a relaxation time of 1 ps and Parrinello–Rahman barostat55 are used to maintain the required temperature and pressure. The equation of motion is integrated using the leapfrog algorithm with a time step of 1 fs. The short-range interactions are calculated within a cutoff of 1.4 nm, while the long-range electrostatic interactions are treated using Particle Mesh Ewald (PME).56 The nonbonded van der Waals and electrostatic interactions are modeled using 12-6 Lennard-Jones and coulombic models, respectively. The bonded interactions account for bonds stretching, angles bending and dihedrals, except for silica nanoparticles where only OH bond stretching are accounted for. All the simulations are conducted using GROningen Machine for Chemical Simulations (GROMACS 2018) simulation package.57
000 steps of energy minimization using “steepest descent” method are performed on the initial configurations to decrease their high energy and remove the inappropriate geometries. The minimized configurations underwent semi-isotropic compression in z-direction, the direction normal to the interface for 50 ns using the constant number of molecules, constant pressure, constant interfacial area, and constant temperature (NPAT) ensemble. The simulations are performed at 1 bar and 298 K to be consistent with the experimental conditions. Nose–Hoover thermostat53,54 with a relaxation time of 1 ps and Parrinello–Rahman barostat55 are used to maintain the required temperature and pressure. The equation of motion is integrated using the leapfrog algorithm with a time step of 1 fs. The short-range interactions are calculated within a cutoff of 1.4 nm, while the long-range electrostatic interactions are treated using Particle Mesh Ewald (PME).56 The nonbonded van der Waals and electrostatic interactions are modeled using 12-6 Lennard-Jones and coulombic models, respectively. The bonded interactions account for bonds stretching, angles bending and dihedrals, except for silica nanoparticles where only OH bond stretching are accounted for. All the simulations are conducted using GROningen Machine for Chemical Simulations (GROMACS 2018) simulation package.57
3. Results and discussion
3.1. Assembly of nanoparticles and SDS on the interfaces
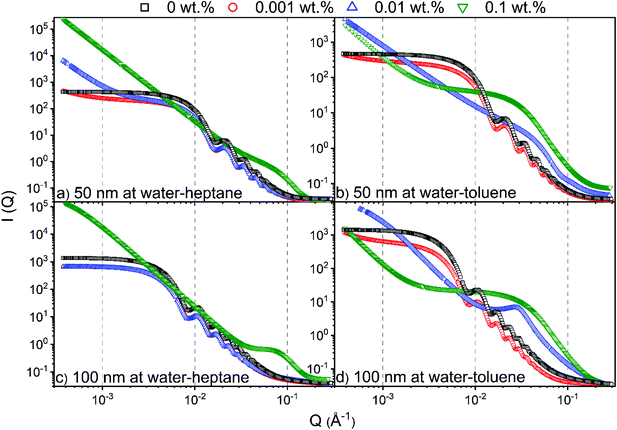
The assembly of silica nanoparticles and SDS molecules on water–heptane and water–toluene interfaces is evident from the USAXS/SAXS intensity curves (see Fig. 2). At 0 wt% SDS, the scattering curves suggest that water–heptane and water–toluene interfaces are dominated by 50 nm and 100 nm silica nanoparticles as the intensities shows a scattering pattern that corresponds to that of spherical nanoparticles. The assembly behavior of silica nanoparticles with comparable sizes at water–heptane and water–toluene interfaces under similar conditions are evident from prior experimental and computational studies.37,58 The scattering behavior from the interfacial silica nanoparticles is observed in the presence of 0.001 wt% SDS concentrations, suggesting the coexistence of nanoparticles and surfactant on water–heptane and water–toluene interfaces. Interestingly, as SDS concentrations increases to 0.01 wt%, the scattering curve from water–heptane interface indicates the dominance of silica nanoparticles, while the detected intensity from water–toluene interfaces suggests that SDS molecules occupy the interfacial region and displace the nanoparticles toward the aqueous phase. These results suggest that the higher interfacial energy of water–heptane systems drives an enhanced assembly of silica nanoparticles.As 0.1 wt% SDS is added to the system, the water–heptane and water–toluene interfaces are completely occupied by SDS molecules and no scattering from nanoparticles was observed, suggesting that the interfacial nanoparticles are completely displaced from the interfaces and emerged in the water phase. The competitive assembly of silica nanoparticles and SDS molecules on water–hydrocarbon interfaces is consistent with prior experimental work showing that the small quantities of surfactant stabilized nanoparticle emulsions.29,59
To determine the size distribution and the number of interfacial silica nanoparticles at water–heptane and water–toluene interfaces, we modeled the USAXS/SAXS curves that represent the scattering behavior of silica nanoparticles and surfactant at these interfaces. Quantitative analyses on the nanoparticles’ dominated interfaces are performed by modeling the structure factor  and the form factor
  of the intensity curves on the Q scale. The intensity
  scattered from identical spherical nanoparticles can be expressed as the product of
  and
and  such that:60
 | (1) |
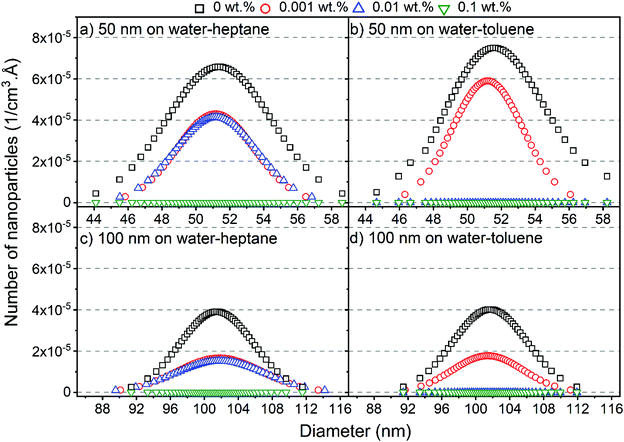
The size distribution and the number of interfacial silica nanoparticles at water–heptane and water–toluene interfaces (Fig. 3) are obtained from fitting  at the high Q regions. At 0 wt% SDS, the number of 50 nm and 100 nm nanoparticles assembled at water–toluene surfaces is higher compared to water–heptane interfaces. The number of 50 nm and 100 nm silica nanoparticles at water–heptane and water–toluene interfaces decreased substantially as the SDS concentration increased to 0.001 wt%, indicating that the added SDS molecules preferentially occupy the interfacial area and thus reduce the available area for the nanoparticles to adsorb on the interface. It is interesting to note that the number of interfacial silica nanoparticles at water–heptane interface remains similar when the concentrations of surfactants are 0.001 wt% and 0.01 wt% irrespective of the size of the nanoparticles (Fig. 3(a) and (c)). In contrast, the number of silica nanoparticles at the water–toluene interface dropped to zero on increasing the concentration of surfactants to 0.01 wt% and 0.1 wt% (Fig. 3(b) and (d)). These observations agree with the findings of Vashisth and co-workers that interfacial surfactants displace the adsorbed nanoparticles after accounting for the difference in the sizes of nanoparticles.29
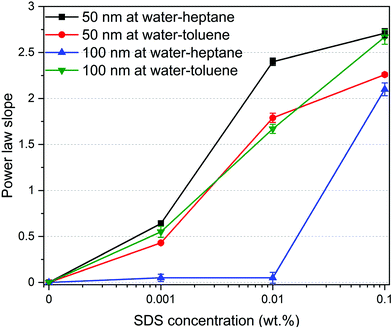
The observations noted from Fig. 3 are consistent with the scattering data shown in Fig. 2. The scattering pattern from water–heptane and water–toluene interfaces at high SDS concentrations (i.e., 0.1 wt% at water–heptane and ≥ 0.01 wt% at water–toluene) suggests the absence of silica nanoparticles at these interfaces and the dominance of surfactant assemblies (see Fig. 2). At 0.1 wt% SDS, the scattering curves from the water–heptane interfacial regions showed peaks at about 0.05 Å−1 indicating scattering from self-assembled surfactant molecules. The scattering from self-assembled surfactant at water–toluene are noticed at 0.01 wt% and at 0.1 wt% SDS concentrations, whereas peaks are detected at about 0.031 Å−1 and 0.026 Å−1, respectively. The locations of the peaks in water–heptane and water–toluene interfaces show the dependence of the formed assembles sizes and morphologies on the interfacial properties of the corresponding emulsions. Porod analysis of the interfacial surfactants on water–heptane and water–toluene interfaces are performed at high Q region to investigate the morphology of the self-assembled SDS molecules (see Fig. 2). The power law slope values of the scattering intensity curves on water–heptane interfaces in the presence of 0.1 wt% are 2.4 and 2.3 for emulsions with 50 nm and 100 nm silica nanoparticles, respectively. These values indicate the formation of 2D disk-like morphologies by the interfacial surfactants. However, SDS molecules at the interfaces of water–toluene forms both 2D disk-like (Q−2) and 1D rod-like (Q−1) morphologies. The formation of surfactant ensembles on water–hydrocarbon interfaces are evident from prior experimental and computational studies.61–64 Czajka and Armes61 concluded that the presence of SDS surfactants results in the formation of spherical latex emulsions based on SAXS measurements. Shi and Guo64 performed MD simulations on the effect of SDS molecular structure on its aggregation morphology at water–trichloroethylene interfaces. The results indicated that the surfactants form a continuous monolayer at the interface as the interfacial coverage increases.
The morphology of the self-assembled silica nanoparticles and SDS ensembles are further analyzed by calculating the power law slope in the USAXS (low Q) region (see Fig. 4). The morphology of self-assembled nanoparticles and SDS molecules change significantly with the SDS concentration. The low power law slope (< 1) in the absence (0 wt%) and presence of low SDS concentrations (0.001 wt%) indicate that the interfacial nanoparticles and SDS molecules are well dispersed at the interfaces. As the SDS concentration increases, the power law slope values increase substantially, implying the emergence of SDS aggregates with varying morphologies. A power law slope of < 3 indicates the formation of surface fractals.65,66 Further, the displaced silica nanoparticles to the bulk water are well dispersed with no indication of self-assembly as the power low slope is < 1 in the USAXS region (see Fig. S3†).
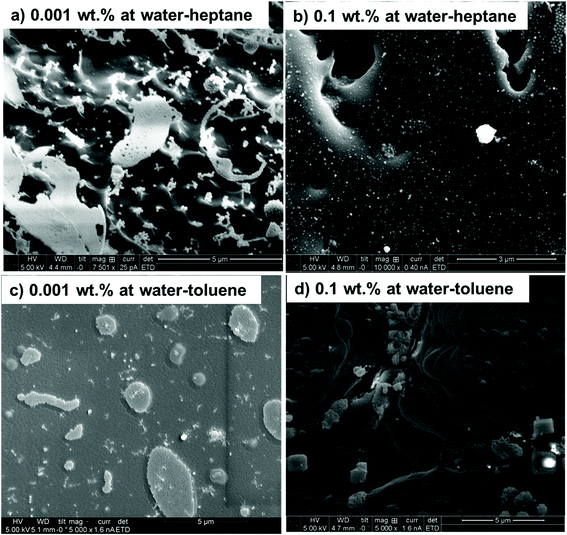
The displacement of interfacial nanoparticles from water–heptane and water–toluene interfaces are confirmed by cryo-SEM imaging (see Fig. 5). At low SDS concentrations of 0.001 wt%, the nanoparticles are abundant in the interfacial region of water–heptane and water–toluene emulsions. The nanoparticles are mostly found as individual nanoparticles with minor traces as aggregates on water–heptane and water–toluene interfaces (see Fig. 5(a) and (c)). However, the number of interfacial nanoparticles on water–heptane and water–toluene interfaces were significantly reduced as the SDS concentration increased to 0.1 wt%. Only traces of nanoparticles are observed at the interfaces due to the displacement into the aqueous phase by the interfacial SDS assembles. The cryo-SEM data agrees with the observation of USAXS/SAXS scattering measurements (Fig. 2).
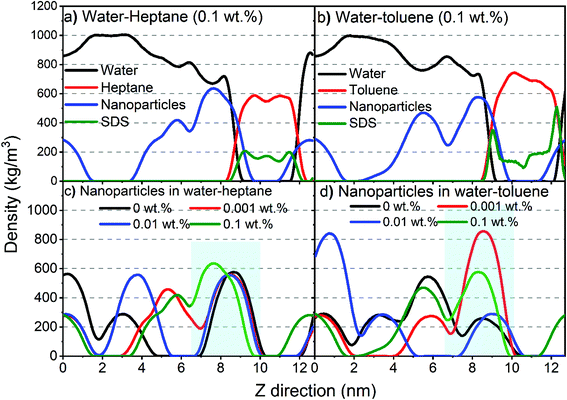
Additional insights into the assembly of silica nanoparticles and SDS molecules on water–heptane and water–toluene interfaces are obtained from the density profiles governed by MD simulations (Fig. 6). The density profiles are averaged over the last 10 ns of the simulation time and calculated along the axis normal to the interface (z-axis). Water and hydrocarbons formed two separated phases, while the silica nanoparticles and SDS molecules are dispersed in the water and hydrocarbon phases, respectively, with favorable assembly at the interfaces (Fig. 6(a) and (b)). The initially dispersed nanoparticles in the water phase migrated and assembled on the interfaces to extents that differ with the concentration of SDS molecules. SDS density profiles showed peaks at water–heptane and water–toluene interfaces, indicating preferential assembly at water–hydrocarbon interfaces compared to the dispersion in bulk hydrocarbons. Higher peaks in SDS profiles are observed on water–toluene interfaces compared to water–heptane interfaces.
Interestingly, the density profiles of silica nanoparticles at water–heptane interfaces showed a systematic shift toward the water phase as the SDS concentrations increase in the system (Fig. 6(c)). The nanoparticles’ density peaks at water–heptane interfaces are shifted from 8.7 nm to 7.6 nm as the SDS concentration increased from 0 wt% to 0.1 wt%, respectively. Similarly, the density peaks of nanoparticles at water–toluene are shifted from 8.5 nm to 8.3 nm as the SDS concentrations increased from 0 wt% to 0.1 wt%, respectively. The shift toward the aqueous phase suggests that the assembled SDS molecules on the interfaces displace the assembled nanoparticles away from the interface. This observation is consistent with the USAXS/SAXS intensities (Fig. 2 and 3) and agrees with previous studies.29
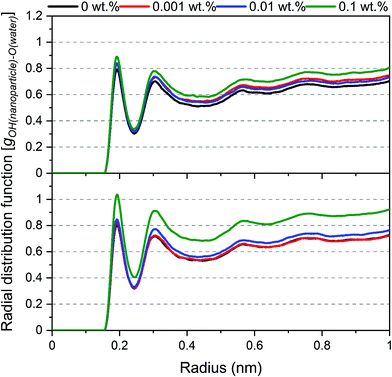
The displacement of nanoparticles from the interface is also evident from the density of water molecules around the surface of nanoparticles. These densities are quantified by calculating the radial distribution function (g(r)) of oxygen atoms in water molecules from the hydroxyl groups (–OH) on the surface of silica nanoparticles as a reference atom (see Fig. 7). The peaks represent the first coordination shells and second coordination shells of the oxygen in the water molecule around silica –OH groups. The density of the first and second coordination shells increased systematically with the increase in SDS concentrations. The denser water shells stem from the exposure of nanoparticle surface to water molecules that cover the nanoparticle as it is displaced from the interface and emerges into the aqueous phase to solvate the surfaces of nanoparticles and reduce its surface free energy.
3.2. Interfacial properties
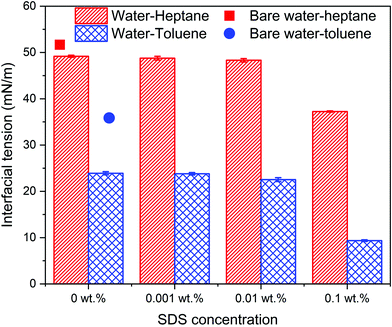
The influence of SDS surfactants on the assembly of silica nanoparticles and the resulting impact on the interfacial properties of water–heptane and water–toluene emulsions is probed from the MD simulation trajectories. Water–heptane and water–toluene formed two distinct phases with average densities of about 994, 658 and 862 kg m−3 for water, heptane, and toluene phases, respectively (see Fig. 6), which is in excellent agreement with the experimental bulk and emulsion densities at the conditions of 1 bar and 298 K.67,68 The influence of silica nanoparticles and SDS surfactants on the interfacial properties is quantified by calculating the interfacial tensions of the studied emulsions (Fig. 8) as follow:69,70 | (2) |
In this expression, γWH is the interfacial tension of water–heptane and water–toluene mixtures, n is the number of interfaces in the simulation cell, Pii is the pressure (where i = x, y and z directions) and Lz is the equilibrium cell length in the direction normal to the interface (z direction).
The calculated interfacial tensions of water–heptane and water–toluene at 1 bar and 298 K are 51.8 mN m−1 and 36.4 mN m−1, respectively, which are consistent with prior experimental and simulation results.67,71 Introducing silica nanoparticles to the interface resulted in a 4.7% and 9.4% reduction in the interfacial tension of water–heptane and water–toluene mixtures, respectively. Increases in the SDS concentrations to 0.01 wt% resulted in a slight reduction in the interfacial tension of both emulsions due to the addition of limited quantities of surfactant molecules that accumulate at the water–hydrocarbon interfaces. A substantial reduction in the interfacial tensions of both emulsions is observed on adding 0.1 wt% of SDS to the systems. The interfacial tension of water–heptane and water–toluene decreased to 24.3 and 9.1 mN m−1, respectively. These results suggest that high concentrations of SDS are more effective in stabilizing the emulsion of interest compared to hydrophilic silica nanoparticles. The simulations and experiments reveal that the stabilization of water–hydrocarbon emulsions in the presence of high concentrations of SDS surfactants is accompanied by limiting the assembly of silica nanoparticles at water–hydrocarbon interfaces.
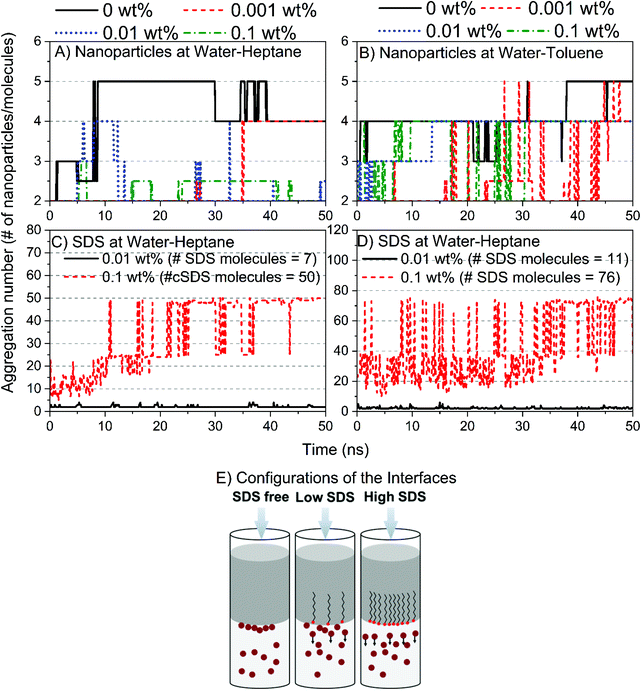
The mechanism by which silica nanoparticles and SDS molecules reduce the interfacial tension of water–heptane and water–toluene emulsions involves the assembly and dispersion of these nanoparticles and surfactant at the interfaces (see Fig. 9). Silica nanoparticles form a cluster of five nanoparticles at water–heptane and water–toluene in the absence of SDS molecules. Interestingly, the aggregation number of the nanoparticles decreases systematically as the SDS concentration increases (Fig. 9A and B) due to the preferential assembly of the SDS molecules at the interfacial region (Fig. 9C and D). Thus, the reduction in the interfacial tensions is driven by three scenarios (Fig. 9E): (a) the presence of nanoparticles at the interface results in slight reduction in the interfacial tension, (b) the coexistence of nanoparticles and surfactant at the interface results in a greater reduction in the interfacial tension compared to the first scenario, and (c) the excess SDS molecules at the interfaces of water–heptane and water–toluene reduces the interfacial tension significantly.
3.3. Energetics associated with the assembly of silica nanoparticles and SDS surfactant
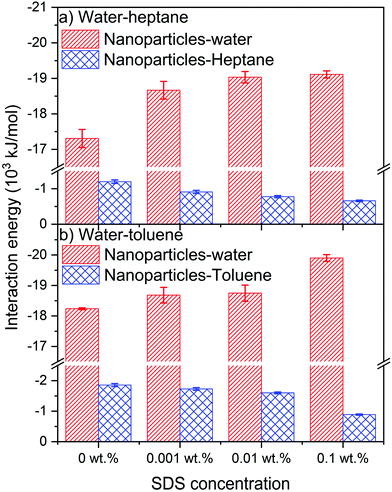
The intermolecular interactions of silica nanoparticles with water and hydrocarbons are probed to elucidate the energetic basis underlying their observed assembly as a function of SDS concentration (see Fig. 10). The van der Waals and electrostatic interactions averaged over the last 10 ns of the simulation constitute the intermolecular interactions of interest. The intermolecular interactions of the nanoparticles with water molecules are higher than the interactions of nanoparticles with heptane and toluene due to the hydrophilic nature of silica nanoparticles that drives the largest portion of the interfacial nanoparticle surface to be covered by water molecules.Interestingly, the interactions of nanoparticles with water in water–heptane and water–toluene systems increase systematically with the SDS concentrations. The increase in nanoparticles–water interactions is associated with a systematic decrease in the magnitude of nanoparticle–heptane and nanoparticle–toluene interaction energies. The trends of nanoparticles–water and nanoparticles–hydrocarbons energetic interactions as SDS concentrations increase confirm the displacement of nanoparticles from the interfaces toward the aqueous phase by SDS molecules. The displacement of the nanoparticles toward the aqueous phase is also confirmed by the increase of the average number of water molecules in the first coordination shell of the hydroxyl group on the surface of the nanoparticles (see Table 1). The number of Owater in the first coordination shell of OHsilica increases systematically with the increase of SDS concentrations in the hydrocarbon phases, indicating the increase of water density around the displaced nanoparticles. The enhanced solvation of silica nanoparticles due to the displacement into the aqueous phase is associated with an increase in the number of the hydrogen bonds between the hydroxyl groups on the surface of the nanoparticles and the surrounding water molecules (see Fig. S4†).
| SDS concentration (wt%) | Water–heptane | Water–toluene |
|---|---|---|
| 0 | 0.43 ± 0.01 | 0.43 ± 0.02 |
| 0.001 | 0.45 ± 0.04 | 0.44 ± 0.01 |
| 0.01 | 0.47 ± 0.02 | 0.47 ± 0.03 |
| 0.1 | 0.48 ± 0.02 | 0.54 ± 0.01 |
van der Waals interactions contribute significantly to the coexistence of silica nanoparticles and SDS surfactant at the interfaces of water–heptane and water–toluene emulsions, with electrostatic interactions having minor contribution (see Table 2). van der Waals and electrostatic interactions increase systematically with the concentrations of SDS due to the assembly of SDS at the interfaces. Further, van der Waals and electrostatic interactions between the interfacial nanoparticles and surfactants are higher at water–toluene compared to at water–heptane at all SDS concentrations. The higher intermolecular interactions of nanoparticles–SDS at the interface of water–toluene explains the significant reduction in the interfacial tension driven by the synergetic interactions between the interfacial nanoparticles and surfactants. However, the increase in the hydrogen bonding of nanoparticles–water (Fig. S4†) and SDS–water (Fig. S5†) with the increase of SDS concentrations confirms the favorable adsorption of SDS surfactant at the interface over the silica nanoparticles.
| SDS concentration (wt%) | Water–heptane interface | Water–toluene interface | ||
|---|---|---|---|---|
| van der Waals | Electrostatic | van der Waals | Electrostatic | |
| 0.001 | −2.52 ± 0.04 | −0.43 ± 0.02 | −2.60 ± 0.01 | −0.45 ± 0.04 |
| 0.01 | −16.10 ± 0.12 | −2.41 ± 0.08 | −23.05 ± 0.27 | −3.35 ± 0.09 |
| 0.1 | −43.25 ± 1.39 | −5.19 ± 0.42 | −69.207 ± 2.03 | −11.02 ± 0.21 |
Interestingly, attractive electrostatic interactions of nanoparticles with water are noted while the van der Waals interactions between the OH-terminated nanoparticles and water molecules are repulsive (see Table 3). Hydrogen bonding between the hydroxyl groups on the nanoparticles surfaces and water molecules contributed positively to the strong attraction between the nanoparticles and the aqueous phase. Nanoparticle interactions with heptane are dominated by van der Waals interactions with minor contributions of Coulomb attraction, while the interaction with toluene includes a substantial contribution from van der Waals and electrostatic interactions. The interaction energies elucidate the systematic displacement of silica nanoparticles from water–heptane and water–toluene interfaces that observed from USAXS/SAXS measurements, cryo-SEM imaging and MD simulations.
| SDS concentration (wt%) | Silica nanoparticles–water interactions | Silica nanoparticles–hydrocarbon interactions | ||
|---|---|---|---|---|
| van der Waals | Electrostatic | van der Waals | Electrostatic | |
| Water–heptane | ||||
| 0 | 1435.4 ± 11 | −18![[thin space (1/6-em)]](https://www.rsc.org/images/entities/char_2009.gif) 805.4 ± 49 805.4 ± 49 |
−1150.67 ± 11 | −45.46 ± 5 |
| 0.001 | 1461.8 ± 12 | −20![[thin space (1/6-em)]](https://www.rsc.org/images/entities/char_2009.gif) 155.9 ± 48 155.9 ± 48 |
−874.658 ± 16 | −33.65 ± 4 |
| 0.01 | 1489.8 ± 19 | −20![[thin space (1/6-em)]](https://www.rsc.org/images/entities/char_2009.gif) 495.0 ± 31 495.0 ± 31 |
−748.29 ± 8 | −26.18 ± 1 |
| 0.1 | 1499.3 ± 20 | −20![[thin space (1/6-em)]](https://www.rsc.org/images/entities/char_2009.gif) 545.6 ± 19 545.6 ± 19 |
−634.7 ± 12 | −22.14 ± 2 |
| Water–toluene | ||||
| 0 | 1378.1 ± 10 | −19![[thin space (1/6-em)]](https://www.rsc.org/images/entities/char_2009.gif) 614.7 ± 53 614.7 ± 53 |
−884.7 ± 14 | −970.2 ± 12 |
| 0.001 | 1454.0 ± 23 | −20![[thin space (1/6-em)]](https://www.rsc.org/images/entities/char_2009.gif) 135.9 ± 49 135.9 ± 49 |
−774.7 ± 18 | −953.4 ± 11 |
| 0.01 | 1476.7 ± 23 | −20![[thin space (1/6-em)]](https://www.rsc.org/images/entities/char_2009.gif) 224.0 ± 51 224.0 ± 51 |
−648.3 ± 13 | −951.1 ± 13 |
| 0.1 | 1527.3 ± 16 | −21![[thin space (1/6-em)]](https://www.rsc.org/images/entities/char_2009.gif) 426.6 ± 21 426.6 ± 21 |
−534.7 ± 9 | −353.4 ± 6 |
4. Conclusions
In this study, we uncover the mechanisms underlying the stabilization of water–toluene and water–heptane emulsions in the presence of silica nanoparticles with diameters of 50 nm and 100 nm and surfactant concentrations ranging from 0.001 wt% to 0.1 wt%. At low SDS concentrations of 0 wt% and 0.001%, emulsion stabilization proceeds via the assembly of silica nanoparticles at water–hydrocarbon interfaces. However, at higher SDS concentrations of 0.1%, emulsion stabilization occurs via the assembly of surfactant at the water–hydrocarbon interfaces and the associated displacement of silica nanoparticles away from these interfaces. The interfacial tensions and the energetics calculated from the simulations underlying these emulsion stabilization mechanisms support experimental observations of the differences in the assembly of silica nanoparticles and SDS surfactant at the water–hydrocarbon interfaces. The reduction in the interfacial tensions occurs solely due to the assembly of silica nanoparticles at the interfaces in the presence of low SDS concentrations. However, the interfacial tensions reduce significantly in the presence of 0.1% SDS because of the assembly of surfactant that displace the interfacial nanoparticles toward the aqueous phase. These insights provide the physico-chemical basis for designing energy-efficient water and hydrocarbon separations to advance sustainable energy and environmental technologies. Further experimental and computational studies are needed to resolve the effect of the surface curvature of silica nanoparticles and their solutions’ pH on their interfacial behavior at immiscible liquids interfaces.Conflicts of interest
There are no conflicts to declare.Acknowledgements
This work was supported as part of the Multi-Scale Fluid-Solid Interactions in Architected and Natural Materials (MUSE), an Energy Frontier Research Center funded by the U.S. Department of Energy, Office of Science, Basic Energy Sciences under Award # DE-SC0019285. The use of the Advanced Photon Source, an Office of the Science User Facility operated for the U.S. Department of Energy (DOE) Office of Science by Argonne National Laboratory, is supported by the U.S. DOE under Contract DE-AC02-06CH11357. The authors would also like to acknowledge Dr. Katie Spoth for assisting with the Cryogenic SEM images at Cornell Center for Materials Research shared facilities which is supported through the NSF MRSEC program (DMR-1719875).References
- N. Yekeen, E. Padmanabhan, A. K. Idris and S. M. Ibad, J. Pet. Sci. Eng., 2019, 179, 841–854 CrossRef CAS.
- C. Omurlu, H. Pham and Q. P. Nguyen, Appl. Nanosci., 2016, 6, 1167–1173 CrossRef CAS.
- S. Rahman, J. J. Tamborski, M. A. Charette and J. K. Cochran, Mar. Chem., 2019, 208, 29–42 CrossRef CAS.
- J. Faria, M. P. Ruiz and D. E. Resasco, Adv. Synth. Catal., 2010, 352, 2359–2364 CrossRef CAS.
- L. Leclercq, A. Mouret, A. Proust, V. Schmitt, P. Bauduin, J. M. Aubry and V. Nardello-Rataj, Chem. – Eur. J., 2012, 18, 14352–14358 CrossRef CAS PubMed.
- F. Tang, L. Li and D. Chen, Adv. Mater., 2012, 24, 1504–1534 CrossRef CAS.
- M. Manzano and M. Vallet-Regí, Adv. Funct. Mater., 2020, 30, 1902634 CrossRef CAS.
- Z. H. Zhou, J. Wang, X. Liu and H. S. O. Chan, J. Mater. Chem., 2001, 11, 1704–1709 RSC.
- E. B. Mock, H. De Bruyn, B. S. Hawkett, R. G. Gilbert and C. F. Zukoski, Langmuir, 2006, 22, 4037–4043 CrossRef CAS.
- P. Shinde, S. S. Gupta, B. Singh, V. Polshettiwar and B. L. Prasad, J. Mater. Chem. A, 2017, 5, 14914–14921 RSC.
- S. Hasebe, S. Aoyama, M. Tanaka and H. Kawakami, J. Membr. Sci., 2017, 536, 148–155 CrossRef CAS.
- A. Burns, P. Sengupta, T. Zedayko, B. Baird and U. Wiesner, Small, 2006, 2, 723–726 CrossRef CAS.
- M. Lundqvist, I. Sethson and B. H. Jonsson, Langmuir, 2004, 20, 10639–10647 CrossRef CAS.
- S. J. D. Sofla, L. A. James and Y. Zhang, Fuel, 2018, 216, 559–571 CrossRef.
- E. Dickinson, Trends Food Sci. Technol., 2012, 24, 4–12 CrossRef CAS.
- K. Zhang, Q. Wang, H. Meng, M. Wang, W. Wu and J. Chen, Particuology, 2014, 14, 12–18 CrossRef CAS.
- R. Pichot, F. Spyropoulos and I. T. Norton, J. Colloid Interface Sci., 2012, 377, 396–405 CrossRef CAS PubMed.
- T. V. Vu and D. V. Papavassiliou, J. Colloid Interface Sci., 2019, 553, 50–58 CrossRef CAS.
- H. Ma, M. Luo and L. L. Dai, Phys. Chem. Chem. Phys., 2008, 10, 2207–2213 RSC.
- N. G. Eskandar, S. Simovic and C. A. Prestidge, Phys. Chem. Chem. Phys., 2007, 9, 6426–6434 RSC.
- A. J. Worthen, L. M. Foster, J. Dong, J. A. Bollinger, A. H. Peterman, L. E. Pastora, S. L. Bryant, T. M. Truskett, C. W. Bielawski and K. P. Johnston, Langmuir, 2014, 30, 984–994 CrossRef CAS PubMed.
- R. U. Ranatunga, C. T. Nguyen, B. A. Wilson, W. Shinoda and S. O. Nielsen, Soft Matter, 2011, 7, 6942–6952 RSC.
- B. P. Binks and J. A. Rodrigues, Langmuir, 2007, 23, 7436–7439 CrossRef CAS PubMed.
- I. Akartuna, A. R. Studart, E. Tervoort, U. T. Gonzenbach and L. J. Gauckler, Langmuir, 2008, 24, 7161–7168 CrossRef CAS PubMed.
- B. P. Binks and C. P. Whitby, Colloids Surf., A, 2005, 253, 105–115 CrossRef CAS.
- W. Wang, Z. Zhou, K. Nandakumar, Z. Xu and J. H. Masliyah, J. Colloid Interface Sci., 2004, 274, 625–630 CrossRef CAS.
- N. R. Biswal, N. Rangera and J. K. Singh, J. Phys. Chem. B, 2016, 120, 7265–7274 CrossRef CAS PubMed.
- R. Pichot, F. Spyropoulos and I. T. Norton, J. Colloid Interface Sci., 2010, 352, 128–135 CrossRef CAS PubMed.
- C. Vashisth, C. P. Whitby, D. Fornasiero and J. Ralston, J. Colloid Interface Sci., 2010, 349, 537–543 CrossRef CAS PubMed.
- S. Levine, B. D. Bowen and S. J. Partridge, Colloids Surf., 1989, 38, 325–343 CrossRef CAS.
- D. E. Tambe and M. M. Sharma, J. Colloid Interface Sci., 1993, 157, 244–253 CrossRef.
- J. H. Schulman and J. Leja, Trans. Faraday Soc., 1954, 50, 598–605 RSC.
- E. H. Lucassen-Reynders and M. V. D. Tempel, J. Phys. Chem., 1963, 67, 731–734 CrossRef CAS.
- H. Hassander, B. Johansson and B. Törnell, Colloids Surf., 1989, 40, 93–105 CrossRef CAS.
- F. Ravera, E. Santini, G. Loglio, M. Ferrari and L. Liggieri, J. Phys. Chem. B, 2006, 110, 19543–19551 CrossRef CAS PubMed.
- J. Wang, F. Yang, C. Li, S. Liu and D. Sun, Langmuir, 2008, 24, 10054–10061 CrossRef CAS PubMed.
- S. Mohammed, H. Asgar, I. Kuzmenko and G. Gadikota, Energy Fuels, 2020, 34, 12545–12555 CrossRef CAS.
- J. Ilavsky, P. R. Jemian, A. J. Allen, F. Zhang, L. E. Levine and G. G. Long, J. Appl. Crystallogr., 2009, 42, 469–479 CrossRef CAS.
- J. Ilavsky, F. Zhang, A. J. Allen, L. E. Levine, P. R. Jemian and G. G. Long, Metall. Mater. Trans. A, 2013, 44, 68–76 CrossRef CAS.
- J. Ilavsky, J. Appl. Crystallogr., 2012, 45, 324–328 CrossRef CAS.
- J. Ilavsky and P. R. Jemian, J. Appl. Crystallogr., 2009, 42, 347–353 CrossRef CAS.
- G. Yu and J. Zhou, Phys. Chem. Chem. Phys., 2016, 18, 23500–23507 RSC.
- D. Argyris, N. R. Tummala, A. Striolo and D. R. Cole, J. Phys. Chem. C, 2008, 112, 13587–13599 CrossRef CAS.
- D. Argyris, D. R. Cole and A. Striolo, Langmuir, 2009, 25, 8025–8035 CrossRef CAS PubMed.
- A. Phan, D. R. Cole and A. Striolo, J. Phys. Chem. C, 2014, 118, 4860–4868 CrossRef CAS.
- R. T. Cygan, J. J. Liang and A. G. Kalinichev, J. Phys. Chem. B, 2004, 108, 1255–1266 CrossRef CAS.
- W. L. Jorgensen, J. D. Madura and C. J. Swenson, J. Am. Chem. Soc., 1984, 106, 6638–6646 CrossRef CAS.
- W. L. Jorgensen, D. S. Maxwell and J. Tirado-Rives, J. Am. Chem. Soc., 1996, 118, 11225–11236 CrossRef CAS.
- V. S. Farafonov and A. V. Lebed, J. Chem. Theory Comput., 2017, 13, 2742–2750 CrossRef CAS.
- T. Fang, Y. Zhang, R. Ma, Y. Yan, C. Dai and J. Zhang, Appl. Surf. Sci., 2019, 494, 80–86 CrossRef CAS.
- B. Meghwal, N. Rampal and A. Malani, Energy Fuels, 2020, 34, 16023–16034 CrossRef CAS.
- H. Yan and S. Yuan, J. Phys. Chem. C, 2016, 120, 2667–2674 CrossRef CAS.
- S. Nosé, Mol. Phys., 1984, 52, 255–268 CrossRef.
- W. G. Hoover, Phys. Rev. A, 1985, 31, 1695 CrossRef.
- M. Parrinello and A. Rahman, J. Chem. Phys., 1982, 76, 2662–2666 CrossRef CAS.
- T. Darden, D. York and L. Pedersen, J. Chem. Phys., 1993, 98, 10089–10092 CrossRef CAS.
- M. J. Abraham, T. Murtola, R. Schulz, S. Páll, J. C. Smith, B. Hess and E. Lindahl, SoftwareX, 2015, 1, 19–25 CrossRef.
- Y. Chai, J. Hasnain, K. Bahl, M. Wong, D. Li, P. Geissler, P. Y. Kim, Y. Jiang, P. Gu, S. Li and D. Lei, Sci. Adv., 2020, 6, eabb8675 CrossRef CAS PubMed.
- M. Zargartalebi, N. Barati and R. Kharrat, J. Pet. Sci. Eng., 2014, 119, 36–43 CrossRef CAS.
- T. Li, A. J. Senesi and B. Lee, Chem. Rev., 2016, 116, 11128–11180 CrossRef CAS PubMed.
- A. Czajka and S. P. Armes, J. Am. Chem. Soc., 2021, 143, 1474–1484 CrossRef CAS PubMed.
- S. Svenson, Curr. Opin. Colloid Interface Sci., 2004, 9, 201–212 CrossRef CAS.
- W. Shinoda, R. DeVane and M. L. Klein, Soft Matter, 2008, 4, 2454–2462 RSC.
- W. X. Shi and H. X. Guo, J. Phys. Chem. B, 2010, 114, 6365–6376 CrossRef CAS PubMed.
- P. W. Schmidt, J. Appl. Crystallogr., 1991, 24, 414–435 CrossRef CAS.
- J. Teixeira, J. Appl. Crystallogr., 1988, 21, 781–785 CrossRef.
- T. Lan, H. Zeng and T. Tang, J. Phys. Chem. C, 2019, 123, 22989–22999 CrossRef CAS.
- X. Sun, H. Zeng and T. Tang, J. Colloid Interface Sci., 2021, 586, 766–777 CrossRef CAS PubMed.
- S. Mohammed and G. A. Mansoori, Energy Fuels, 2018, 32, 5409–5417 CrossRef CAS.
- S. Mohammed and G. A. Mansoori, J. Mol. Liq., 2018, 263, 268–273 CrossRef CAS.
- A. H. S. Dehaghani, M. S. Taleghani, M. H. Badizad and R. Daneshfar, Colloid Interface Sci. Commun., 2019, 33, 100202 CrossRef CAS.
Footnote |
| † Electronic supplementary information (ESI) available. See DOI: 10.1039/d1nr06807e |
| This journal is © The Royal Society of Chemistry 2022 |

