DOI:
10.1039/D1NJ04491E
(Paper)
New J. Chem., 2022,
46, 239-249
Colorimetric detection of glucose by a hybrid nanomaterial based on amplified peroxidase-like activity of ferrosoferric oxide modified with gold–platinum heterodimer†
Received
21st September 2021
, Accepted 9th November 2021
First published on 9th November 2021
Abstract
The colorimetric detection of glucose using hybrid nanostructures is a rapidly growing research hotspot. In this work, we established a simple route for the synthesis of a class of multi-metal hybrid nanostructure materials and investigated their peroxidase-like performance for the colorimetric detection of glucose. The hybrid nanomaterial (Fe3O4@Au–Pt) incorporated ferrosoferric oxide nanoparticles (Fe3O4 NPs) and heterodimers composed of gold (Au) and platinum (Pt), which presents excellent morphology and structure. On the basis of our research, we constructed an easy and sensitive colorimetric sensor for the detection of glucose and hydrogen peroxide (H2O2), and the results indicated that the Fe3O4@Au–Pt hybrid nanomaterial possessed preferable peroxidase-like activity in comparison with other nanozyme materials and showing prominent selectivity for glucose detection. For H2O2, the sensor has a linear range of 0.05–120 μM and a relatively low limit of detection (LOD) of 0.018 μM. For glucose, the linear range is 0.05–140 μM with an LOD of 0.025 μM. It is envisioned that these hydrophilic hybrid nanostructures will be widely applied in sensing target analytes, biomedical diagnosis, and therapeutic applications in the future by taking advantage of their specific structure and excellent catalytic performance.
1. Introduction
Glucose is a metabolic intermediate of living cells, which plays a major role in the working of the physiological and pathological processes of humans.1–3 The concentration of glucose in the human body is a vital indicator for monitoring health, and abnormal glucose levels in human blood, tears, urine, and other body fluids usually result in the emergence of metabolism-related diseases such as obesity and hyperglycemia.4–6 Therefore, developing simple and rapid methods for accurately quantifying glucose is of crucial significance. A number of techniques have been developed for detecting glucose, such as high-performance liquid chromatography (HPLC),7 fluorescence,8,9 and electrochemistry.10,11 However, these analytical methods are mostly based on relatively complex processes and require expensive instruments, which restricts their use for rapid glucose detection. Among the existing glucose detection methods, enzyme colorimetric biosensing12–14 has received significant attention as a result of its speed, low cost, simplicity, and practicality.
The main mechanism of colorimetry for glucose detection is catalyzing the oxidation of glucose to produce gluconic acid and H2O2 by glucose oxidase (GOx).15 H2O2 produced by the reaction is then used as a substrate for the oxidation of colorless 3,3′,5,5′-tetramethylbenzidine (TMB) into oxidized TMB (oxTMB) using horseradish peroxidase (HRP). Unlike the colorless TMB, oxTMB has an obvious blue color.16 In this process, natural enzymes perform the catalytic reactions with high efficiency and specificity. However, their application for practical use is fundamentally limited by intrinsic disadvantages including a complex purification process, low stability, high susceptibility to the catalytic environment, challenges of long-term storage, and high cost.17,18 Recent advancements in nanotechnology and nanozymology have opened new windows for developing nanomaterial-based enzyme-like materials, namely nanozymes, to replace natural enzymes. Nanozymes have demonstrated catalytic activity resembling that of natural enzymes.19 Additionally, nanozymes possess inherent merits, such as low cost, high environmental stability, and amenability to mass production, which overcome the shortcomings of natural enzymes used in practical applications.20 Nanozymes mimicking the enzymatic activity of HRP can catalyze the oxidative reaction of various colorimetric substrates by transferring electrons to H2O2, and thereby attract significant interest due to their broad application in analytical detection and clinical chemistry.21–23 Since the first peroxidase-like activity of Fe3O4 nanoparticles was reported by Gao et al. in 2007,24 various new nanomaterials possessing intrinsic peroxidase-like properties have been synthesized, including carbon nanomaterials,25 quantum dots,26,27 noble metals,28–30 metal oxides,31,32 metal sulfides,33,34 and metal–organic frameworks (MOFs).35,36
Among these enzyme mimics, hybrid nanostructures stand out because they integrate multifunctionalities, which are hardly possible to be realized by simply mixing their individual components. These hybrid nanomaterials often demonstrate superior catalyst efficiency by virtue of their synergistic effects compared with their monometallic counterparts.37 Fe3O4 and related nanomaterials are extensively used as peroxidase-like mimics in place of HRP for the colorimetric and fluorescent detection of H2O2 and glucose.38 Separately, Pt is a familiar noble metal element, which is extensively used in many fields. Pt is chemically inert at the volume scale; however, interestingly, it serves as one of the most common and important catalysts at the nanoscale.39 Pt nanozymes consisting of 57% Pt0 and 43% Pt2+ have been reported to possess high peroxidase-like activity with Km values of 0.119 mM and 41.8 mM toward TMB and H2O2, respectively.40 Au is also a commonly reported noble metal element for catalytic applications. Historically, gold has been regarded as catalytically inert but it has been shown to become active when stabilized in the nanoparticle form. It has also been reported that Au NPs possess intrinsic peroxidase-like activity and show high selectivity toward glucose detection.41 Schmid proposed that compared with single metal nanomaterials, the interaction between the alloy atoms will change the catalytic effect, which is called the synergistic effect.42 It is usually superior to the original single metal materials in their catalytic activity, selectivity, durability, and reaction conditions. Considering this information, a class of hybrid nanostructures that include iron oxide and heterodimers composed of noble metals (Au and Pt) are potentially desirable nanozyme materials for the catalysis of peroxides. The combined catalytic properties of Au and Pt show a synergistic effect when used together and hold great promise for broad applications in catalysis.
Therefore, in this work, we prepared a kind of Fe3O4@Au–Pt hybrid nanomaterial as a peroxidase mimic for the colorimetric detection of H2O2 and glucose. The well-synthesized hybrid nanomaterial possesses excellent morphology and structure and is able to catalytically oxidize the colorless substrate TMB by H2O2 to generate blue oxTMB. More importantly, the blue color of this system is directly decided by the concentration of glucose. Under the synergistic effect of Fe3O4 NPs and gold–platinum heterodimer, an easy and sensitive colorimetric sensor based on the Fe3O4@Au–Pt hybrid nanomaterial for the detection of H2O2 and glucose was constructed, and the results indicated that the hybrid nanomaterial demonstrated amplified peroxidase-like activity in comparison with other nanozyme materials and excellent selectivity for glucose detection.
2. Experimental section
2.1. Chemicals
All chemicals and reagents were of analytical grade. Polyethylene glycol 6000 (PEG-6000), sodium acetate anhydrous, 3,3′,5,5′-tetramethylbenzidine dihydrochloride (TMB), and glucose oxidase (GOx) were obtained from Shanghai Macklin Biochemical Co., Ltd (Shanghai, China). Iron(III) chloride hexahydrate, L-ascorbic acid, ethylene glycol, H2O2, and glucose were purchased from Sinopharm Chemical Reagent Co., Ltd (Shanghai, China). Trisodium citrate (TSC) and ethanol were purchased from Tianjin Hengxing Chemical Preparation Co., Ltd (Tianjin, China).
2.2. Apparatus
The morphology of novel Fe3O4@Au–Pt was characterized by scanning electron microscopy (SEM, Zeiss EVO 18 scanning electron microscope, Jena, Germany). Transmission electron microscopy (TEM) measurements and energy dispersive X-ray spectrometry (EDX) mapping profiles were made with a JEM-2100 High Resolution TEM (Beijing, China) with an accelerating voltage of 200 kV. X-ray diffraction was characterized by a NEW SmartLab XRD (Beijing, China). X-Ray photoelectron spectroscopy (XPS) was recorded using a photoelectron spectrometer (Thermo ESCALAB 250Xi, Shanghai, China). All UV-vis absorption spectra were recorded on a TU-1901 spectrophotometer (Beijing, China).
2.3. Synthesis of Fe3O4 NPs
A mixture containing iron(III) chloride hexahydrate (1.35 g) and ethylene glycol (40 mL) was stirred in a beaker. Next, sodium acetate anhydrous (3.6 g) and PEG-6000 (1.0 g) were added and the mixture was stirred for 30 min. The mixture was then transferred to a hydrothermal synthesis reactor (50 mL) and heated for 8 h at 200 °C in a vacuum drying oven. After the reaction was completed, the reactor was allowed to cool down to the room temperature and Fe3O4 NPs were removed from the ethylene glycol reaction mixture by magnetic separation. The Fe3O4 NPs were washed three times with ethanol and three times with distilled water afterward. The Fe3O4 NPs were collected by magnetic separation after each washing step. Finally, oven-dried Fe3O4 NPs (0.16 g) were dispersed in H2O (30 mL) and set aside for further use.
2.4. Synthesis of the Fe3O4@Au–Pt hybrid nanomaterial
H2O (20 mL) and Fe3O4 NPs (0.5 mL) were mixed in a three-neck flask and heated until boiling. Next, HAuCl4 solution (10 mM, 0.9 mL) and an equal volume of TSC (10 mg mL−1) were respectively added into the boiling solution at a rate of 0.05 mL min−1. During this step, the color of the solution changed from black to purple. After the HAuCl4 and TSC solutions were added, ascorbic acid solution (0.1 M, 0.25 mL) and H2PtCl6 solution (20 mM, 0.25 mL) were rapidly added to the above solution and the mixture was heated for an additional 30 min. It is worth noting that the solution temperature should be decreased before the ascorbic acid solution and the H2PtCl6 solution were added. During this step, the color of the mixture changed from purple to dark purple. Finally, the resulting Fe3O4@Au–Pt hybrid nanomaterial was collected by a beaker covered with an aluminum foil to prevent exposure to ambient light and allowed to naturally cool to room temperature.
2.5. Kinetic analysis of the hybrid nanomaterial
The steady-state kinetic analysis experiments of the Fe3O4@Au–Pt hybrid nanomaterial were carried out on a spectrophotometer in the time-scan mode. In the course of the experiment, the concentration of one substrate was changed while that of the other was kept constant. Then, the kinetic curves were drawn. The initial reaction velocity can be obtained from the relationship between absorbance and time at different concentrations of each substrate based on the kinetic curves. The kinetics data, the Michaelis–Menten constant (Km), and the maximum initial velocity (Vmax) can be calculated through the Michaelis–Menten equation (eqn (1)) and Lineweaver–Burk plot (eqn (2)).| |  | (1) |
| |  | (2) |
where V and Vmax symbolize the initial and maximum reaction velocities, respectively, Km represents the Michaelis–Menten constant, and [S] stands for the concentration of the substrate (TMB or H2O2).
2.6. Colorimetric detection of H2O2
Different concentrations of H2O2 (50 μL), TMB (5 mM, 50 μL), the Fe3O4@Au–Pt hybrid nanomaterial solution (50 μL), and 0.2 M NaAc-HAc buffer solution (3.6 mL, pH 4.5) were mixed in a centrifuge tube (5 mL). The mixture was reacted at 45 °C for 10 min and then placed in cool water to stop the reaction. The absorbance was measured at 652 nm on the spectrophotometer. Each experiment was performed three times under the same conditions.
2.7. Colorimetric detection of glucose
Different concentrations of glucose solution (70 μL) and GOx (10 μg mL−1, 100 μL) were added into a Na2HPO4–NaH2PO4 buffer solution (10 mM, 900 μL, pH 7.0). The mixed solution was incubated at 35 °C for 30 min. After the reaction, TMB (5 mM, 50 μL), the Fe3O4@Au–Pt hybrid nanomaterial solution (50 μL), and 0.2 M NaAc–HAc buffer solution (3 mL, pH 4.0) were added. The mixed solution was reacted at 45 °C for 10 min and then placed in cool water to stop the reaction. The absorbance spectra were recorded at 652 nm on the spectrophotometer. Each experiment was performed three times under the same conditions. In the selectivity analysis experiments, maltose, galactose, fructose, and sucrose were respectively tested (5 mM) instead of glucose (0.5 mM).
2.8. Analysis of glucose in the serum samples
For glucose detection in characterized newborn bovine serum (NBS), the samples were first treated by ultrafiltration for 30 min and glucose standard solution (20, 50, 70, and 100 μM) was added to the filtrates. The samples (70 μL) and GOx (10 μg mL−1, 100 μL) were added into a Na2HPO4–NaH2PO4 buffer solution (10 mM, 900 μL, pH 7.0). The mixed solution was incubated at 35 °C for 30 min. After the reaction, TMB (5 mM, 50 μL), the Fe3O4@Au–Pt hybrid nanomaterial solution (50 μL), and 0.2 M NaAc–HAc buffer solution (3 mL, pH 4.0) were added. The mixed solution was reacted at 45 °C for 10 min and then placed in cool water to stop the reaction. The absorbance spectra were recorded at 652 nm on the spectrophotometer. Each experiment was performed three times under the same conditions.
3. Results and discussion
3.1. Preparation of the Fe3O4@Au–Pt hybrid nanomaterial and the possible detection principle
A facile approach was utilized to prepare the Fe3O4@Au–Pt hybrid nanomaterial, as shown in Fig. 1a. Firstly, Fe3O4 NPs were synthesized via the solvothermal method, thus obtaining a core supporting material that had a stable structure and magnetic properties. Next, HAuCl4 and trisodium citrate were added to a boiling aqueous solution of Fe3O4 NPs by controlling the addition rate. During this process, Au(III) was partially reduced to Au(0), thus leading to the deposition of a small Au seed on the surface of the Fe3O4 NPs. Due to the prereduction condition, HAuCl4 will not be completely reduced. Then, ascorbic acid and H2PtCl6 were added to the mixture owing to the strong reducibility of ascorbic acid, the incomplete reduction of HAuCl4 in the previous step with the added H2PtCl6 was simultaneously reduced and grown on the Au seed as the sites. Hence, the Fe3O4@Au–Pt hybrid nanomaterials were successfully obtained. Due to the geometric and electronic effects between the two metals, bimetallic nanoparticles composed of two or more components usually exhibit different properties from their single metal analogues. As previously reported, the activity and selectivity of Pt-based catalysts can be significantly enhanced by forming alloys between Pt and Au.43 In addition, Au-Pt heterodimer materials also greatly increase the catalytic sites by being loaded on the surface of Fe3O4 NPs. In conclusion, hybrid nanostructures that include Fe3O4 and Au–Pt heterodimers showed desirable catalytic activity of the nanozyme. Fig. 1b schematically illustrates the possible detection principle of the Fe3O4@Au–Pt hybrid nanomaterial toward glucose. It is a typical colorimetric detection method in which glucose is catalytically oxidized to produce gluconic acid and H2O2 by GOx, and the H2O2 produced by the reaction is then used as a substrate for the oxidation of colorless TMB into blue oxTMB using the synthesized Fe3O4@Au–Pt hybrid nanomaterial taking the place of HRP. In this process, glucose was quantitatively related to the color of TMB through the intermediate H2O2, thus realizing the determination of glucose.
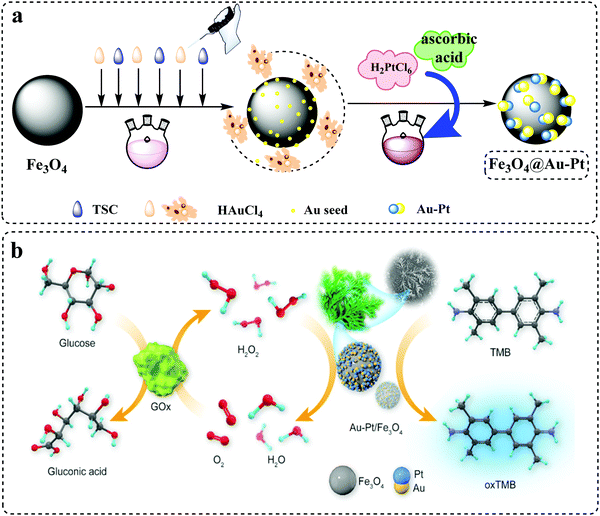 |
| | Fig. 1 (a) Schematic illustration of the preparation process of the Fe3O4@Au–Pt hybrid nanomaterial. (b) Schematic diagram of the constructed colorimetric sensor for H2O2 and glucose detection using the Fe3O4@Au–Pt hybrid nanomaterial as a peroxidase-like mimic. | |
3.2. Characterization of the hybrid material
A typical SEM image of the Fe3O4@Au–Pt hybrid nanomaterial is shown in Fig. 2a. As can be seen, the Fe3O4@Au–Pt hybrid nanomaterial presented an excellent morphology and structure resembling pine branches. This morphology and structure is indicative of a high number of catalytically active sites. Large and small nanoparticle aggregations can both be seen in the SEM image. Fig. 2b and c showed typical TEM images of the Fe3O4@Au–Pt hybrid nanomaterial. Several globular nanoparticles were presented in Fig. 2b. As can be seen from Fig. 2c, the Fe3O4@Au–Pt hybrid nanomaterial has a regular spherical morphology with a uniform size and a diameter of approximately 350 nm. The standard deviation of the diameter was approximately 20%. A shell-like structure of the nanoparticles wrapping the solid spheres was clearly visible. The EDX results shown in Fig. 2d indicated that the spheres were composed of Fe3O4, while the shell-like structure consisted of Au–Pt heterodimers. The EDX map shows that the elemental distribution of Au and Pt heavily overlaps, indicating their existence as a heterodimer.
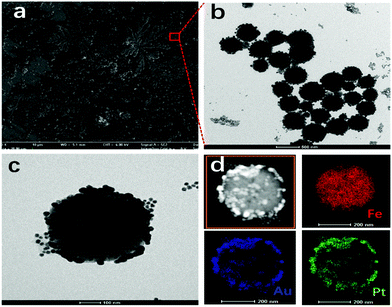 |
| | Fig. 2 (a) SEM micrograph of the Fe3O4@Au–Pt hybrid nanomaterial, (b and c) TEM micrographs of Fe3O4@Au–Pt, and (d) EDX mapping of Fe3O4@Au–Pt. | |
In this work, Fe3O4 NPs were prepared via the solvothermal method, and X-ray diffraction was used to characterize the crystalline phase of the Fe3O4 NPs. As shown in Fig. 3a, the reflections of (111), (220), (311), (400), (422), (511), (440), and (533) in the typical XRD pattern could be ascribed to Fe3O4.44,45 To analyze the surface composition of the Fe3O4@Au–Pt hybrid nanomaterial, the XPS spectra were determined. The elemental composition was 20.91% (Fe 2p), 46.52% (O 1s), 24.34% (O 1s), 6.83% (Au 4f), and 1.39% (Pt 4f), as shown in Table S1 (ESI†). High resolution XPS spectra of Fe 2p, Au 4f, and Pt 4f of the Fe3O4@Au–Pt hybrid nanomaterial were also investigated. As can be seen in Fig. 3b, two peaks at 710.5 and 724.1 eV were exhibited, corresponding to the peaks of Fe 2p3/2 and Fe 2p1/2 in Fe3O4, respectively. There are no obvious shakeup satellite structures at the higher binding energy side of both the main peaks, which is the characteristic of Fe3O4.46–48 The high resolution XPS spectra of Au 4f and Pt 4f were analyzed to indicate the oxidation state of Au and Pt. As shown in Fig. 3c, there were two obvious characteristic peaks at 83.9 and 87.6 eV, corresponding to the peaks of Au 4f7/2 and Au 4f5/2, respectively. These values were similar to the XPS analysis of pristine gold nanoparticle,49,50 indicating the synthesis of metallic gold (Au0). Fig. 3d shows the binding energy of Pt 4f7/2 and Pt 4f5/2 at 71.2 eV and 74.6 eV, respectively, which were similar to metallic Pt (Pt0), indicating the synthesis of Pt0.51,52 Therefore, the XPS results proved that Au and Pt were in the metallic form on the surface of the hybrid nanomaterial.
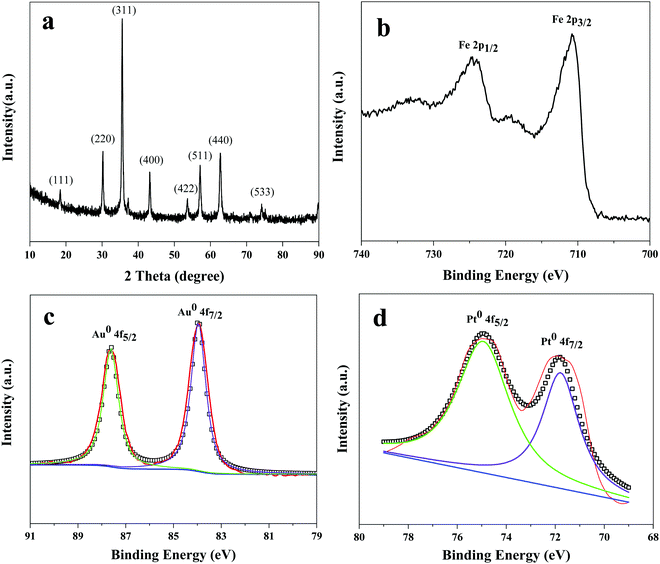 |
| | Fig. 3 (a) XRD pattern of Fe3O4 NPs. High resolution XPS spectra of (b) Fe 2p, (c) Au 4f, (d) Pt 4f of the Fe3O4@Au–Pt hybrid nanomaterial. | |
Besides, the zeta potentials and magnetic response property of the Fe3O4@Au–Pt hybrid nanomaterial were also investigated and plotted in Fig. S1 and S2 (ESI†), respectively. The values of zeta potential values indicated that the Fe3O4 and the Fe3O4@Au–Pt hybrid nanomaterials were negatively charged and the deposition of the Au–Pt heterodimers on Fe3O4 resulted in a shift of the potential to more negative values, respectively. The zeta potentials of the Fe3O4@Au–Pt hybrid nanomaterial at pH of 3.5, 4.5, and 5.5 were −10.213, −13.567, and −11.533 mV, respectively. It shows that the material has good dispersibility and stability, which is helpful for achieving better catalytic performance. As can be observed in Fig. S2 (ESI†), the maximum saturation magnetization of Fe3O4 NPs was 82.7 emu g−1, and then this value of the Fe3O4@Au–Pt hybrid nanomaterial reduced to 7.85 emu g−1, which is attributed to the existence of nonmagnetic coating after modification. However, the magnetism of the Fe3O4@Au–Pt hybrid nanomaterial was still sufficient for magnetic separation with ordinary magnets.
3.3. Peroxidase-like activity of the Fe3O4@Au–Pt hybrid nanomaterial
To investigate the peroxidase-like activity of the Fe3O4@Au–Pt hybrid nanomaterial, four different reaction systems that were added with different chemical agents were designed and the addition of reagents is listed in Table S2 (ESI†). In the designed experiments, TMB was used as a typical chromogenic substrate in the presence of H2O2. After the trail, the test solutions’ spectra were measured between 320 and 800 nm. As shown in Fig. 4, the inset clearly shows the color variance. As can be seen in spectra (c) and (d) in Fig. 4 and the inset, no color changes occurred in the TMB solution in the presence or absence of the Fe3O4@Au–Pt hybrid nanomaterial, indicating that catalytic oxidation does not occur in the absence of H2O2. However, weak absorption was observed in the mixture of H2O2 and TMB solution, as seen in spectrum (b) in Fig. 4. The observed light blue color of the solution indicates that the weak oxidation of TMB by H2O2 can occur in the absence of a catalyst. Finally, a strong blue color became quickly evident and a much stronger absorption spectrum appeared in the mixture of the Fe3O4@Au–Pt hybrid nanomaterial, H2O2, and TMB solution, as seen in spectrum (a). This indicated a strong acceleration of the oxidation reaction of TMB with H2O2 in the presence of the hybrid nanomaterial and a high concentration of oxTMB. This experiment verifies that the hybrid nanomaterial possesses ideal peroxidase-like activity.
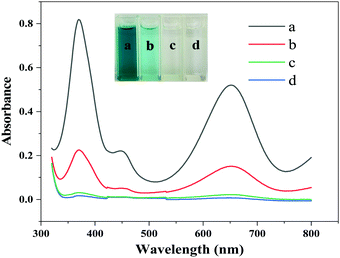 |
| | Fig. 4 Four different reaction systems to investigate the peroxidase-like performance of the Fe3O4@Au–Pt hybrid nanomaterial, including (a) Fe3O4@Au–Pt + H2O2 + TMB + HAc–NaAc buffer, (b) H2O2 + TMB + HAc–NaAc buffer, (c) Fe3O4@Au–Pt + TMB + HAc–NaAc buffer, and (d) TMB + HAc–NaAc buffer. The inset shows the color variance. | |
To compare the peroxidase-like performance of the Fe3O4@Au–Pt hybrid nanomaterial with other similarly processed nanomaterials, four different reaction systems with different nanomaterials were devised. The experiments were designed to carry out the oxidation reaction of TMB in the presence of H2O2, which was catalyzed by either the hybrid nanomaterial, Fe3O4 NPs, Au NPs, or Fe3O4–Au nanocomposite material without Pt. After the trail, the test solutions’ spectra were gauged between 320 and 800 nm, with the results displayed in Fig. 5. As can be seen, a much stronger absorption spectrum was observed in the mixture including the Fe3O4@Au–Pt hybrid nanomaterial compared with other nanomaterials, indicating that the intrinsic peroxidase-like activity of the Fe3O4@Au–Pt hybrid nanomaterial is significantly enhanced compared with single-element nanomaterials. The peroxidase-like activity order of these nanomaterials is as follows: Fe3O4@Au–Pt > Fe3O4 NPs > Au NPs > Fe3O4–Au. The excellent catalytic performance of the Fe3O4@Au–Pt hybrid nanomaterial is due to its morphology and structure, which provides a large number of catalytic sites on the material's surface. On the other hand, the synergistic effect among the components of the hybrid material also contributes to the excellent catalytic performance.
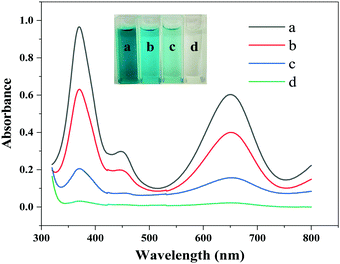 |
| | Fig. 5 Comparison of the peroxidase-like activity of different nanomaterials. (a) Fe3O4@Au–Pt; (b) Fe3O4 NPs; (c) Au NPs; (d) Fe3O4–Au nanocomposite. The inset showed the color contrast. | |
The effect of the Fe3O4@Au–Pt hybrid nanomaterial-modified glassy carbon electrode (Fe3O4@Au–Pt/GCE) on the electrocatalytic activity of the electrode toward H2O2 reduction was also investigated. Fig. S3 (ESI†) shows that Fe3O4@Au–Pt/GCE exhibited enhanced amperometric response, including a much higher peak current and lower overpotential, toward the reduction of H2O2 compared with bare GCE. This demonstrates the superb electrocatalytic activity of the Fe3O4@Au–Pt hybrid nanomaterial toward H2O2 reduction.
3.4. Mechanism of peroxidase-like activity of the Fe3O4@Au–Pt hybrid nanomaterial
In order to investigate the catalytic mechanism of the Fe3O4@Au–Pt hybrid nanomaterial as catalase mimetics, terephthalic acid (TA) was selected as the fluorescence probe to evaluate the production of hydroxyl radical (˙OH). The hydroxyl radical can react readily with terephthalic acid, forming highly fluorescent 2-hydroxy terephthalic acid, which can be easily monitored by a spectrofluorophotometer. As shown in Fig. 6, it was can be seen that the fluorescence intensity decreased with the increase in the amount of the Fe3O4@Au–Pt hybrid nanomaterial, which indicated that the Fe3O4@Au–Pt hybrid nanomaterial reduced the formation of hydroxyl radicals by catalyzing the decomposition of H2O2. This result followed the electron transfer mechanism, similar to HRP-C,53 NiPd hNPs,54 Co3O4 NPs,53 AuNP@CDs,30 and Au@Pt nanostructures.55 The first step involved the reduction of H2O2 by the Fe3O4@Au–Pt hybrid nanomaterial, which was oxidized. This electron transfer process occurred from the Au–Pt heterodimers to H2O2 as an electron acceptor. In the second step, TMB acted as a donor of electrons and donated the lone-pair electrons from the amino groups to the Au–Pt heterodimers. This accelerated the electron transfer from the Fe3O4@Au–Pt hybrid nanomaterial to H2O2, thus increasing the reaction rate of TMB oxidation by H2O2. Therefore, the nature of the peroxidase-like activity of the Fe3O4@Au–Pt hybrid nanomaterial originates from their ability of electron transfer between the reducing substrates and H2O2.
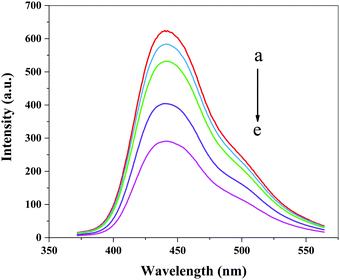 |
| | Fig. 6 The effect of the Fe3O4@Au–Pt hybrid nanomaterial on the formation of the hydroxyl radical with terephthalic acid as a fluorescence probe. (a–f) 0, 10, 20, 30, 40 μg mL−1. | |
3.5. Effect of the reaction conditions
As is known, the experimental reaction conditions directly affect the enzymatic activity. Therefore, it is likely that the peroxidase-like performance of the Fe3O4@Au–Pt hybrid nanomaterial is both temperature-dependent and pH-dependent, similar to other peroxidase mimics. To determine the optimal reaction conditions, the catalytic performance of the Fe3O4@Au–Pt hybrid nanomaterial was investigated with varying temperature (from 30 °C to 65 °C) and pH (from 3.0 to 6.0). The UV-vis absorbance spectra of the experimental solutions at 652 nm are shown in Fig. 7. As can be seen, the absorbance increases in intensity with the temperature increase in the range of 30–45 °C and with a pH of 3.0–4.5, indicating that the peroxidase-like catalytic activity of the hybrid nanomaterial also correspondingly increases with increasing temperature and increasing pH in the above ranges. However, the absorbance declines with increasing temperature and pH above 45 °C and pH 4.5, respectively, indicating that the peroxidase-like catalytic activity of the Fe3O4@Au–Pt hybrid nanomaterial is repressed at temperatures higher than 45 °C and is also inhibited in less acidic solutions. This behavior is similar to that of HRP24 and other nanomaterial-based peroxidase-like mimics previously reported in the literature.56–58 Therefore, temperature of 45 °C and pH 4.5 were chosen as the optimal reaction temperature and solution pH, respectively.
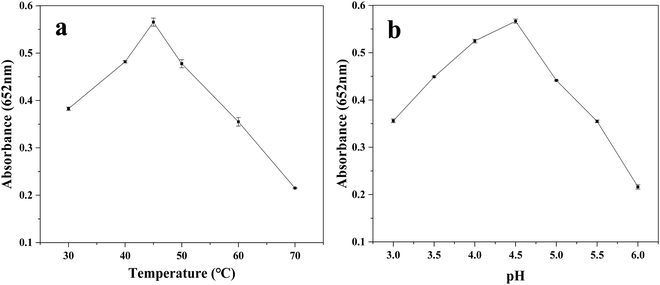 |
| | Fig. 7 Effects of temperature (a) and pH (b) on the peroxidase-like performance of the Fe3O4@Au–Pt hybrid nanomaterial. | |
3.6. Enzyme-like kinetics of the hybrid nanomaterial's peroxidase-like activity
In order to preferably explore the reaction mechanism of the Fe3O4@Au–Pt hybrid nanomaterial's peroxidase-like catalysis, we further researched the steady-state kinetics of the hybrid nanomaterial by changing the concentration of the substrate H2O2 and TMB under the optimal reaction conditions (45 °C and pH 4.5). The UV-vis absorbance of the experimental solutions was obtained at 652 nm, with the typical Michaelis–Menten curves59 toward H2O2 (Fig. 8a) and TMB (Fig. 8b). Then, the Lineweaver–Burk curves toward H2O2 and TMB were obtained through transformation and calculation, as shown in Fig. 8c and Fig. 8d. The kinetics data, Km and Vmax, can be calculated through eqn (1) and (2). The Km and Vmax values of the other previously reported systems are listed in Table 1. Km often has an effect on the affinity of the catalyst toward its substrates: a high Km represents a weak affinity and a low Km represents a high affinity.60Table 1 shows the comparison of the Km and Vmax values of the Fe3O4@Au–Pt hybrid nanomaterial and other peroxidase-like catalysts. As can be seen, the Km value of the Fe3O4@Au–Pt hybrid nanomaterial with H2O2 as the substrate is lower than the corresponding Km value for HRP and other catalysts,61–64 clearly stating the exceptional affinity of the Fe3O4@Au–Pt hybrid nanomaterial for H2O2. However, for the substrate TMB, the hybrid nanomaterial shows a higher Km value, illustrating that the affinity of the Fe3O4@Au–Pt catalysts for TMB is weaker than the TMB affinity of HRP and other metal-based catalyst systems. Due to the lower affinity of the Fe3O4@Au–Pt hybrid nanomaterial for TMB, this nanomaterial has more catalytic active sites for the H2O2 substrate. This is demonstrated by the higher concentration of TMB required to achieve high catalytic activity with Fe3O4@Au–Pt, as shown in Fig. 8. The Fe3O4@Au–Pt hybrid nanomaterial demonstrates higher catalytic activity for H2O2, showing a more sensitive response to changing H2O2 concentration compared with changing TMB concentration.
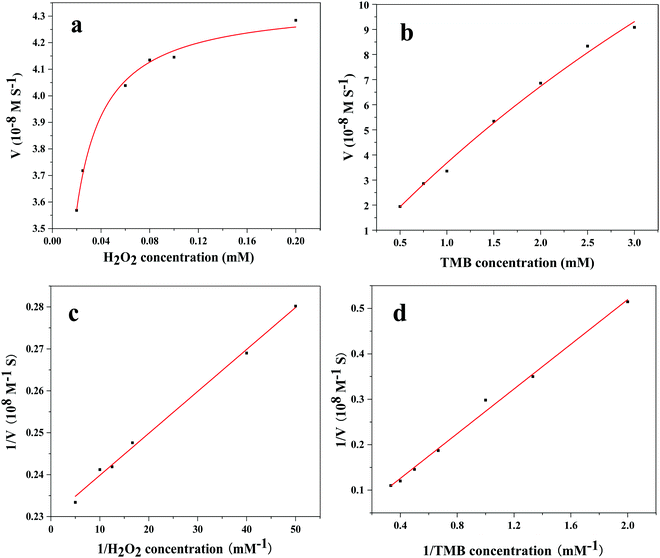 |
| | Fig. 8 Steady-state kinetics of the Fe3O4@Au–Pt hybrid nanomaterial. (a) Varying H2O2 concentration and 4 mM TMB. (b) Varying TMB concentration and 0.1 M H2O2. (c) Lineweaver–Burk plot for Fe3O4@Au–Pt and varying H2O2 concentration. (d) Lineweaver–Burk plot for Fe3O4@Au–Pt and varying TMB concentration. | |
Table 1 Comparison of the kinetics data of HRP and different nanozyme catalysts
| Nanozyme |
K
m (mM) |
V
max (10−8 M s−1) |
Ref. |
| H2O2 |
TMB |
H2O2 |
TMB |
| HRP |
3.70 |
0.434 |
8.71 |
10.00 |
24
|
| Fe3O4@SiO2–NH2–Au@Pd0.30 NPs |
3.50 |
0.090 |
6.76 |
11.20 |
61
|
| FeS2/SiO2 |
0.0126 |
0.948 |
18.10 |
31.00 |
62
|
| Fe3O4/CNDs NPs |
0.0687 |
0.105 |
30.70 |
128.00 |
63
|
| Fe3O4 QDs |
31.06 |
0.03 |
8.89 |
137.00 |
64
|
| Fe3O4@Au–Pt |
0.00435 |
8.94 |
4.35 |
36.35 |
This work |
3.7. Detection of H2O2 utilizing the hybrid nanomaterial
On the basis of the ideal peroxidase-like catalytic activity of the hybrid nanomaterial, we designed a simple and sensitive colorimetric sensor for the detection of H2O2, with the results presented in Fig. S4 (ESI†). As can be seen in Fig. S4a (ESI†), the absorbance sharply increases in step with the concentration of H2O2 from 0.05 to 120 μM, and then gradually slows down at above 120 μM. Fig. S4b (ESI†) showed that the absorbance of oxTMB and the H2O2 concentration are linearly dependent in the range from 0.05 to 120 μM (R2 = 0.9926). The LOD was down to 0.018 μM, which was calculated by the formula in eqn (3).where s is the standard deviation of the blank measurements and k is the sensitivity of the calibration graph.65 Furthermore, a comparative study on H2O2 detection was conducted to compare the peroxidase-like activity of the Fe3O4@Au-Pt hybrid nanomaterial to the activity of other nanozyme catalysts reported, with the results listed in Table S3 (ESI†). It is clear that the LOD value of this study is lower than the LOD values of other colorimetric methods using Fe–Ag2S,66 Fe3O4@C/Ni nanotubes,67 FeS2@C NSs,68 Pal@Co3O4,69 0.15Fe–CoO NCs,70 and Fe3O4@CP71 for the detection of H2O2. Obviously, the peroxidase-like activity of the Fe3O4-coupled Au–Pt heterodimer hybrid nanomaterial was significantly amplified, thereby improving the colorimetric detection ability of H2O2.
3.8. Detection of glucose utilizing the hybrid nanomaterial
H2O2 can oxidize TMB in the presence of the Fe3O4@Au–Pt hybrid nanomaterials, and the resulting oxTMB concentration and H2O2 concentration are in a direct ratio. As is well known, H2O2 concentration is closely related to the glucose concentration in the presence of Gox; therefore, when these two different catalytic reactions using Fe3O4@Au–Pt and GOx were carried out separately, the oxTMB concentration should be decided by the glucose concentration. On account of this, a simple and sensitive colorimetric sensor for detecting glucose was constructed, as illustrated in Fig. 1b, with the experimental results presented in Fig. 9. The absorbance of oxTMB is in linear correlation with the glucose concentration between 0.05 and 140 μM (R2 = 0.9983), and the LOD is calculated to be 0.025 μM.
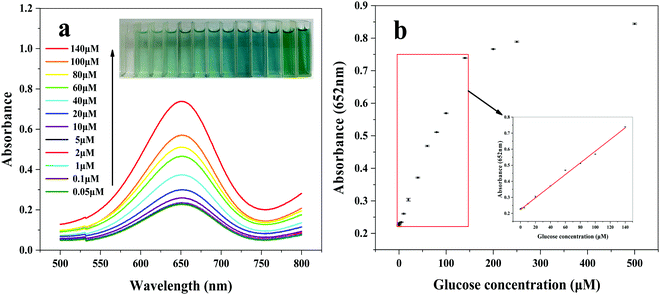 |
| | Fig. 9 (a) UV-vis absorbance spectra with different glucose concentrations (inset images of cuvettes showing color variance). (b) Dependence of absorbance at 652 nm on the glucose concentration and the corresponding linear calibration plot. The error bars symbolize the standard deviation of three surveys. | |
The linear range and LOD of glucose obtained using the Fe3O4@Au–Pt hybrid nanomaterial were compared with that using other nanozyme systems reported to use the same colorimetric method for glucose detection, as shown in Table 2. As can be seen, the LOD calculated in this study for glucose detection with the Fe3O4@Au–Pt hybrid nanomaterial is lower than the reported LODs for colorimetric glucose detection using Fe3O4@SiO2-NH2-Au@Pd0.30 NPs,61 FeS2@C NSs,68 Por-ZnFe2O4 HSs,72 C-dots/Fe2+/VB1,73 PDI- Fe3O4,74 AuNPs@C. CNF,75 and Pt-LNT NCs.76
Table 2 Comparison of the linear range and the limit of detection for glucose detection by different nanozyme catalysts
| Nanozyme |
Linear range (μM) |
LOD (μM) |
Ref. |
| Fe3O4@SiO2-NH2-Au@Pd0.30 NPs |
0.010–60 |
0.06 |
61
|
| FeS2@C NSs |
0.5–50 |
0.19 |
68
|
| Por-ZnFe2O4 HSs |
6–90 |
5.5 |
72
|
| C-dots/Fe2+/VB1 |
0.8–300 |
0.14 |
73
|
| PDI-Fe3O4 |
3–100 |
1.12 |
74
|
| AuNPs@C. CNF |
1–60 |
0.67 |
75
|
| Pt-LNT NCs |
5–1000 |
1.79 |
76
|
| Fe3O4@Au–Pt |
0.05–140 |
0.025 |
This work |
3.9. Interference experiments
In order to assess the selectivity of the colorimetric method using the Fe3O4@Au–Pt nanomaterial for glucose detection, the influence of other carbohydrates was surveyed. The effect of maltose, galactose, fructose, and sucrose on the ability of this method to detect glucose is shown in Fig. 10. As can be seen, even when the concentration of other carbohydrates was 10 times higher than that of glucose, no significant interference was seen. These results clearly illustrated the prominent selectivity of this colorimetric method for glucose detection. The high selectivity can be attributed to the specificity of GOx for glucose and the amplified peroxidase-like activity of the Fe3O4@Au–Pt hybrid nanomaterial toward H2O2.
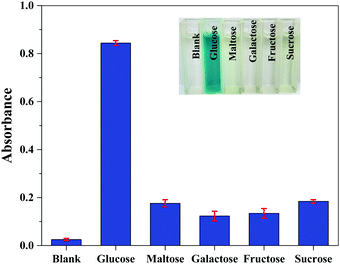 |
| | Fig. 10 Selectivity analysis of glucose based on the Fe3O4@Au–Pt hybrid nanomaterial (inset images of cuvettes showing color contrast). The concentration of glucose is 0.5 mM and the concentration of other carbohydrates is 5 mM. The error bars symbolize the standard deviation of three surveys. | |
3.10. Detection of glucose in characterized newborn bovine serum
To assess the practicality of the colorimetric method using the Fe3O4@Au–Pt nanomaterial for glucose detection in the actual samples, the recovery experiments using characterized newborn bovine serum (NBS)-added different glucose concentrations as the actual samples was devised and the results are shown in Table 3. As can be seen, the content of added glucose in NBS was determined with the recovery values in the range of 97.62–103.56% and with the relative standard deviation (RSD) in the range of 1.36–3.48. The results indicated that our constructed colorimetric sensor was practically applicable for the precise detection of trace glucose in complex samples.
Table 3 Glucose detection in spiked serum samples using the Fe3O4@Au-Pt hybrid nanomaterial colorimetric sensor
| Samples |
Glucose added (μM) |
Glucose found (μM) |
Recovery (%) |
RSD (n = 3, %) |
| 1 |
0 |
0.00 |
— |
— |
| 2 |
20 |
20.24 |
101.20 |
2.15 |
| 3 |
50 |
48.81 |
97.62 |
1.36 |
| 4 |
70 |
69.64 |
99.49 |
3.48 |
| 5 |
100 |
103.56 |
103.56 |
2.23 |
4. Conclusion
In summary, an easy route for the direct synthesis of a class of multi-metal hybrid in aqueous media that possesses excellent morphology and structure nanostructures was established. A simple and sensitive colorimetric sensor was constructed for the detection of H2O2 and glucose, and the results indicated that the Fe3O4@Au–Pt hybrid nanomaterial possessed preferable peroxidase-like activity in comparison with other nanozyme materials and excellent selectivity for glucose detection. For the unique morphology, structure, and the synergistic effect among the components of the hybrid material, this sensor can be applied to the sensitive detection of H2O2 and glucose with a good response and low LODs of 0.018 μM and 0.025 μM, respectively. Furthermore, this material demonstrates the potential for the application of hydrophilic hybrid nanostructures in sensing target analytes, biomedical diagnosis, and therapeutic applications in the future due to their specific structure and excellent catalytic property.
Conflicts of interest
There are no conflicts to declare.
Acknowledgements
This research was supported by the National Natural Science Foundation of China (21906075) and the Natural Science Foundation of Shandong Province (ZR2020MD077).
Notes and references
- K. G. Alberti and P. Z. Zimmet, Diabetic Med., 1998, 15, 539–553 CrossRef CAS.
- K. T. Hamorsky, C. M. Ensor, Y. Wei and S. Daunert, Angew. Chem., Int. Ed., 2008, 47, 3718–3721 CrossRef.
- M. W. Schwartz, R. J. Seeley, M. H. Tschop, S. C. Woods, G. J. Morton, M. G. Myers and D. D’Alessio, Nature, 2013, 503, 59–66 CrossRef CAS.
- K. Wang, R. Zhang, X. Yue, Z. Zhou, L. Bai, Y. Tong, B. Wang, D. Gu, S. Wang, Y. Qiao, Q. Liu, X. Xue, Y. Yin, R. Xi and M. Meng, ACS Sens., 2021, 6, 1543–1551 CrossRef CAS PubMed.
- J. Liu, X. Shen, D. Baimanov, L. Wang, Y. Xiao, H. Liu, Y. Li, X. Gao, Y. Zhao and C. Chen, ACS Appl. Mater. Interfaces, 2019, 11, 2647–2654 CrossRef CAS.
- S. Lin and D. G. Hardie, Cell Metab., 2018, 27, 299–313 CrossRef CAS.
- M. Zhang and Z. Li, Food Chem., 2005, 90, 785–790 CrossRef CAS.
- S. Jiang, Y. Zhang, Y. Yang, Y. Huang, G. Ma, Y. Luo, P. Huang and J. Lin, ACS Appl. Mater. Interfaces, 2019, 11, 10554–10558 CrossRef CAS.
- P. Du, Q. Niu, J. Chen, Y. Chen, J. Zhao and X. Lu, Anal. Chem., 2020, 92, 7980–7986 CrossRef CAS PubMed.
- X. Zhu, Y. Ju, J. Chen, D. Liu and H. Liu, ACS Sens., 2018, 3, 1135–1141 CrossRef CAS.
- C. Xu, Z. Song, Q. Xiang, J. Jin and X. Feng, Nanoscale, 2016, 8, 7391–7395 RSC.
- H. Chen, C. Yuan, X. Yang, X. Cheng, A. A. Elzatahry, A. Alghamdi, J. Su, X. He and Y. Deng, ACS Appl. Nano Mater., 2020, 3, 4586–4598 CrossRef CAS.
- X. Luo, J. Xia, X. Jiang, M. Yang and S. Liu, Anal. Chem., 2019, 91, 15461–15468 CrossRef CAS.
- Y. Xing, H. Si, D. Sun and X. Hou, Microchem. J., 2020, 156, 104929 CrossRef CAS.
- C. M. Riccardi, D. Mistri, O. Hart, M. Anuganti, Y. Lin, R. M. Kasi and C. V. Kumar, Chem. Commun., 2016, 52, 2593–2596 RSC.
- Y. Song, K. Qu, C. Zhao, J. Ren and X. Qu, Adv. Mater., 2010, 22, 2206–2210 CrossRef CAS.
- Y. Lin, J. Ren and X. Qu, Acc. Chem. Res., 2014, 47, 1097–1105 CrossRef CAS PubMed.
- Z. Yang, Y. Zhu, M. Chi, C. Wang, Y. Wei and X. Lu, J. Colloid Interface Sci., 2018, 511, 383–391 CrossRef CAS PubMed.
- H. Wei and E. Wang, Chem. Soc. Rev., 2013, 42, 6060–6093 RSC.
- Y. Lin, J. Ren and X. Qu, Acc. Chem. Res., 2014, 47, 1097–1105 CrossRef CAS PubMed.
- Z. Wang, X. Yang, J. Yang, Y. Jiang and N. He, Anal. Chim. Acta, 2015, 862, 53–63 CrossRef CAS PubMed.
- J. Cao, X. Jiang, H. Zhang, T. R. Croley and J. Yin, RSC Adv., 2017, 7, 52210–52217 RSC.
- W. Dong, Y. Zhuang, S. Li, X. Zhang, H. Chai and Y. Huang, Sens. Actuators, B, 2018, 255, 2050–2057 CrossRef CAS.
- L. Gao, J. Zhuang, L. Nie, J. Zhang, Y. Zhang, N. Gu, T. Wang, J. Feng, D. Yang, S. Perrett and X. Yan, Nat. Nanotechnol., 2007, 2, 577–583 CrossRef CAS PubMed.
- B. Garg, T. Bisht and Y. Ling, Molecules, 2015, 20, 14155–14190 CrossRef CAS.
- N. Kitchawengkul, A. Prakobkij, W. Anutrasakda, N. Yodsin, S. Jungsuttiwong, S. Chunta, M. Amatatongchai and P. Jarujamrus, Anal. Chem., 2021, 93, 6989–6999 CrossRef CAS PubMed.
- K. M. Tripathi, H. T. Ahn, M. Chung, X. A. Le, D. Saini, A. Bhati, S. K. Sonkar, M. I. Kim and T. Kim, ACS Biomater. Sci. Eng., 2020, 6, 5527–5537 CrossRef CAS.
- N. Zhou, S. Zou, L. Zou, R. Shen, Y. Zhou and L. Ling, Can. J. Chem., 2019, 97, 317–323 CrossRef.
- X. Feng, X. Li, H. Shi, H. Huang, X. Wu and W. Song, Anal. Chim. Acta, 2014, 852, 37–44 CrossRef CAS.
- C. Zheng, W. Ke, T. Yin and X. An, RSC Adv., 2016, 6, 35280–35286 RSC.
- J. Lu, H. Zhang, S. Li, S. Guo, L. Shen, T. Zhou, H. Zhong, L. Wu, Q. Meng and Y. Zhang, Inorg. Chem., 2020, 59, 3152–3159 CrossRef CAS PubMed.
- N. Alizadeh, A. Salimi and R. Hallaj, Talanta, 2018, 189, 100–110 CrossRef CAS PubMed.
- J. Yu, D. Ma, L. Mei, Q. Gao, W. Yin, X. Zhang, L. Yan, Z. Gu, X. Ma and Y. Zhao, J. Mater. Chem. B, 2018, 6, 487–498 RSC.
- W. He, H. Jia, X. Li, Y. Lei, J. Li, H. Zhao, L. Mi, L. Zhang and Z. Zheng, Nanoscale, 2012, 4, 3501–3506 RSC.
- J. Wang, Y. Hu, Q. Zhou, L. Hu, W. Fu and Y. Wang, ACS Appl. Mater. Interfaces, 2019, 11, 44466–44473 CrossRef CAS.
- H. Zheng, Y. Zeng, J. Chen, R. Lin, W. Zhuang, R. Cao and Z. Lin, Inorg. Chem., 2019, 58, 6983–6992 CrossRef CAS.
- T. Zhang, Y. Xing, Y. Song, Y. Gu, X. Yan, N. Lu, H. Liu, Z. Xu, H. Xu, Z. Zhang and M. Yang, Anal. Chem., 2019, 91, 10589–10595 CrossRef CAS.
- Y. Yang, Y. Wang and W. Tseng, ACS Appl. Mater. Interfaces, 2017, 9, 10069–10077 CrossRef CAS PubMed.
- L. Jin, Z. Meng, Y. Zhang, S. Cai, Z. Zhang, C. Li, L. Shang and Y. Shen, ACS Appl. Mater. Interfaces, 2017, 9, 10027–10033 CrossRef CAS.
- W. Li, B. Chen, H. Zhang, Y. Sun, J. Wang, J. Zhang and Y. Fu, Biosens. Bioelectron., 2015, 66, 251–258 CrossRef CAS.
- Y. Jv, B. Li and R. Cao, Chem. Commun., 2010, 46, 8017–8019 RSC.
- G. Schmid, A. Lehnert, J. Malm and J. Bovin, Angew. Chem., Int. Ed. Engl., 1991, 30, 874–876 CrossRef.
- C. E. Chan-Thaw, L. Chinchilla, S. Campisi, G. A. Botton, L. Prati, N. Dimitratos and A. Villa, ChemSusChem, 2015, 8, 4189–4194 CrossRef CAS.
- Z. Liu, J. Wang, D. Xie and G. Chen, Small, 2008, 4, 462–466 CrossRef CAS PubMed.
- B. Pant, M. Park, J. Lee, H. Kim and S. Park, J. Colloid Interface Sci., 2017, 496, 343–352 CrossRef CAS.
- T. Yamashita and P. Hayes, Appl. Surf. Sci., 2008, 254, 2441–2449 CrossRef CAS.
- J. Gao, X. Ran, C. Shi, H. Cheng, T. Cheng and Y. Su, Nanoscale, 2013, 5, 7026–7033 RSC.
- Y. Liu, Y. Wang, S. Zhou, S. Lou, L. Yuan, T. Gao, X. Wu, X. Shi and K. Wang, ACS Appl. Mater. Interfaces, 2012, 4, 4913–4920 CrossRef CAS.
- J. Radnik, C. Mohr and P. Claus, Phys. Chem. Chem. Phys., 2003, 5, 172–177 RSC.
- A. Hardiansyah, A. Chen, H. Liao, M. Yang, T. Liu, T. Chan, H. Tsou, C. Kuo, J. Wang and Y. Wang, Nanoscale Res. Lett., 2015, 10, 412 CrossRef PubMed.
- F. Raynal, A. Etchberry, C. Reynaud and H. Perez, Appl. Surf. Sci., 2004, 236, 198–207 CrossRef CAS.
- R. Hull, L. Li, Y. Xing and C. Chusuei, Chem. Mater., 2006, 18, 1780–1788 CrossRef CAS.
- J. Mu, Y. Wang, M. Zhao and L. Zhang, Chem. Commun., 2012, 48, 2540–2542 RSC.
- Q. Wang, L. Zhang, C. Shang, Z. Zhang and S. Dong, Chem. Commun., 2016, 52, 5410–5413 RSC.
- W. He, Y. Liu, J. Yuan, J. Yin, X. Wu, X. Hu, K. Zhang, J. Liu, C. Chen, Y. Ji and Y. Guo, Biomaterials, 2011, 32, 1139–1147 CrossRef CAS.
- W. Shi, Q. Wang, Y. Long, Z. Cheng, S. Chen, H. Zheng and Y. Huang, Chem. Commun., 2011, 47, 6695–6697 RSC.
- X. Heng., Q. Lian, L. Zhou, Y. Jiang and J. Gao, ACS Sustainable Chem. Eng., 2021, 9, 7030–7043 CrossRef.
- D. Guo, C. Li, G. Liu, X. Luo and F. Wu, ACS Sustainable Chem. Eng., 2021, 9, 5412–5421 CrossRef CAS.
- M. Golicnik, Anal. Biochem., 2010, 406, 94–96 CrossRef CAS PubMed.
- Y. Liu and F. Yu, Nanotechnology, 2011, 22, 145704 CrossRef.
- O. Adeniyi, S. Sicwetsha and P. Mashazi, ACS Appl. Mater. Interfaces, 2020, 12, 1973–1987 CrossRef CAS.
- X. Huang, F. Xia and Z. Nan, ACS Appl. Mater. Interfaces, 2020, 12, 46539–46548 CrossRef CAS.
- N. Luo, Z. Yang, F. Tang, D. Wang, M. Feng, X. Liao and X. Yang, ACS Appl. Nano Mater., 2019, 2, 3951–3959 CrossRef CAS.
- S. R. Ahmed, J. Cirone and A. Chen, ACS Appl. Nano Mater., 2019, 2, 2076–2085 CrossRef CAS.
- X. Fu, L. Chen, J. Li, M. Lin, H. You and W. Wang, Biosens. Bioelectron., 2012, 34, 227–231 CrossRef CAS PubMed.
- Y. Ding, H. Liu, L. Gao, M. Fu, X. Zhang, Q. Liu and R. Zeng, J. Alloys Compd., 2019, 785, 1189–1197 CrossRef CAS.
- H. Peng, J. Zhang, C. Zeng, C. Zhou, Q. Li, N. Lu and L. Wang, ACS Appl. Bio Mater., 2020, 3, 5111–5119 CrossRef CAS.
- W. Ding, H. Liu, W. Zhao, J. Wang, Y. Yao, C. Yao and C. Song, ACS Appl. Bio Mater., 2020, 3, 5905–5912 CrossRef CAS.
- P. Chen, H. Zhong, X. Li, M. Li and S. Zhou, Appl. Clay Sci., 2021, 209, 106109 CrossRef CAS.
- J. Lian, Y. He, N. Li, P. Liu, Z. Liu and Q. Liu, Inorg. Chem., 2021, 60, 1893–1901 CrossRef CAS.
- G. Liu, H. Liu, H. Xu, L. Zhu, C. Su, C. Gu and L. Li, Spectrochim. Acta, Part A, 2020, 239, 118544 CrossRef CAS PubMed.
- B. Bian, Q. Liu and S. Yu, New J. Chem., 2018, 42, 18189–18200 RSC.
- T. Liu, S. Zhang, W. Liu, S. Zhao, Z. Lu, Y. Wang, G. Wang, P. Zou, X. Wang, Q. Zhao and H. Rao, Sens. Actuators, B, 2020, 305, 127524 CrossRef CAS.
- M. Chen, L. Sun, Y. Ding, Z. Shi and Q. Liu, New J. Chem., 2017, 41, 5853–5862 RSC.
- M. Alle, S. C. Park, R. Bandi, S. Lee and J. Kim, Carbohydr. Polym., 2021, 253, 117239 CrossRef CAS.
- L. Dong, R. Li, L. Wang, X. Lan, H. Sun, Y. Zhao and L. Wang, Int. J. Biol. Macromol., 2021, 172, 289–298 CrossRef CAS.
Footnote |
| † Electronic supplementary information (ESI) available. See DOI: 10.1039/d1nj04491e |
|
| This journal is © The Royal Society of Chemistry and the Centre National de la Recherche Scientifique 2022 |
Click here to see how this site uses Cookies. View our privacy policy here.  *
*


