Electrical conductivity studies and correlated barrier hopping transport in Europium-doped graphene oxide nanocomposites
I.
Dhanya
 *a,
S.
Heera
a,
Soosen
Samuel M.
a and
Sreejith K.
Pisharady
b
aDepartment of Physics, Catholicate College, Pathanamthitta, Kerala, India. E-mail: dhanya.iv@gmail.com
bDepartment of Physics, Sanatana Dharma College, Alappuzha, Kerala, India
First published on 7th December 2021
Abstract
Graphene oxide was prepared using the modified Hammers method. Europium nitrate of varying concentrations was added to obtain different composites. The morphology of doped samples was analyzed by atomic force microscopy. The folded-sheet-like pattern on the surface is an evidence of the rolling of graphene layers. X-ray diffraction patterns for doped samples were obtained, which show polycrystalline nature; the structure remains unchanged after doping with europium. Optical studies, including UV-visible spectrum analysis, reveal that europium-doped graphene oxide possesses an extremely wide band gap energy. Graphene oxide and the doped samples were subjected to thermal conductivity analysis. Arrhenius plot directly gives the activation energy in the intrinsic and extrinsic regions due to the presence of rare-earth impurity, such as europium ions, along with the graphene oxide. Hopping level conduction in doped samples was analyzed using the correlated barrier hopping model, and different hopping conduction parameters were thereby identified.
Introduction
The electrical conductivity of graphene-based composites has drawn much attention in molecular electronics for their energy transport and storage applications.1 Both organic and inorganic materials are extensively used for supercapacitor fabrication due to their capability of storing electrical energy, facilitated by their porous morphology, charge transport properties and wide optical band gap.2,3 Graphene and its composites constitute the prime components for supercapacitor application due to the storage ability of their nanoporous carbon layers.4 Apart from pure graphene oxide (GO) and its reduced oxide layers, impurities such as transition metal ions and their oxides present excellent materials for supercapacitor application.5Even though there are several methods for the synthesis of reduced graphene oxide, the modified Hammers method is quite promising for the large-scale preparation of graphene oxide and reduced graphene oxide.6 Nanoporous behaviour, together with the electric energy storage in GO, makes it an effective material for gas sensing applications.7 Hot probe analysis studies on GO explore n-type conductivity.8 High thermal stability, together with fast electron transport through the layers, render GO one of the promising materials for electrical and electronic devices.9
Graphene oxide can be used in making composites with polymers, inorganic materials and organic monomers due to the strong van der Waals forces between the sheets.10–12 Nanocomposites of graphene oxide have attracted much attention in research related to electromagnetic behaviour and sensing applications due to their storage and structural analogues.13,14 Excellent electron transport properties, together with the nanoporous nature of graphene, are usually taken into account while choosing it as the base material for the preparation of nanocomposites.15 The high cost involved in the production of carbon nanotube-based nanocomposites can be reduced by doping graphene oxide with fillers. Meanwhile, the performance of both materials in electrical devices are comparable, in terms of mobility of charge carriers and transverse electrical properties.16,17
The latest applications of graphene oxides include functionalization of face mask materials to inhibit the rate of infections from SARS-CoV-2 virus, wearable biosensing applications, and supercapacitor electrode applications with suitable polymer nanocomposites.18–20 Here, graphene oxide is prepared by the modified Hammers method, and different concentrations of Eu3+ ions are added to GO to obtain europium-doped graphene oxide composites. Morphological and structural studies reveal the nano-level properties of the composite. AC conductivity was analysed over an angular frequency range of 0.1 × 10⁶ rad per s to 5 × 10⁶ rad per s and temperature range of 308–373 K. DC electrical conductivity with the variation of temperature was studied using Arrhenius plot, and hopping of charge carriers was found in europium(III)-doped graphene oxide nanosheets by applying the correlated barrier hopping (CBH) model.21
Experimental
Graphite powder (purity 99.999%) procured from Sigma Aldrich was used as the prime material. Graphene oxide was prepared from source powder using the modified Hammers method. It includes three reaction steps as follows, under (1) low, (2) moderate, and (3) high temperature. One gram graphite powder was mixed with 0.5 g sodium nitrate. 23 mL of 98% sulphuric acid was added to the mixture, which was kept in an ice bath with continuous stirring for 30 minutes. 3 g potassium permanganate was added slowly to the mixture and continuously stirred for 3 hours. The solution was transferred to a 35 °C water bath for half an hour. Then, 46 mL deionized water was added to the solution, which was kept stirring at a temperature of 95 °C for 30–45 minutes. 140 mL deionized water was added rapidly, followed by 10 mL hydrogen peroxide solution, to the above mixture to stop the oxidation process. The resultant dark-yellow residue was filtered using Whatman small-pore filter paper and further cleaned by washing several times with 5% HCl solution and deionized water. Unexfoliated oxide was eliminated from the sample by ultrasonication and microcentrifugation under 4000 rpm for 30 minutes. The resultant sample was collected and dried. Europium(III) nitrate was added to graphene oxide powder in the weight percentages defined as (GO)100−x (Eu3+)x where the weight percentage of x is 10%, 20% and 30%. They are respectively labelled as sample 1 [each 100 mg Eu3+-doped GO contains 10 mg Eu3+ with 90 mg GO], sample 2 [each 100 mg Eu3+-doped GO contains 20 mg Eu3+ with 80 mg GO] and sample 3 [each 100 mg Eu3+-doped GO contains 30 mg Eu3+ with 70 mg GO], and the pure GO was labelled as sample 4.Concentration was made uniform in doped samples by further sonication for another 30 minutes. Vacuum annealing was done on the entire samples at 60 °C for 12 hours to obtain the black fine powder of europium-doped graphene oxide composite. Composite samples and pure graphene oxide were subjected to various characterizations. Morphological analysis was done on samples by analysing the atomic force microscopic image taken using WiTec Alpha 300RA atomic force microscope coupled with a CCD camera of pixel size 24 microns and a resolution of 0.2 nm. The X-ray diffractogram was taken using a Bruker D8 advance powder X-ray diffractometer. The optical behaviour of rare-earth-doped GO was examined well by means of UV-visible absorption spectra using a UV2600 instrument with the integrating sphere attachment ISR-2600 plus in a wide wavelength range from 200 nm to 1400 nm. The thermal conductivity behaviour of GO and europium-doped GO nanocomposite was analysed using a DC electrometer set up using two probes. Both graphene oxide and europium-doped GO powder were converted into pellets by applying 5 tons of uniaxial force for 5 minutes using a hydraulic press. Pellets thus prepared had a diameter of 10 mm and thickness of 1.5 mm. Pellets were placed in a tube furnace for taking measurements at various temperatures. The temperature control and monitor was used with a DPI-1100 dry temperature calibrator coupled with a Keithley electrometer model 2450. The AC electrical conductivity was measured using a HIOKI 3532-5 LCR meter. Silver electrodes were used to connect pellets with the instrument by applying silver paste as ohmic contact.
Result and discussion
Morphological studies
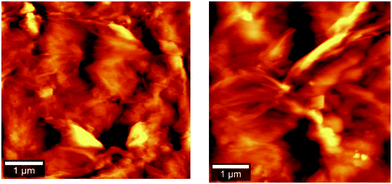
The surface morphology of the sample was examined by forming a thin layered surface of powdered material by ultrahigh vacuum sputtering. Thin films of 100 nm thickness were micro-scanned using contact mode AFM analysis. The 2D AFM images for europium-doped GO (sample 3) and pure GO (sample 4) are shown in Fig. 1. The surface morphology of the AFM image for graphene oxide was modified from thick folded sheets to a narrow sheet, and columnar growth was confirmed along the Z-axis with reduced pores in between the layers. The columnar growth may be due to the rolling of graphene sheets into carbon nanotubes as facilitated by europium. The AFM image was further analysed by Gwyddion software.The relative RMS surface roughness of the doped sample (sample 3), RD, with respect to GO, RG, is determined by the following equation:22
 | (1) |
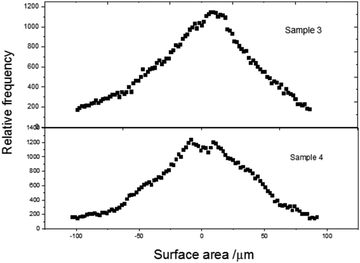
Fig. 2 presents the height profiles for graphene oxide and doped samples. Apart from the GO nanosheets, doped sample layers have no frequency splitting, and the surface area is enhanced. This may be due to the filling of doped rare earth materials in the nanoporous surface topology of the graphene oxide layer. The rolling of GO layer to form carbon nanotubes is prominent in sample 4, while the length of nanotubes is shortened in sample 3, with reduced pores on the surface. The relative RMS surface roughness values are tabulated in Table 1.
| Samples | R (%) | D (nm) | S |
|---|---|---|---|
| Sample 1 | 68.07 | 75.63 | 0.0518 |
| Sample 2 | 57.38 | 77.43 | 0.0496 |
| Sample 3 | 54.23 | 73.29 | 0.0478 |
| Sample 4 | — | 79.97 | 0.0554 |
Structural studies
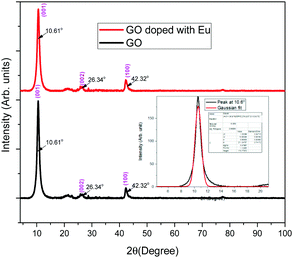
Typical XRD diagrams of europium-doped GO (sample 3) and GO (sample 4) are shown in Fig. 3. XRD analysis confirms the reduction of graphite to graphene oxide, with a sharp peak at 2θ = 10.61° and a minor peak at 42.32° in both the composite and bare graphene oxide powders.The peak at 2θ = 26.34° corresponds to the reduced graphene oxide. Further, there is no change in the structure due to the presence of composite. According to the standard XRD data of graphite with JCPDS card number 41-1478, the characteristic peak near 26° is suppressed by the prominent orientation of the peak near 10.61° due to the presence of oxygen functional group in graphite, which has a hexagonal carbon lattice, like graphene. The average particle size is calculated using the Scherer equation:
 | (2) |
Optical studies
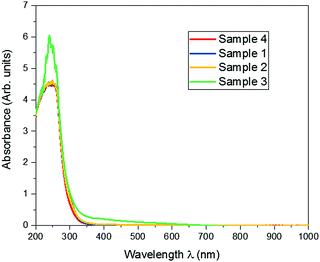
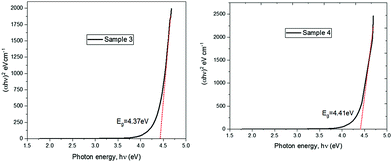
Optical absorption spectra were recorded in a wavelength ranging from 200 to 900 nm. The absorption spectra of samples 1–4 are shown in Fig. 4. It is observed from the figure that the absorption peak is at 250 nm wavelength. This confirms that the prepared GO and the dopant-added samples with lower concentrations have the same maximum absorbance, while this increases with highest concentration of europium (30%)-added samples.Band gap energy for the doped samples with respect to the pure graphene oxide was explored in the Tauc plot, as shown in Fig. 5.24 The band gap energy for graphene oxide is not much altered by the presence of europium ions, with the ultrawide band gap energy of 4.4 eV.
DC electrical conductivity studies
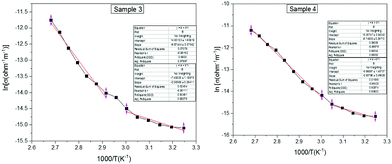
Low-temperature conductivity is significant in graphene-based organic materials. Temperature dependence on dark conductivity is measured in a low temperature region from 303 to 373 K using two-probe analysis of samples 1–4. It is found that the conductivity of all the samples decreases with an increase in temperature. This indicates that the low-temperature samples possess greater semiconducting properties than the heated samples. The Arrhenius plot displayed in Fig. 6 shows a semi-logarithmic nature for all samples.25 From the Arrhenius equation (eqn (3)), the activation energy for both the intrinsic region and that due to dopant can be evaluated as Ea1 and Ea2. | (3) |
| Samples | E a1 (eV) | E a2 (eV) | T 0 (K) X1010 | N(EF) (m−3 Ev−1) | R A0 | W (eV) |
|---|---|---|---|---|---|---|
| Sample 1 | 1.527 | 0.424 | 52.17 | 3.56 × 1030 | 2.49 | 5.32 |
| Sample 2 | 1.259 | 0.417 | 28.34 | 6.55 × 1030 | 2.14 | 4.57 |
| Sample 3 | 0.815 | 0.204 | 5.35 | 34.71 × 1030 | 1.41 | 3.01 |
| Sample 4 | 0.809 | 0.243 | 4.30 | 43.19 × 1030 | 1.33 | 2.85 |
Barrier hopping theory can be implemented for europium-doped graphene oxide, since the theory can successfully explain the conduction mechanism in a wide variety of organic materials with inorganic or rare-earth doped polymers.26,27 The best experimental fit for the present sample is associated with the 3-dimensional variable range hopping model (3D-VRH). The theory of VRH mechanism proposed by Mott and Davis is applicable to different organic semiconductors reported by different authors.28,29
 | (4) |
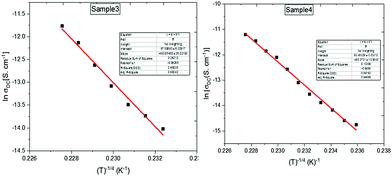
Plots containing loge σDC(T) vs. T−1/4 are shown in Fig. 7, yielding the Mott characteristic temperature T0. From To, the density of states near Fermi level can be determined by the relation:
 | (5) |
| R = [9/8 πσKTN(EF)]¼ | (6) |
The energy required for variable range hopping can be found by the equation
| W = K (T0T3)¼ | (7) |
Different hopping parameters are calculated and listed in Table 2.
Hopping transport in europium-doped graphene oxide is prominent due to the hopping of electrons in the defect sites of carbon and the hopping of electrons due to the presence of impurity atoms of europium in a localized state, which creates a potential well due to atomic polarization. The extrinsic activation energy is reduced with the percentage of doping, since europium ions create an extrinsic level near the conduction band for better transport mechanism. Apart from the undoped samples, Eu3+-doped graphene oxide composite needs a much lower energy to cross over between the bands. The energy needed for hopping and the distance between the hopping sites are rather reduced with the increasing concentration of rare-earth element. The polycrystalline property of the composite structures also affects the electrical conductivity of the charged states, which is limited within the depleted region and offers impedance in the path of thermionic emission.31
AC electrical conductivity studies
Recently, conductivity in organic-based composites has invited more attention for their varying frequencies and temperatures. Even though most organic materials have stable conductance at low-frequency range, a few materials resemble the high-frequency constant conductivity of inorganic materials.32,33 This is mainly contributed by organic–inorganic composites and graphene-based composites.34 The overall conductivity of a material, σt, can be described by Joncher's universal dynamic response (UDR) relation35| σT = σDC + σAC | (8) |
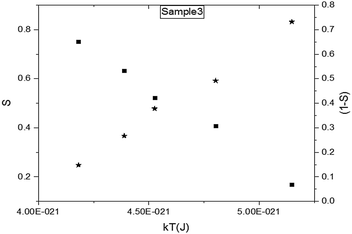
| σAC = Aωs | (9) |
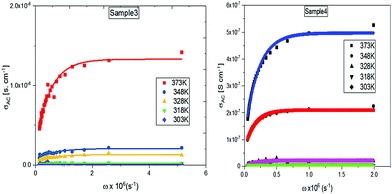
The variation of AC conductivity with respect to ω for different temperatures are shown in Fig. 9. It is found that the conductivity remains almost constant at high frequencies, while an exponential growth towards the lower values is noticed. There is an increase in conductivity for doped samples from the pure graphene oxide. One of the most widely used models to explain AC conductivity in the low-temperature region of organic materials and their doped composites is correlated to the bipolaron hopping mechanism.
The activation energy required for this process is very high, and its effect is rather reduced in the high-temperature region. The density of charge carriers near the bipolaron hopping centres, N0, generated by conversion of neutral defects can be evaluated through the expression
N = N0 exp![[thin space (1/6-em)]](https://www.rsc.org/images/entities/char_2009.gif) [Ueff/2kT] [Ueff/2kT] | (10) |
 | (11) |
The hopping distance at a frequency can be calculated by
 | (12) |
 | (13) |
![[thin space (1/6-em)]](https://www.rsc.org/images/entities/char_2009.gif) 000 s−1
000 s−1
| Samples | T (K) | W m (eV) | R w (nm) | τ 0 (A0) |
|---|---|---|---|---|
| Sample 4 | 303 | 0.039 | 3.462 | 2.753 |
| 328 | 0.063 | 3.587 | 1.654 | |
| 348 | 0.068 | 3.681 | 0.079 | |
| 373 | 0.108 | 3.789 | 0.116 |
AC conductivity studies show that the best experimental fit is achieved for the lower-temperature region. This is because at very high temperature, the mechanism for AC conductivity changes from correlated barrier hopping to either quantum mechanical tunnelling or small polaron tunnelling. Hopping by impurities like europium is prominent in the hopping sites for low temperature, which may be the reason for the lower barrier energy and hopping distance. The decrease in relaxation time towards the high-temperature region accounts for the changing of bipolaron hopping to single polaron by acquiring more energy to transfer electrons.
Conclusions
Graphene oxide was prepared by modified Hammers method and doped with varying concentrations of europium ions. The surface morphology and structure of the samples were analysed by AFM and XRD, respectively. Optical absorption studies for all samples show that europium-doped and undoped graphene oxide samples possess ultrawide band gap energy. DC electrical conductivity under two-probe method was adopted to obtain the activation enthalpy. Analysis of variable range hopping was carried out to understand the transport mechanism of charge carriers through the doped and undoped graphene oxide layers. Low-temperature AC conductivity in the samples proposes the best suit of bipolaron transport mechanism in samples with the correlated barrier hopping model. Europium-doped graphene oxide composites are found to be characterized with a small extrinsic activation energy and hopping distance, achieving better conductivity compared to pure graphene oxide samples.Author contributions
I Dhanya PhD: Idea of this research work, experimental data collection, coding of results, writing the article; Heera S MSc.: Laboratory work, data collection and coding of characterisations like AFM, optical absorption spectra; Sreejith K. Pisharady, PhD: DC electrical conductivity studies, data analysis, hopping conduction parameters calculation, coding the results; Soosen M. Samuel, PhD: AC electrical conductivity studies, data analysis, CBH model explanation and parameter calculations.Conflicts of interest
There are no conflicts to declare.Acknowledgements
The authors acknowledge KSCSTE, Government of Kerala and the DST, Government of India for the research facilities provided under the SARD (No. 612/2016/KSCSTE) and FIST schemes (SR/FIST/College-238/2014(c)) respectively.References
- D. R. Dreyer, S. Park, C. W. Bielawsk and R. S. Ruoff, Chem. Soc. Rev., 2010, 39, 228–240, 10.1039/B917103G.
- P. K. Jha, S. K. Singh, V. Kumar, S. Rana, S. Kurungot and N. Ballav, Chem, 2017, 3, 846–860 CAS.
- M. Sang, J. Shin, K. Kim and K. J. Yu, Nanomaterials, 2019, 9, 374, DOI:10.3390/nano9030374.
- P. Hao, Z. Zhao, Y. Leng, J. Tian, Y. Sang, R. Boughton, C. P. Wong, H. Liu and B. Yang, Nano Energy, 2015, 15, 9–23, DOI:10.1016/j.nanoen.2015.02.035.
- C. Jing, Y. Huang, L. Xia, Y. Chen, X. Wang, X. Liu, B. Dong, F. Dong, S. Lie and Y. Zhang, Appl. Surf. Sci., 2019, 496, 143700, DOI:10.1016/j.apsusc.2019.143700.
- J. Wu, K. Tao, J. Miao and L. K. Norford, ACS Appl. Mater. Interfaces, 2015, 7(49), 27502–27510, DOI:10.10.1021/acsami.5b09695.
- G. Venugopal, R. Krishnamoorthy, R. Mohan and S. J. Kim, Mater. Chem. Phys., 2012, 132, 29–33, DOI:10.1016/j.matchemphys.2011.10.040.
- O. O. Ekiz, M. Urel, H. Guner, A. K. Mizrak and A. Dana, Acs Nano, 2011, 5, 2475–2482, DOI:10.1021/nn1014215.
- Y. Z. Dustin, K. J. James and M. Tour, Adv. Mater., 2012, 24, 4924–4955, DOI:10.1002/adma.201202321.
- D. Xiang, Y. H. Pang, B. Li, R. Vajtai, L. Xu, P. G. Ren, J. H. Wang and Z. M. Li, Adv. Funct. Mater., 2015, 25, 559–566, DOI:10.1002/adfm.201403809.
- H. Moussa, E. Girot, K. Mozet, H. Alem, G. Medjahdi and R. Schneider, Appl. Catal., B, 2016, 185, 11–21, DOI:10.1016/j.apcatb.2015.12.007.
- O. Tovide, N. Jahed, C. E. Sunday, K. Pokpas, R. F. Ajayi, H. R. Makelane, K. M. Molapo, S. V. John, P. G. Baker and E. I. Iwuoha, Sens. Actuators, B, 2014, 15, 184–192, DOI:10.1016/j.snb.2014.07.116.
- N. Gill, V. Gupta, M. Tomar, A. L. Sharma, O. P. Pandey and D. P. Singh, Compos. Sci. Technol., 2020, 192, 108113, DOI:10.1016/j.compscitech.2020.108113.
- W. Li, X. Geng, Y. Guo, J. Rong, Y. Gong, L. Wu, X. Zhang, P. Li, J. Xu, G. Cheng, M. Sun and L. Liu, ACS Nano, 2011, 5(9), 6955–6961, DOI:10.1021/nn201433r.
- C. Wan and B. Chen, J. Mater. Chem., 2012, 22, 3637, 10.1039/c2jm15062j.
- Y. Wang, Y. Chen, S. D. Lacey, L. Xu, H. Xie, T. Li, V. A. Danner and L. Hu, Mat. Today, 2018, 21(2), 186–192, DOI:10.1016/j.mattod.2017.10.008.
- J. Wu, Y. Yang, Y. Qu, X. Xu, Y. Liang, S. T. Chu, B. E. Little, R. Morandotti, B. Jia and D. J. Moss, Laser Photonics Rev., 2019, 13(9), 1900056, DOI:10.1002/lpor.201900056.
- F. De Maio, V. Palmieri and G. Babini, et al. , iscience, 2021, 24, 102788, DOI:10.1016/j.isci.2021.102788.
- G. Yildiz, M. B. Warberg and F. Awajac, Acta Biomater., 2021, 131, 62, DOI:10.1016/j.actbio.2021.06.047.
- A. Thadathil, Y. A. Ismail and P. Periyat, RSC Adv., 2021, 11, 35828–35841, 10.1039/D1RA04946A.
- M. Yasin, T. Tauqeer, S. M. H. Zaidi, S. E. San, A. Mahmood, M. E. Köse, B. Canimkurbey and M. Okutang, Thin Solid Films, 2015, 590, 118–123, DOI:10.1016/j.tsf.2015.07.042.
- Y. Mao, Q. Huang, B. Meng, K. Zhou, G. Liu, A. Gugliuzza, E. Drioli and W. Jin, J. Membr. Sci., 2020, 611, 118364, DOI:10.1016/j.memsci.2020.118364.
- L. Stobinski, B. Lesiak, A. Malolepszy, M. Mazurkiewicz, B. Mierzwaa, J. Zemek, P. Jiricek and I. Bieloshapka, J. Ele. Mic. Rel. Phen., 2014, 195, 145–154, DOI:10.1016/j.elspec.2014.07.003.
- A. Singh, N. Sharma, M. Arif and R. S. Katiyar, J. Mater. Res., 2019, 32, 652–660, DOI:10.1557/jmr.2019.32.
- I. Jung, D. A. Field, N. J. Clark, Y. Zhu, D. Yang, R. D. Piner, S. Stankovich, D. A. Dikin, H. Geisler, C. A. Ventrice, Jr. and R. S. Ruoff, J. Phys. Chem. C, 2009, 113, 18480–18486, DOI:10.1021/jp904396j.
- A. Y. Yassin, A. Raouf Mohamed, A. M. Abdelghany and E. M. Abdelrazek, J. Mater. Sci.: Mater. Electron., 2018, 29, 15931–15945, DOI:10.1007/s10854-018-9679-7.
- P. Moni, M. Wilhelm and K. Rezwanab, RSC Adv., 2017, 7, 37559, 10.1039/C7RA01937H.
- J. J. Bae, J. H. Yoon, S. Jeong, B. H. Moon, J. T. Han, H. J. Jeong, G. W. Lee, H. R. Hwang, Y. H. Lee, S. Y. Jeong and S. C. Lim, Nanoscale, 2015, 7, 15695–15700, 10.1039/C5NR04039F.
- H. Hosono and M. Kitano, Chem. Rev., 2021, 121(5), 3121–3185, DOI:10.1021/acs.chemrev.0c01071.
- B. Movaghar, L. O. Jones, M. A. Ratner, G. C. Schatz and K. L. Kohlstedt, J. Phys. Chem. C, 2019, 123, 29499, DOI:10.1021/acs.jpcc.9b06250.
- Y. V. M. Reddy, B. Sravani, H. Maseed, T. Łuczak, M. Osińska, L. SubramanyamSarma, V. V. S. S. Srikanth and G. Madhavi, New J. Chem., 2018, 42, 16891–16901, 10.1039/C8NJ03894E.
- A. Ahmed, M. N. Siddique, T. Ali and P. Tripathi, Adv. Powder Technol., 2018, 29, 3415, DOI:10.1016/j.apt.2018.09.026.
- T. Kavinkumar and S. Manivannan, Vacuum, 2018, 148, 149–157, DOI:10.1016/j.vacuum.2017.11.019.
- J. Jyoti, A. Kumar, S. R. Dhakate and B. P. Singh, Pol. Tes., 2018, 68, 456–466, DOI:10.1016/j.polymertesting.2018.04.003.
- S. Rao, J. Upadhyay, K. Polychronopoulou, R. Umer and R. Das, J. Compos. Sci., 2018, 2, 25, DOI:10.3390/jcs2020025.
- G. Kandhol, H. Wadhwa, S. Chand, S. Mahendia and S. Kumar, Vacuum, 2019, 160, 384–393, DOI:10.1016/j.vacuum.2018.11.051.
- P. Jaiswal and D. K. Dwivedi, Mater. Res. Express, 2019, 6, 015202, DOI:10.1088/2053-1591/aae2e8.
| This journal is © The Royal Society of Chemistry and the Centre National de la Recherche Scientifique 2022 |

