
 Open Access Article
 This Open Access Article is licensed under a Creative Commons Attribution-Non Commercial 3.0 Unported Licence
The enhanced photocatalytic performance and first-principles computational insights of Ba doping-dependent TiO2 quantum dots
Muhammad
Ikram
 *a,
Muhammad Ahsan
Ul Haq
b,
Ali
Haider
c,
Junaid
Haider
d,
Anwar
Ul-Hamid
e,
Iram
Shahzadi
f,
Muhammad Ahsaan
Bari
a,
Salamat
Ali
b,
Souraya
Goumri-Said
g and
Mohammed Benali
Kanoun
h
*a,
Muhammad Ahsan
Ul Haq
b,
Ali
Haider
c,
Junaid
Haider
d,
Anwar
Ul-Hamid
e,
Iram
Shahzadi
f,
Muhammad Ahsaan
Bari
a,
Salamat
Ali
b,
Souraya
Goumri-Said
g and
Mohammed Benali
Kanoun
h
aSolar Cell Applications Research Lab, Department of Physics, Government College University Lahore, Lahore, 54000, Punjab, Pakistan. E-mail: dr.muhammadikram@gcu.edu.pk
bDepartment of Physics, Riphah Institute of Computing and Applied Sciences (RICAS), Riphah International University, 14 Ali Road, Lahore, Pakistan
cDepartment of Clinical Medicine and Surgery, University of Veterinary and Animal Sciences, Lahore 54000, Punjab, Pakistan
dTianjin Institute of Industrial Biotechnology, Chinese Academy of Sciences, Tianjin 300308, China
eCenter for Engineering Research, Research Institute, King Fahd University of Petroleum & Minerals, Dhahran, 31261, Saudi Arabia
fPunjab University College of Pharmacy, University of the Punjab, 54000, Pakistan
gCollege of Science, Physics Department, Alfaisal University, P. O. Box 50927, Riyadh 11533, Saudi Arabia
hDepartment of Physics, College of Science, King Faisal University, P. O. Box 400, Al-Ahsa, 31982, Saudi Arabia
First published on 16th August 2022
Abstract
Degradation in the presence of visible light is essential for successfully removing dyes from industrial wastewater, which is pivotal for environmental and ecological safety. In recent years, photocatalysis has emerged as a prominent technology for wastewater treatment. This study aimed to improve the photocatalytic efficiency of synthesized TiO2 quantum dots (QDs) under visible light by barium (Ba) doping. For this, different weight ratios (2% and 4%) of Ba-doped TiO2 QDs were synthesized under ambient conditions via a simple and modified chemical co-precipitation approach. The QD crystal structure, functional groups, optical features, charge-carrier recombination, morphological properties, interlayer spacing, and presence of dopants were analyzed. The results showed that for 4% Ba-doped TiO2, the effective photocatalytic activity in the degradation process of methylene blue (MB) dye was 99.5% in an alkaline medium. Density functional theory analysis further corroborated that the band gap energy was reduced when Ba was doped into the TiO2 lattice, implying a considerable redshift of the absorption edge due to in-gap states near the valence band.
1. Introduction
Freshwater reservoirs are getting more drained and polluted due to their use in various industrial fields, notably garment industries. Freshwater supplies are constantly getting depleted due to population growth and extended droughts, and the world now faces a massive problem in fulfilling the expanding needs for potable water.1–4 Approximately 750 million people on the planet are suffering from a shortage of clean water, and an increase in the supply of micropollutants in water has proven dangerous to the environment. Industries including textiles, polycarbonate, paper printing, foodstuff, and chemicals are the primary water pollution sources.5–7 Industrial dyes can cause major sicknesses in animals and humans, such as cancer, skin irritability, numerous respiratory ailments, allergies, and liver malfunctions.8 It is reported that 15% of dyes are directly discharged into the environment. Some traditional approaches, including advanced oxidation processes,9 adsorption,10 flocculation and coagulation,11 electrocoagulation,12 and photocatalytic degradation,13 are utilized in wastewater treatment. These methods have some flaws, such as inadequate removal and the formation of secondary contaminants. Besides these, photocatalytic activity (PCA) in the presence of metal oxide semiconductors is recognized as an effective approach for removing contaminants from wastewater.14Many metal oxide semiconductors (Fe2O3, TiO2, MgO, and WO3) are widely used for photocatalytic dye degradation due to their excellent chemical stabilization, low toxicity, and broad band gap. Among them, titanium dioxide (TiO2) has versatile characteristics such as a large band gap, high physiochemical stability, zero toxicity, high oxidative power, inexpensiveness, effective bactericidal potential, and photocatalytic activity under UV light.15–17 TiO2 naturally exists in three crystalline phases: anatase (tetragonal), rutile (tetragonal), and brookite (orthorhombic).18,19 Among these, strong photocatalytic activity, chemical stability, and a negative charge-carrier potential are credited with making the anatase phase one of the most effective photocatalysts.20 The physicochemical parameters, surface-to-volume ratio, grain size, geometry, crystallinity, and surface texture influence the photocatalytic activity.21,22
The development of new mixed metal oxides (MOs) for degrading various organic dyes by photocatalysis has been a major focus in recent years. As a result, doping TiO2 with noble metals, rare-earth metals, and transition metals has been extensively studied to reduce the particle size and improve the photocatalytic and antibacterial properties of TiO2. Doping TiO2 with the alkaline earth metal Ba alters the oxide's optical absorption characteristics, which may affect its antibacterial activity and PCA. By modifying the band gap energy, the Ba dopant may operate as an electron trap, inhibiting the recombination rate of e−/h+ pairs. This enhances the antibacterial action and PCA by promoting the generation of reactive oxygen species.23 According to Mills and Hoffmann's research, the photocatalytic efficiency of a nanocatalyst can be improved by doping the nanocatalyst with an appropriate substance.24 However, few studies are reported in the literature regarding Ba-doped TiO2 synthesized through different methodologies. In a recent study, up to 3% Ba-doped TiO2 was synthesized using the sol–gel method at 80 °C for 5 hours. The product was calcined at 500 °C for 2 hours and a nanoparticle morphology was obtained. The acquired nanoparticles were utilized for the degradation of methylene blue (MB) dye for up to 150 minutes, and the calculated degradation percentage was insufficient.25 In another study, up to 2% barium-doped TiO2 was prepared using a mild hydrothermal method and placed in an oven at 100 °C for 12 hours to complete the chemical reaction. After drying the product at 50 °C, the nanocrystal morphology was determined and used for the degradation of acid red 18, a dye. The degradation efficiency was calculated to be 98.6% under acidic conditions for 90 minutes.26 In this regard, pure TiO2 and Ba-doped TiO2 in the anatase form are particularly interesting among the various photoactive MOs.
Herein, 2% and 4% Ba-doped TiO2 were prepared with a simple co-precipitation technique and a QD morphology was achieved. We determined the maximum doping effect of Ba on TiO2 using structural, optical, and morphological techniques and tested its ability to remove organic pollutants in different media from contaminated water. The obtained results showed maximum degradation in almost all media; however, the most promising results were in the basic medium and were found to be 99.5%. Furthermore, computational density functional theory was employed to investigate the Ba-doped TiO2 systems. We show that the changes in the electronic structure of TiO2 doped with Ba can be explained by combining experimental results with theoretical calculations.
2. Experimental section
2.1 Materials
Titanium(IV) butoxide (C16H36O4Ti), ethanol (C2H5OH), sodium hydroxide (NaOH), and barium chloride dehydrate (BaCl2·2H2O) were purchased from Sigma-Aldrich (Germany).2.2 Synthesis of Ba-doped TiO2 quantum dots
To synthesize TiO2, titanium(IV) butoxide (20 mL) was dissolved in ethanol (50 mL) under vigorous stirring at 75 °C to form a solution. Later, 400 mL deionized water (DI water) and NaOH (0.5 M) were introduced dropwise to form a colloidal solution; the formation of precipitates started during the incorporation of the 0.5 M NaOH solution while maintaining the above-mentioned colloidal solution at pH ∼ 10. Then, the colloidal solution was centrifuged for 6 minutes at 7500 rpm to achieve sedimentation, and the product was rinsed numerous times with deionized (DI) water to eliminate impurities. The final product was dried at 500 °C to create anatase-phase TiO2 fine powder using the co-precipitation technique. For the doping of Ba into TiO2, different concentrations of Ba (2 and 4 wt%) were incorporated in the colloidal solution of TiO2 QDs, and the same procedure was adapted for the synthesis of doped QDs (Fig. 1).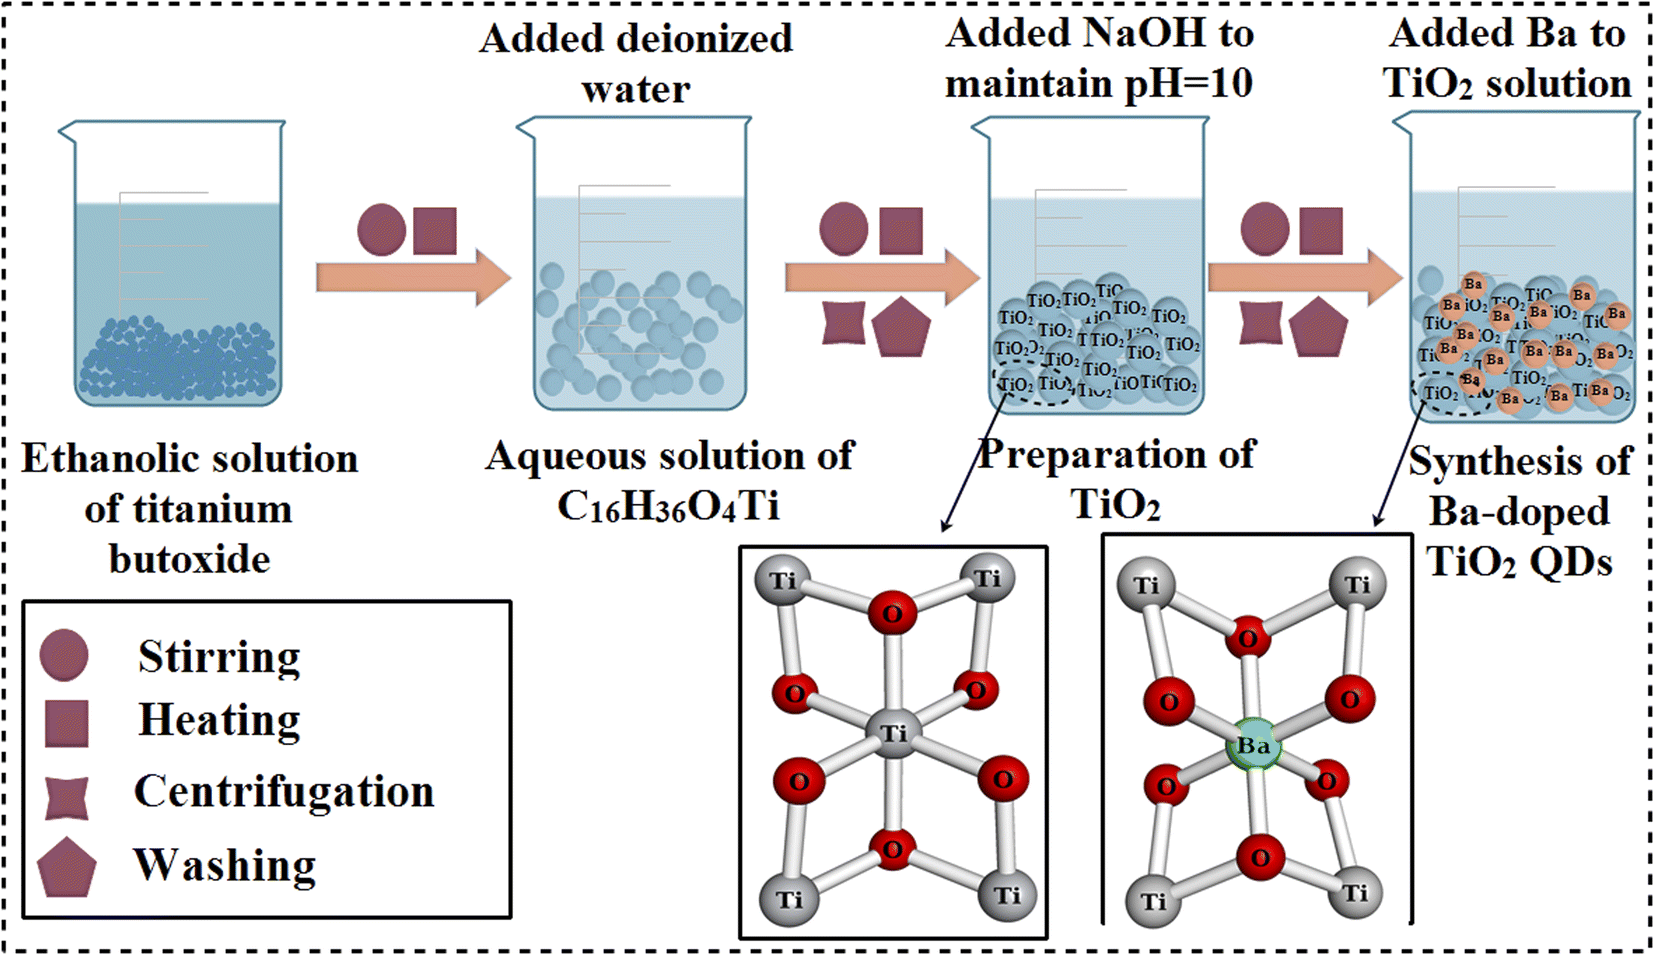 | ||
| Fig. 1 Schematic diagram of the synthesized Ba-doped TiO2 QDs. | ||
2.3 Photocatalysis
The PCA of the TiO2 and Ba-doped TiO2 QDs under the influence of light ranging between 400 and 800 nm at room temperature was evaluated with UV-vis spectrophotometry. Initially, 5 mg of the nanocatalyst was dissolved in a 30 mL aqueous solution of MB while being vigorously stirred for 10 minutes in the absence of light. Then, the solution was exposed to the above-mentioned light for 2 hours, with 3 mL of the solution taken out every 30 minutes for UV-vis analysis to evaluate the MB dye degradation (λmax = 665 nm). The percentage degradation efficiency was calculated using eqn (1).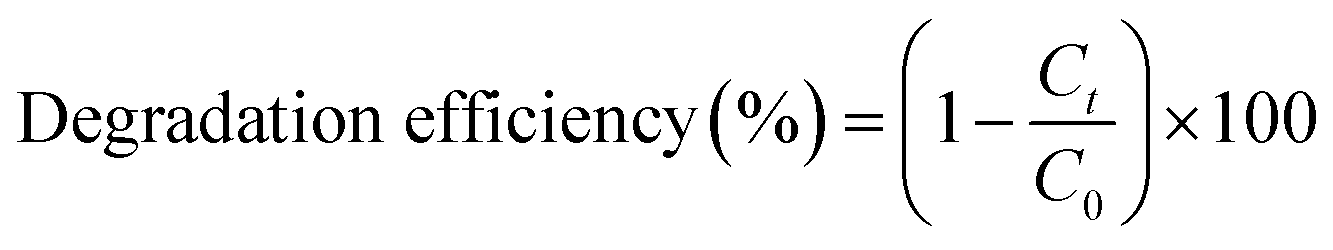 | (1) |
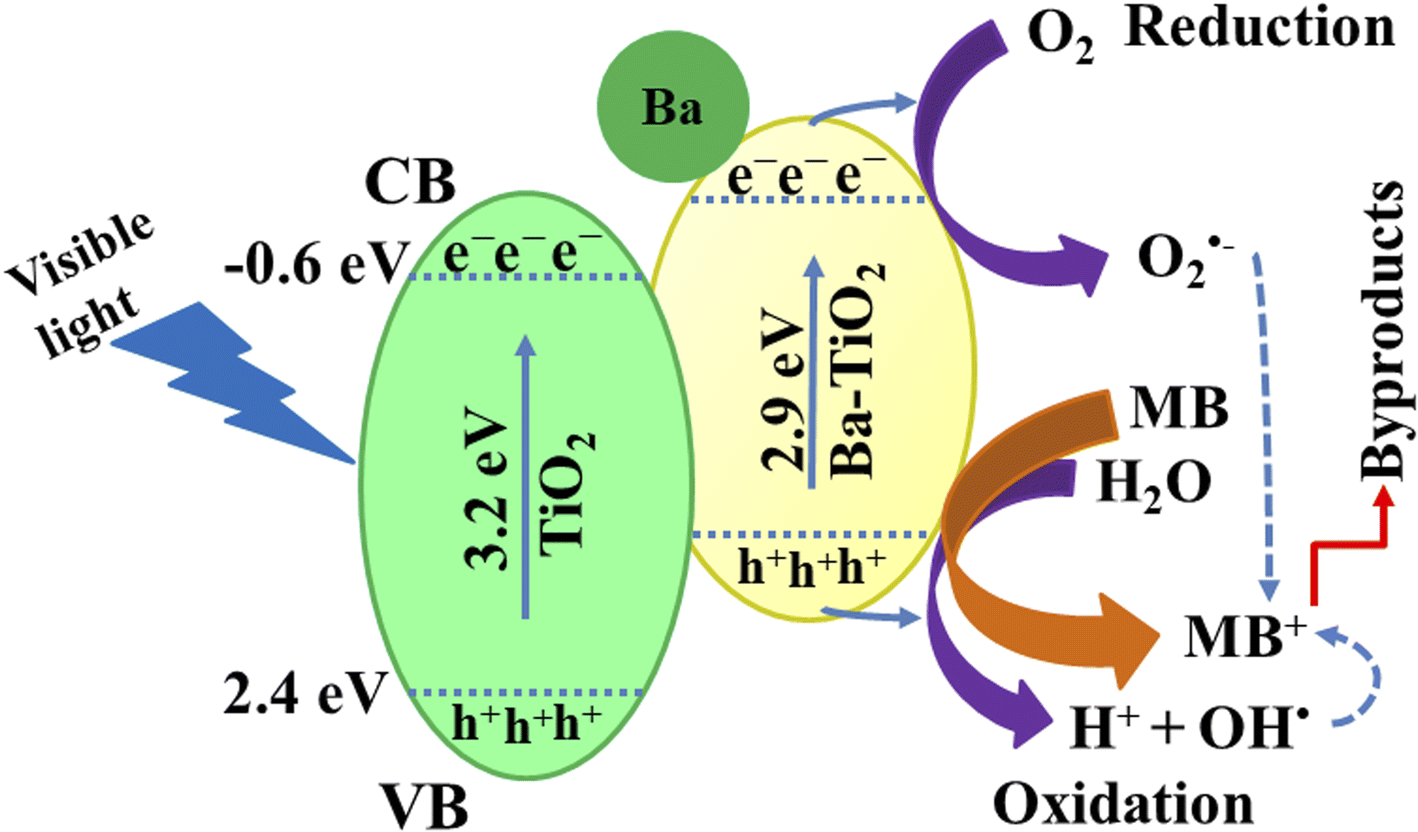 | ||
| Fig. 2 Schematic photocatalytic mechanism of the Ba-doped TiO2 QDs. | ||
(i) Photoexcitation: photocatalysis (PCA) begins with photoexcitation, which occurs when photons have energy equal to or greater than the band gap energy of the material (Eg). These photons urge electrons in the VB to move towards the CB.
| TiO2 + hv → TiO2 (eCB− + hVB+) |
(ii) Water ionization: in order to form a hydroxyl radical (OH˙), the positive holes (h+) can oxidize hydroxide ions or water molecules that have been adsorbed on the surface of TiO2.
| TiO2 (hVB+) + H2O → TiO2 + OH˙ + H+ |
| TiO2 (hVB+) + OH− → TiO2 + OH˙ |
At the photocatalyst surface, these OH˙ radicals act as oxidizing agents that strike adsorbed organic molecules that are very close to the catalyst surface and take part in mineralization to improve decontamination.
(iii) Ionosorption of oxygen: superoxide radicals (O2˙−) are formed when excited electrons react with oxygen. Protons and superoxide radical anions combine to generate hydroperoxyl radicals (HOO˙).
| TiO2 (eCB−) + O2 → TiO2 + O2˙− |
| O2˙− + H+ → HOO˙ |
(iv) Photosensitized oxidation: in conditions where catalysts are present, the excited state of MB can inject an electron into the conduction band. After this step, the dye is changed into a cationic radical, which subsequently degrades and produces compounds in accordance with the following reactions:
| MB+ + TiO2 → MB˙+eCB− (TiO2) |
| O2 + e− → O2˙− |
| MB˙+ + OH− → MB + OH˙ |
| MB˙+ + OH˙ → products |
| MB˙+ + O2˙− → products |
When the catalyst absorbs visible light holes in the valence band (VB), electrons are produced in the conduction band (CB). In this way, electron–hole pairs are generated and initiate the redox reaction on the TiO2 surface. OH˙ radicals are produced whenever the holes (hVB+) interact with an adsorbed hydroxyl group. In contrast, the reaction of electrons (eCB−) with oxygen produces the superoxide anion radical O2˙−. The degradation of MB occurs due to a collaborative effort of OH˙ and O2˙− radicals. Lastly, the oxidation of organic molecules produces CO2 and H2O.27
3. Results and discussion
XRD was employed to examine the crystalline structure and crystallite size of undoped and doped TiO2 in the range of 15°–65° (Fig. 3a). The identified TiO2 pattern is consistent with JCPDS card no. 00-021-1272, revealing that the peaks coincide with the anatase phase of TiO2. The tetragonal structure was validated by the diffraction peaks detected at 2θ = 25.28°, 37.80°, 48.05°, 53.89°, and 62.69°, which synced with the (101), (004), (200), (105), and (204) planes, respectively.28 Additionally, the presence of barium titanium oxide (Ba2O20TiO9) was observed at 20.0°, 27.4°, 28.6°, and 44.92°, with the hkl values of (013), (141), (2![[2 with combining macron]](https://www.rsc.org/images/entities/char_0032_0304.gif) 0) and (30
0) and (30![[3 with combining macron]](https://www.rsc.org/images/entities/char_0033_0304.gif) ), respectively, which matched well with JCPDS card no: 00-040-0405. Upon Ba doping, intense TiO2 peaks were found and peak shifting was observed towards higher angles, which indicates an improvement in crystallinity. The crystalline sizes of the synthesized dopant-free and doped TiO2 were computed using the Debye–Scherer formula. Subsequently, SAED patterns were recorded to explore the highly crystalline nature of the pristine and Ba-doped TiO2, as depicted in Fig. 3c–e. The XRD results validate the tetragonal crystalline structure of TiO2 by indexing the images with the diffraction planes (101), (004), (105), (200), and (204).
), respectively, which matched well with JCPDS card no: 00-040-0405. Upon Ba doping, intense TiO2 peaks were found and peak shifting was observed towards higher angles, which indicates an improvement in crystallinity. The crystalline sizes of the synthesized dopant-free and doped TiO2 were computed using the Debye–Scherer formula. Subsequently, SAED patterns were recorded to explore the highly crystalline nature of the pristine and Ba-doped TiO2, as depicted in Fig. 3c–e. The XRD results validate the tetragonal crystalline structure of TiO2 by indexing the images with the diffraction planes (101), (004), (105), (200), and (204).
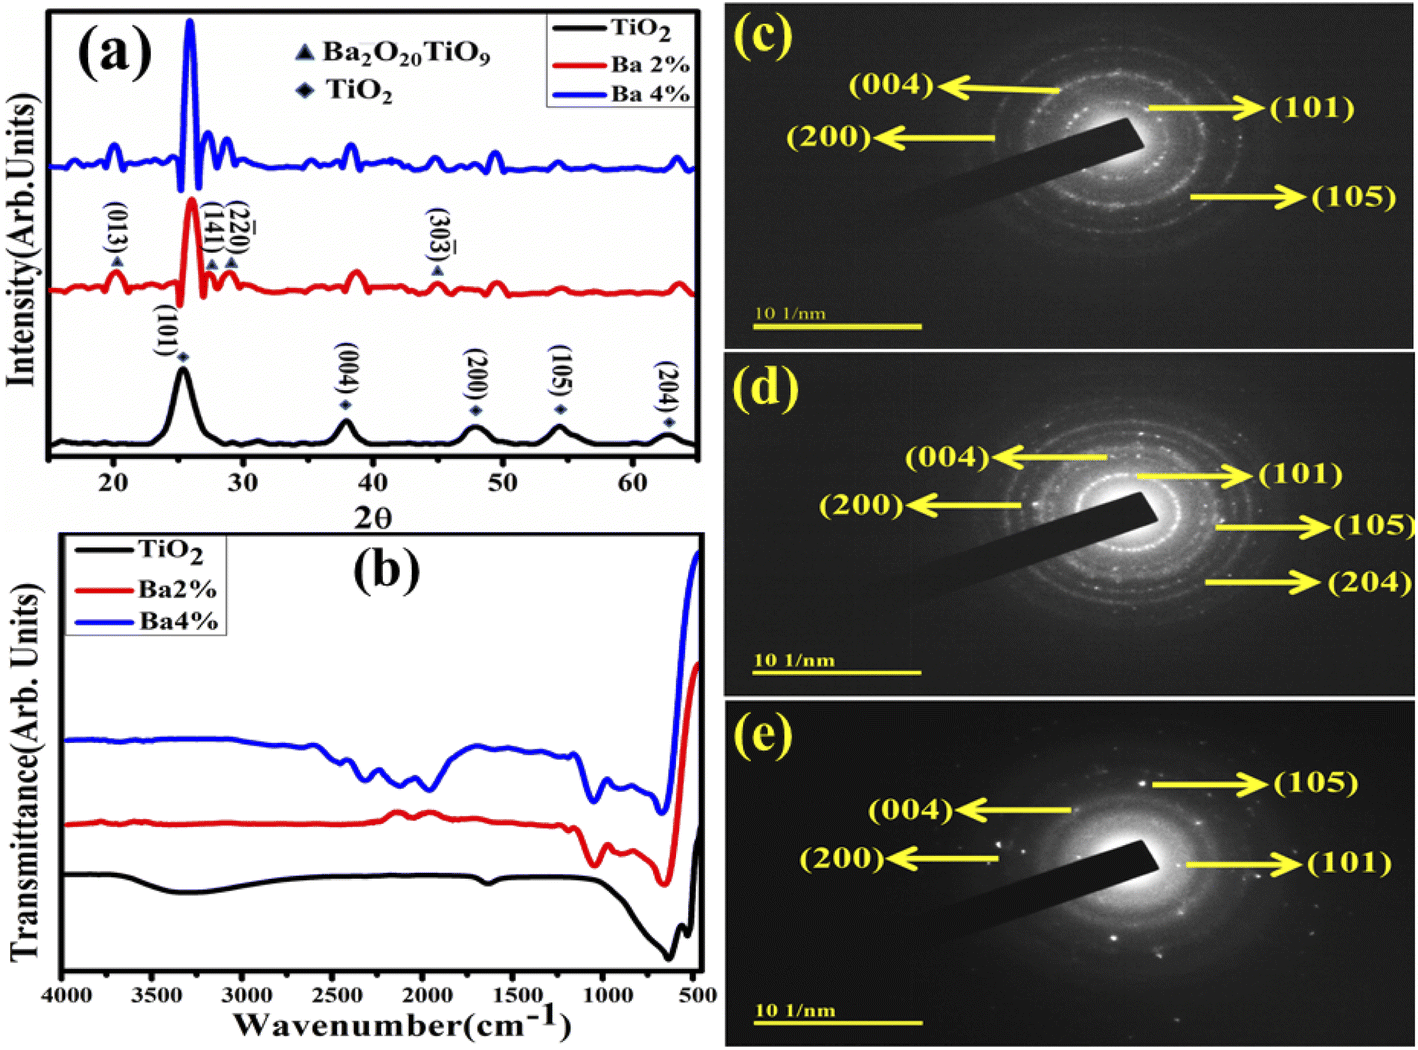 | ||
| Fig. 3 (a) X-ray diffraction patterns, (b) FTIR spectra and (c–e) SAED patterns of pure and Ba (2%, 4%)-doped TiO2 QDs. | ||
FTIR analysis was applied for the functional group identification of the doped TiO2 samples. Wavenumbers ranging from 4000 to 500 cm−1 were used to record the spectra (Fig. 3b). The Ti–O–Ti bridging stretching and Ti–O stretching modes were observed at the bands at 527 and 628 cm−1, respectively.29 Bands appeared at 1640 cm−1 and 3200–3400 cm−1, corresponding to the hydroxyl group (OH) bending and stretching vibrations caused by the presence of H2O molecules in the TiO2 catalyst.30 Band ranges at 2150–2360 cm−1 were revealed with higher doping concentrations of Ba, ascribed to the physical adsorption of CO2 and CO.31 The spreading of the adsorption region over 950–400 cm−1 upon Ba doping was attributed to the characteristic M–O bond oscillations (where M = Ti and Ba). Shifting in the band position suggests that Ba2+ ions were successfully doped into TiO2.32
The optical properties of TiO2 are widely known to be highly dependent on the material type (e.g., single-crystal, powder) along with the fabrication methods. The absorbance spectra of undoped and barium-doped TiO2 were measured by UV-vis spectrophotometry. The absorption peak identified for the as-prepared TiO2 at ∼350 nm is attributed to electron transfer from the 2p to 3d region of the VB of O2− to the CB of Ti3+.33 In the absorption spectra, a redshift is observed with Ba (2%, 4%) doping, resulting in decreased band gap energy (Eg). Tauc transformation was used to calculate Eg, as displayed in Fig. 4b. The estimated Eg was 3.25 eV for TiO2,33 and Eg was reduced with a low and high doping concentration of Ba (3.16 eV and 3.12 eV, respectively). The reduction in the band energy gap can be attributed to the increasing crystallite size, as demonstrated by the XRD measurements.
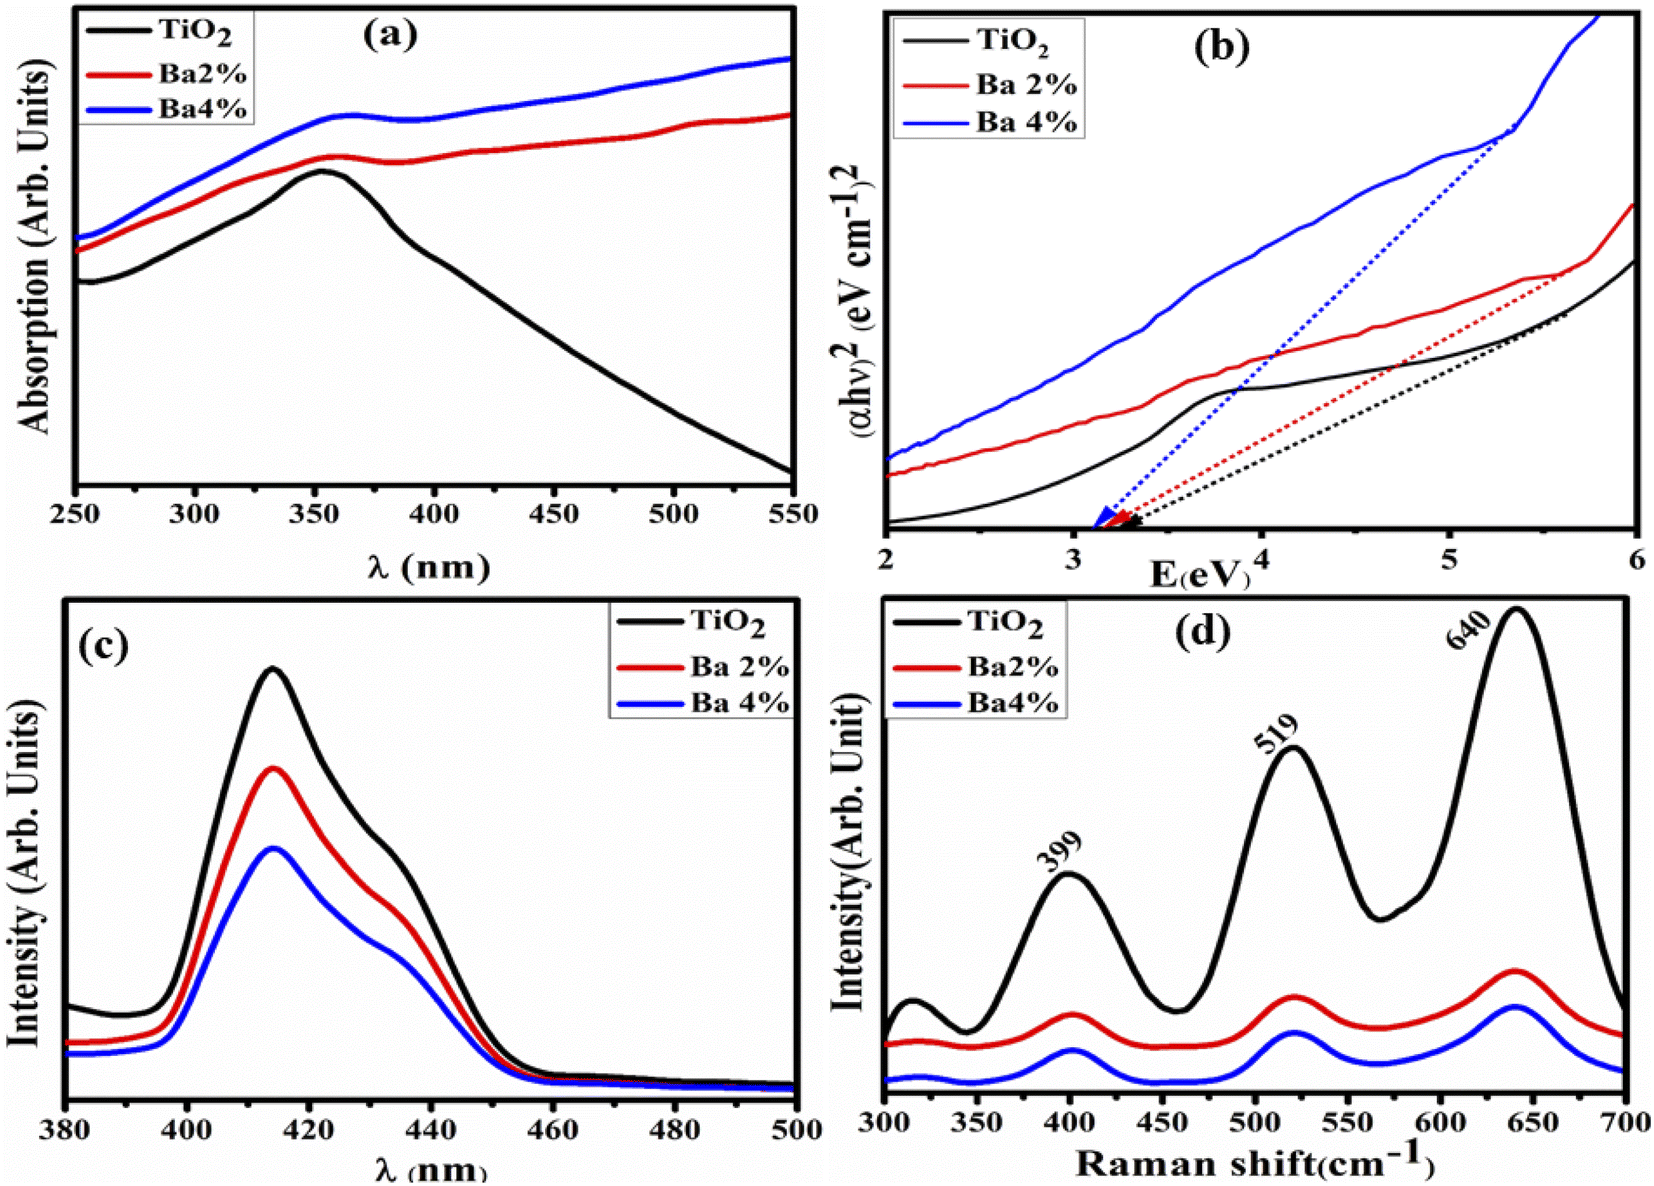 | ||
| Fig. 4 (a) Absorbance spectra, (b) Eg by Tauc plot, (c) photoluminescence spectra and (d) Raman spectra of the TiO2 and Ba (2%, 4%)-doped TiO2 QDs. | ||
PL spectroscopy was used to assess the e−–h+ recombination rate, recorded between 380 and 500 nm at an excitation wavelength of 350 nm (Fig. 4c). The TiO2 peak intensity observed at 414 nm demonstrated the high recombination rate of e−–h+ pairs, which influences the TiO2 photocatalytic performance significantly. Furthermore, the peak intensity was reduced, which indicates a lower charge recombination rate upon doping and thus higher photocatalytic activity.34,35 These emission transitions have been credited to unilaterally charged oxygen vacancies in TiO2 and arise when a photogenerated h+ mixes with an e− taking up oxygen vacancies.36 When the concentration of Ba increases, the peak intensity reduces as higher concentrations restrict the inter-nuclear space, and the emission intensity begins to flow towards the energy-killing domains.37–40 Raman spectroscopy was used to investigate the lattice strain, phase transformations, lattice dynamics, and local symmetry of the samples.41,42
Fig. 4d presents the Raman spectra of doped TiO2 between 300 and 700 cm−1. The peaks appearing at 399, 519, and 640 cm−1 for the samples are attributed to distinct LO vibration modes, demonstrating the improved crystallinity of TiO2 with Ba (2%, 4%) doping, having minimum interlayer stress and defect density.43 All the samples exhibited high bands at 399, 519, and 640 cm−1, which most certainly correlate to the permissible Raman modes B1g, B1g, and Eg, respectively, with the space group D4h19.44
The surface morphology and chemical composition of the synthesized QDs were confirmed by FESEM and EDS spectroscopy, as shown in Fig. 5. Aggregated quantum dots (QDs) of different sizes appear (Fig. 5a). Upon Ba doping, small-scale agglomeration was observed (Fig. 5b). A layer of Ba is formed as the concentration increases, and the QDs are dispersed (Fig. 5c). The EDS spectra for the TiO2 QDs are presented in Fig. 5d–f. Prominent peaks of Ti with O reveal the successful preparation of TiO2 QDs. The presence of Ba in the spectra confirms the successful incorporation of dopants, whereas the peaks of Cu and C are attributed to the Cu grid and carbon tape used to mount the samples, respectively (Fig. 5e and f). Furthermore, Au, Zn, and Cl peaks emerged, which were assigned to the coating of gold sprayed over the sample and some contamination. Additionally, a peak of Na was found in each prepared sample, ascribed to the use of NaOH to maintain the pH of the solutions.
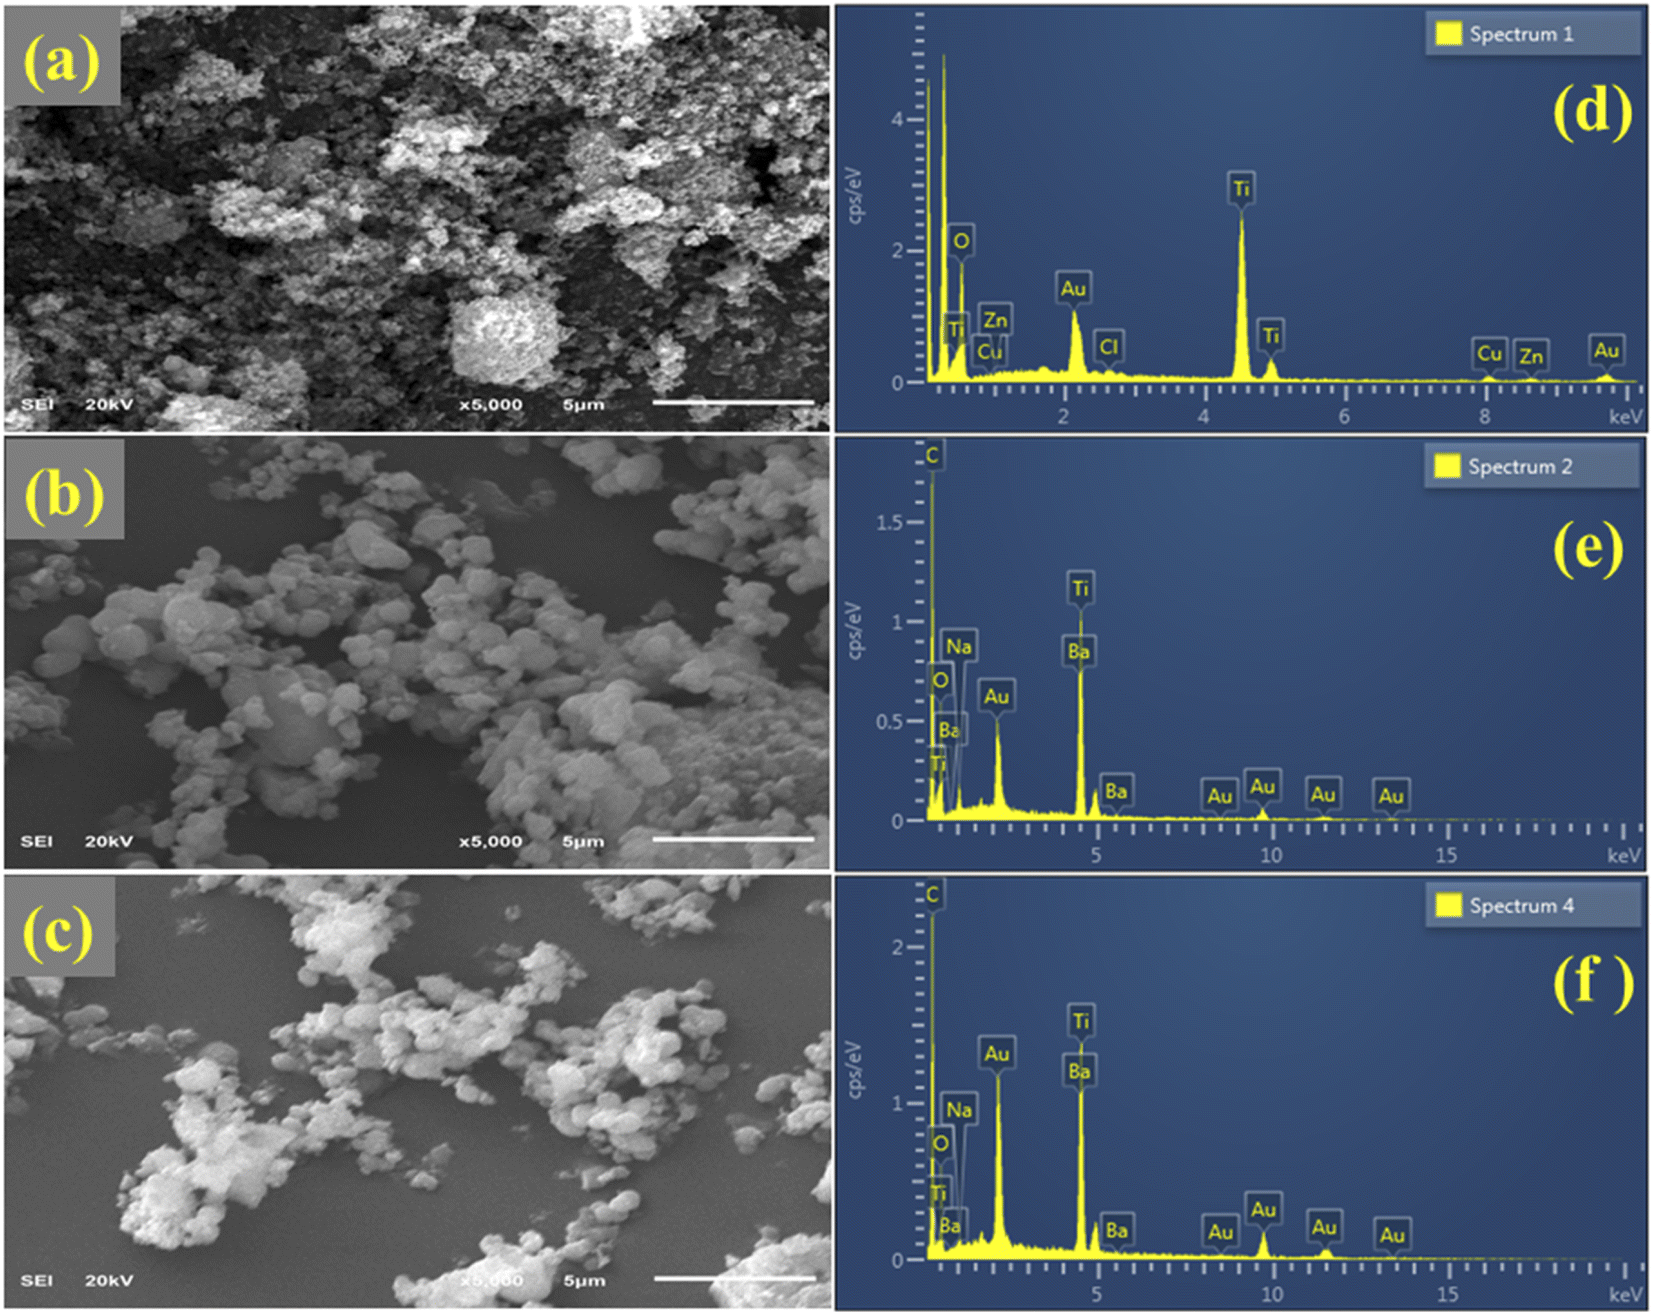 | ||
| Fig. 5 (a–c) FESEM images and (d–f) EDS analysis of pure and Ba (2%, 4%)-doped TiO2. | ||
The morphology, size, and shape of the TiO2 and Ba (2%, 4%)-doped TiO2 QDs were examined using TEM, as illustrated in Fig. 6a–c. Spherical-shaped small-size QDs ranging from 6 to 9 nm are observed, as shown in Fig. 6a. On doping with Ba, the synthesized QDs appeared to be loosely bound with the TiO2 QDs (Fig. 6b). By increasing the dopant concentration, the QDs seem to become overlapped and highly aggregated, which may result in their decreased size (Fig. 6c). Moreover, HRTEM was utilized to determine the interlayer d-spacing, as shown in Fig. 6d–f. The interlayer d-spacing of TiO2 and Ba (2%, 4%)-doped TiO2 were estimated to be 0.35, 0.34, and 0.34 nm, respectively, assigned to the (101) plane for doped and undoped TiO2, and well agreed with the XRD results. The above optical, structural, and morphological characterizations for doped TiO2 indicate that the Ba-doped TiO2 lattice has an anatase phase with a tetragonal crystalline structure, as confirmed by SAED. The addition of Ba increased the absorption and introduced a redshift as the crystallite size increased, which could capture a wide range of wavelengths. The morphological study confirmed the formation of QDs with agglomeration upon doping.
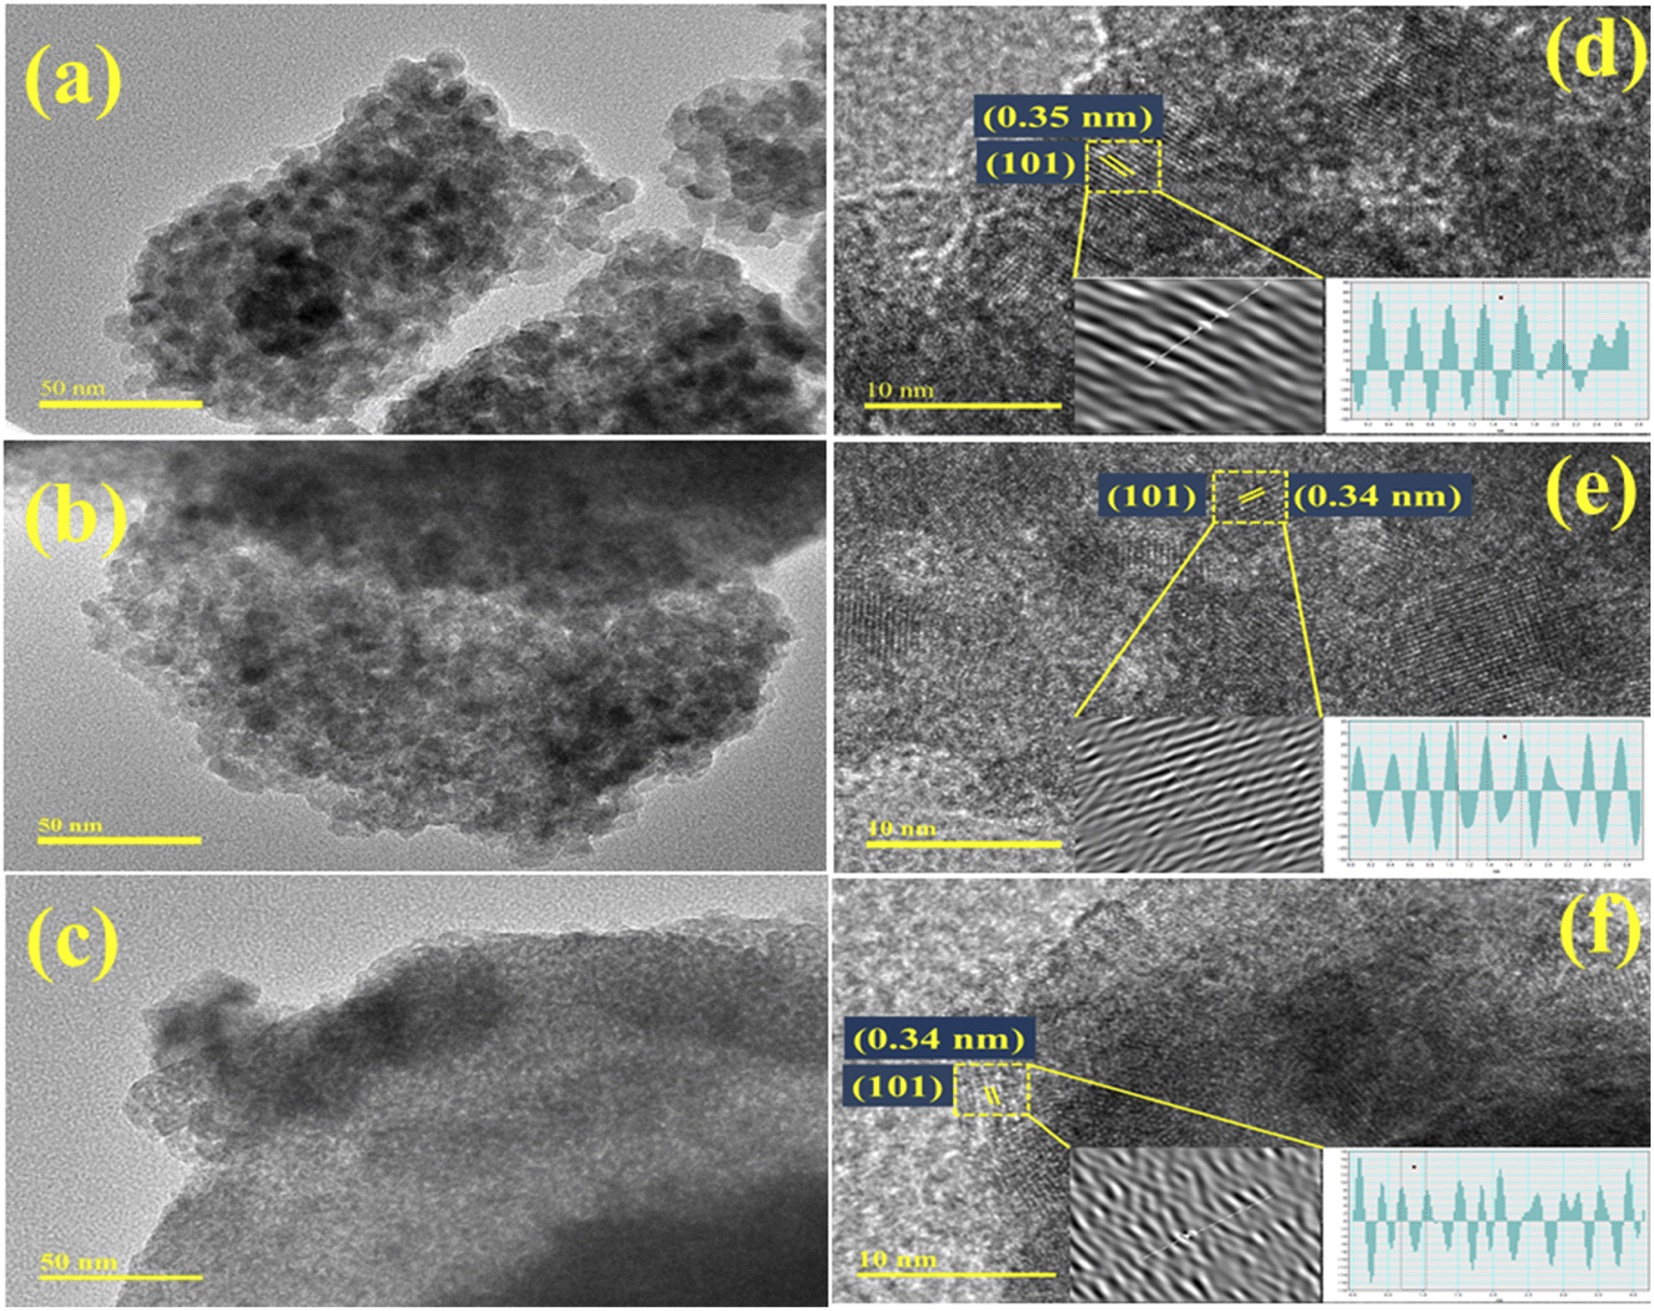 | ||
| Fig. 6 (a–c) TEM images of pure and Ba (2%, 4%)-doped TiO2; (d–f) interlayer d-spacing HRTEM images of undoped and Ba-doped TiO2. | ||
To determine the PCA of the prepared nanocatalyst, UV-vis spectrophotometry was used (Fig. 7). The degradation efficiency was calculated against acidic, basic and neutral media. In a neutral medium (pH 7), the percentage degradation was estimated to be 65.56%, 81.84%, and 82.91% for dopant-free and doped TiO2, respectively, as presented in Fig. 7a. The solution pH influences the photocatalytic mechanism, which may affect the adsorption of the dye on the photocatalyst surface. MB, as a positively charged dye, degrades slowly at lower pH; as a result, the degradation efficiency is enhanced on increasing the pH. Moreover, in an acidic medium (pH 4), the measured degradation results are 47.41%, 49%, and 70.41% for the doped and undoped TiO2, respectively, as demonstrated in Fig. 7b. From the results in the acidic medium, the degradation of MB seems to be ineffective compared to that in the neutral medium, attributed to the positively charged surfaces of the catalysts, which tend to resist the adsorption of the cationic adsorption species. Furthermore, in a basic medium (pH 12), the prepared nanocatalyst exhibits efficient dye degradation results of 92.17%, 97%, and 99.5% for TiO2 and Ba (2%, 4%)-doped TiO2, respectively, as illustrated in Fig. 7c. Increased electrostatic interaction between the positively charged dye and the negatively charged catalyst in the basic dye solution causes the surface charges to become negative, which facilitates dye degradation.45–47 Generally, the PCA is influenced by the surface area of the nanocatalyst, as a large surface area provides more active sites, increases the number of redox reactions on the nanocatalyst surface and results in the degradation of MB.48,49 The results show that the MB dye degrades maximally when treated with Ba-doped TiO2 rather than with the TiO2 QDs. For the Ba-doped TiO2 photocatalysts, the possible charge separation mechanism is described as follows. Charge pairs are formed when visible light interacts with the TiO2 QDs, and electrons in the charge pairs move from the valence band (VB) to the conduction band (CB), leaving a hole in the VB. Most of these electron–hole pairs tend to recombine and lower the degradation capability of TiO2. Incorporating metal ions (Ba) into the TiO2 lattice as electron traps inhibits the recombination of charge pairs, resulting in increased photocatalytic activity. The separation of charges and the transport of these charges play a significant role in enhancing the photocatalytic activity.25 In this regard, 4% Ba-doped TiO2 shows the maximum results in all the media for MB degradation, attributed to the lower recombination rate as evidenced from the PL spectra (Fig. 4c). 4% Ba-doped TiO2 has lower charge recombination that results in enhanced photocatalytic degradation. Additionally, recycling experiments were used to examine the photostability of TiO2 doped with 4% barium, as presented in Fig. 7d. Even after being subjected to six separate cycles of the photocatalytic degradation of MB by visible light, the high-concentration Ba-doped TiO2 QDs exhibited a high level of stability and maintained an exceptional level of activity. A literature comparison with the current study is provided in Table 1.
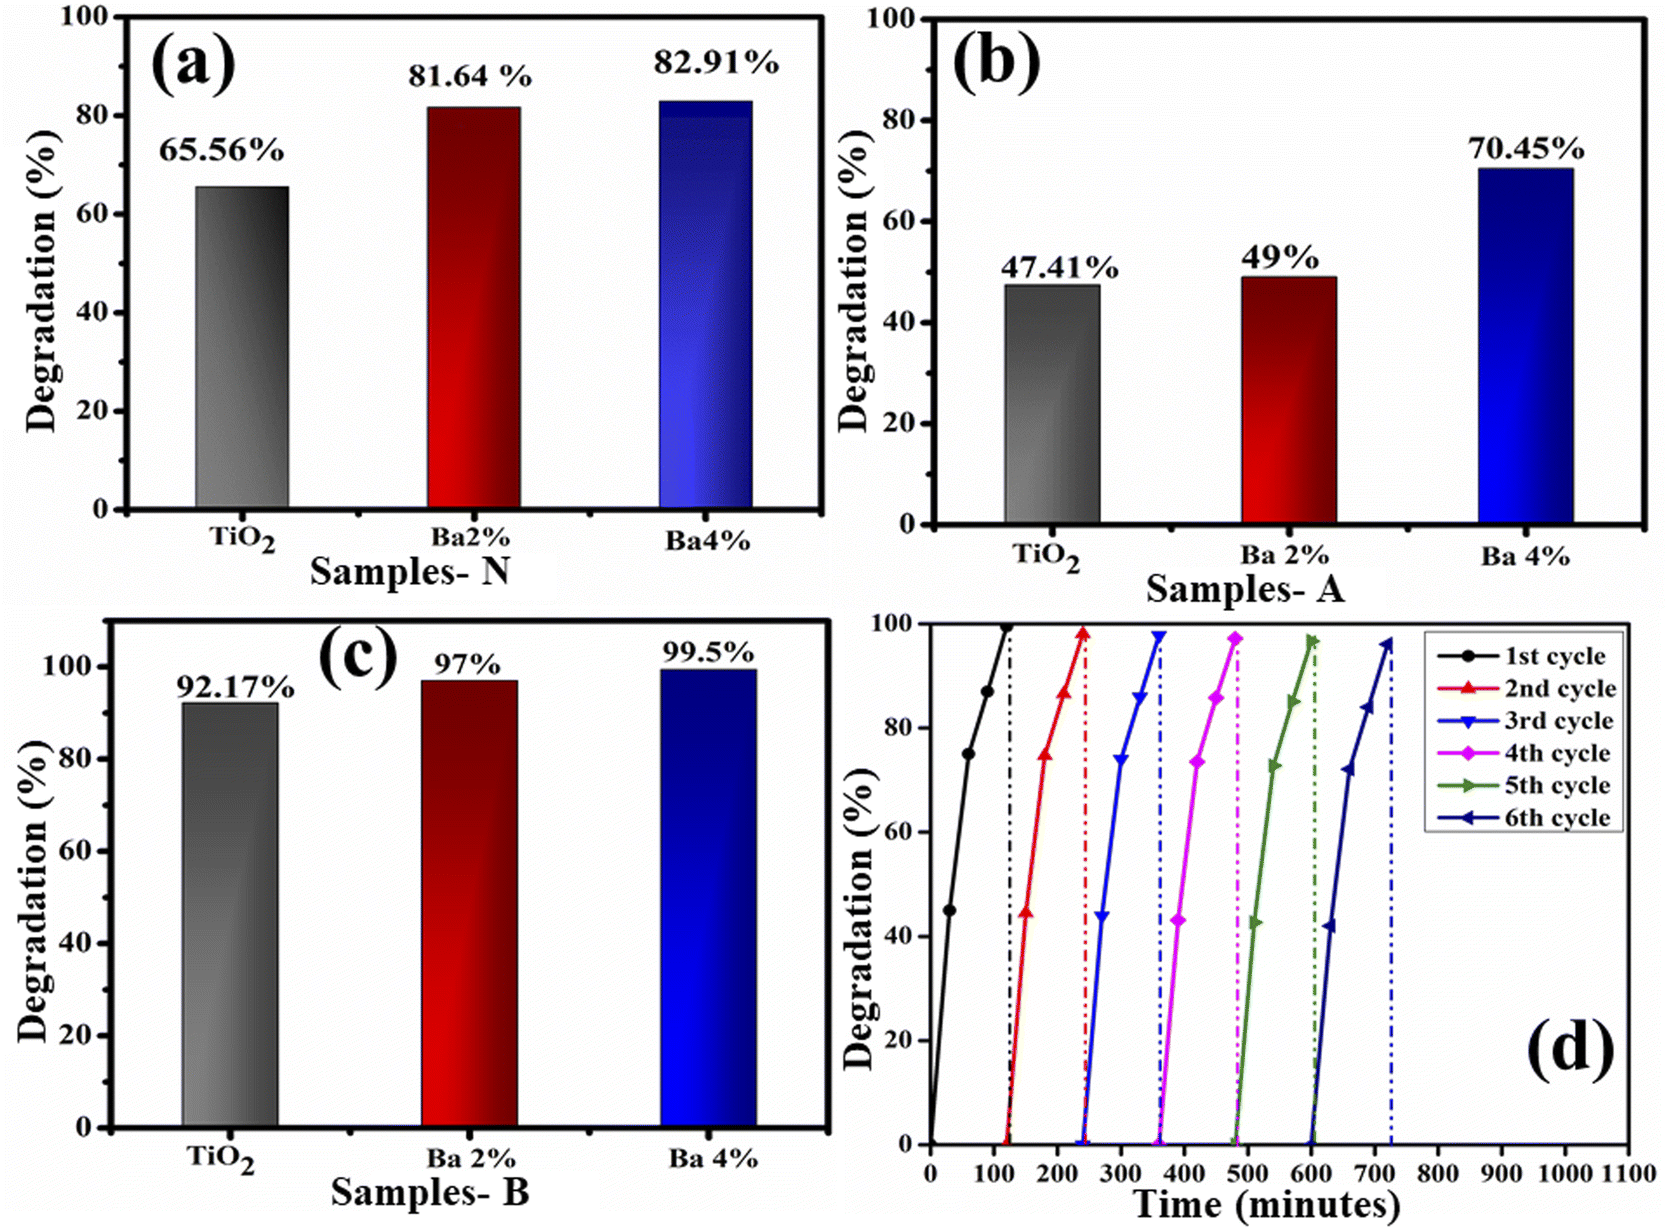 | ||
| Fig. 7 Photocatalytic degradation of TiO2 and Ba (2% 4%)-doped TiO2 in (a) neutral, (b) acidic and (c) basic media and (d) the photocatalytic degradation of MB by 4% Ba-doped TiO2. | ||
The BET surface area and pore size of the as-prepared TiO2 and Ba-doped TiO2 samples were investigated using BET analysis. The N2 adsorption–desorption isotherms of all the samples are shown in Fig. 8. The adsorption–desorption isotherm of TiO2 and Ba-doped TiO2 matched the characteristics of a traditional type IV curve that had an H4 hysteresis loop (Fig. 8). A mesoporous structure was found in both the undoped and doped TiO2 QDs. In addition, the BET surface areas of the prepared QDs increased gradually to 119.183, 132.846, and 138.5 m2 g−1 for TiO2 and Ba (2%, 4%)-doped TiO2, respectively. The average pore size was calculated to be 3.6, 4.5, and 10.8 nm for dopant-free and doped TiO2, respectively. It can be observed that the incorporation of Ba increased the surface area, which is beneficial for enhanced photocatalytic activity.
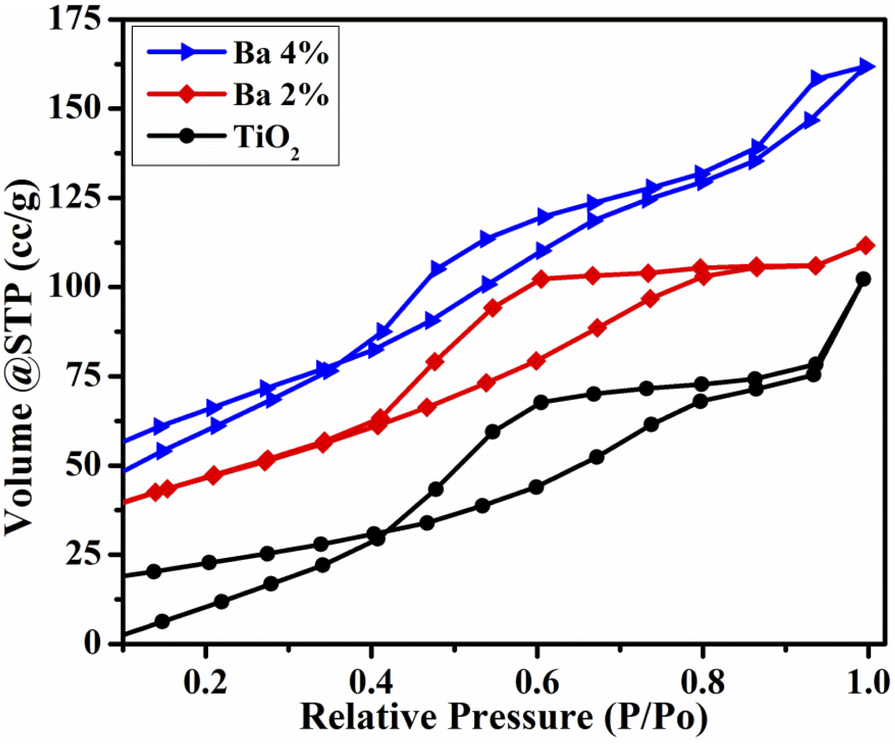 | ||
| Fig. 8 N2 adsorption–desorption isotherms. | ||
3.2 Electronic calculations
The electronic structures and optical characteristics were investigated by comprehensive first-principles calculation with the DFT method using the QuantumATK software package.55 In our calculation, the exchange and correlation potential were dealt with by functionals at both the Perdew–Burke–Ernzerhof (PBE)56 and DFT-1/2 method levels.57,58 The Brillouin region was represented by a Monkhorst–Pack special k-point grid (5 × 5 × 1 for geometric optimization and 10 × 10 × 4 for electronic structure calculation). The basis set was set to the norm-conserving PseudoDojo59-medium with a mesh cut-off energy of 125 Ha. The force tolerance was set to 0.01 eV Å−1 for geometric optimization.The crystalline atomic structure of anatase TiO2 was modeled by a 2 × 2 × 2 supercell containing 32 Ti atoms and 64 O atoms, as illustrated in Fig. 9a. The calculated lattice constants for TiO2 (a = b = 3.782 Å and c = 9.552 Å) are very close to the experimental data (a = b = 3.7842 Å, c = 9.5146 Å).60 The Ba-doped structures were prepared by substituting one and two Ti atoms with one and two Ba atoms, affording doping concentrations of 3.125% (1/32) and 6.25% (2/32), respectively (Fig. 9b). When Ba impurities were introduced into the TiO2 structure, the a- and c-lattice values (a = b = 3.790 Å, c = 9.766 Å and, a = b = 3.778 Å c = 10.013 Å for 3.125% and 6.25% Ba-doped TiO2, respectively) were slightly higher than those in the pristine material. The hexagonal lattice deformation due to Ba-doping causes this difference.
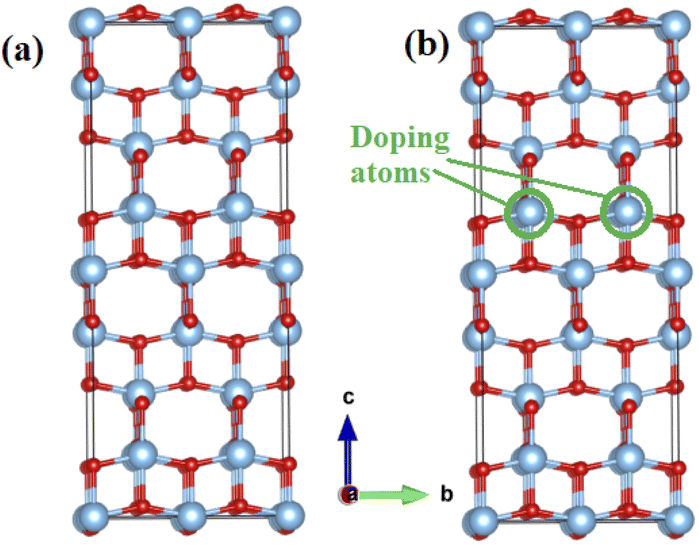 | ||
| Fig. 9 Computational model (a 2 × 2 × 2 supercell) for the anatase (a) TiO2 and (b) Ba-doped TiO2. | ||
The electronic densities of states of the undoped and doped systems were calculated to analyze the effect of Ba doping into the TiO2 lattice from the perspective of the electronic structures (Fig. 10). The calculated pristine TiO2 band gap was found to be 3.17 eV based on the GGA-1/2 method, which is very close to our measured experimental value and previously reported results.61–65 The analysis of the partial DOS of pure TiO2 (Fig. 11a) shows that the upper valence region is mostly dominated by O 2p states, while the lower conduction region is mainly due to the Ti 3d character. Doping Ba at Ti sites modified the electronic structure by generating a slightly asymmetric DOS near the valence band, as illustrated in Fig. 11b. It is observed that in-gap states appear in the band gap, especially in the peak in the DOS of the minority spin close to the upper part of the valence band. It can also be seen that the edge of the valence band advances closer to the Fermi level, indicating an increase in charge-carrier concentration and a modest reduction in the band gap.
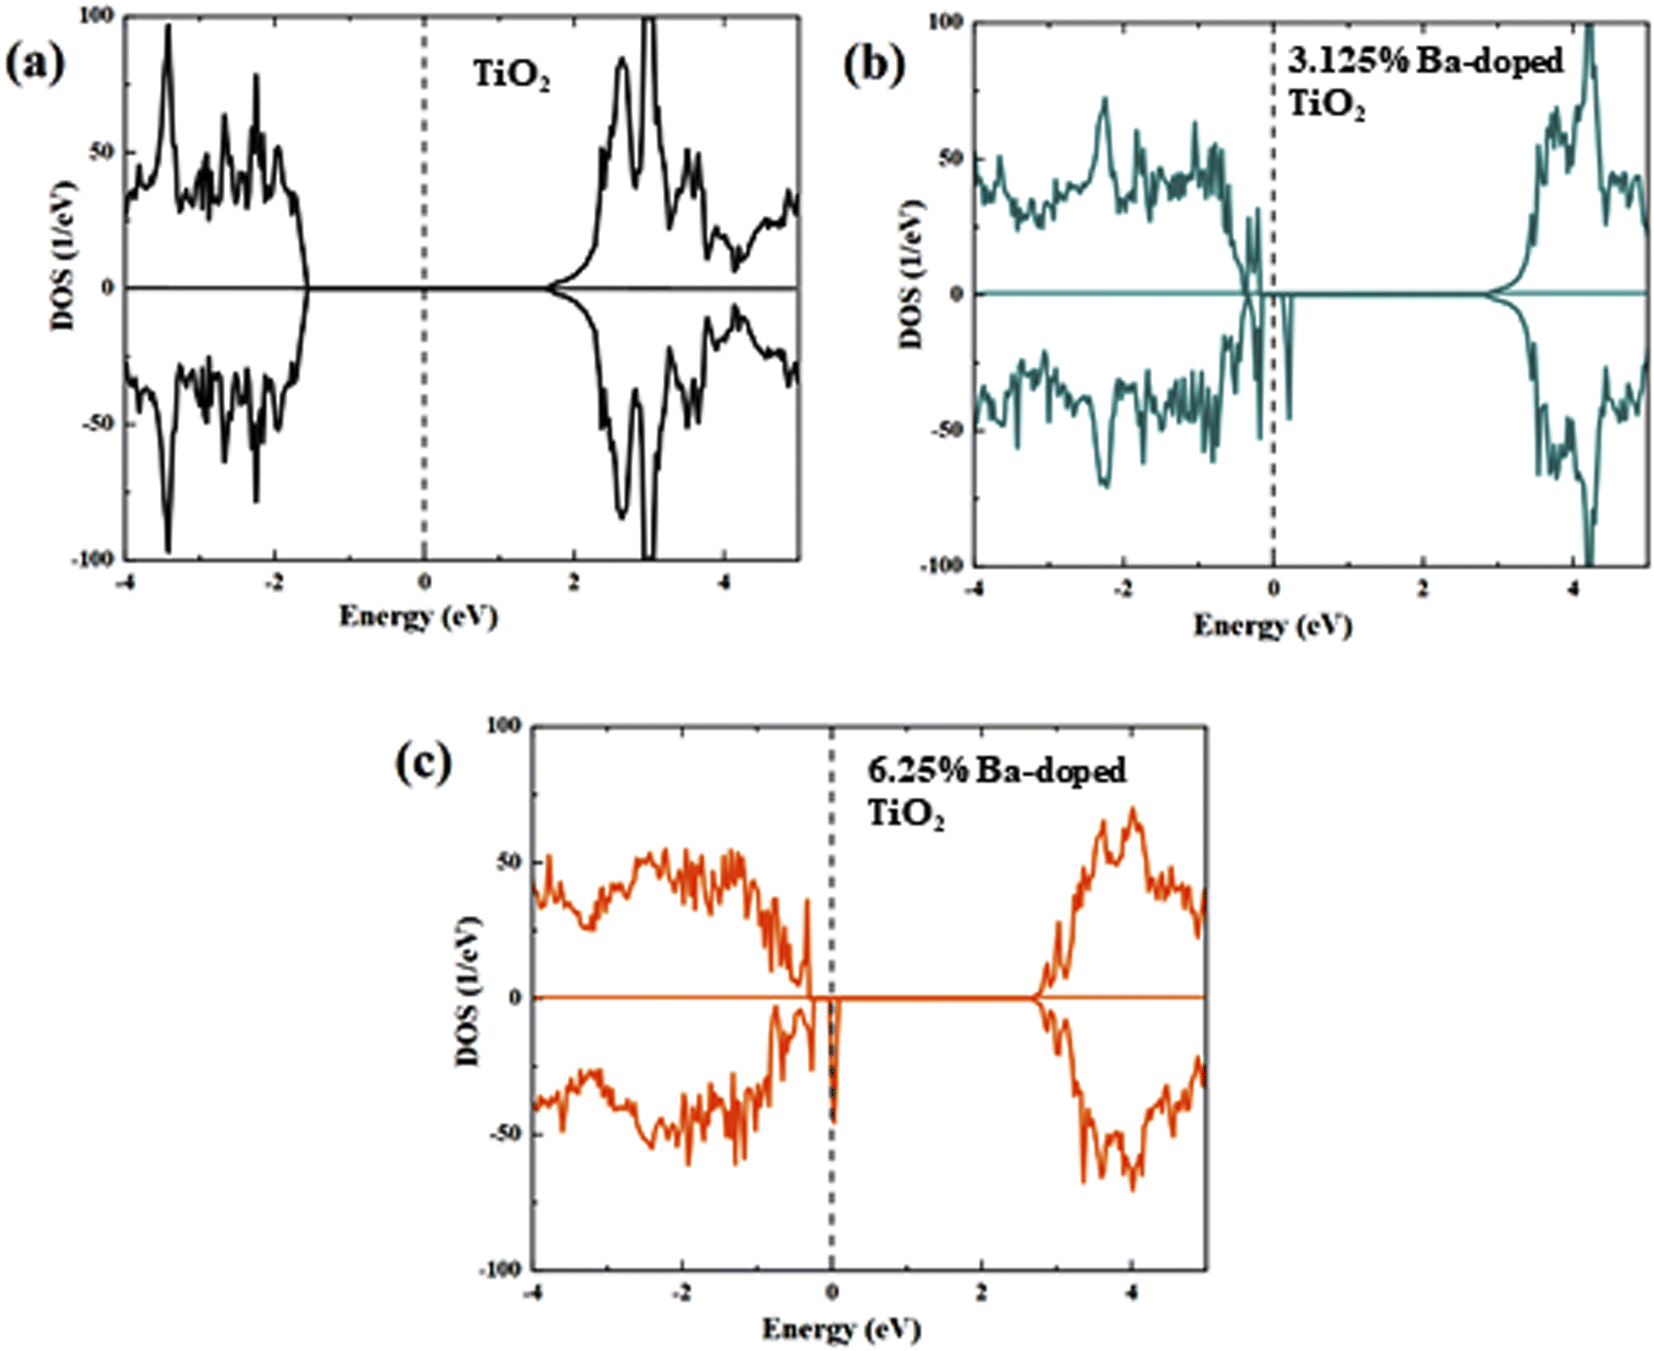 | ||
| Fig. 10 Calculated total of (a) pure, (b) 3.125% Ba- and (c) 6.25% Ba-doped TiO2 using the DFT-1/2 method. The Fermi level is represented by the red vertical dashed line. | ||
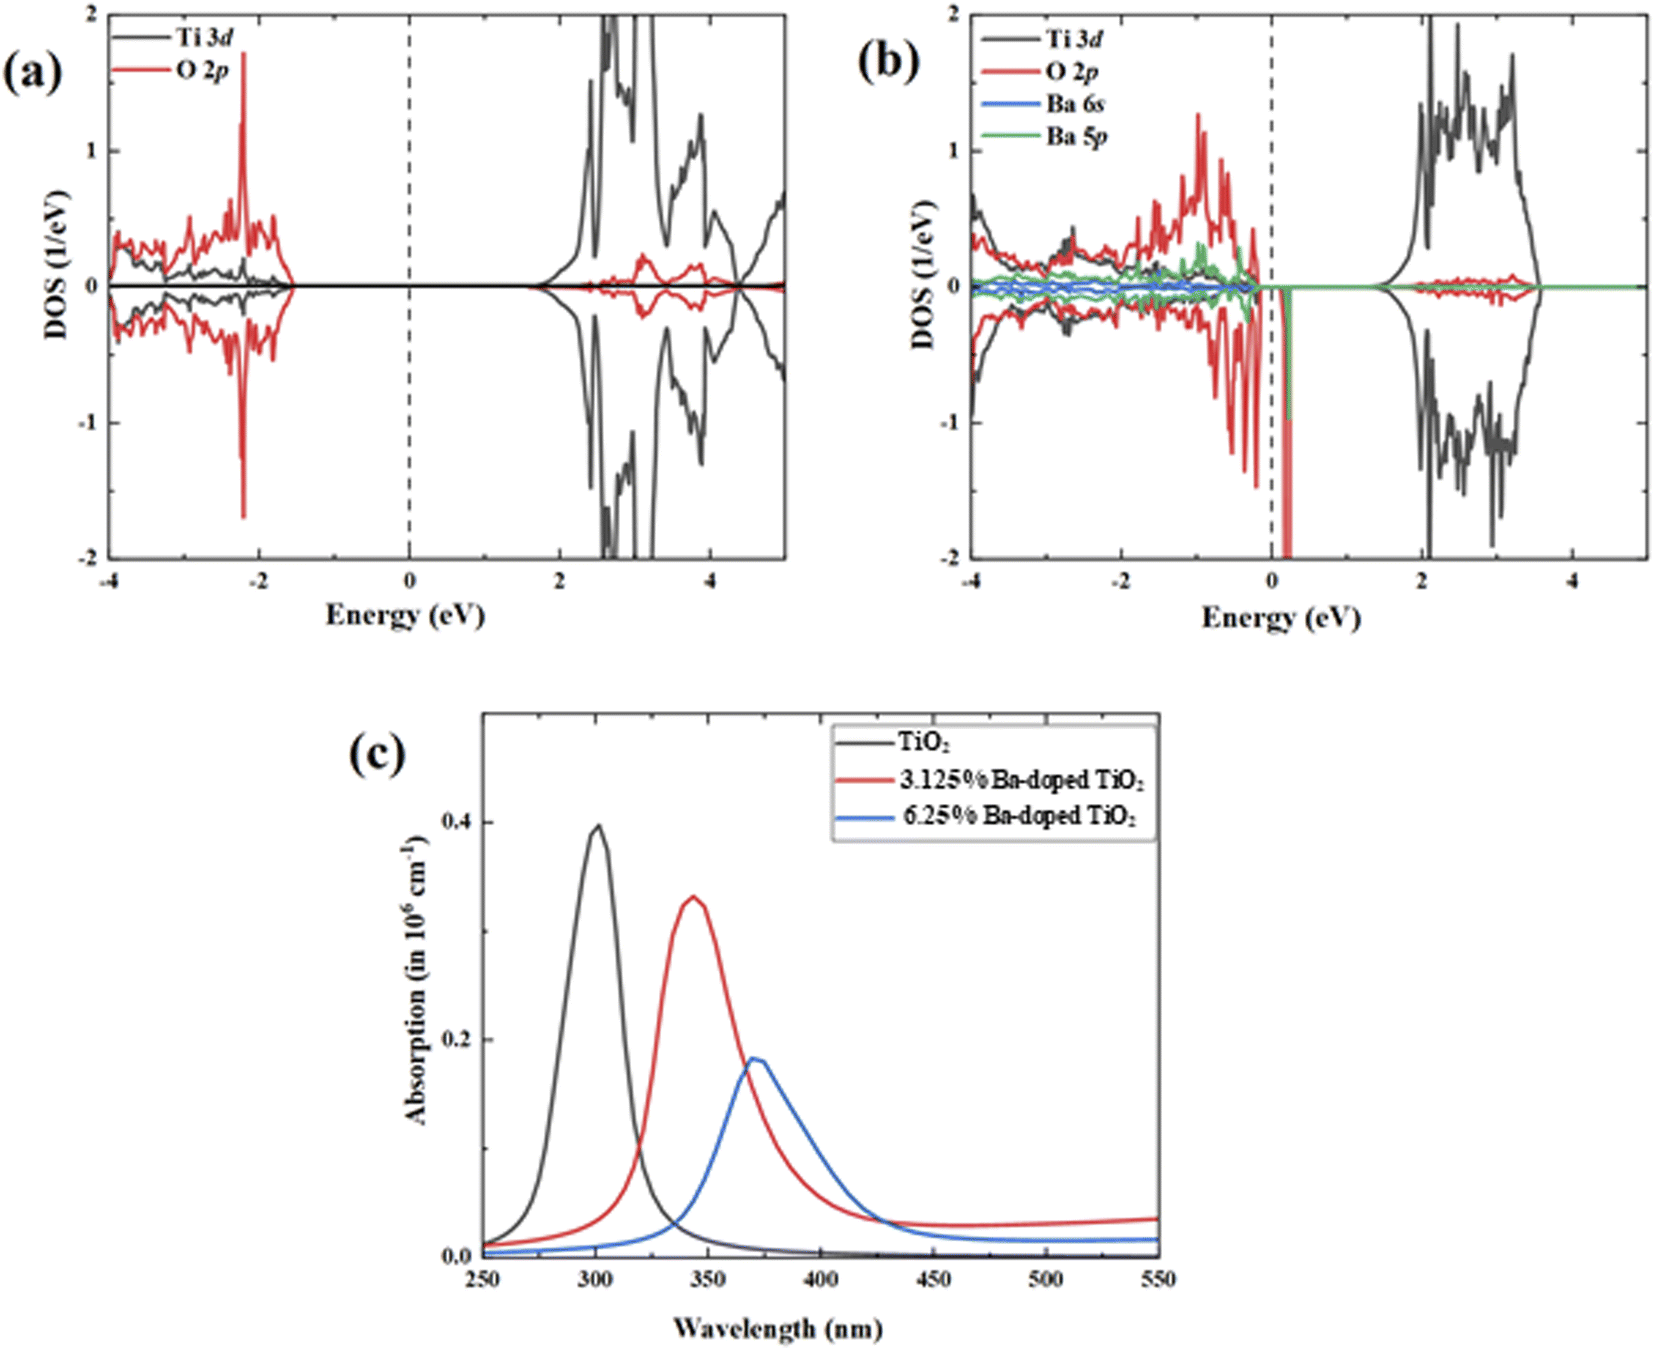 | ||
| Fig. 11 PDOS of (a) pristine TiO2 and (b) 3.125% Ba-doped TiO2 and (c) the optical absorption spectra. | ||
The obtained band gap values are found to be 3.07 eV and 3.002 eV for 3.125% Ba- and 6.25% Ba-doped TiO2, respectively. Additionally, the band gap values are shown to slightly decrease with further increase in Ba concentration. The same behavior was observed in our experimental measurements.
Moreover, the states that appear in the band gap can help to stimulate valence electrons to the conduction band, boosting the visible light absorption, which is beneficial to improving the optical absorption efficiency. The in-gap states may lower the threshold for photoexcitation, decrease the energy needed for electron transitions, and thereby broaden the optical absorption spectrum without altering the energy of the electrons or holes. This result gives a good explanation of the redshift. The features of the PDOS of Ba-doped TiO2 systems show that the Ba 5p states are coupled with O 2p, while partially appearing in the band gap. The absorption spectra of the pristine and Ba-doped TiO2 were computed and are illustrated in Fig. 11c. The absorption spectrum analysis displays that the pristine TiO2 only absorbed photons in the ultraviolet range with no photo-absorption activity in visible light. In the case of the Ba-doped TiO2 configurations, there is a considerable redshift of the absorption edge owing to the presence of an in-gap near the valence band, which makes it simpler for electrons to be driven to the conduction band.
4. Conclusion
The co-precipitation technique was employed to synthesize TiO2 and Ba (2%, 4%)-doped TiO2 quantum dots. The XRD patterns revealed a tetragonal structure and anatase phase with a highly crystalline nature of TiO2, as confirmed by SAED. The FTIR spectra present a band at 670 cm−1 attributed to the Ti–O–Ti bond after preparing Ba-doped TiO2. The absorbance increased with an increasing amount of Ba accompanied by a redshift and decrease in the band gap energy. PL measurement showed a higher electron recombination rate as the intensity increased upon doping relative to the doped TiO2. The strongest Raman signal of TiO2 at 640 cm−1 was indexed to the Eg vibrational mode utilizing Raman spectroscopy. Moreover, TEM images confirmed the QD formation and the d-spacing (0.34–0.35 nm) was evaluated using the Gatan software, comparable with the XRD measurements. Additionally, the dye degradation efficiency of the prepared nanocatalysts was examined against MB using different media. Among these, the most effective dye removal efficiency was observed in the basic medium. To investigate the influence of Ba doping on the TiO2 lattice from the viewpoint of the electronic structures, the electronic densities of states of the undoped and doped TiO2 systems were computed. With increasing the Ba concentration, the band gap values appear to slightly decrease. According to the absorption spectrum study, pristine TiO2 solely absorbed photons in the ultraviolet region, with no photo-absorption activity in visible light. The existence of an in-gap in the valence band in the Ba-doped TiO2 configurations causes a significant redshift of the absorption edge, making it easier for electrons to be pushed to the conduction band. Lastly, the TiO2 and Ba (2%, 4%)-doped TiO2 QDs were found to be more effective against MB dye removal (99.5% in basic medium).Conflicts of interest
There are no conflicts to declare.Acknowledgements
The authors are grateful to the higher education commission (HEC), Pakistan, for financial funding through NRPU-20-17615.References
- A. L. Srivastav, Chemical fertilizers and pesticides: role in groundwater contamination, Agrochem. Detect., Treat. Rem., 2020, 143–159, DOI:10.1016/b978-0-08-103017-2.00006-4.
- D. Zhao, Y. Yu and J. P. Chen, Treatment of lead contaminated water by a PVDF membrane that is modified by zirconium, phosphate and PVA, Water Res., 2016, 101, 564–573, DOI:10.1016/j.watres.2016.04.078.
- M. M. Mekonnen and A. Y. Hoekstra, Sustainability: four billion people facing severe water scarcity, Sci. Adv., 2016, 2, e1500323, DOI:10.1126/sciadv.1500323.
- M. Kummu, J. H. A. Guillaume, H. De Moel, S. Eisner, M. Flörke, M. Porkka, S. Siebert, T. I. E. Veldkamp and P. J. Ward, The world’s road to water scarcity: shortage and stress in the 20th century and pathways towards sustainability, Sci. Rep., 2016, 6, 38495, DOI:10.1038/srep38495.
- U. I. Gaya and A. H. Abdullah, Heterogeneous photocatalytic degradation of organic contaminants over titanium dioxide: a review of fundamentals, progress and problems, J. Photochem. Photobiol., C, 2008, 9, 1–12, DOI:10.1016/j.jphotochemrev.2007.12.003.
- S. Dervin, D. D. Dionysiou and S. C. Pillai, 2D nanostructures for water purification: graphene and beyond, Nanoscale, 2016, 8, 15115–15131, 10.1039/c6nr04508a.
- B. De Caprariis, M. Scarsella, A. Petrullo and P. De Filippis, Olive oil residue gasification and syngas integrated clean up system, Fuel, 2015, 158, 705–710, DOI:10.1016/j.fuel.2015.06.012.
- S. A. Khan, Z. Arshad, S. Shahid, I. Arshad, K. Rizwan, M. Sher and U. Fatima, Synthesis of TiO2/graphene oxide nanocomposites for their enhanced photocatalytic activity against methylene blue dye and ciprofloxacin, Composites, Part B, 2019, 175, 107120, DOI:10.1016/j.compositesb.2019.107120.
- H. Luo, Y. Zeng, D. He and X. Pan, Application of iron-based materials in heterogeneous advanced oxidation processes for wastewater treatment: a review, Chem. Eng. J., 2021, 407, 127191, DOI:10.1016/j.cej.2020.127191.
- L. R. Marcelo, J. S. de Gois, A. A. da Silva and D. V. Cesar, Synthesis of iron-based magnetic nanocomposites and applications in adsorption processes for water treatment: a review, Environ. Chem. Lett., 2021, 19, 1229–1274, DOI:10.1007/s10311-020-01134-2.
- C. L. Loor-Moreira, K. J. Fernández-Andrade, G. S. Cedeño-Solórzano, G. M. Manzaba-Salazar, Y. Gómez-Salcedo, J. M. Rodríguez-Díaz and R. J. Baquerizo-Crespo, Generalities of the Coagulation-Flocculation Process: A Perspective on Biocoagulants, in Innov. Biotechnol. a Sustain. Futur., Springer International Publishing, 2021, pp. 333–352, DOI:10.1007/978-3-030-80108-3_16.
- N. Ika Pratiwi, A. Mukimin, N. Zen and I. Septarina, Integration of electrocoagulation, adsorption and wetland technology for jewelry industry wastewater treatment, Sep. Purif. Technol., 2021, 279, 119690, DOI:10.1016/j.seppur.2021.119690.
- M. S. Samuel, E. Selvarajan, T. Mathimani, N. Santhanam, T. N. Phuong, K. Brindhadevi and A. Pugazhendhi, Green synthesis of cobalt-oxide nanoparticle using jumbo Muscadine (Vitis rotundifolia): Characterization and photo-catalytic activity of acid Blue-74, J. Photochem. Photobiol., B, 2020, 211, 112011, DOI:10.1016/j.jphotobiol.2020.112011.
- R. Murugan, L. Kashinath, R. Subash, P. Sakthivel, K. Byrappa, S. Rajendran and G. Ravi, Pure and alkaline metal ion (Mg, Ca, Sr, Ba) doped cerium oxide nanostructures for photo degradation of methylene blue, Mater. Res. Bull., 2018, 97, 319–325, DOI:10.1016/j.materresbull.2017.09.026.
- Y. Zheng, L. Cao, G. Xing, Z. Bai, J. Huang and Z. Zhang, Microscale flower-like magnesium oxide for highly efficient photocatalytic degradation of organic dyes in aqueous solution, RSC Adv., 2019, 9, 7338–7348, 10.1039/C8RA10385B.
- S. Yang, P. Huang, L. Peng, C. Cao, Y. Zhu, F. Wei, Y. Sun and W. Song, Hierarchical flowerlike magnesium oxide hollow spheres with extremely high surface area for adsorption and catalysis, J. Mater. Chem. A, 2015, 4, 400–406, 10.1039/c5ta08542j.
- J. Bahadur, S. Agrawal, V. Panwar, A. Parveen and K. Pal, Antibacterial properties of silver doped TiO2 nanoparticles synthesized via sol-gel technique, Macromol. Res., 2016, 24, 488–493, DOI:10.1007/s13233-016-4066-9.
- S. M. Gupta and M. Tripathi, A review of TiO2 nanoparticles, Chin. Sci. Bull., 2011, 56, 1639–1657, DOI:10.1007/s11434-011-4476-1.
- E. Y. C. Yan, S. Zakaria and C. H. Chia, One-step synthesis of titanium oxide nanocrystal-rutile by hydrothermal method, AIP Conf. Proc., 2014, 122–128, DOI:10.1063/1.4895183.
- A. F. Alkaim, T. A. Kandiel, F. H. Hussein, R. Dillert and D. W. Bahnemann, Solvent-free hydrothermal synthesis of anatase TiO2 nanoparticles with enhanced photocatalytic hydrogen production activity, Appl. Catal., A, 2013, 466, 32–37, DOI:10.1016/j.apcata.2013.06.033.
- X. Hu, G. Li and J. C. Yu, Design, fabrication, and modification of nanostructured semiconductor materials for environmental and energy applications, Langmuir, 2010, 26, 3031–3039, DOI:10.1021/la902142b.
- Y. Bai, I. Mora-Seró, F. De Angelis, J. Bisquert and P. Wang, Titanium dioxide nanomaterials for photovoltaic applications, Chem. Rev., 2014, 114, 10095–10130, DOI:10.1021/cr400606n.
- K. Vijayalakshmi and D. Sivaraj, Synergistic antibacterial activity of barium doped TiO2 nanoclusters synthesized by microwave processing, RSC Adv., 2016, 6, 9663–9671, 10.1039/c5ra28125c.
- G. Mills and M. R. Hoffmann, Photocatalytic Degradation of Pentachlorophenol on TiO2 Particles: Identification of Intermediates and Mechanism of Reaction, Environ. Sci. Technol., 1993, 27, 1681–1689, DOI:10.1021/es00045a027.
- S. Mugundan, P. Praveen, S. Sridhar, S. Prabu, K. L. Mary, M. Ubaidullah, S. F. Shaikh and S. Kanagesan, Sol-gel synthesized barium doped TiO2 nanoparticles for solar photocatalytic application, Inorg. Chem. Commun., 2022, 139, 109340, DOI:10.1016/j.inoche.2022.109340.
- B. Shahmoradi, M. A. Pordel, M. Pirsaheb, A. Maleki, S. Kohzadi, Y. Gong, R. R. Pawar, S. M. Lee, H. P. Shivaraju and G. McKay, Synthesis and characterization of barium-doped TiO2 nanocrystals for photocatalytic degradation of acid red 18 under solar irradiation, Desalin. Water Treat., 2017, 88, 200–206, DOI:10.5004/dwt.2017.21424.
- H. A. Le, L. T. Linh, S. Chin and J. Jurng, Photocatalytic degradation of methylene blue by a combination of TiO 2-anatase and coconut shell activated carbon, Powder Technol., 2012, 225, 167–175, DOI:10.1016/j.powtec.2012.04.004.
- Z. Chen, L. Fang, W. Dong, F. Zheng, M. Shen and J. Wang, Inverse opal structured Ag/TiO2 plasmonic photocatalyst prepared by pulsed current deposition and its enhanced visible light photocatalytic activity, J. Mater. Chem. A, 2014, 2, 824–832, 10.1039/c3ta13985a.
- P. Praveen, G. Viruthagiri, S. Mugundan and N. Shanmugam, Structural, optical and morphological analyses of pristine titanium di-oxide nanoparticles - synthesized via sol-gel route, Spectrochim. Acta, Part A, 2014, 117, 622–629, DOI:10.1016/j.saa.2013.09.037.
- A. Kathiravan and R. Renganathan, Photosensitization of colloidal TiO2 nanoparticles with phycocyanin pigment, J. Colloid Interface Sci., 2009, 335, 196–202, DOI:10.1016/j.jcis.2009.03.076.
- N. Ullah, S. M. Shah, R. Ansir, S. Erten-Ela, S. Mushtaq and S. Zafar, Pyrocatechol violet sensitized cadmium and barium doped TiO2/ZnO nanostructures: as photoanode in DSSC, Mater. Sci. Semicond. Process., 2021, 135, 106119, DOI:10.1016/j.mssp.2021.106119.
- K. Vijayalakshmi and D. Sivaraj, Synergistic antibacterial activity of barium doped TiO2 nanoclusters synthesized by microwave processing, RSC Adv., 2016, 6, 9663–9671, 10.1039/c5ra28125c.
- A. Ashfaq, M. Ikram, A. Haider, A. Ul-Hamid, I. Shahzadi and J. Haider, Nitrogen and Carbon Nitride-Doped TiO2 for Multiple Catalysis and Its Antimicrobial Activity, Nanoscale Res. Lett., 2021, 16, 1–15, DOI:10.1186/s11671-021-03573-4.
- F. Zhao, F. Zhang, D. Han, K. Huang, Y. Yang and H. Yin, Enhanced light-driven hydrogen generation on carbon quantum dots with TiO2 nanoparticles, Phys. Chem. Chem. Phys., 2021, 23, 10448–10455, 10.1039/d1cp00417d.
- M. Ikram, N. Abid, A. Haider, A. Ul-Hamid, J. Haider, A. Shahzadi, W. Nabgan, S. Goumri-Said, A. R. Butt and M. B. Kanoun, Toward efficient dye degradation and the bactericidal behavior of Mo-doped La2O3 nanostructures, Nanoscale Adv., 2022, 4, 926–942, 10.1039/d1na00802a.
- Y. Gong, T. Andelman, G. F. Neumark, S. O'Brien and I. L. Kuskovsky, Origin of defect-related green emission from ZnO nanoparticles: effect of surface modification, Nanoscale Res. Lett., 2007, 2, 297–302, DOI:10.1007/s11671-007-9064-6.
- C. Yu, K. Yang, Q. Shu, J. C. Yu, F. Cao, X. Li and X. Zhou, Preparation, characterization and photocatalytic performance of Mo-doped ZnO photocatalysts, Sci. China: Chem., 2012, 55, 1802–1810, DOI:10.1007/s11426-012-4721-8.
- R. S. Yadav, S. J. Dhoble and S. B. Rai, Improved photon upconversion photoluminescence and intrinsic optical bistability from a rare earth co-doped lanthanum oxide phosphor: Via Bi3+ doping, New J. Chem., 2018, 42, 7272–7284, 10.1039/c8nj01091a.
- R. S. Yadav, R. V. Yadav, A. Bahadur and S. B. Rai, Enhanced white light emission from a Tm3+/Yb3+/Ho3+ co-doped Na4ZnW3O12 nano-crystalline phosphor via Li+ doping, RSC Adv., 2016, 6, 51768–51776, 10.1039/c6ra08116a.
- R. S. Yadav, R. K. Verma and S. B. Rai, Intense white light emission in Tm3+/Er3+/Yb 3+ co-doped Y2O3-ZnO nano-composite, J. Phys. D: Appl. Phys., 2013, 46, 275101, DOI:10.1088/0022-3727/46/27/275101.
- E. Sediva, D. Bohdanov, G. F. Harrington, I. Rafalovskyi, J. Drahokoupil, F. Borodavka, P. Marton and J. Hlinka, Anisotropic Strain in Rare-Earth Substituted Ceria Thin Films Probed by Polarized Raman Spectroscopy and First-Principles Calculations, ACS Appl. Mater. Interfaces, 2020, 12, 56251–56259, DOI:10.1021/acsami.0c14249.
- A. H. Youssef, J. Zhang, A. Ehteshami, G. Kolhatkar, C. Dab, D. Berthomieu, A. Merlen, F. Légaré and A. Ruediger, Symmetry-Forbidden-Mode Detection in SrTiO3Nanoislands with Tip-Enhanced Raman Spectroscopy, J. Phys. Chem. C, 2021, 125, 6200–6208, DOI:10.1021/acs.jpcc.0c10938.
- M. Ikram, A. Mahmood, A. Haider, S. Naz, A. Ul-Hamid, W. Nabgan, I. Shahzadi, J. Haider, I. Ahmad and S. Ali, Dye degradation, antibacterial and in silico analysis of Mg/cellulose-doped ZnO nanoparticles, Int. J. Biol. Macromol., 2021, 185, 153–164, DOI:10.1016/j.ijbiomac.2021.06.101.
- C. A. Chen, Y. S. Huang, W. H. Chung, D. S. Tsai and K. K. Tiong, Raman spectroscopy study of the phase transformation on nanocrystalline titania films prepared via metal organic vapour deposition, J. Mater. Sci.: Mater. Electron., 2009, 20, 303–306, DOI:10.1007/S10854-008-9595-3.
- T. N. T. Thu, N. N. Thi, V. T. Quang, K. N. Hong, T. N. Minh and N. L. T. Hoai, Synthesis, characterisation, and effect of pH on degradation of dyes of copper-doped TiO2, J. Exp. Nanosci., 2016, 11, 226–238, DOI:10.1080/17458080.2015.1053541.
- E. Haque, J. W. Jun and S. H. Jhung, Adsorptive removal of methyl orange and methylene blue from aqueous solution with a metal-organic framework material, iron terephthalate (MOF-235), J. Hazard. Mater., 2011, 185, 507–511, DOI:10.1016/j.jhazmat.2010.09.035.
- K. P. Singh, D. Mohan, S. Sinha, G. S. Tondon and D. Gosh, Color removal from wastewater using low-cost activated carbon derived from agricultural waste material, Ind. Eng. Chem. Res., 2003, 42, 1965–1976, DOI:10.1021/ie020800d.
- M. Ikram, N. Abid, A. Haider, A. Ul-Hamid, J. Haider, A. Shahzadi, W. Nabgan, S. Goumri-Said, A. R. Butt and M. B. Kanoun, Toward efficient dye degradation and the bactericidal behavior of Mo-doped La2O3nanostructures, Nanoscale Adv., 2022, 4, 926–942, 10.1039/d1na00802a.
- J. Wang, G. Wang, B. Cheng, J. Yu and J. Fan, Sulfur-doped g-C3N4/TiO2 S-scheme heterojunction photocatalyst for Congo Red photodegradation, Chin. J. Catal., 2021, 42(1), 56–68, DOI:10.1016/S1872-2067(20)63634-8 , ISSN 1872-2067..
- K. Kasinathan, J. Kennedy, M. Elayaperumal, M. Henini and M. Malik, Photodegradation of organic pollutants RhB dye using UV simulated sunlight on ceria based TiO2 nanomaterials for antibacterial applications, Sci. Rep., 2016, 6, 1–12, DOI:10.1038/srep38064.
- K. Sonu, S. H. Puttaiah, V. S. Raghavan and S. S. Gorthi, Photocatalytic degradation of MB by TiO2: studies on recycle and reuse of photocatalyst and treated water for seed germination, Environ. Sci. Pollut. Res., 2021, 28, 48742–48753, DOI:10.1007/s11356-021-13863-0.
- D. Komaraiah, P. Madhukar, Y. Vijayakumar, M. V. R. Reddy and R. Sayanna, Photocatalytic degradation study of methylene blue by brookite TiO2 thin film under visible light irradiation, Mater. Today: Proc., 2016, 3770–3778, DOI:10.1016/j.matpr.2016.11.026.
- N. H. Mohamad Idris, J. Rajakumar, K. Y. Cheong, B. J. Kennedy, T. Ohno, A. Yamakata and H. L. Lee, Titanium Dioxide/Polyvinyl Alcohol/Cork Nanocomposite: A Floating Photocatalyst for the Degradation of Methylene Blue under Irradiation of a Visible Light Source, ACS Omega, 2021, 6, 14493–14503, DOI:10.1021/acsomega.1c01458.
- F. Kazemi, Z. Mohamadnia, B. Kaboudin and Z. Karimi, Photodegradation of methylene blue with a titanium dioxide/polyacrylamide photocatalyst under sunlight, J. Appl. Polym. Sci., 2016, 133, 43386, DOI:10.1002/app.43386.
- S. Smidstrup, T. Markussen, P. Vancraeyveld, J. Wellendorff, J. Schneider, T. Gunst, B. Verstichel, D. Stradi, P. A. Khomyakov, U. G. Vej-Hansen, M. E. Lee, S. T. Chill, F. Rasmussen, G. Penazzi, F. Corsetti, A. Ojanperä, K. Jensen, M. L. N. Palsgaard, U. Martinez, A. Blom, M. Brandbyge and K. Stokbro, QuantumATK: an integrated platform of electronic and atomic-scale modelling tools, J. Phys.: Condens. Matter, 2020, 32, 015901, DOI:10.1088/1361-648X/ab4007.
- J. P. Perdew, K. Burke and M. Ernzerhof, Generalized gradient approximation made simple, Phys. Rev. Lett., 1996, 77, 3865–3868, DOI:10.1103/PhysRevLett.77.3865.
- L. G. Ferreira, M. Marques and L. K. Teles, Slater half-occupation technique revisited: The LDA-1/2 and GGA-1/2 approaches for atomic ionization energies and band gaps in semiconductors, AIP Adv., 2011, 1, 032119, DOI:10.1063/1.3624562.
- M. B. Kanoun and S. Goumri-Said, Insights into the impact of Mn-doped inorganic CsPbBr3 perovskite on electronic structures and magnetism for photovoltaic application, Mater. Today Energy, 2021, 21, 100796, DOI:10.1016/j.mtener.2021.100796.
- M. J. van Setten, M. Giantomassi, E. Bousquet, M. J. Verstraete, D. R. Hamann, X. Gonze and G. M. Rignanese, The PSEUDODOJO: training and grading a 85 element optimized norm-conserving pseudopotential table, Comput. Phys. Commun., 2018, 226, 39–54, DOI:10.1016/j.cpc.2018.01.012.
- N. Foreman and D. R. Peacor, Refinement of the nepheline structure at several temperatures, Z. fur Krist.–New Cryst. Struct., 1970, 132, 45–70, DOI:10.1524/zkri.1970.132.1-6.45.
- N. Shahzad, A. Hussain, N. Mustafa, N. Ali, M. B. Kanoun and S. Goumri-Said, First principles study of the adsorption and dissociation mechanisms of H2S on a TiO2 anatase (001) surface, RSC Adv., 2016, 6, 7941–7949, 10.1039/c5ra20875k.
- J. Liu, M. Weng, S. Li, X. Chen, J. Cen, J. Jie, W. Xiao, J. Zheng and F. Pan, High-throughput HSE study on the doping effect in anatase TiO2, Phys. Chem. Chem. Phys., 2019, 22, 39–53, 10.1039/c9cp04591k.
- F. Ahmed, M. Kanoun, C. Awada and C. Jonin, An Experimental and Theoretical Study on the Effect of Silver Nanoparticles Concentration on the Structural, Morphological, Optical, and Electronic Properties of TiO2, 2021, https://Mdpi.com, https://www.mdpi.com/2073-4352/11/12/1488, accessed, May 18, 2022, P. B.- Crystals, undefined Search PubMed.
- Z. Mei, G. Wang, S. Yan and J. Wang, Rapid Microwave-Assisted Synthesis of 2D/1D ZnIn2S4/TiO2 S-Scheme Heterojunction for Catalyzing Photocatalytic Hydrogen Evolution, Acta Phys.-Chim. Sin., 2021, 37(6), 2009097 Search PubMed.
- H. Wang, X. Li, X. Zhao, C. Li, X. Song, P. Zhang, P. Huo and X. Li, A review on heterogeneous photocatalysis for environmental remediation: From semiconductors to modification strategies, Chin. J. Catal., 2022, 43(2), 178–214, DOI:10.1016/S1872-2067(21)63910-4 , ISSN 1872-2067..
| This journal is © The Royal Society of Chemistry 2022 |