 Open Access Article
Synthesis of crystalline WS3 with a layered structure and desert-rose-like morphology†
Zeyao
Zhang
ac,
Yi
Qiu
a,
Wenqing
Yan
ab,
Zhengyang
Zhou
a,
Yixi
Yao
ab,
Xiyan
Liu
a,
Junliang
Sun
 a and
Yan
Li
 *abc
*abc
aBeijing National Laboratory for Molecular Science, State Key Laboratory of Rare Earth Materials Chemistry and Applications, College of Chemistry and Molecular Engineering, Peking University, Beijing, 100871, China. E-mail: yanli@pku.edu.cn
bAcademy for Advanced Interdisciplinary Studies, Peking University, Beijing 100871, China
cPKU-HKUST ShenZhen-HongKong Institution, Shenzhen, 518057, China
First published on 17th February 2022
Abstract
Tungsten disulphide has attracted great research interest due to its layered structure as well as physical and chemical properties. A less common type of tungsten sulphide, WS3, has also been studied as an electrochemical catalyst, but its crystal structure remains unclear because it has only been prepared in the amorphous form. In this work, crystalline WS3 is synthesized with a desert-rose-like morphology through the sulphurization of WO3·0.33H2O in a solvothermal reaction. The composition of WS3 is confirmed by X-ray photoelectron spectroscopy measurements as well as thermogravimetric experiment. The crystalline WS3 also has a layered structure and is likely to belong to the trigonal crystal system. Its lattice parameters in the hexagonal description are 5.30 Å × 5.30 Å × 29.0 Å <90 ° × 90 ° × 120°>, which are determined by 3D electron diffraction and powder X-ray diffraction. The WS3 shows potential as catalyst for the electrochemical hydrogen evolution reaction. Our findings extend the family of layered tungsten sulphide materials.
Introduction
Tungsten disulphide and other transition metal dichalcogenides have recently attracted great attention for their outstanding physical1–4 and chemical properties5,6 as well as the potential applications.7,8 The most common tungsten sulphide is WS2, which has a layered structure. Each layer of WS2 is made up of one layer of W atoms sandwiched between two layers of S atoms. Within each layer, the W and S atoms are bonded covalently, while the interaction between the layers is van der Waals force. There are three common phases (or polymorphs) of WS2, which are named 1T, 2H, and 3R. The letters stand for the structural symmetry, i.e., trigonal, hexagonal, and rhombohedral, respectively, and the digit stands for the number of layers within each unit cell.9 The 2H phase is the thermodynamically stable phase, in which the W–S coordination is trigonal prismatic. In the 1T phase, the W–S coordination changes into distorted octahedral (also referred to as trigonal antiprismatic). In the 3R phase, the W–S coordination remains trigonal prismatic as in the 2H phase, but the stacking sequence of layers is different. However, the interlayer distances of the three phases are nearly the same, around 6.1 Å.WS3 is another kind of tungsten sulphide, which is typically prepared by the thermal decomposition of ammonium thiotungstate ((NH4)2WS4) in an inert atmosphere.10 To the best of our knowledge, WS3 has only been prepared in the amorphous form.11 It is generally believed that the amorphous WS3 has a chain-like structure with polysulphide anions.10,12 A detailed study on its analogue, the amorphous MoS3, indicated that there was a great structural similarity between MoS3 and the [Mo3S13]2− anion based on the X-ray photoelectron spectroscopy (XPS) results, where some of the S atoms formed the S22− ligands.13 In terms of electrochemical catalytic applications, both WSx and MoSx (x > 2) have been used as catalysts for the hydrogen evolution reaction, because their rich S22− ligands were believed to serve as the catalytically active sites.14–17 The Tafel slope of intrinsic 2H WS2 is generally above 100 mV dec−1.6,18 However, with careful design of the catalyst structure, improving the electron transport capability from the active sites to the electrode, the Tafel slopes of WSx and MoSx were dramatically improved to as low as 40 mV dec−1.14,16,17
Here, we synthesized crystalline WS3 for the first time and determined its lattice parameters by 3D electron diffraction (ED) measurements and powder X-ray diffraction (XRD). WS3 showed activity as an electrochemical catalyst for the hydrogen evolution reaction (HER). Our findings not only extend the family of layered tungsten sulphide materials but also help to further study the exact crystal structure and potential applications of WS3.
Experimental
Hydrothermal synthesis of desert-rose-like WO3·0.33H2O
0.210 g of ammonium metatungstate hydrate (purity 99%, purchased from Sinopharm Chemical Reagent Co., Ltd) was dissolved in 12.2 g of deionized water, and 8.3 g of nitric acid was added. The solution (pH ∼ −0.65) was stirred for 10 minutes. 16.6 g of the solution was added to a 20 mL Teflon-lined stainless-steel autoclave to carry out the hydrothermal reaction at 180 °C for 12 hours. The light green precipitate was collected by centrifugation at 10![[thin space (1/6-em)]](https://www.rsc.org/images/entities/char_2009.gif) 000 rpm, washed with water several times until the pH of the supernatant was neutral and then freeze-dried.
000 rpm, washed with water several times until the pH of the supernatant was neutral and then freeze-dried.
Solvothermal synthesis of desert-rose-like WS3
0.10 g of the synthesized WO3·0.33H2O, 0.42 g of thioacetamide, and 14 g of DMF were mixed thoroughly and added to a 23 mL Teflon-lined stainless-steel autoclave. The solvothermal reaction was carried out at 200 °C for 12 hours. The black precipitate was collected by centrifugation at 10![[thin space (1/6-em)]](https://www.rsc.org/images/entities/char_2009.gif) 000 rpm, washed with water 5 times and then freeze-dried.
000 rpm, washed with water 5 times and then freeze-dried.
Thermogravimetric experiment of WS3
45.77 mg of WS3 was added in a quartz boat and continuously annealed in an Ar gas flow at 200 °C, 300 °C, 400 °C, 500 °C, and 600 °C for 30 min each. The ramp rate was 5 °C min−1. After each annealing, the sample was cooled to room temperature and weighed again.Electrochemical measurements
The WS3 sample was dispersed in isopropanol (1 mg mL−1). 10 μL of the above dispersion was drop-cast onto a glassy carbon electrode (circular, 0.5 cm in diameter), and dried naturally in a closed space (the loading amount was 51 μg cm−2).Electrochemical measurements were performed with a three-electrode system connected to an electrochemical workstation (CHI Corporation, model 760E). The working electrode is the above-mentioned glassy carbon electrode. The counter electrode is a platinum wire electrode. The reference electrode is a saturated Ag/AgCl electrode.
For the HER, the electrolyte was 0.5 M aqueous sulfuric acid. Before testing, the sulfuric acid solution was bubbled with N2 for at least 30 min to remove the dissolved oxygen. The measurement was always carried out under the protection of a N2 atmosphere. The catalyst surface was first cleaned using cyclic voltammetry, scanning from 0 to 0.3 V (vs. NHE) for 25 cycles (scanning speed of 50 mV s−1). Then, linear sweep voltammetry was used to record the polarization curve of the HER at a scan rate of 2 mV s−1.
Characterization
The SEM images were obtained on a Hitachi S4800 scanning electron microscope. The XRD measurements were performed on a PANalytical X'Pert3 Powder X-ray diffractometer using monochromatic Cu-Kα radiation (λ = 1.5406 Å, 40 kV, 40 mA). XPS measurements were performed on a Kratos Analytical AXIS Ultra X-ray photoelectron spectroscope with Al-Kα radiation (hν = 1486.71 eV). The X-ray source was operated at 225 W with 15 kV acceleration voltage. The C 1s line at 284.8 eV was used to calibrate the binding energies. The TEM study was performed on an FEI Tecnai F20 electron microscope. The 3D electron diffraction data were collected by the rotation electron diffraction method, which was processed on a JEOL-2100 transmission electron microscope with an operation voltage of 200 kV. Raman spectroscopy measurements were carried out on a Horiba Jobin-Yvon LabRAM ARAMIS spectrometer with a 532 nm laser excitation.Results and discussion
We first synthesized the desert-rose-like WO3·0.33H2O microspheres via the hydrothermal reaction of ammonium metatungstate hydrate and nitric acid. The microspheres consisted of flattened crystal “petals” with thickness smaller than 100 nm (Fig. 1a and b). The sizes of the microspheres were in the range of 1 to 10 μm (Fig. 1c). The XRD pattern of the microspheres matched with the standard card of the orthorhombic phase WO3·0.33H2O (PDF #35-0270), as shown in Fig. 1d. These WO3·0.33H2O microspheres were used as starting materials for the sulphurization reaction.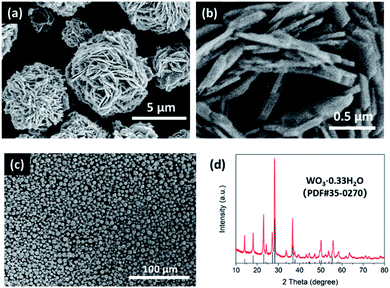 | ||
| Fig. 1 Scanning electron microscopy (SEM) images (a–c) and XRD pattern (d) of the desert-rose-like WO3·0.33H2O microspheres, which were used as the starting materials to synthesize WS3. | ||
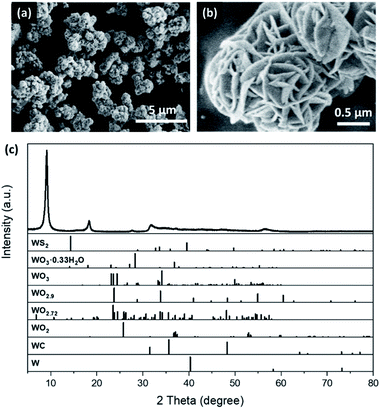
The sulphurization of the desert-rose-like WO3·0.33H2O microspheres was also carried out via the solvothermal reaction. Thioacetamide was used as the S source19 and dimethylformamide (DMF) was used as the solvent. The black sulphurization product also had a desert-rose-like morphology, but the size of the “petals” and the size of the microspheres were both smaller (Fig. 2a and b). The petals of WO3·0.33H2O were closely packed, while those of the sulphurization product were more opened-up. It is very likely that during the solvothermal reaction, W was first dissolved into the solvent and then precipitated. The solution turned dark red after the reaction, indicating the leaching of W. What surprised us was that, the XRD pattern of the sulphurization product showed that its structure was different from the common tungsten sulphide, WS2 (Fig. 2c). The Raman spectrum of the sulphurization product also confirmed that it was not WS2 (Fig. S1†). In fact, despite the simple and clear XRD pattern of the sulphurization product, it did not match with any XRD pattern of the potential W-containing substances in the crystal structure database (Fig. 2c). The starting materials only contained W, S, C, N, O, and H elements. We searched through all the possible materials containing one or more of those elements in the databases and found no match for our sulphurization product. Therefore, the sulphurization product was probably a new phase.
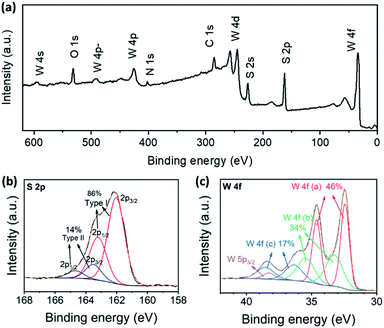
In order to find out more information on the sulphurization product, XPS measurements were taken. The predominant elements of the sulphurization product were W and S, as shown in the survey spectrum (Fig. 3a). The atomic ratio of W and S calculated from the spectrum was 1![[thin space (1/6-em)]](https://www.rsc.org/images/entities/char_2009.gif) :
:![[thin space (1/6-em)]](https://www.rsc.org/images/entities/char_2009.gif) 3.0, indicating that the composition of the sulphurization product was likely to be WS3. Besides, the XPS spectra in S 2p and W 4f regions of the sulphurization product were similar to the reported results for the amorphous WS3.10,20 We further investigated the valence of S and W through peak fitting analysis of the XPS spectra in S 2p and W 4f regions. The S 2p spectrum was fitted by two doublets, indicating at least two different types of S in the compound (Fig. 3b). The two 2p3/2 peaks were at 161.9 eV and 163.5 eV, and the relative contents were 86% and 14%, respectively. In the XPS study of amorphous MoS3 and other MoSx cluster anion compounds, the assignment of S 2p peaks was rather complicated.13,15,21 The doublet with a lower binding energy was assigned to basal plane S2− and terminal S22− and the higher one was assigned to apical S2− and bridging S22−. The fact that different types of S had quite similar binding energy in XPS made accurate relative quantification just based on S 2p peak analysis nearly impossible. Nonetheless, the two doublets did indicate the essential difference between our WS3 phase and the common WS2 compound. The S 2p spectrum of WS2 consisted of a simple doublet, of which the 2p3/2 peak was around 162 eV.22 But the full width at half maximum reported (0.63 eV) was smaller than our result (1.28 eV), which also indicated that the doublet with lower binding energy in our result was probably made up of not only the basal plane S2− as in WS2, but also some other components such as the terminal S22−. In the W 4f region, the spectrum was fitted by three doublets as well as the W 5p3/2 peak, which also appeared in this region (Fig. 3c). The three W 4f7/2 peaks were at 32.4 eV, 33.3 eV, and 36.4 eV, respectively, and the W 5p3/2 peak was at 38.2 eV. The XPS spectrum indicated a mixed valence state of +4 and higher ones and complex chemical environments of W. The positions of the first W 4f7/2 peak and the W 5p3/2 peak coincided well with those of WS2 (32.6 eV and 38.3 eV, respectively).22 Three similar doublets were also observed in the XPS of amorphous WS3 and were assigned to W(IV), W(V), and W(VI), respectively.20
3.0, indicating that the composition of the sulphurization product was likely to be WS3. Besides, the XPS spectra in S 2p and W 4f regions of the sulphurization product were similar to the reported results for the amorphous WS3.10,20 We further investigated the valence of S and W through peak fitting analysis of the XPS spectra in S 2p and W 4f regions. The S 2p spectrum was fitted by two doublets, indicating at least two different types of S in the compound (Fig. 3b). The two 2p3/2 peaks were at 161.9 eV and 163.5 eV, and the relative contents were 86% and 14%, respectively. In the XPS study of amorphous MoS3 and other MoSx cluster anion compounds, the assignment of S 2p peaks was rather complicated.13,15,21 The doublet with a lower binding energy was assigned to basal plane S2− and terminal S22− and the higher one was assigned to apical S2− and bridging S22−. The fact that different types of S had quite similar binding energy in XPS made accurate relative quantification just based on S 2p peak analysis nearly impossible. Nonetheless, the two doublets did indicate the essential difference between our WS3 phase and the common WS2 compound. The S 2p spectrum of WS2 consisted of a simple doublet, of which the 2p3/2 peak was around 162 eV.22 But the full width at half maximum reported (0.63 eV) was smaller than our result (1.28 eV), which also indicated that the doublet with lower binding energy in our result was probably made up of not only the basal plane S2− as in WS2, but also some other components such as the terminal S22−. In the W 4f region, the spectrum was fitted by three doublets as well as the W 5p3/2 peak, which also appeared in this region (Fig. 3c). The three W 4f7/2 peaks were at 32.4 eV, 33.3 eV, and 36.4 eV, respectively, and the W 5p3/2 peak was at 38.2 eV. The XPS spectrum indicated a mixed valence state of +4 and higher ones and complex chemical environments of W. The positions of the first W 4f7/2 peak and the W 5p3/2 peak coincided well with those of WS2 (32.6 eV and 38.3 eV, respectively).22 Three similar doublets were also observed in the XPS of amorphous WS3 and were assigned to W(IV), W(V), and W(VI), respectively.20
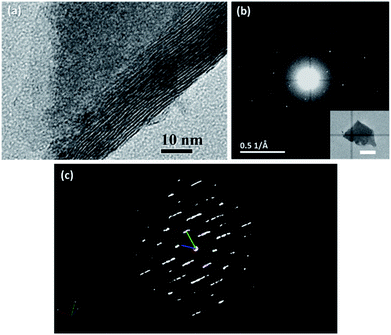
Based on the results of the above characterization, it was reasonable to say that the sulphurization product in our experiment was probably an unknown crystal phase of WS3. We then tried to figure out its crystal structure by transmission electron microscopy (TEM) and ED. In the TEM image (Fig. 4a), we found that the WS3 nanoflakes had a layered structure. The interlayer spacing was approx. 9.2 Å, which was generally in accordance with the first peak in the XRD spectrum at 9.1° (corresponding to 9.68 Å). The series of peaks at 9.1°, 18.3°, 27.7°, and 37.2° in the XRD spectrum (Fig. 2c) also suggested a layered structure, because the diffraction angles of the latter three peaks were integer multiples of the angle of the first peak, and their intensities gradually decreased. It was very likely that these peaks belonged to diffractions along the layers.
The ED pattern clearly showed that the WS3 nanoflake was a single crystal with a hexagonal characteristic (Fig. 4b). We tried to use the three-dimensional ED technique to determine the lattice parameters of the structure. However, because the WS3 nanoflakes were too thin in the perpendicular direction of the basal planes (i.e., the c-axis direction), the reciprocal lattice points of the crystals were elongated in that direction, making it difficult to accurately measure the cell edge length along that direction (Fig. 4c). Therefore, we only obtained the other five lattice parameters. The edge lengths, a and b, were 5.31 Å and 5.30 Å, and the angles, α, β, and γ, were 91.24°, 90.95°, and 119.19°, respectively. The parameters were very close to those of a hexagonal or trigonal crystal structure. Although the edge length c could not be determined by the ED results, it was possible to deduce it together with the XRD data. As we mentioned above, the series of peaks at 9.1°, 18.3°, 27.7°, and 37.2° in the XRD spectrum were from diffractions parallel to the c axis. The peak at 9.1° corresponded to a set of planes with a spacing of 9.68 Å, which must be an integer fraction of length c. After some trial and error, we came up with a probable assignment for all the XRD peaks in a trigonal crystal structure. The length of c was proposed to be 29.0 Å, which was 3 times the 9.68 Å spacing. Therefore, the series of peaks at 9.1°, 18.3°, 27.7°, and 37.2° were assigned to diffractions from planes (0 0 3), (0 0 6), (0 0 9), and (0 0 12), respectively. According to the systematic absence rule for trigonal crystal systems, only the diffractions that met the condition of −h + k + l = 3n (n = 0, 1, 2, …) could be observed. Therefore, diffractions such as (0 0 1) and (0 0 2) were absent. Then, we tried to assign the other peaks in the XRD spectrum based on the proposed structure. The peak at 31.8° was assigned to (0 1 8), whose calculated value was 31.4°. For the peak at 56.5°, there was a bunch of possible diffractions near its position, such as (1 2 5), (0 1 17), (0 2 13), and (2 1 7). The calculated position of the first diffraction was at 55.2° and those of the latter three were at 57.5°. So, it was rather difficult to make further assignment.
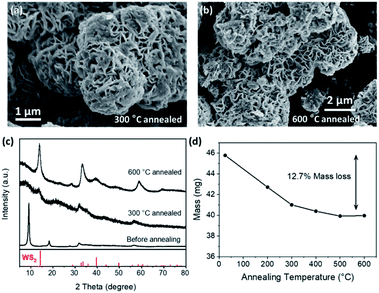
When annealed in an inert atmosphere, the amorphous WS3 gradually changed into WS2 at around 350 °C.10,20,23,24 So we annealed our crystalline WS3 in Ar and looked into the change of the crystal structure and the mass loss. As the annealing temperature increased, the WS3 gradually changed into WS2, as shown by the XRD patterns in Fig. 5c. The resultant WS2 from annealing generally preserved the desert-rose-like morphology (Fig. 5a and b). The “petals” seemed to become curvy and some amorphous substance was observed on the surface after annealing. There was no significant change of petal thickness (Fig. S2†). At 500 °C and 600 °C, there were nanoparticles formed on the petals, which were possibly the WS2 produced by annealing. The relative mass loss after full conversion was 12.7%, which was very close to the calculated 11.4% mass loss from WS3 to WS2. The sublimation of W-containing compounds might be responsible for the additional weight loss. This result further confirmed that the composition of our sulphurization product was WS3. Besides, we also tried to use inductively coupled plasma optical emission spectrometry to further determine the composition of WS3. But the problem regarding accurate digestion of S anions prevented us from getting the actual composition. The detailed discussion can be found in the ESI.†
To the best of our knowledge, only one way to synthesize WS3 has been reported in previous papers, that is, thermal decomposition of (NH4)2WS4 at 200–300 °C in an inert atmosphere.10,12,20,25–30 This method was well adopted by many research groups from the 1970s to 2010s. Besides, electrodeposition was used to produce WS3−x from (NH4)2WS4 solution.17 In the aforementioned papers, the synthesized WS3 was all amorphous.
So, why did our synthesis method lead to crystalline WS3? We believe the reasons are as follows. First, a solvothermal reaction was employed in our method, which is often used for the synthesis of nanocrystals with a metastable phase. As a metastable phase of tungsten sulphide, it was more likely that crystalline WS3 was obtained through the solvothermal reaction, compared to thermal decomposition. Second, since W had a strong affinity for O, it was very important to minimize the chemical potential of O so that the sulphurization of WO3 took place. Therefore, we chose DMF as the solvent, which had no oxygen. Finally, to further facilitate the sulphurization, the amount of S used in the reaction was far beyond equivalent (the molar ratio of W![[thin space (1/6-em)]](https://www.rsc.org/images/entities/char_2009.gif) :
:![[thin space (1/6-em)]](https://www.rsc.org/images/entities/char_2009.gif) S was 1
S was 1![[thin space (1/6-em)]](https://www.rsc.org/images/entities/char_2009.gif) :
:![[thin space (1/6-em)]](https://www.rsc.org/images/entities/char_2009.gif) 130). As a comparison, when using H2O as the solvent or using less S (molar ratio of W
130). As a comparison, when using H2O as the solvent or using less S (molar ratio of W![[thin space (1/6-em)]](https://www.rsc.org/images/entities/char_2009.gif) :
:![[thin space (1/6-em)]](https://www.rsc.org/images/entities/char_2009.gif) S was 1
S was 1![[thin space (1/6-em)]](https://www.rsc.org/images/entities/char_2009.gif) :
:![[thin space (1/6-em)]](https://www.rsc.org/images/entities/char_2009.gif) 13), there was almost no precipitate after the solvothermal reaction.
13), there was almost no precipitate after the solvothermal reaction.
We tested the activity of the desert-rose-like WS3 microspheres as an electrochemical catalyst for the HER (Fig. 6). The WS3 had rich edge sites and S22− species, which were considered as the catalytically active sites.14,15,31 Our catalyst showed reasonable activity, with an overpotential of 130 mV, a Tafel slope of 86 mV dec−1, and an exchange current density of 1.4 × 10⁻⁷ A cm−2. The HER activities of tungsten sulphide catalysts are summarized in Table S1.† The Tafel slopes ranged from 43.7 to 115 mV dec−1. The overpotentials ranged from 75 to 200 mV. The Tafel slope of our catalyst exceeded most of the reported bulk WS2 catalysts.6,18,32–34 The major limitation of the catalytic activity was probably the poor electron transportation between the active sites and the electrode, which is a common problem for the tungsten sulphide catalysts. For WS2, the 1T phase was often employed as an efficient HER catalyst because of its metallic conductivity.6,35 Besides, incorporating conductive supports, such as reduced graphene oxides, was another way to improve the conductivity.32 The latter strategy may also apply to WS3.
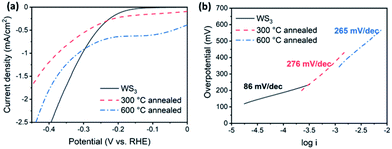 | ||
| Fig. 6 Activity of WS3 as the electrochemical catalyst for the HER. Polarization curves (a) and Tafel curves (b) of as-prepared WS3, and WS3 annealed at 300 °C and 600 °C are shown respectively. | ||
The HER activity of WS3 was significantly reduced after annealing. The Tafel slope increased to 276 mV dec−1 (annealed at 300 °C) and 265 mV dec−1 (annealed at 600 °C), respectively. The onset potential was also increased to more than 200 mV. There are two possible causes for the reduced activity. First, the active S22− sites were likely to be transformed into the less active S2− sites during the conversion of WS3 to WS2. Second, the grain boundaries formed during the change of phases were unfavorable for the transport of electrons.
Conclusions
We synthesized a new phase of WS3 with a new crystalline structure and a desert-rose-like microsphere morphology via a solvothermal process from WO3·0.33H2O microspheres. The WS3 was likely to have a trigonal crystal structure with the lattice parameters in hexagonal description of 5.30 Å × 5.30 Å × 29.0 Å <90 ° × 90 ° × 120°>, which were determined by the 3D ED and XRD data. The WS3 sample showed potential to serve as an electrochemical catalyst for the hydrogen evolution reaction. Although amorphous WS3 has been known for a long time, this is the first time that crystalline WS3 has been reported. Hereby, a new member of WS3 is added to the family of layered tungsten sulphide materials. Afterwards, the physical and chemical properties will be carefully studied with high-quality samples obtained by controlled preparation.Conflicts of interest
There are no conflicts to declare.Acknowledgements
This work was supported by the National Natural Science Foundation of China (22120102004, 21631002), Ministry of Science and Technology of China (2016YFA0201904), Shenzhen KQTD Project (KQTD20180411143400981), and Beijing National Laboratory for Molecular Sciences (BNLMS-CXTD-202001).References
- A. K. Geim and I. V. Grigorieva, Nature, 2013, 499, 419–425 CrossRef CAS PubMed.
- Y. Liu, N. O. Weiss, X. Duan, H.-C. Cheng, Y. Huang and X. Duan, Nat. Rev. Mater., 2016, 1, 16042 CrossRef CAS.
- K. S. Novoselov, A. Mishchenko, A. Carvalho and A. H. Castro Neto, Science, 2016, 353, aac9439 CrossRef CAS PubMed.
- Y. Liu, Y. Huang and X. Duan, Nature, 2019, 567, 323–333 CrossRef CAS PubMed.
- Y. Li, H. Wang, L. Xie, Y. Liang, G. Hong and H. Dai, J. Am. Chem. Soc., 2011, 133, 7296–7299 CrossRef CAS PubMed.
- D. Voiry, H. Yamaguchi, J. Li, R. Silva, D. C. B. Alves, T. Fujita, M. Chen, T. Asefa, V. B. Shenoy, G. Eda and M. Chhowalla, Nat. Mater., 2013, 12, 850–855 CrossRef CAS PubMed.
- S. X. Wu, Z. Y. Zeng, Q. Y. He, Z. J. Wang, S. J. Wang, Y. P. Du, Z. Y. Yin, X. P. Sun, W. Chen and H. Zhang, Small, 2012, 8, 2264–2270 CrossRef CAS PubMed.
- X. Li, J. Y. Shan, W. Z. Zhang, S. Su, L. H. Yuwen and L. H. Wang, Small, 2017, 13, 28 Search PubMed.
- M. Chhowalla, H. S. Shin, G. Eda, L.-J. Li, K. P. Loh and H. Zhang, Nat. Chem., 2013, 5, 263–275 CrossRef PubMed.
- K. Liang, S. Cramer, D. Johnston, C. Chang, A. Jacobson and R. Chianelli, J. Non-Cryst. Solids, 1980, 42, 345–356 CrossRef CAS.
- H. Jehn, G. Bär, E. Best and E. Koch, W Tungsten, Springer-Verlag Berlin Heidelberg, 1993 Search PubMed.
- K. Liang, A. Jacobson, R. Chianelli and F. Betts, J. Non-Cryst. Solids, 1980, 35, 1249–1254 CrossRef.
- T. Weber, J. Muijsers and J. Niemantsverdriet, J. Phys. Chem., 1995, 99, 9194–9200 CrossRef CAS.
- H. Vrubel, D. Merki and X. Hu, Energy Environ. Sci., 2012, 5, 6136–6144 RSC.
- J. Kibsgaard, T. F. Jaramillo and F. Besenbacher, Nat. Chem., 2014, 6, 248–253 CrossRef CAS PubMed.
- T. Wang, J. Zhuo, K. Du, B. Chen, Z. Zhu, Y. Shao and M. Li, Adv. Mater., 2014, 26, 3761–3766 CrossRef CAS PubMed.
- S. M. Tan and M. Pumera, ACS Appl. Mater. Interfaces, 2016, 8, 3948–3957 CrossRef CAS PubMed.
- Y. Zhang, J. Shi, G. Han, M. Li, Q. Ji, D. Ma, Y. Zhang, C. Li, X. Lang, Y. Zhang and Z. Liu, Nano Res., 2015, 8, 2881–2890 CrossRef CAS.
- Y. Li, D. Xu, Q. Zhang, D. Chen, F. Huang, Y. Xu, G. Guo and Z. Gu, Chem. Mater., 1999, 11, 3433–3435 CrossRef CAS.
- Y. Yi, C. T. Williams, M. Glascock, G. Xiong, J. Lauterbach and C. Liang, Mater. Res. Bull., 2014, 56, 54–64 CrossRef CAS.
- J. C. Muijsers, T. Weber, R. M. Vanhardeveld, H. W. Zandbergen and J. W. Niemantsverdriet, J. Catal., 1995, 157, 698–705 CrossRef CAS.
- D. J. Morgan, Surf. Sci. Spectra, 2018, 25, 014002 CrossRef.
- G. Alonso, M. Del Valle, J. Cruz, A. Licea-Claverie, V. Petranovskii and S. Fuentes, Catal. Lett., 1998, 52, 55–61 CrossRef CAS.
- D. Hunyadi, A. L. V. M. Ramos and I. M. Szilágyi, J. Therm. Anal. Calorim., 2015, 120, 209–215 CrossRef CAS.
- E. Diemann and A. Müller, Coord. Chem. Rev., 1973, 10, 79–122 CrossRef CAS.
- E. Diemann, Z. Anorg. Allg. Chem., 1977, 432, 127–135 CrossRef CAS.
- S. P. Cramer, K. S. Liang, A. J. Jacobson, C. H. Chang and R. R. Chianelli, Inorg. Chem., 1984, 23, 1215–1221 CrossRef CAS.
- R. A. Scott, A. Jacobson, R. Chianelli, W. Pan, E. Stiefel, K. Hodgson and S. Cramer, Inorg. Chem., 1986, 25, 1461–1466 CrossRef CAS.
- J. Espino, L. Alvarez, C. Ornelas, J. Rico, S. Fuentes, G. Berhault and G. Alonso, Catal. Lett., 2003, 90, 71–80 CrossRef CAS.
- Z. Huang, C. Wang, Z. Chen, H. Meng, C. Lv, Z. Chen, R. Han and C. Zhang, ACS Appl. Mater. Interfaces, 2014, 6, 10408–10414 CrossRef CAS PubMed.
- B. Hinnemann, P. G. Moses, J. Bonde, K. P. Jørgensen, J. H. Nielsen, S. Horch, I. Chorkendorff and J. K. Nørskov, J. Am. Chem. Soc., 2005, 127, 5308–5309 CrossRef CAS PubMed.
- J. Yang, D. Voiry, S. J. Ahn, D. Kang, A. Y. Kim, M. Chhowalla and H. S. Shin, Angew. Chem., Int. Ed., 2013, 52, 13751–13754 CrossRef CAS PubMed.
- L. Cheng, W. Huang, Q. Gong, C. Liu, Z. Liu, Y. Li and H. Dai, Angew. Chem., Int. Ed., 2014, 53, 7860–7863 CrossRef CAS PubMed.
- J. Lin, Z. Peng, G. Wang, D. Zakhidov, E. Larios, M. J. Yacaman and J. M. Tour, Adv. Energy Mater., 2014, 4, 1301875 CrossRef.
- M. A. Lukowski, A. S. Daniel, C. R. English, F. Meng, A. Forticaux, R. J. Hamers and S. Jin, Energy Environ. Sci., 2014, 7, 2608–2613 RSC.
Footnote |
| † Electronic supplementary information (ESI) available. See DOI: 10.1039/d1na00558h |
| This journal is © The Royal Society of Chemistry 2022 |

