
 Open Access Article
 This Open Access Article is licensed under a Creative Commons Attribution-Non Commercial 3.0 Unported Licence
Machine-learning-assisted discovery of perovskite materials with high dielectric breakdown strength†
Jianbo
Li
a,
Yuzhong
Peng
b,
Lupeng
Zhao
a,
Guodong
Chen
a,
Li
Zeng
a,
Guoqiang
Wei
a and
Yanhua
Xu
 *a
*a
aKey Laboratory of New Electric Functional Materials of Guangxi Colleges and Universities, Nanning Normal University, Nanning 530299, China. E-mail: yanhuaxu@nnnu.edu.cn
bGuangxi Key Lab of Human machine Interaction and Intelligent Decision, Nanning Normal University, Nanning, 530001, China
First published on 3rd October 2022
Abstract
In this paper, we have built a stepwise model based on the XGBoost machine learning algorithm to screen perovskite materials with high dielectric breakdown strength by comparing six machine learning algorithms. Here, the phonon cutoff frequency of perovskite materials can be predicted as an instrumental variable from features that can be commonly and easily found in materials databases. This prediction model shows outstanding performance and greatly reduces the amount of computation. Then we have screened borate perovskite materials with high dielectric breakdown strength such as LaBO3, AlBO3 and LuBO3 from a database of 760 perovskite oxides. The results can help search for possible perovskite materials with high dielectric breakdown strength for application in dielectric capacitors.
Instruction
Dielectric capacitors, as a leading energy storage technology, have high power density, fast response time, higher operating voltage, lower cost and longer cycle life,1 which are more suitable for large-scale applications. However, the energy density of dielectric capacitors is always lower than those of other capacitors. The high energy density of a dielectric material can greatly improve the volume efficiency, which is advantageous to the miniaturization and light weight of the equipment.2 Accordingly, improving the energy density of a dielectric capacitor will greatly broaden its application prospect in the field of energy storage. Dielectric breakdown strength is the key influencing factor of the energy density for dielectric capacitors. When the applied electric field reaches the dielectric breakdown strength of the material, the energy density is maximized. Therefore, it is of great significance to explore new materials with high dielectric breakdown strength.3–15Perovskite materials are widely used in energy conversion and storage due to their variety, simple preparation process and outstanding properties.16–18 The general formula of perovskite compounds is usually expressed by ABX3, where A and B are cations of different sizes and X is an anion. Interestingly, 90% of elements in the periodic table can be used as A, B and X, and the structure of perovskites usually does not change.19 Therefore, rich perovskite materials with different properties can be produced by adjusting the composition of compound elements, which have broad development prospects in various fields. With the development of perovskite solar cells, the potential of perovskite materials in solar energy conversion has been gradually discovered. Many researchers show that perovskite materials have good dielectric properties and a large number of them have been considered as a new potential generation of dielectric materials.20 ABO3 perovskite oxides have become the focus in modern industrial catalysis and thermoelectric research due to their good stability, low cost and controllable structure.21,22 As a result, we pay attention to ABO3 perovskite oxides for dielectric capacitors with high dielectric breakdown strength in this paper.
The dielectric breakdown strength is usually obtained experimentally. In this method, the test material is sandwiched between two pieces of glass, and a high pressure and uniform electric field in the shape of the electrode gap is generated from an appropriate electric field, then multiple dielectric breakdown strength measurements are conducted at each point of the test material. The average value is obtained as the experimental result after removing the maximum and minimum values, and the experimental error is within 6%.23 Nevertheless, it represents the poor efficiency of the experimental method in screening materials with high dielectric breakdown strength from a large materials database. Therefore, it is necessary to explore other methods to guide experiments and improve efficiency. Density functional theory (DFT) calculations, as the main method to simulate various properties of materials to analyze and filter the target materials, can effectively avoid extensive experimentation. At present, the dielectric breakdown strength of materials can be calculated using a first-principles calculation framework based on von Hippel and Fröhlich's theories.24,25 However, the dielectric breakdown strength of materials is related not only to the inner factors (including chemical composition, chemical properties, crystal structure, etc.), but also to the external factors (including defect, morphology, impurities, degradation, interface, etc.26). The huge computational cost of the DFT calculation greatly reduces its efficiency of high-throughput exploration in material space.
Data-driven machine learning methods have attracted wide attention in various fields due to their advantages of simplicity, efficiency and accuracy,27 which have been successfully applied to the screening, composition and performance prediction of materials. Li et al.28 constructed a model to predict the thermodynamic relative stability of perovskite oxides based on more than 19![[thin space (1/6-em)]](https://www.rsc.org/images/entities/char_2009.gif) 000 DFT calculated data sets. Zhao et al.29 developed a machine learning model based on the constraint satisfaction problem of charge neutrality and constraint coefficient to screen the formed and stable perovskite oxides from ABO3 combinations. Liu et al.30 established a machine learning model based on 236 experimental data sets and screened 236 stable ferroelectric double perovskite oxides with research value from 4058905 candidate materials by predicting band gap values. Kim et al.20 successfully predicted the dielectric breakdown strength of ABX3 perovskites and found that the boron containing perovskites may be extremely tolerant towards high dielectric breakdown strength. In this paper, we compared six machine learning algorithms to build a model, which can screen perovskite materials with high dielectric breakdown strength.
000 DFT calculated data sets. Zhao et al.29 developed a machine learning model based on the constraint satisfaction problem of charge neutrality and constraint coefficient to screen the formed and stable perovskite oxides from ABO3 combinations. Liu et al.30 established a machine learning model based on 236 experimental data sets and screened 236 stable ferroelectric double perovskite oxides with research value from 4058905 candidate materials by predicting band gap values. Kim et al.20 successfully predicted the dielectric breakdown strength of ABX3 perovskites and found that the boron containing perovskites may be extremely tolerant towards high dielectric breakdown strength. In this paper, we compared six machine learning algorithms to build a model, which can screen perovskite materials with high dielectric breakdown strength.
Methodology
All of our work was completed with Python Programming Language in Jupyter notebook. The flow chart of our work is shown in Fig. 1, including data preparation, feature generation, machine learning model construction and new data set prediction. | ||
| Fig. 1 Machine learning flow chart. It can be divided into four parts: data preparation, feature generation, machine learning model construction and new data set prediction. Machine learning model construction used a stepwise method and can be divided into three parts: model selection, model training and model evaluation. The model is used to predict the phonon cutoff frequency (ω) and dielectric breakdown strength (Fb) of materials. | ||
a. Data preparation
Data sets are the most basic resource for driving machine learning models.31 In this study, we collected 209 ABX3 perovskite materials by referring to Kim's study20 as our initial training set. The 209 dynamically stable ABX3 perovskite materials were identified by DFT computations from 735 perovskite materials which were found to be insulating (based on the CMR reported32–34 GLLB-SC band gaps). In addition, we also collected the information of seven other materials35,36 outside the initial training set to verify the reliability of the model. Finally, 760 data sets of ABO3 perovskite oxides were collected from Materials Project and Open Quantum Materials Database (OQMD) with the help of the Python Materials Genomics library, which was aimed at screening novel perovskite materials with high dielectric breakdown strength after the machine learning model construction was finished.b. Feature generation
In previous reports, Kim et al.35 have found that dielectric breakdown strength is closely related to band gap and phonon cutoff frequency by collecting and analyzing 82 different materials. They further predicted the dielectric breakdown strength of ABX3 perovskite materials by using band gap and phonon cutoff frequency as main factors.20 However, the phonon cutoff frequency of perovskite materials must be calculated by DFT, unlike the band gap of materials which can be obtained from common materials databases such as Materials Project, AFLOWLIB and Open Quantum Materials Database. In order to reduce the amount of calculation, we decided to build a machine learning model to predict the phonon cutoff frequency of materials by using features that were easy to obtain from materials databases. We selected 9 features including the band gap (Eg), lattice parameters (a, b, c, α, β, γ), space group (Space_group) and anionic group (Anionic_group) as the initial input of the model and predicted the phonon cutoff frequency (ω) successfully. Then we add the prediction result into the feature set as an instrumental variable, and in this way we got 10 features of perovskite materials used in the machine learning model to predict the dielectric breakdown strength, as shown in Table 1.| Label | Feature |
|---|---|
| E g | Band gap |
| ω | Phonon cutoff frequency |
| a | Lattice parameters |
| b | |
| c | |
| α | |
| β | |
| γ | |
| Space_group | Space group |
| Anionic_group | Anionic group |
c. Machine learning model construction
In this part, we used a stepwise machine learning model to predict the dielectric breakdown strength of the materials. This method has two steps: the first step is predicting the phonon cutoff frequency (ω) and the next step is predicting the dielectric breakdown strength (Fb). Machine learning in this method can be divided into three parts: model selection, model training and model evaluation. In model selection, six different machine learning algorithms (SVM, Bagging, XGBoost, LightGBM, RF and AdaBoost) were selected for training, of which SVM, Bagging and RF algorithms are old machine learning algorithms, while XGBoost, LightGBM, and AdaBoost are improved algorithms, and the latter are more powerful and perform well in many algorithm competitions. Particularly, the XGBoost algorithm has been widely used due to its excellent accuracy and efficiency.In model training, we divided the data into a training set and a test set. The training set was used to train and fit the model and adjust the parameters of the model, the test set was used to evaluate the training effect of the model. In model evaluation, the determination coefficient (R2), root mean square error (RMSE) and mean absolute error (MAE), which are the common indexes in machine learning to evaluate the fitting effect of the model on the training set, were selected as the evaluation indexes. In order to reduce the random error, we have done parallel repeated trials with different random seeds during sampling and the final calculation results of the evaluation indexes are the average values of results in all trials. The optimal hyperparameters of all models were searched by using the same standard Bayesian optimization algorithm and ten-fold CV was used as the evaluation metric.37 In addition, we also used the average method to search for the “random_state” hyperparameter. The results of the average 10-fold CV eliminated the randomization and we used the “random_state” with the closest average effect as the final hyperparameter.38
After finishing the prediction of phonon cutoff frequency (ω), we added the prediction results into the feature set to build the preliminary model for predicting the dielectric breakdown strength of the materials. In order to improve the prediction accuracy and efficiency, we used the traversal method to screen out the best parameters of the model, including the appropriate features, the number of features and the proportion of the training set and test set. Then we used the optimized parameters to construct the final prediction model and predict the dielectric breakdown strength of the materials.
Results and discussion
a. Prediction and evaluation of the instrumental variable (ω)
In this part, we choose the phonon cutoff frequency (ω) as the instrumental variable and built instrumental variable prediction models by using 9 groups of initial feature sets as the model input to get the phonon cutoff frequency (ω). Six machine learning algorithms including SVM, Bagging, XGBoost, LightGBM, RF and AdaBoost were selected to build the instrumental variable prediction models. In order to evaluate the stability and robustness of the instrumental variable prediction models, we divided the data set into a training set (80%) and a test set (20%), then used R2, RMSE and MAE as the evaluation indexes of the models. The performance of the models consisting of different machine learning algorithms is shown in Table 2.| Model | R 2 | RMSE (THz) | MAE (THz) |
|---|---|---|---|
| SVM | 0.762 | 3.696 | 2.789 |
| Bagging | 0.783 | 3.531 | 2.603 |
| XGBoost | 0.854 | 2.889 | 2.095 |
| LightGBM | 0.768 | 3.649 | 2.852 |
| RF | 0.804 | 3.355 | 2.437 |
| AdaBoost | 0.805 | 3.341 | 2.473 |
From Table 2, we can see that the model consisting of the XGBoost machine learning algorithm has the best performance, R2 is 0.854, RMSE is 2.889, and MAE is 2.095. Therefore, we choose the XGBoost machine learning algorithm for building the instrumental variable prediction model to predict the phonon cutoff frequency (ω).
b. Construction and optimization of the dielectric breakdown strength prediction model
After successfully predicting the instrumental variable (ω) set, we added the data into the feature set and formed a new feature set including 10 features of perovskite materials as shown in Table 1. Then we constructed the prediction model of dielectric breakdown strength (Fb) based on the new feature set. We still used the same parameters of the model which were mentioned above. The performance of the model is shown in Table 3.| Model | R 2 | RMSE (MV m−1) | MAE (MV m−1) |
|---|---|---|---|
| SVM | 0.711 | 272.991 | 131.817 |
| Bagging | 0.857 | 380.425 | 170.592 |
| XGBoost | 0.872 | 184.411 | 67.486 |
| LightGBM | 0.792 | 280.436 | 170.530 |
| RF | 0.812 | 437.526 | 156.972 |
| AdaBoost | 0.861 | 376.133 | 190.015 |
From the results shown above, we can see that the model consisting of the XGBoost machine learning algorithm has the better performance (R2: 0.872, RMSE: 184.411, MAE: 67.486) than the other algorithms. Consequently, we selected the model consisting of the XGBoost machine learning algorithm as our final prediction model to predict dielectric breakdown strength (Fb) in this study.
In order to ensure the accuracy and efficiency of the model consisting of the XGBoost machine learning algorithm, it is necessary to optimize the parameters of the model. The model optimization contains two parts: the ratio of data in the test set and the number of features. In order to reduce the impact of random segmentation contingency of data set on model accuracy, we conducted the traversal operation on the segmentation percentage of the data set (the test set proportion ranged from 10% to 100%, and the step size was 10%) in terms of data set segmentation. Then we used the XGBoost algorithm to train 10 different generated data sets and chose R2 as the model score. The optimization process of the model parameters is shown in Fig. 2.
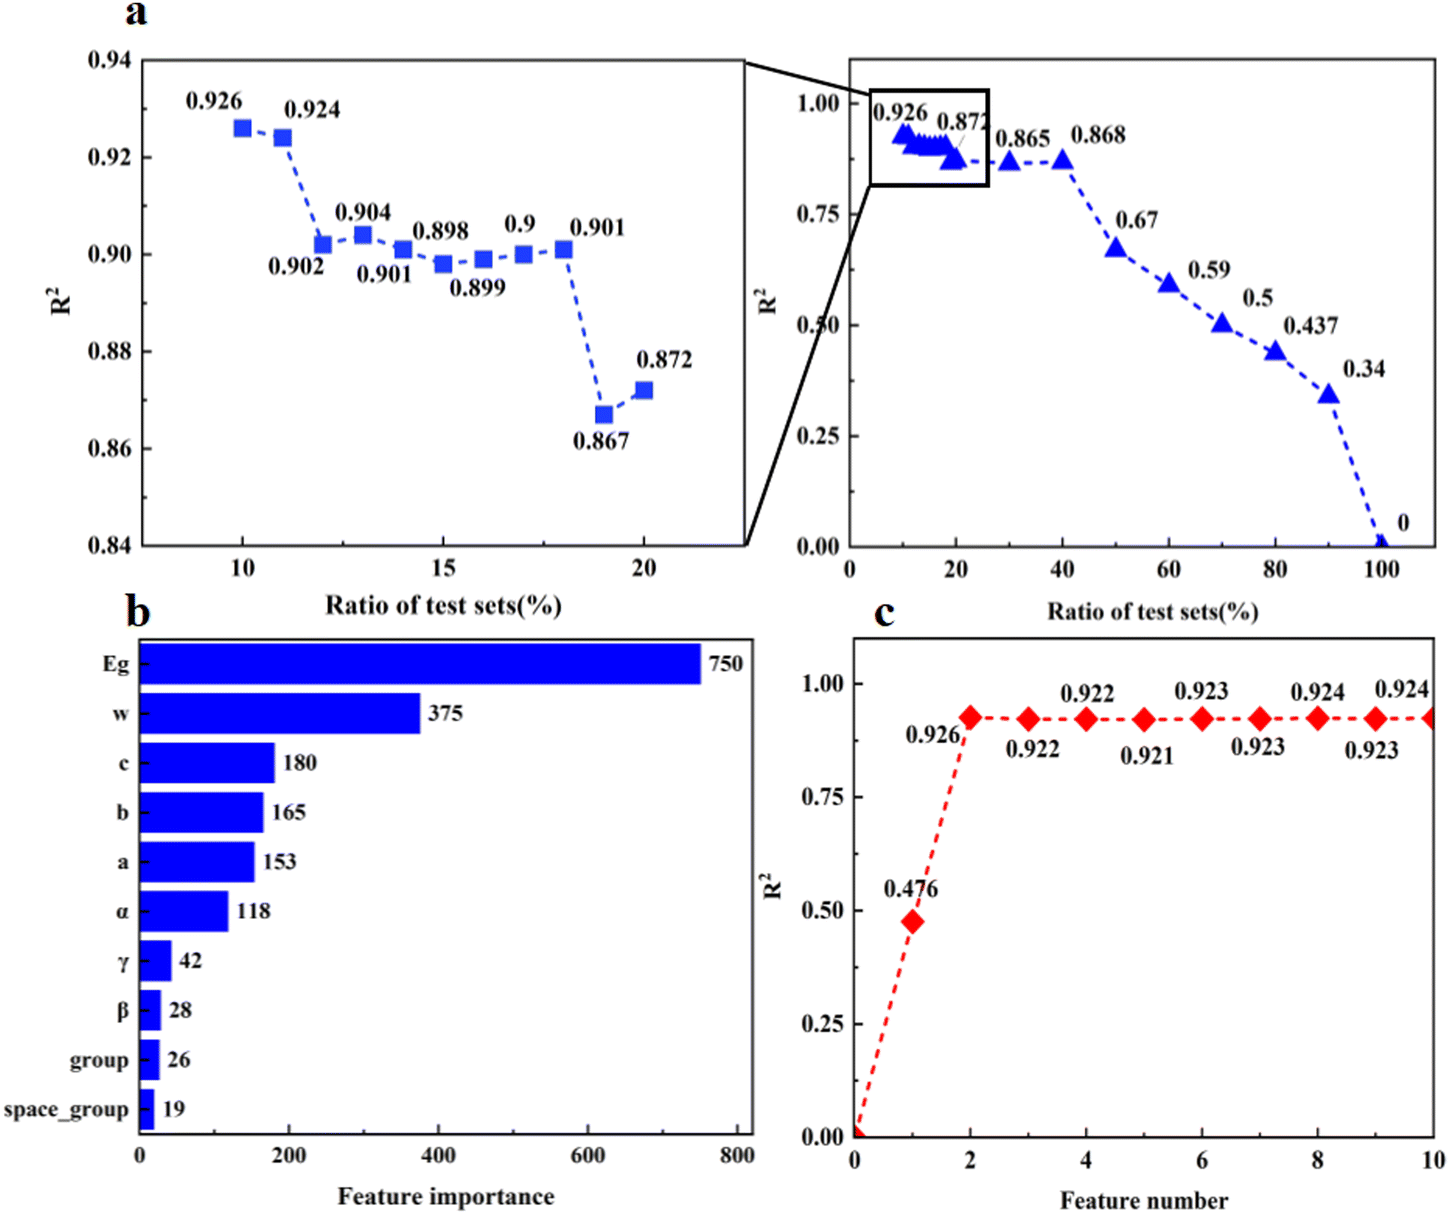 | ||
| Fig. 2 Optimization process of model parameters: (a) the R2 score of the model under different proportions of test sets; (b) the correlation scores of each feature to the model; and (c) the R2 score of the model under different numbers of features. | ||
As shown in Fig. 2(a), R2 scores decrease as the proportion of test sets increases. When the ratio of test sets is between 10% and 20%, the R2 of the model performed well. Then, we conducted traversal operations in the range of 10–20% with higher R2 scores (the proportion of the test set was from 10% to 20%, and the step size was 1%) and generated 10 different data sets for training, with R2 as the model score. This shows that the model score tended to be stable at 12–18% and reached the highest value at 10%. Due to our limited training data set, too few test sets increase the serendipity of model prediction results. Thus, we take 10% test set and 90% training set ratio as the best ratio for data segmentation and use this ratio for model training in the subsequent work.
Filtering the features is important for the prediction model. In the process of building a machine learning algorithm model, more feature sets are not always better. Too many or too few feature sets will affect the accuracy of the model, and the difficulty of feature set data collection is also related to the efficiency of the model. Therefore, we need to remove redundant features and reduce the number of features as much as possible while ensuring the accuracy of the model. We list the importance of each feature in Fig. 2(b). The feature importance is literally the correlation score of each feature which is related to model performance and we obtained these values using the plot_importance library of the XGBoost algorithm.
From Fig. 2(b) we can see that band gap (Eg) and phonon cutoff frequency (ω) are two features that are in more higher correlation with the dielectric breakdown strength (Fb) than the other features. After that, we still conducted the traversal operation to select the number of features used for building the model. The number of features ranges from 1 to 10, and the step size is 1. The XGBoost algorithm is used to generate 10 prediction models with different test sets, and R2 is used to evaluate the model.
Fig. 2(c) shows that the R2 of the model tends to be stable when the number of features is more than 2, while the R2 reached the highest value when the number of features is 2. This means that it is enough to predict the dielectric breakdown strength (Fb) with band gap (Eg) and phonon cutoff frequency (ω). This is consistent with the conclusion of Kim et al.20 and also proves that our model is reliable.
In conclusion, we selected the XGBoost machine learning algorithm to build the final prediction model for the dielectric breakdown strength (Fb). We selected band gap (Eg) and phonon cutoff frequency (ω) which we predicted before as the feature sets and dielectric breakdown strength (Fb) as the target set and put them into the dielectric breakdown strength (Fb) prediction model. The data sets for model training were randomly divided into the training set (90%) and test set (10%), and the results are shown in Fig. 3.
 | ||
| Fig. 3 Evaluation of the optimized XGBoost machine learning model. (a) The histogram of the comparison of various evaluation indexes between the initial model and the optimized model. (b) The fitting result of the prediction of the dielectric breakdown strength of materials using the optimized model. (c) The comparison between the predicted and real dielectric breakdown strength of seven materials outside of the initial data set. | ||
As can be seen from Fig. 3(a), after the optimization of the model, the evaluation indexes of the model have been significantly improved (R2: 0.872–0.926, RMSE: 184.411–58.061, MAE: 67.486–28.359). This means that the optimization of the model worked.
From Fig. 3(b) we can see that each point in the XGBoost machine learning model fitting test is distributed near the diagonal, indicating that the model has good accuracy in predicting the dielectric breakdown strength of materials.
In order to further verify the reliability and universality of the model, we also collected the dielectric breakdown strength of seven other materials (Ge, Si, C, LiF, Li2S, Na2S and ZrO2) which are calculated by DFT or measured by experiments, and input the feature parameters of materials into the model. Fig. 3(c) shows the prediction results of dielectric breakdown strength and we can see clearly that the dielectric breakdown strength of the seven materials predicted using the model is basically consistent with the actual experimental values, which further proves the reliability of our model.
c. Applying the model to a new data set to search for materials with high dielectric breakdown strength
After constructing the prediction model, we collected 760 perovskite oxide materials from Materials Project and OQMD and successfully predicted the dielectric breakdown strength of the materials through the XGBoost machine learning model. The prediction results of borate perovskite materials are provided in Table 4 and all the prediction results are provided in the ESI.†| Perovskite | Fb (MV m−1) | Perovskite | Fb (MV m−1) |
|---|---|---|---|
| LaBO3 | 2784.25 | AlBO3 | 2395.67 |
| LuBO3 | 1498.91 | HoBO3 | 1470.04 |
| SbBO3 | 1295.39 | BiBO3 | 1284.48 |
| ScBO3 | 1158.10 | GaBO3 | 1062.99 |
According to the predicted results, LaBO3 has the best dielectric breakdown strength of 2784.25 MV m−1, and AlBO3 is the second with 2395.67 MV m−1. In addition, we have found that LaBO3, AlBO3, LuBO3 and other borate perovskites all have high dielectric breakdown strength. Kim et al.20 pointed out that boron containing perovskites may be extremely tolerant towards high electric fields and predicted that BSiO2F and SrBO2F display high breakdown fields. However, BSiO2F and SrBO2F cannot be found out or produced by existing technology. But in our work every material is of practical significance. Previous reports have shown that borate perovskites have wide application prospects in the field of energy storage and are expected to become candidate materials for a new generation of energy storage devices. For instance, LaBO3 is one of the preferred alternatives to precious metal catalysts due to its good thermal stability, good oxygen storage and low cost.39–41 Its excellent energy storage properties make it one of the candidate materials with great potential for a new generation of electrochemical devices.42,43 AlBO3 can be used as a thin film coating for batteries to improve the electron transfer kinetics and increase the discharge capacity and electrode lifetime.44 LuBO3 and HoBO3 have good luminescence properties,45 and their potential in the field of electrochemical energy storage is yet to be explored. Besides, borate perovskite materials such as BiBO3, SbBO3 and ScBO3 have shown good energy storage properties in some literature reports.46–48
Conclusions
In this work, we predicted the phonon cutoff frequency of a material as an instrumental variable from features that can be commonly and easily found in materials databases, and it is used as a part of the feature set to further predict the dielectric breakdown strength of materials. We have verified that the model built with the XGBoost machine learning algorithm displays excellent performance. Then we have screened borate perovskite materials high dielectric breakdown strength such as LaBO3, AlBO3 and LuBO3. Our work can pave the way for the application of borate perovskite materials in dielectric capacitors.Conflicts of interest
There are no conflicts to declare.Acknowledgements
This work was supported by the National Natural Science Foundation of China (61705049 and 11964020).References
- Z. H. Shen, H. X. Liu and Y. Shen, et al., Machine learning in energy storage materials, Interdisciplinary Mater., 2022, 1(2), 175–195 CrossRef.
- L. Yang, X. Kong and F. Li, et al., Perovskite lead-free dielectrics for energy storage applications, Prog. Mater. Sci., 2019, 102, 72–108 CrossRef CAS.
- J. A. Kittl, K. Opsomer, M. Popovici, N. Menou, B. Kaczer, X. P. Wang, C. Adel-Mann, M. A. Pawlak, K. Tomida and A. Rothschild, et al., High-k Dielectrics for Future Generation Memory Devices, Microelectron. Eng., 2009, 86, 1789–1795 CrossRef CAS.
- K. Müller, I. Paloumpa, K. Henkel and D. Schmeisser, A Polymer High-k Dielectric Insulator for Organic Field-effect Transistors, J. Appl. Phys., 2005, 98, 5–8 Search PubMed.
- V. Sharma, C. Wang, R. G. Lorenzini, R. Ma, Q. Zhu, D. W. Sinkovits, G. Pilania, A. R. Oganov, S. Kumar, G. A. Sotzing, S. A. Boggs and R. Ramprasad, Rational Design of all Organic Polymer Dielectrics, Nat. Commun., 2014, 5, 4845 CrossRef CAS PubMed.
- W. S. Yang, J. H. Noh, N. J. Jeon, Y. C. Kim, S. Ryu, J. Seo and S. I. Seok, High-performance Photovoltaic Perovskite Layers Fabricated through Intramolecular Exchange, Science, 2015, 348, 1234–1237 CrossRef CAS PubMed.
- R. Ma, V. Sharma, A. F. Baldwin, M. Tefferi, I. Offenbach, M. Cakmak, Y. Cao, R. Ramprasad and G. A. Sotzing, Rational Design and Synthesis of Polythioureas as Capacitor Dielectrics, J. Mater. Chem. A, 2015, 1–8 Search PubMed.
- A. F. Baldwin, T. D. Huan, R. Ma, A. Mannodi-Kanakkithodi, M. Tefferi, N. Katz, Y. Cao, R. Ramprasad and G. A. Sotzing, Rational Design of Organotin Polyesters, Macromolecules, 2015, 48, 2422–2428 CrossRef CAS.
- I. Grinberg, D. V. West, M. Torres, G. Gou, D. M. Stein, L. Wu, G. Chen, E. M. Gallo, A. R. Akbashev, P. K. Davies, K. E. Spanier and A. M. Rappe, Perovskite Oxides for Visible-light-absorbing Ferroelectric and Photovoltaic Materials. Perovskite Oxides for Visible-light-absorbing Ferroelectric and Photovoltaic Materials, Nature, 2013, 503, 509–512 CrossRef CAS PubMed.
- G. Pilania, C. C. Wang, K. Wu, N. Sukumar, C. Breneman, G. Sotzing and R. Ramprasad, New Group IV Chemical Motifs for Improved Dielectric Permittivity of Polyethylene, J. Chem. Inf. Model., 2013, 53, 879–886 CrossRef CAS PubMed.
- K. Chen, W. Jin and Y. Zhang, et al., High efficiency mesoscopic solar cells using CsPbI3 perovskite quantum dots enabled by chemical interface engineering, J. Am. Chem. Soc., 2020, 142(8), 3775–3783 CrossRef CAS PubMed.
- Q. Ou, Y. Zhang and Z. Wang, et al., Strong depletion in hybrid perovskite p–n junctions induced by local electronic doping, Adv. Mater., 2018, 30(15), 1705792 CrossRef PubMed.
- X. Qi, Y. Zhang and Q. Ou, et al., Photonics and optoelectronics of 2D metal–halide perovskites, Small, 2018, 14(31), 1800682 CrossRef PubMed.
- Y. Xu, X. F. Jiang and Y. Ge, et al., Size-dependent nonlinear optical properties of black phosphorus nanosheets and their applications in ultrafast photonics, J. Mater. Chem. C, 2017, 5(12), 3007–3013 RSC.
- Z. Huang, W. Han and H. Tang, et al., Photoelectrochemical-type sunlight photodetector based on MoS2/graphene heterostructure, 2D Mater., 2015, 2(3), 035011 CrossRef.
- Q. Tao, P. Xu and M. Li, et al., Machine learning for perovskite materials design and discovery, npj Comput. Mater., 2021, 7(1), 1–18 CrossRef.
- J. Oró-Solé, et al., Synthesis, anion order and magnetic properties of RVO3−xNx perovskites (R = La, Pr, Nd; 0 ≤ x ≤ 1), J. Mater. Chem. C, 2014, 2, 2212–2220 RSC.
- J. Shiogai, et al., Signature of band inversion in the perovskite thin-film alloys BaSn1−xPbxO3, Phys. Rev. B, 2020, 101, 125125 CrossRef CAS.
- L. Zhu, R. Ran and M. Tade, et al., Perovskite materials in energy storage and conversion, Asia-Pac. J. Chem. Eng., 2016, 11(3), 338–369 CrossRef CAS.
- C. Kim, G. Pilania and R. Ramprasad, Machine learning assisted predictions of intrinsic dielectric breakdown strength of ABX3 perovskites. The, J. Phys. Chem. C, 2016, 120(27), 14575–14580 CrossRef CAS.
- E. Ekström, et al., The effects of microstructure, Nb content and secondary Ruddlesden-Popper phase on thermoelectric properties in perovskite CaMn1−xNbxO3 (x = 0–0.10) thin films, RSC Adv., 2020, 10, 7918–7926 RSC.
- V. Sydorchuk, et al., PrCo1−xFexO3 perovskite powders for possible photocatalytic applications, Res. Chem. Int., 2020, 46, 1909–1930 CrossRef CAS.
- P. Kopčanský, L. Tomčo and K. Marton, et al., The experimental study of the DC dielectric breakdown strength in magnetic fluids, J. Magn. Magn. Mater., 2004, 272, 2377–2378 CrossRef.
- A. Von Hippel, Electric Breakdown of Solid and Liquid Insulators, J. Appl. Phys., 1937, 8, 815–832 CrossRef.
- H. Fröhlich, Theory of Electrical Breakdown in Ionic Crystals, Proc. R. Soc. A, 1937, 160, 230–241 Search PubMed.
- C. Zhang, Y. Chen and M. Zhou, et al., Achieving ultrahigh dielectric breakdown strength in MgO-based ceramics by composite structure design, J. Mater. Chem. C, 2019, 7(26), 8120–8130 RSC.
- C. Li, H. Hao and B. Xu, et al., A progressive learning method for predicting the band gap of ABO3 perovskites using an instrumental variable, J. Mater. Chem. C, 2020, 8(9), 3127–3136 RSC.
- R. J. Wei Li and D. Morgan, Comput. Mater. Sci., 2018, 150, 454–463 CrossRef.
- J. Zhao and X. Wang, Screening Perovskites from ABO3 Combinations Generated by Constraint Satisfaction Techniques Using Machine Learning, ACS Omega, 2022, 7(12), 10483–10491 CrossRef CAS PubMed.
- H. Liu, J. Feng and L. Dong, Quick screening stable double perovskite oxides for photovoltaic applications by machine learning, Ceram. Int., 2022, 48(13), 18074–18082 CrossRef CAS.
- L. Himanen, A. Geurts, A. S. Foster and P. Rinke, Data-driven materials science: Status, challenges, and perspectives, Adv. Sci., 2019, 6, 1900808 CrossRef PubMed.
- I. E. Castelli, D. D. Landis and K. S. Thygesen, et al., New cubic perovskites for one-and two-photon water splitting using the computational materials repository, Energy Environ. Sci., 2012, 5(10), 9034–9043 RSC.
- I. E. Castelli, T. Olsen and S. Datta, et al., Computational screening of perovskite metal oxides for optimal solar light capture, Energy Environ. Sci., 2012, 5(2), 5814–5819 RSC.
- I. E. Castelli, K. S. Thygesen and K. W. Jacobsen, Calculated Pourbaix diagrams of cubic perovskites for water splitting: stability against corrosion, Top. Catal., 2014, 57(1), 265–272 CrossRef CAS.
- C. Kim, G. Pilania and R. Ramprasad, From organized high-throughput data to phenomenological theory using machine learning: the example of dielectric breakdown, Chem. Mater., 2016, 28(5), 1304–1311 CrossRef CAS.
- Y. Sun, S. A. Boggs and R. Ramprasad, The intrinsic electrical breakdown strength of insulators from first principles, Appl. Phys. Lett., 2012, 101(13), 132906 CrossRef.
- S. Putatunda and K. Rama, A comparative analysis of hyperopt as against other approaches for hyper-parameter optimization of XGBoost[C]//Proceedings of the 2018 International Conference on Signal Processing and Machine Learning, 2018, pp. 6–10.
- R. Zhao, B. Xing and H. Mu, et al., Evaluation of performance of machine learning methods in mining structure–property data of halide perovskite materials, Chin. Phys. B, 2022, 31(5), 056302 CrossRef.
- Y. J. Zhao, Y. Hang, Y. D. Zhang, Z. D. Wang, Y. J. Yao, X. J. He, C. F. Zhang and D. W. Zhang, Strontium-doped perovskite oxide La1−xSrxMnO3 (x = 0, 0.2, 0.6) as a highly efficient electrocatalyst for nonaqueous Li–O2 batteries, Electrochim. Acta, 2017, 232, 296–302 CrossRef CAS.
- S. M. Ali and Y. M. A. Al-Rahman, Catalytic activity of LaBO3 for OER in HClO4 medium: an approach to the molecular orbital theory, J. Electrochem. Soc., 2016, 163(2), H81–H88 CrossRef CAS.
- H. Zhu, P. Zhang and S. Dai, Recent advances of lanthanum-based perovskite oxides for catalysis, ACS Catal., 2015, 5(11), 6370–6385 CrossRef CAS.
- A. A. Kolchugin, E. Y. Pikalova and N. M. Bogdanovich, et al., Structural, electrical and electrochemical properties of calcium-doped lanthanum nickelate, Solid State Ionics, 2016, 288, 48–53 CrossRef CAS.
- D. S. Khaerudini, G. Guan and P. Zhang, et al., (Bi0.15La0.27Sr0.53)(Co0.25Fe0.75)O3−δ perovskite: a novel cathode material for intermediate temperature solid oxide fuel cells, J. Power Sources, 2016, 334, 137–145 CrossRef CAS.
- T. N. Khamaganova, Structural specific features and properties of alkaline-earth and rare-earth metal borates, Russ. Chem. Bull., 2017, 66(2), 187–200 CrossRef CAS.
- C. S. Seu, V. K. Davis and J. Pasalic, et al., Aluminum borate coating on high-voltage cathodes for Li-ion batteries, J. Electrochem. Soc., 2015, 162(12), A2259 CrossRef CAS.
- N. A. Noor, M. Hassan and M. Rashid, et al., Systematic study of elastic, electronic, optical and thermoelectric properties of cubic BiBO3 and BiAlO3 compounds at different pressure by using ab-initio calculations, Mater. Res. Bull., 2018, 97, 436–443 CrossRef CAS.
- A. A. Belik and W. Yi, High-pressure synthesis, crystal chemistry and physics of perovskites with small cations at the A site, J. Phys.: Condens. Matter, 2014, 26(16), 163201 CrossRef PubMed.
- D. Lu, Z. Pan and H. Yu, et al., Exploration of Yb3+: ScBO 3-a novel laser crystal in the rare-earth ion doped orthoborate system, Opt. Mater. Express, 2015, 5(8), 1822–1833 CrossRef CAS.
Footnote |
| † Electronic supplementary information (ESI) available. See DOI: https://doi.org/10.1039/d2ma00839d |
| This journal is © The Royal Society of Chemistry 2022 |