
 Open Access Article
 This Open Access Article is licensed under a
 Creative Commons Attribution 3.0 Unported Licence
Green synthesis of carbon dots using expired agar for a label-free fluorescence signal-amplified detection of ferric ion utilizing oxalate functionalization†
Ojodomo J.
Achadu
 *ab,
Gideon L.
Elizur
c,
ThankGod E.
Boye
d and
Enoch Y.
Park
ef
*ab,
Gideon L.
Elizur
c,
ThankGod E.
Boye
d and
Enoch Y.
Park
ef
aDepartment of Chemistry, University of Warwick, CV4 7AL, UK. E-mail: Ojodomo.Achadu@warwick.ac.uk; Tel: +44(0)2476575625
bInstitute of Advanced Study, University of Warwick, CV4 7AL, UK
cInternational Study Centre, University of Strathclyde, Glasgow, G1 1XQ, UK
dEngineering and Physical Sciences, University of Southampton, SO17 1BJ, UK
eResearch Institute of Green Science and Technology, Shizuoka University, 836 Ohya, Suruga-ku, Shizuoka 422-8529, Japan
fLaboratory of Biotechnology, Department of Bioscience, Graduate School of Science and Technology, Shizuoka University, 836 Ohya Suruga-ku, Shizuoka 422-8529, Japan
First published on 29th June 2022
Abstract
Surface passivation strategies for functional carbon-based nanoparticles can provide unrivalled performance whilst fine-tuning their optical properties in addition to giving routes for large-scale syntheses. Herein, the synthesis of highly fluorescent agar-derived and oxalate-functionalized carbon dots (ag-oxCDs) is presented. We deployed a facile hydrothermal protocol, using expired potato dextrose agar and oxalate as “green” precursors to prepare fluorescent ag-oxCDs with a relative fluorescence (FL) quantum yield of ∼32% (emission/excitation wavelengths: 445/340 nm). The switchable fluorescence properties of the prepared ag-oxCDs was used for developing a sensitive nanosensor for ferric ion [Fe(III)] detection. Through Fe(III) coordination to the oxalate passivated surface of ag-oxCDs, the FL of ag-oxCDs was enhanced by an aggregation-induced emission enhancement mechanism. The tested and optimized concentration of Fe(III) was within a broad linear range of 0.5–1500 μM, with a detection limit of 75 nM (s/N = 3). The practical application of the ag-oxCDs-based FL nanosensor for real-time quantitative monitoring of Fe(III) was demonstrated by detecting up to 0.15 μM of Fe(III) in spiked human serum and water samples.
1. Introduction
Carbon dots (CDs) are nanoscale optical materials with zero-dimensional quasi-spherical particles with average diameters usually less than 10 nm,1,2 and have attracted many scientific and research interests in the last decade. The burgeoning interests in deploying CDs and their derivatives in chemical sensing, bioimaging, and drug delivery, to mention but a few, is mainly due to their excellent and uniquely tunable fluorescence (FL) supplemented by high aqueous solubility, low cytotoxicity, and, most interestingly, can be derived from a vast abundance of cheap and “green” natural sources.3,4 CDs have been reportedly prepared via pyrolytic and hydrothermal treatments of small organic molecules and compounds such as citric acid,5 glucose,6 and natural products7 as the source precursors. However, using some of the above-mentioned precursors for CD syntheses is complicated and expensive, with low yields, making them unsuitable for large-scale production and further limiting their applications. On the other hand, the drive to up-scale the yield of CDs has further led to exploring new precursors for their synthesis using biomass and naturally occurring raw materials as carbon sources that can give very high yields or good conversion percentages. Using (bio)materials that would otherwise be considered wastes could prove to be effective since these materials can be processed into fluorescent CDs and their derivatives in large quantities. Furthermore, this may fulfil the beneficial purposes of waste conversion, a low-cost and environmentally friendly process. From this perspective, fluorescent carbon-based nanosized dots have been derived from the hydrothermal treatments of Otaheite gooseberry (Phyllanthus acidus); dwarf banana peel; Kentucky bluegrass (Poa pratensis);8–10 bee pollens;11 food wastes;12 harmful cyanobacteria;13 silkworm excrements;14 waste toners15 and sugar-cane bagasse pulp.16 The variously derived fluorescent CDs reported in the literature have been applied in metal ions sensing, intracellular bioimaging, and drug delivery,17–19 achieving excellent results and unprecedented applications. We also have, in this work, used expired potato dextrose agar (PDA) and oxalate as novel precursors to extend the portfolio of precursors capable of large-scale preparation of surface-functionalized CDs. PDA is a culture medium for fungi and yeast, made up of dehydrated potato infusion, dextrose, agar, and trace quantities of micronutrients.20 High-quality media are considered essential to effective cell cultures; thus, expired culture media might not be reliable for related microbial assays, and their use is generally discouraged.21 Due to short shelf-life, tons of culture media expire before use and are often discarded.22 Thus, it is imperative that expired culture media products find other important use as precursors for synthesizing nanomaterials such as CDs or close derivatives. This could reduce the wastage of resources and bring about the large-scale production of carbon-based nanoparticles. Based on this idea, we prepared agar-derived oxalate functionalized CDs (henceforth denoted as ag-oxCDs) using expired PDA and sodium oxalate. This is the first time a facile, low-temperature hydrothermal route obtaining highly fluorescent oxalate passivated ag-oxCDs with excellent water solubility and biocompatibility. Herein, the synthesis method have the following distinguishing characteristics: a simple and direct synthetic route using environmentally friendly “green” sources with large-scale potential; one-pot functionalization in a one-step procedure without post-synthesis treatment; a low-temperature hydrothermal treatment at 160 °C (higher temperatures of 180–240 °C are often reported8–10); and a comparatively higher FL quantum yield (QY), suitable for practical applications. Furthermore, the prepared ag-oxCDs were adequately characterized and deployed as an FL nanosensor for metal ion detection.The quest for real-time and continuous tracking of metal ions at low concentrations has increased tremendously to safeguard human health and the environment. In particular, the real-time and low-level (sensitive) detection of iron (Fe) metal ions with minimal effort is highly imperative.23 This is significant because, while Fe ions are required for human metabolic functions, either low or excessive amounts can be harmful, which can occur as a result of either low-level or excessive intake.24 In this work, the optical properties and performance of fluorescent CDs were improved by functionalization with oxalate moieties with a specific chelating affinity for Fe(III) used as a test metal ion. The oxalate moiety enables the selective interaction of the prepared ag-oxCDs with Fe(III) in the presence of other metal ions.25 Taking advantage of this interaction affinity and the ability of Fe(III) to stimulate the FL enhancement of the prepared ag-oxCDs via an aggregation-induced emission enhancement (AIEE) mechanism, a novel label-free nanosensor for Fe(III) was developed. The ag-oxCDs nanosensor exhibits a stronger FL in the presence of quantitative amounts of Fe(III) with a limit of detection (LOD) of 0.15 μM. The designed nanosensing system was then successfully deployed for actual samples (human serum and pond water) to quantify Fe(III). It is envisaged that ag-oxCDs can be deployed to fabricate nanosensing platforms for other biological and environmental systems.
2. Experimental
2.1. Materials and chemicals
Iron(III) chloride (FeCl3), L-cysteine (L-Cys), sodium oxalate, and dialysis membrane tubing (MWCO 1.5 kDa) were obtained from Sigma-Aldrich (St Louis, USA). PDA (expired in 2014) was initially supplied by Merck (Darmstadt, Germany). Human AB Serum was obtained from ZenBio, Inc, UK. All other reagents were purchased from Thermo Fischer Scientific, UK, and used without further treatment. Ultrapure doubly distilled-deionized (DI) water (>18 MΩ cm) was used in all experiments and solutions preparations.2.2. Characterization
X-Ray photoelectron spectroscopy (XPS) was conducted on the ESCA1600 system (ULVAC-PHI Inc., Tokyo, Japan) using an Al K-alpha X-ray source and a hemispheric electron analyzer. Transmission electron microscope (TEM) micrographs were obtained using an HT7800 RuliTEM (Hitachi High-Tech Europe GmbH) with an accelerating electrical potential of 120 kV. Atomic force microscopy (AFM) was performed on Bruker's Innova® in tapping mode. Fluorescence spectra (excitation and emission) were recorded on a PerkinElmer LS 55 luminescence spectrometer with a Xenon lamp. Ground state electronic absorption was performed on a PerkinElmer Lambda 1050 UV/VIS/NIR spectrometer with a 3D WB detector module. Fourier transform infrared spectroscopy was performed on FT/IR-6300 with ATR PRO610P-S (JASCO). The X-ray diffraction pattern was obtained using a RINT ULTIMA XRD (Rigaku Co., Tokyo, Japan) with a Ni filter and a Cu-Kα source. Dynamic light scattering (DLS) and zeta potential measurements were conducted on Malvern Zetasizer nanoseries, Nano-ZS90 (Malvern Inst. Ltd, Malvern, UK). Raman analysis was done using an NRS-7100 microscopic laser Raman spectrophotometer (JASCO, Tokyo, Japan) using a 532 nm laser source. Elemental analysis was performed using Agilent 5800 ICP-OES (USA).2.3. Synthesis of ag-oxCDs
The ag-oxCDs were synthesized via a facile optimized hydrothermal route similar to our previously reported protocol with modifications.26–29 In brief, 0.5 g of expired PDA powder was dissolved in 20 mL of ultra-pure DI water and vigorously stirred in a beaker for 1 h, then 0.1 g (0.7 mmol) of sodium oxalate was added with continuous stirring for another 30 min. The pH of the resulting viscous solution was adjusted to ∼8.0 using 0.1 M NaOH and then transferred to a Teflon-lined stainless-steel autoclave and heated for 6 h at 160 °C. After cooling to room temperature, the obtained product was washed with a mixture of ethanol and DI water (3![[thin space (1/6-em)]](https://www.rsc.org/images/entities/char_2009.gif) :1), then purified by dialysis (using a membrane of MWCO 1.5 kDa) for 2 days. The solution was subsequently freeze-dried for further use. Th washing and dialysis steps were used for purification of the CDs from residual oligomeric and polymeric fractions, as well as the removal of excess/unreacted sodium oxalate salt from the ag-oxCDs solution.
:1), then purified by dialysis (using a membrane of MWCO 1.5 kDa) for 2 days. The solution was subsequently freeze-dried for further use. Th washing and dialysis steps were used for purification of the CDs from residual oligomeric and polymeric fractions, as well as the removal of excess/unreacted sodium oxalate salt from the ag-oxCDs solution.
2.4. Detection of Fe(III) and real samples analysis
In a typical sensing procedure, 2000 μL (1 mg mL−1, PBS pH 7.2) of ag-oxCDs were sequentially mixed with different concentrations of Fe(III) (0.5 to 1500 μM) in microtubes at room temperature. After 5 min of equilibration time, the fluorescence and absorption spectra of the strongly fluorescing ag-oxCDs-Fe(III) nanocomplexes were recorded, respectively, at an excitation wavelength of 340 nm. Blanks were recorded for each fluorescence measurement, and appropriate instrumental corrections were done for all recordings. Similar procedures were followed for selectivity studies (using dilute aqueous solutions, 5000 μM of metal ions of Na, Ca, K, Cu, Zn, Cr, Ni, Pb, Cd, Co, Mg, and L-Cys) and for human serum or real samples analyses.2.5. FL quantum yield (ΦF) (QY) measurement
Φ F of ag-oxCDs was determined by the comparative method,30 using the following eqn (1):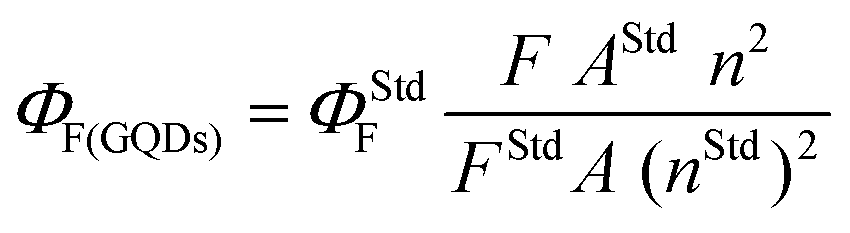 | (1) |
3. Results and discussion
3.1. Synthesis and structural characterization of ag-oxCDs
The synthesis process of ag-oxCDs (illustrated in Scheme 1) is typically reminiscent of the bottom-up approach for preparing various carbon-based quantum dots and/or nanodots, involving the condensation of single small molecular precursors such as citric acid, ascorbic acid, etc., or nitrogen-rich sources such as urea and thiourea.5,32–34 The experimental protocol established herein demands the controlled heating of the alkaline slurry of the PDA-molecular oxalate mixture by hydrothermal activation. The rich carbon compounds of the PDA and oxalate are reduced, co-condensed, and/or carbonized, before gradually forming emissive carbon cores of fluorescent nanosized ag-oxCDs. This mechanistic formation pathway is similar to other documented carbon-based nanosized dots formation mechanisms.35–39 Purified ag-oxCDs exhibit bright blue FL and aqueous media stability, possibly due to the presence of oxygen-functional (–OH) groups inherited from the precursors.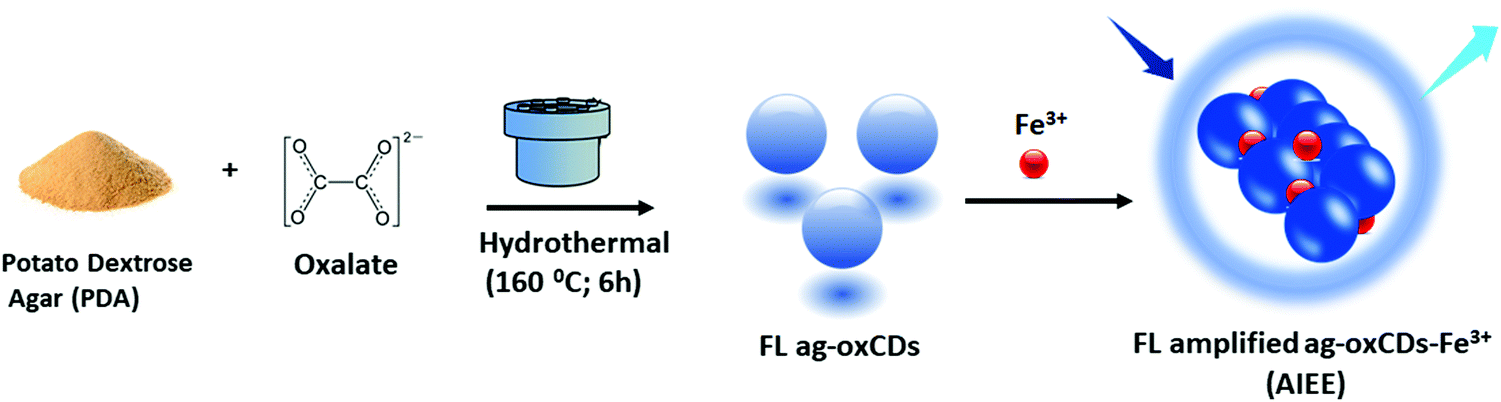 | ||
| Scheme 1 Graphical illustration of the preparation of ag-oxCDs and detection of Fe(III). | ||
The formation of the nanosized dots and the origin of their fluorescence requires a rational discussion. Nonetheless, despite the inherent advantages and benefits of the bottom-up hydrothermal approach for synthesizing carbon-based nanoparticles, there is still considerable debate about their FL origin and nanoscale compositions.40 It is, however, a general understanding that carbon-based nanosized dots can be prepared using a vast array of precursors by employing various carbonization pathways and conditions. The degree of carbonization, which is usually undefined, is a key element. From another perspective, the FL properties of carbon-based nanoparticles are primarily the result of emissive carbogenic and/or graphitic domains within the nanoparticles during the carbonization phase.41–43 Notably, excitation wavelength-dependent emissions are considered to demonstrate this type of FL in carbon-based nanoparticles.44–46 For our ag-oxCDs, the FL origin can be speculated to be due to the formation of carbogenic cores from the PDA's oligomeric derivatives and oxalate molecular conversion during the hydrothermal phase. However, it is necessary to emphasize that careful and precise control of experimental conditions is needed to ensure reproducibility of the form and characteristic features of the derived ag-oxCDs. High-temperature conditions (≥180 °C), in particular, were found to give rise to erratic carbonization processes generating a high population of larger-sized nanoparticles with multiple carbogenic domains. This resulted in fluorescent nanoparticles with non-uniform emissive sites/spectra. Details of the optimization process of ag-oxCDs synthesized at different hydrothermal conditions are further presented and discussed in S1, shown in Fig. S1 and Table S1 in the ESI.† In this scenario, we speculate that the derived fluorescent products may be a blend ag-oxCDs and, according to literature conventions, fractions of graphitic or carbon-based quantum dots. Thus, a mixture of carbon-based nanoparticles of various sizes is produced at extremely high temperatures. From a more in-depth perspective, while the fluorescent nanoparticles prepared herein are denoted as CDs following literature accord, they may, in reality, encompass a wide variety of nanoparticles due to the complexity of the principal precursor (PDA). The precursor PDA is a mixture of potato infusion, dextrose, and agar (agar is composed of polysaccharides, agarose, and agaropectin).20 Therefore, taking this into account, we seek to avoid any ambiguous denotations, given the uncertainties with the ingredients of the precursor when expired, especially with regard to the constituents or exact composition of the derived fluorescent nanoparticles and/or the origin of their FL properties. With this in mind, we have used integrated state-of-the-art techniques from material science to spectroscopy to characterize the prepared ag-oxCDs in great depth. XPS was used to probe the chemical composition and surface states of the prepared ag-oxCDs (Fig. 1a–c). The XPS survey spectrum shows distinct atomic peaks of C1s, Na auger, and O1s at 285.2, 496.2, and 530.6 eV, respectively (Fig. 1a). Na comes from NaOH treatment for a basic pH essential for obtaining fluorescent ag-oxCDs. The ratios of the principal atoms of C and O of the ag-oxCDs are 74.8 and 25%, respectively. This result implies that the ag-oxCDs are carbon-abundant and oxygen-charged nanosized dots identical to other CDs prepared using other source precursors.2,9,10,40,47 Furthermore, the high-resolution C1s signal was deconvoluted into three distinct atomic binding states centered at 284.8, 285.9, 286.9, and 287.8 eV (Fig. 1b), which correspond to sp2 C (C![[double bond, length as m-dash]](https://www.rsc.org/images/entities/char_e001.gif) C), sp3 C (C–C, C–O) and oxidized C (CO) species, respectively. The high-resolution O1s spectra confirmed the presence of copious amounts of oxygen groups in the prepared ag-oxCDs (Fig. 1c), originating from the precursors (PDA and oxalate), as well as the domination of inter-atomic bonds between C and O in the prepared ag-oxCDs.
C), sp3 C (C–C, C–O) and oxidized C (CO) species, respectively. The high-resolution O1s spectra confirmed the presence of copious amounts of oxygen groups in the prepared ag-oxCDs (Fig. 1c), originating from the precursors (PDA and oxalate), as well as the domination of inter-atomic bonds between C and O in the prepared ag-oxCDs.
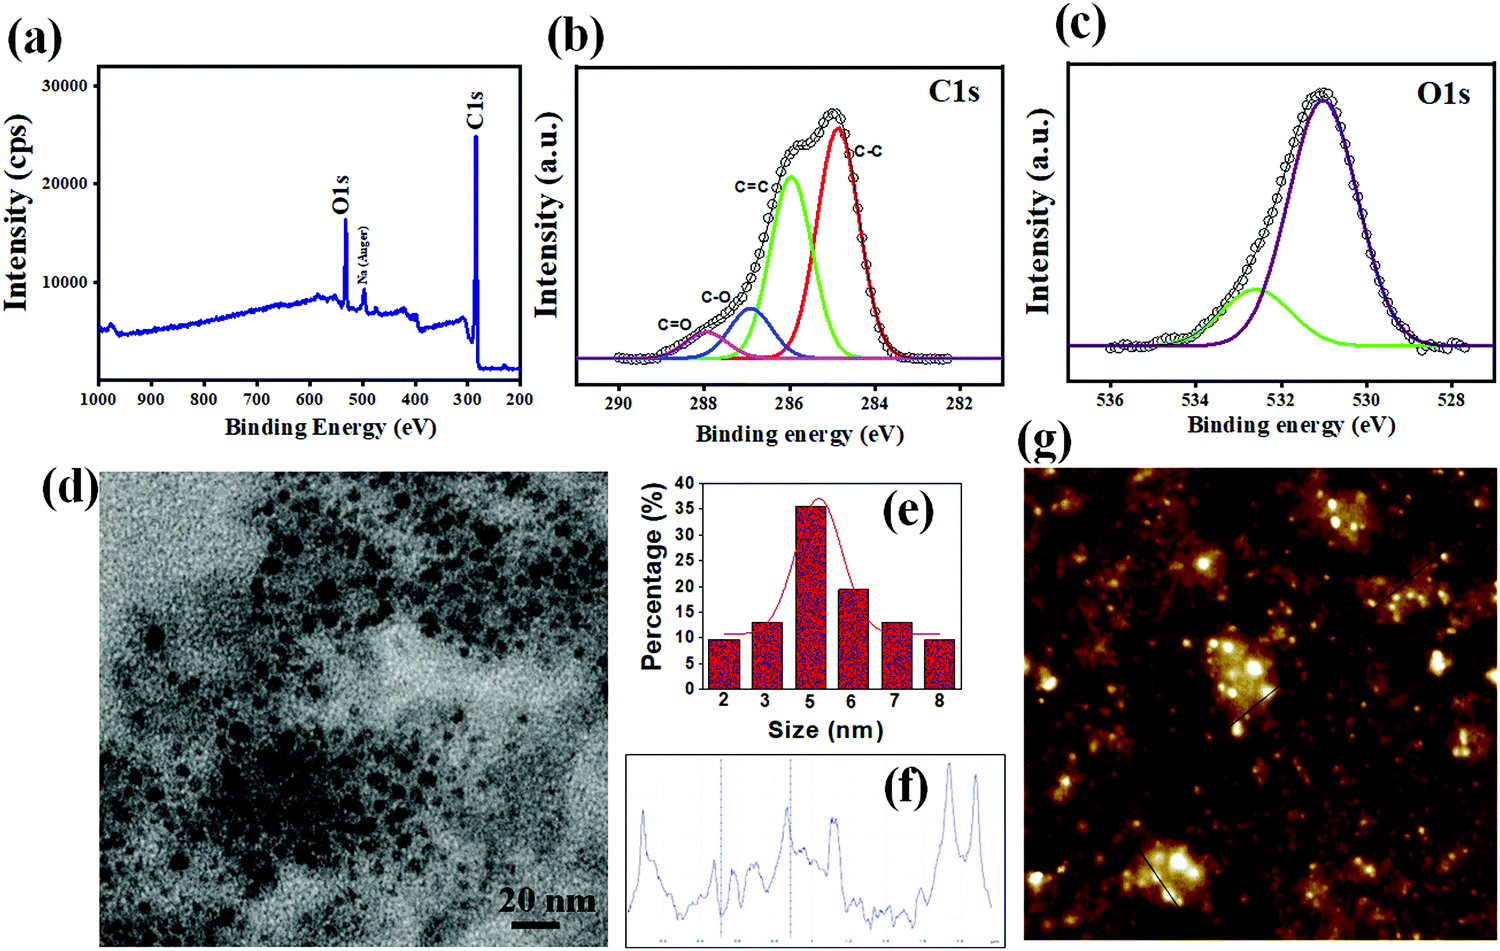 | ||
| Fig. 1 XPS analysis of the prepared ag-oxCDs (a) Survey scan. (b) Deconvoluted C1s peak. (c) Deconvoluted O1s peak. (d) TEM image. (e) TEM size distribution histogram. (f) AFM Height profile, and (g) micrograph of ag-oxCDs. | ||
The TEM image of ag-oxCDs shows monodispersed and quasi-spherical nanosized dots-like particles (Fig. 1d). A size variation of 2 – 10 nm, with an average of ∼5.5 ± 0.1 nm, was evaluated (Fig. 1e). The follow-up HRTEM of the ag-oxCDs (Fig. S2, ESI†) showed no clearly discernible lattice fringes characteristic of graphitic carbon-based nanoparticles. Thus, the prepared ag-oxCDs may be poorly crystalline and/or possess sparse graphitic domains as further confirmed by XRD result. AFM analysis provides more insight into the morphological features of the fluorescent ag-oxCDs. Fig. 1g shows the micrograph of the prepared nanosized dots with an average height of ∼1.8 nm, according to the height profile in Fig. 1f. This is typically within the range reported for other carbon dots.35–39 The Raman spectrum of ag-oxCDs displayed two distinct absorptions popularly referred to as the D-band (∼1347 cm−1) and G-band (∼1575 cm−1) (Fig. 2a), likely corresponding to the random sp2 and sp3 bonds of amorphous or disordered carbon networks.48 The XRD pattern revealed a peak at 2θ = ∼25°, possessing an interlayer spacing (d) of 0.36 nm (Fig. 2b). This means that ag-oxCDs are predominantly composed of amorphous carbons. Since the interlayer spacing of the ag-oxCDs appears to be higher than those typically found in graphitic materials (d = 0.33 nm),1,38,49 it indicates that the prepared ag-oxCDs possess poor crystalline nanostructures. Similar to XPS results, the inclusion of surface-rich oxygen groups was further confirmed by FTIR spectroscopy. As shown in Fig. 2c, the FTIR spectrum of ag-oxCDs displays distinctive absorption bands corresponding to various C and O functional groups of C–O, CC, and O–H, respectively. With this, there is proof that oxalate's rich oxygen functional groups, in addition to those of the PDA, are abundantly anchored on the surface of the prepared ag-oxCDs to afford the observed excellent water-solubility. In addition, the stored aqueous solutions of ag-oxCDs have proven to be very stable based on the surface electrostatic stability analysis using zeta potential. The average zeta potential for three replicate measurements was ∼−52.9 mV (Fig. 2d), indicating sufficient negative surface charges due to the presence of the aforementioned oxygen-rich species on the ag-oxCDs surface.50 The zeta potential values remained close to that of the initial value (∼−52.9 mV, 0 week) over time, and ∼−45.2 mV was recorded at 12 weeks of storage.
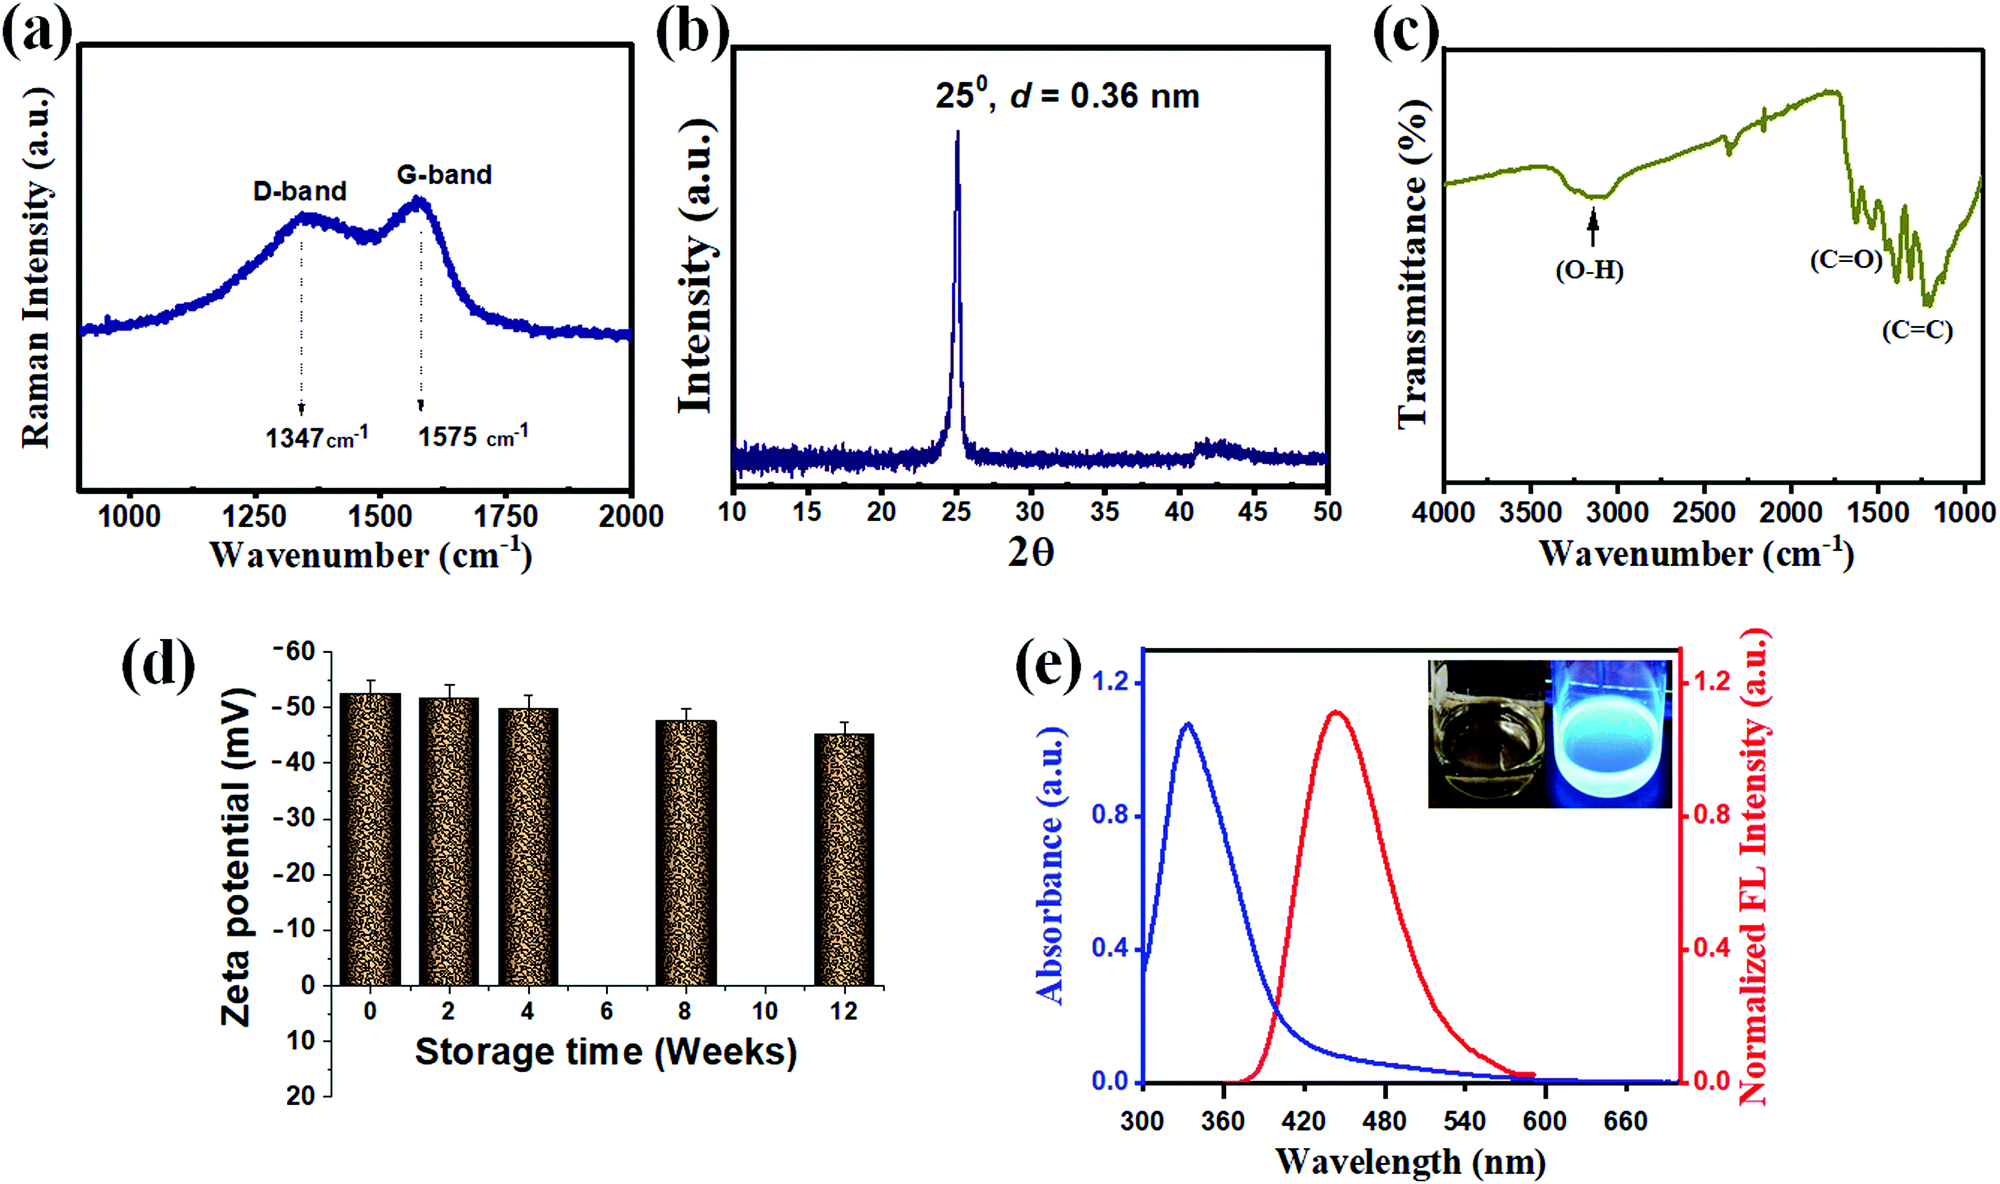 | ||
| Fig. 2 (a) Raman spectroscopy data. (b) XRD. (c) FTIR. (d) zeta potential of ag-oxCDs stored over time and (e) UV-vis and FL spectra of ag-oxCDs (inset: photographs of ag-oxCDs solution viewed under normal and UV (365 nm) lights. FL excitation wavelength = 340 nm. | ||
UV-vis absorption and FL spectroscopy were employed to provide insights into the ag-oxCDs' optical properties. In Fig. 2e, the clearly resolved signature absorption peak occurring strongly at ∼ 330 nm is ascribed to the n–π* or π–π* transitions of randomly conjugated CO or CC bonds in the hydrothermally formed heteroatomic moieties, which are similar to the typical absorptions of CDs prepared using other precursors.26,48,51,52 On the other hand, the FL analysis of the ag-oxCDs typically exhibits distinct and symmetrical FL spectra while displaying a bright blue FL emission under 365 nm UV light exposure (Fig. 2e inset). The excitation-dependent emissions of ag-oxCDs were further evaluated. FL emissions over a wide range of excitation wavelengths between 340–410 nm in a red-shifted sequence were observed (Fig. S3 in ESI†). The highest FL emission peak occurred at ∼445 nm when excited at 340 nm wavelength. The prevailing results indicate a significant energy difference between the emission mode and the associated excitation threshold of the ag-oxCDs, thus providing some insights to explore their FL origin. Although, the exact mechanism of the peculiar wavelength-dependent FL excitation in CDs is still unclear. The existence of various particle sizes and/or proliferation of emissive sites may be a rational explanation for this phenomenon.1,38,41,53,54
Therefore, we speculate that the excitation wavelength-dependent activity observed for our prepared ag-oxCDs does, in effect, reflect a heterogeneous size distribution as seen in TEM and/or different surface states as indicated by XPS.
Furthermore, the photostability of the ag-oxCDs was also investigated. It was observed that the FL properties were maintained up to 92% after continuous irradiation for a period of 6 h using a UV lamp (365 nm wavelength), suggesting the strong photostability of the prepared ag-oxCDs. Besides, the ag-oxCDs have a maximum FL quantum yield (ΦF) estimated to be 0.32 at room temperature. This demonstrates the prepared ag-oxCDs' suitability for optical and biological applications, including imaging and/or biosensing. Additional details of the optimized synthesis protocol for ag-oxCDs are further discussed in S1 and Table S1 in the ESI.†
3.2. Nanosensor design using ag-oxCDs: Fe(III) detection
First, the design of optical nanosensors for biological and environment analytes using nanosized fluorescent CDs is especially exciting in the light of their simplicity, cost effectiveness, and overall “greenness”. The critical biocompatibility and water dispersibility of carbon-based fluorescent materials compared to semiconductor-based nanoparticles are also an inherent advantage in nanosensors design.55,56 This has apparently facilitated the deployment of carbon-based quantum-sized materials to design sensing probes for metal ions, biomolecules, and other environmentally related target species.57,58The application of the prepared ag-oxCDs as a fluorescence nanosensor was tested and validated by the resulting interactions between the label-free fluorescent ag-oxCDs and Fe(III). Under the optimized analytical sensing conditions, the subsequent reactions resulted in a structural and/or surface coordination of the metal ion of Fe(III), leading to the enhanced FL mode of ag-oxCDs, modulated by different concentrations of Fe(III) within the tested range of 0.5 to 1500 μM as shown in Fig. 3a. The corresponding linear calibration plot dependent on Fe(III) concentration is shown in Fig. 3b (comparison of the responses of ag-oxCDs with pristine CDs). Following the typical analytical detection figures of merit evaluation, the sensitivity of the developed nanosensor was calculated from the calibration plot, Fig. 3b, using eqn (2).55,56
| ΔF/F0 = 0.5 + K[Fe(III)] | (2) |
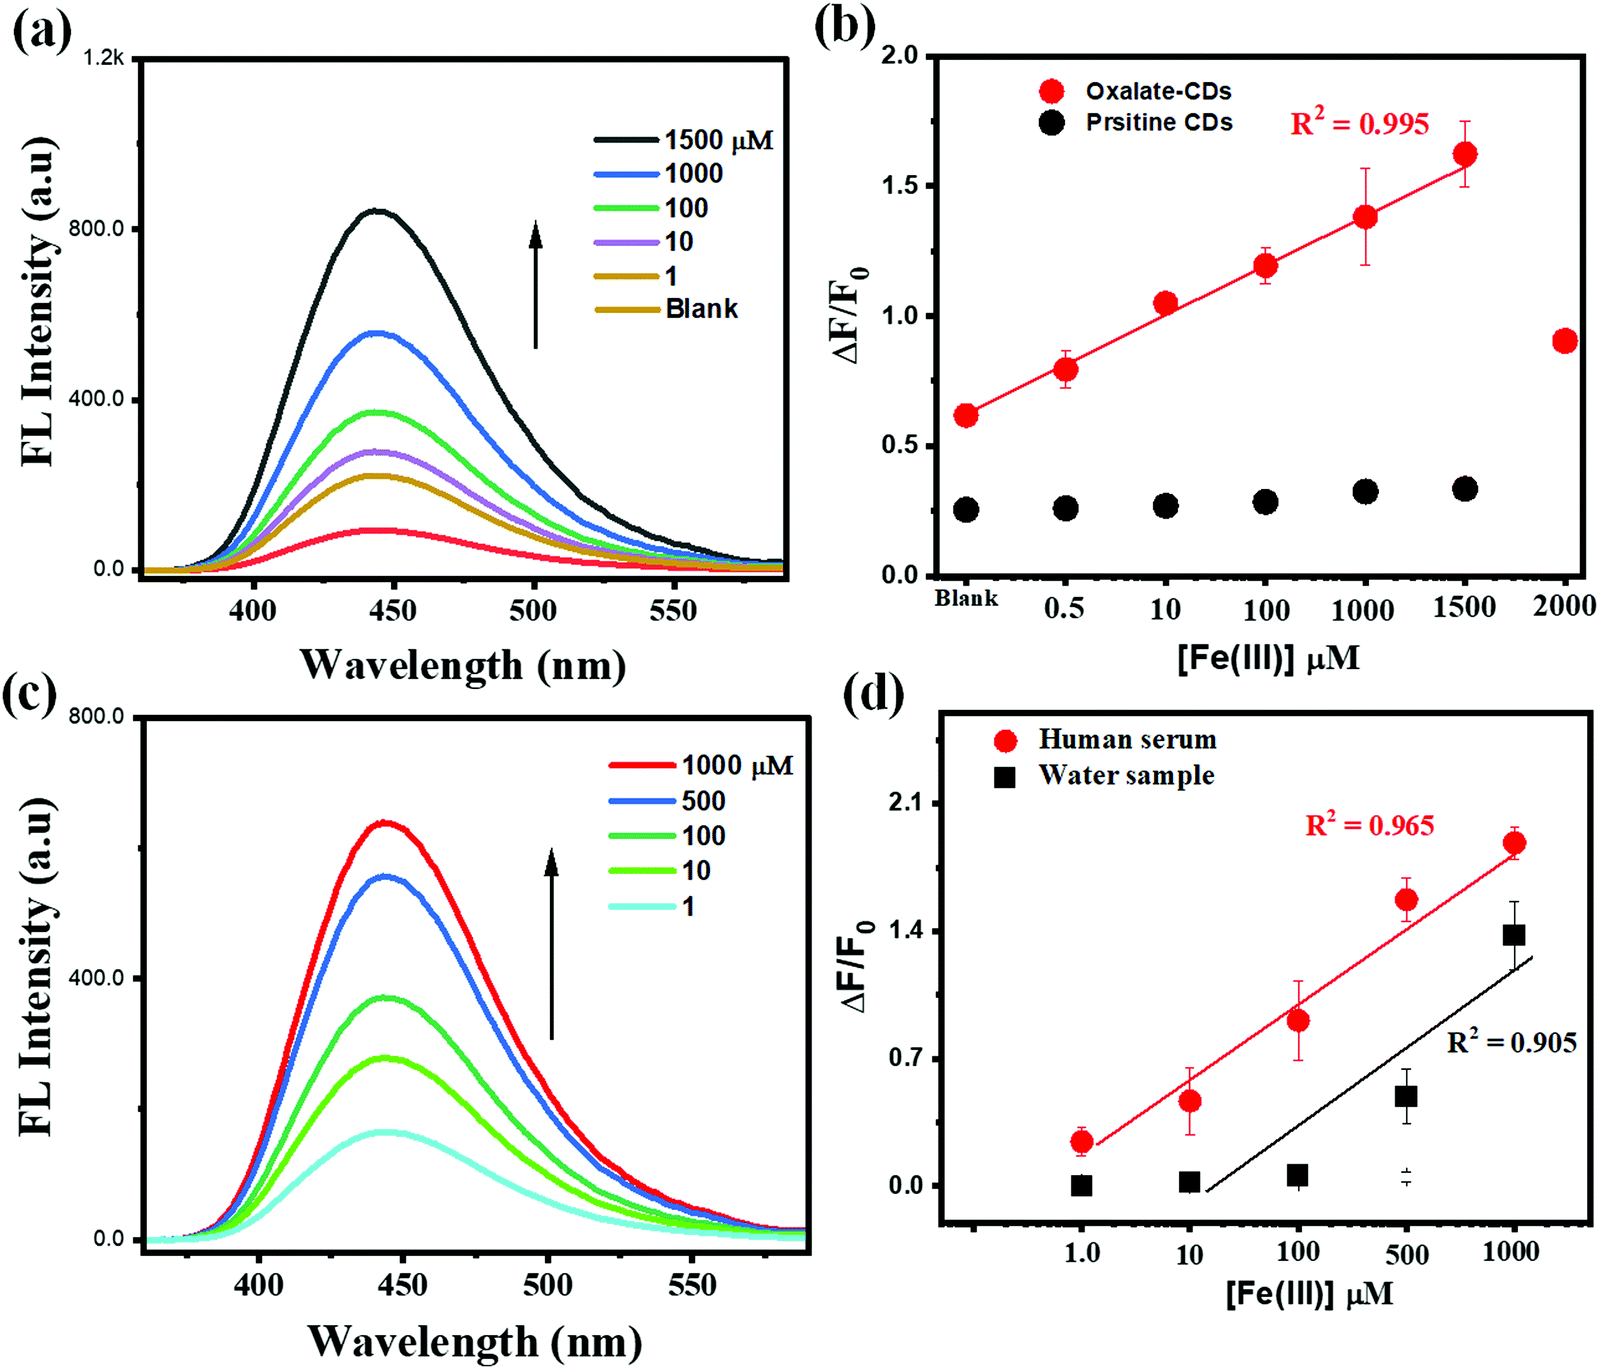 | ||
| Fig. 3 (a) FL spectra of ag-oxCDs in the presence of different concentration of Fe(III). (b) Corresponding calibration plots for Fe(III) detection using ag-oxCDs and pristine CDs. (c) FL spectra of ag-oxCDs for detecting Fe(III) in spiked human serum. (d) Corresponding calibration plots for the detection of Fe(III) in spiked human serum and water samples. Excitation wavelength = 340 nm. | ||
Thus, the FL signals of ag-oxCDs were linearly modulated by the presence of Fe(III) within the concentration range tested. An impressive LOD of 75 nM was calculated to demonstrate the analytical scientific merit of the developed nanosensing system for Fe(III) using the relationship in eqn (3).59
| LOD = 3δ/k, | (3) |
3.3. Real detection: spiked samples
For the real-life applicability of our developed ag-oxCDs-based nanosensor, the clear and interference-free detection of the target metal ion of Fe(III) both in environmental and/or clinical biological samples is important. Therefore, commercially obtained human serum (spiked with known amounts of Fe(III) ion) was screened using the developed analytical detection protocol similar to that of standard solutions of Fe(III). The human serum samples spiked with 1–1000 μM of Fe(III) displayed good detection recoveries as detailed in Table S3 in ESI.† Similarly, practical environmental applications of the designed system for Fe(III) assay in water samples were evaluated by the direct analysis of the spiked water samples collected from a pond (Coventry, UK). This was also followed by recovery/detection of Fe(III) in the samples. The nanosensing system was used to construct calibration plots, Fig. 3c and d, for Fe(III) detection in the complex spiked samples and was used to estimate the index of quantifiable Fe(III) in the human serum and pond water samples, respectively. Both the environmental and biological samples tested present excellent results of the quantified Fe(III) amounts (against known amounts spiked into the samples), with the relative standard deviations (RSDs) recorded (replicate measurements, n = 3) being satisfactory and the overall detected levels being close to other standard technique (ICP-OES) results as highlighted in Table S3 (ESI†). Therefore, the recoveries were >98% with RSD < 5.0% (Table S3 in ESI†). This further indicates the promising practical applications of the ag-oxCDs-based nanosensing system for Fe(III) quantification in complex matrices such as clinical and environmental samples.3.4. Specific and selective Fe(III) detection
A critical performance appraisal of robust analytical nanosensors is the quality and highly selective signal transduction in the presence of non-target species and/or the precise recognition of target analytes. In this case, some selected ions and a biomolecule were examined separately to scrutinize the specificity of the developed Fe(III)-detection system. The results presented in Fig. 4a show that Fe(III) detection can be carried out without interferences in the presence of Ca2+, Cu2+, Fe2+, Pb2+, Mg2+, Na+, K+, Cd2+, Al3+, Cr3+, Hg2+, SO42−, and L-Cys up to tested concentration levels of 5000 μM. It was very interesting to find that the FL signals of the ag-oxCDs have not been changed or distorted in the presence of the metal ions, an anion, and a biomolecule. Therefore, this observation demonstrates the characteristics of the developed nanosensor being selective towards Fe(III). At this juncture, it is necessary to state that by selecting the appropriate surface passivating moiety of oxalate to functionalize the signal emitting CDs, an advanced and specific interaction affinity with Fe(III) was engineered. Meanwhile, for the developed sensing system, the probable interference of the FL enhancement signal of ag-oxCDs for detecting Fe(III) may be caused by EDTA or phenanthroline which can competitively chelate Fe(III). However, in biological and environmental samples, the probability of their presence is relatively small.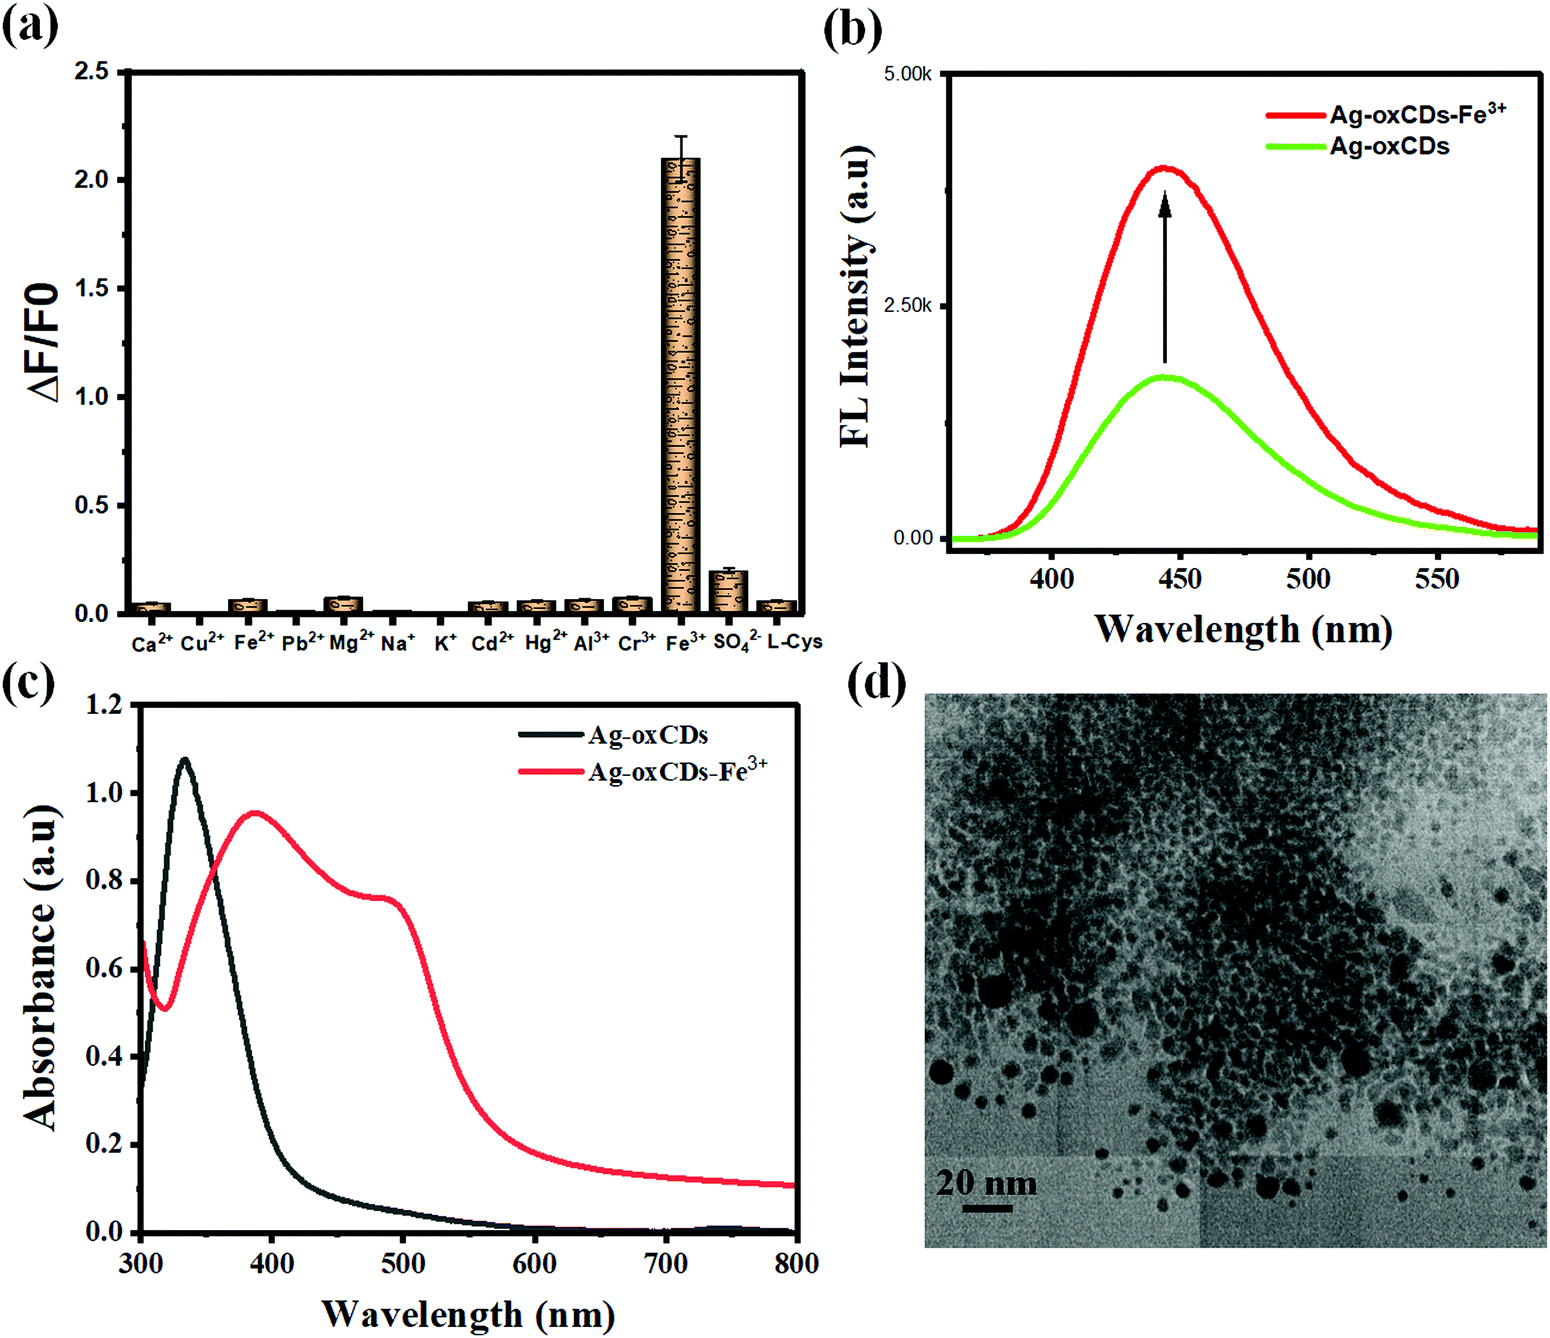 | ||
| Fig. 4 (a) Selectivity test results for detection of Fe(III) compared to other tested ions and a biomolecule. (b) FL characteristics of ag-oxCDs and pristine CDs with or without Fe(III). (c) Optical absorption changes in ag-oxCDs upon interaction with Fe(III). (d) TEM image showing aggregation of ag-oxCDs induced by Fe(III) interaction. | ||
3.5. Detection mechanism
The ag-oxCDs deployed in this study are considered to exhibit excellent optical properties which can be modulated by surface defects and/or interactions with appropriate species.25,26 Therefore, an FL enhancement due to optical coupling and/or spectroscopic interactions of ag-oxCDs with Fe(III) was observed and further investigated experimentally to elucidate the mechanistic process leading to the observed FL enhancement. To do so, first, the FL signals of pristine CDs (with and without oxalate functionality) in the presence of Fe(III) were compared with that of ag-oxCDs (with or without Fe(III). The results clearly showed a marked difference in the FL signal enhancement, Fig. 4b. Therefore, the observed enhancement was a direct outcome of the introduction of oxalate functionalization. Secondly, Fe(III) recognition by ag-oxCDs can be ascribed to an oxalate mediated molecular and electronic interaction with Fe(III) as well as the easy coordination or complexation between ag-oxCDs and Fe(III).60–62 It is important to emphasize here that besides the enhancement in optical properties introduced by oxalate functionalization of ag-oxCDs, rich oxo groups are also made available on the surface of ag-oxCDs. It is plausible to infer that the electronic rich surface C–O/CO (oxo) groups of ag-oxCDs exhibit obvious changes which produces a new electronic effect in the presence of Fe(III). Therefore, the FL enhancement of ag-oxCDs is typically referenced to the synergistic molecular binding and/or electronic interaction between the surface oxalate and Fe(III). We speculate that a binding interaction, between oxalate moiety (of the CDs) and Fe(III) which is widely reported, will result in intra- and/or inter-particles induced aggregation of ag-oxCDs to form bigger agglomerates by the surface groups connected to Fe(III). Similar phenomenon has been previously observed and reported in CDs functionalized with specific moieties that can bind target analytes to induce aggregation of the CDs resulting in enhanced FL signal.63–65 To further understand and experimentally account for the FL signal enhancement of ag-oxCDs in the presence of Fe(III), spectroscopic measurements (UV-vis), as well as microscopic imaging of ag-oxCDs-Fe(III), were conducted. The optical absorption spectra presented in Fig. 4c plausibly show that the specific interaction between ag-oxCDs and Fe(III) resulted in the observed FL signal enhancement. The change in the absorption spectra of ag-oxCDs in the presence of Fe(III) was suspected to be due to aggregation. To confirm this, a TEM image of ag-oxCDs in the presence of Fe(III) was taken (Fig. 4d), which provided clear evidence of an induced aggregation of ag-oxCDs.
4. Conclusions
In summary, we have successfully prepared highly fluorescent ag-oxCDs for the first-time using a bio-precursor of expired potatoes dextrose agar combined with oxalate via a one-pot hydrothermal synthesis route. The ag-oxCDs which possessed impressive FL QY of ∼32% with aqueous stability is suitable for use as an FL nanosensor for the detection of Fe(III). The detection of Fe(III) was based on the specific interaction affinity between the oxalate functionalized-ag-oxCDs and the target Fe(III) analyte. The critical detection protocol and mechanism was the engineered surface oxalate-mediated aggregation induced-enhanced fluorescence of the ag-oxCDs in the presence of Fe(III). The proposed ag-oxCDs-based nanosensor offers an alternative system for the rapid and reliable quantification/monitoring of Fe(III) in clinical blood samples and/or environmental samples as spiked human serum and environment water samples were analyzed and validated. The ag-oxCDs can also be potentially deployed for optical bio-imaging, and other fluorescence-based applications.Author contributions
Ojodomo. J. Achadu: conceptualization of this study, methodology, investigation, data curation, funding acquisition, writing – original draft. Gideon L. Elizur: investigation and visualization. ThankGod E. Boye: investigation and visualization. Enoch Y. Park: supervision, review and editing, funding acquisition.Conflicts of interest
There are no conflicts to declare.Acknowledgements
The Japan Society for the promotion of Science (JSPS) is gratefully acknowledged for the funding (Grant No. P19348) to carry out part of the research work. Funding from the European Union's Horizon 2020 research and innovation program under the Marie Skłodowska-Curie grant agreement No. 945380 is gratefully acknowledged.Notes and references
- Y. P. Sun, B. Zhou, Y. Lin, W. Wang, K. A. S. Fernando, P. Pathak, M. J. Meziani, B. A. Harruff, X. Wang, H. Wang, P. G. Luo, H. Yang, M. E. Kose, B. Chen, L. M. Veca and S. Y. Xie, J. Am. Chem. Soc., 2006, 128(24), 7756 CrossRef CAS PubMed.
- J. Liu, S. Lu, Q. Tang, K. Zhang, W. Yu, H. Sun and B. Yang, Nanoscale, 2017, 9, 7135 RSC.
- Z. Liang, L. Zeng, X. Cao, Q. Wang, X. Wang and R. Sun, J. Mater. Chem. C, 2014, 2, 9760–9766 RSC.
- Z. Yan, Z. Zhang and J. Chen, Sens. Actuators, B, 2016, 225, 465 Search PubMed.
- L. Li, C. Lu, S. Li, S. Liu, L. Wang, W. Cai, W. Xu, X. Yang, Y. Liu and R. Zhang, J. Mater. Chem. B, 2017, 5, 1935–1942 RSC.
- Z. C. Yang, M. Wang, A. M. Yong, S. Y. Wong, X. H. Zhang, H. Tan, A. Y. Chang, X. Li and J. Wang, Chem. Commun., 2011, 47, 11615–11617 RSC.
- X. Zhang, M. Jiang, N. Niu, Z. Chen, S. Li, S. Liu and J. Li, ChemSusChem, 2018, 11(1), 11–24 CrossRef PubMed.
- R. Atchudan, T. N. J. I. Edison, K. R. Aseer, S. Perumal, N. Karthik and Y. R. Lee, Biosens. Bioelectron., 2018, 99, 303–311 CrossRef CAS PubMed.
- R. Atchudan, T. N. J. I. Edison, S. Perumal, N. Muthuchamy and Y. R. Lee, Fuel, 2020, 275, 117821 CrossRef CAS.
- P. Krishnaiah, R. Atchudan, S. Perumal, N. Karthik, E. Salama, Y. R. Lee and B. H. Jeon, Chemosphere, 2022, 286, 131764 CrossRef CAS PubMed.
- J. Zhang, Y. Yuan, G. Liang and S. H. Yu, Adv. Sci., 2015, 2, 1500002 CrossRef PubMed.
- S. Y. Park, H. U. Lee, E. S. Park, S. C. Lee, J. W. Lee, S. W. Jeong, C. H. Kim, Y. C. Lee, Y. S. Huh and J. Lee, ACS Appl. Mater. Interfaces, 2014, 6(5), 3365–3370 CrossRef CAS PubMed.
- H. U. Lee, S. Y. Park, E. S. Park, B. Son, S. C. Lee, J. W. Lee, Y. C. Lee, K. S. Kang, M. Il Kim, H. G. Park, S. Choi, Y. S. Huh, S. Y. Lee, K. B. Lee, Y. K. Oh and J. Lee, Sci. Rep., 2014, 4, 4665 CrossRef PubMed.
- J. Feng, W. J. Wang, X. Hai, Y. L. Yu and J. H. Wang, J. Mater. Chem. B, 2016, 4, 387–393 RSC.
- Q. Xu, Y. Gong, Z. Zhang, Y. Miao, D. Li and G. Yan, Microchim. Acta, 2019, 186, 483 CrossRef PubMed.
- S. Thambiraj and R. S. Dhesingh, Appl. Surf. Sci., 2016, 390, 435 CrossRef.
- I. Y. Goryacheva, A. V. Sapelkin and G. B. Sukhorukov, TrAC, Trends Anal. Chem., 2017, 90, 27–37 CrossRef CAS.
- Z. Peng, E. H. Miyanji, Y. Zhou, J. Pardo, S. D. Hettiarachchi, S. Li, P. L. Blackwelder, I. Skromne and R. M. Leblanc, Nanoscale, 2017, 9, 17533–17543 RSC.
- X. Sun and Y. Lei, TrAC, Trends Anal. Chem., 2017, 89, 163–180 CrossRef CAS.
- G. W. Griffith, G. L. Easton, A. Detheridge, K. Roderick, A. Edwards, H. J. Worgan, J. Nicholson and W. T. Perkins, FEMS Microbiol. Lett., 2007, 276, 165 CrossRef CAS PubMed.
- V. Scherz, C. Durussel and G. Greub, PLoS One, 2017, 12(11), e0187263 CrossRef PubMed.
- E. L. Meyer, G. Golston, S. Thomaston, M. Thompson, K. Rengarajan and P. Olinger, Appl. Biosaf., 2017, 22, 164 CrossRef.
- J. Ju and W. Chen, Biosens. Bioelectron., 2014, 58, 219 CrossRef CAS PubMed.
- D. En, Y. Guo, B. T. Chen, B. Dong and M. J. Peng, RSC Adv., 2014, 4, 248 RSC.
- H. Ahouari, G. Rousse, J. Rodríguez-Carvajal, M. T. Sougrati, M. Saubanère, M. Courty, N. Recham and J. M. Tarascon, Chem. Mater., 2015, 27, 1631 CrossRef CAS.
- O. J. Achadu and N. Revaprasadu, Microchim. Acta, 2018, 185, 461–469 CrossRef PubMed.
- O. J. Achadu and N. Revaprasadu, Microchim. Acta, 2019, 186, 87 CrossRef PubMed.
- O. J. Achadu, F. Abe, F. Hossain, F. Nasrin, M. Yamazaki, T. Suzuki and E. Y. Park, Biosens. Bioelectron., 2021, 193, 113540 CrossRef CAS PubMed.
- O. J. Achadu, D. X. Lioe, K. Kagawa, S. Kawahito and E. Y. Park, Microchim. Acta, 2020, 187, 466 CrossRef CAS PubMed.
- O. J. Achadu, M. Managa and T. Nyokong, J. Photochem. Photobiol., A, 2017, 133, 124 Search PubMed.
- A. M. Brouwer, Pure Appl. Chem., 2011, 83, 2213–2228 CrossRef CAS.
- O. J. Achadu and T. Nyokong, J. Fluoresc., 2016, 26, 283–295 CrossRef CAS PubMed.
- O. J. Achadu and T. Nyokong, Anal. Chim. Acta, 2017, 991, 113–126 CrossRef CAS PubMed.
- K. Holá, M. Sudolská, S. Kalytchuk, D. Nachtigallová, A. L. Rogach, M. Otyepka and R. Zbořil, ACS Nano, 2017, 11, 12402–12410 CrossRef PubMed.
- H. Ding, F. Du, P. Liu, Z. Chen and J. Shen, ACS Appl. Mater. Interfaces, 2015, 7, 6889–6897 CrossRef CAS PubMed.
- S. Zhu, L. Wang, B. Li, Y. Song, X. Zhao, G. Zhang, S. Zhang, S. Lu, J. Zhang, H. Wang, H. Sun and B. Yang, Carbon, 2014, 77, 462–472 CrossRef CAS.
- M. L. Liu, B. Bin Chen, C. M. Li and C. Z. Huang, Green Chem., 2019, 21, 449–471 RSC.
- A. P. Demchenko and M. O. Dekaliuk, Nanoscale, 2016, 8, 14057–14069 RSC.
- M. J. Krysmann, A. Kelarakis, P. Dallas and E. P. Giannelis, J. Am. Chem. Soc., 2012, 134(2), 747–750 CrossRef CAS PubMed.
- J. Ren, F. Weber, F. Weigert, Y. Wang, S. Choudhury, J. Xiao, I. Lauermann, U. Resch-Genger, A. Bande and T. Petit, Nanoscale, 2019, 11, 2056–2064 RSC.
- N. Dhenadhayalan, K. C. Lin, R. Suresh and P. Ramamurthy, J. Phys. Chem. C, 2016, 120(2), 1252–1261 CrossRef CAS.
- L. Wang, S. J. Zhu, H. Y. Wang, S. N. Qu, Y. L. Zhang, J. H. Zhang, Q. D. Chen, H. L. Xu, W. Han, B. Yang and H. B. Sun, ACS Nano, 2014, 8(3), 2541–2547 CrossRef CAS PubMed.
- A. Sharma, T. Gadly, S. Neogy, S. K. Ghosh and M. Kumbhakar, J. Phys. Chem. Lett., 2017, 8(5), 1044–1052 CrossRef CAS PubMed.
- H. Wang, T. Zhang, J. Zhu, Y. Zhai, H. Wang, X. Bai, B. Dong and H. Song, Nanoscale, 2017, 9, 13042–13051 RSC.
- L. Xiao, Y. Wang, Y. Huang, T. Wong and H. Sun, Nanoscale, 2017, 9, 12637–12646 RSC.
- O. J. Achadu, J. Britton and T. Nyokong, J. Fluoresc., 2016, 26, 2199–2212 CrossRef PubMed.
- K. Chen, W. Qing, W. Hu, M. Lu, Y. Wang and X. Liu, Spectrochim. Acta, Part A, 2019, 213, 228 CrossRef CAS PubMed.
- J. Wei, J. Shen, X. Zhang, S. Guo, J. Pan, X. Hou, H. Zhang, L. Wang and B. Feng, RSC Adv., 2013, 3, 13119–13122 RSC.
- B. Chen, F. Li, S. Li, W. Weng, H. Guo, T. Guo, X. Zhang, Y. Chen, T. Huang, X. Hong, S. You, Y. Lin, K. Zeng and S. Chen, Nanoscale, 2013, 5, 1967–1971 RSC.
- Y. Hu, J. Yang, J. Tian, L. Jia and J. S. Yu, RSC Adv., 2015, 5, 15366–15373 RSC.
- H. Ding, S. B. Yu, J. S. Wei and H. M. Xiong, ACS Nano, 2016, 10(1), 484–491 CrossRef CAS PubMed.
- O. J. Achadu and T. Nyokong, New J. Chem., 2017, 41, 1447–1458 RSC.
- Y. Chen, H. Lian, Y. Wei, X. He, Y. Chen, B. Wang, Q. Zeng and J. Lin, Nanoscale, 2018, 10, 6734–6743 RSC.
- Y. Wang, S. Kalytchuk, Y. Zhang, H. Shi, S. V. Kershaw and A. L. Rogach, J. Phys. Chem. Lett., 2014, 5(8), 1412–1420 CrossRef CAS PubMed.
- O. J. Achadu, K. Takemura, I. M. Khoris and E. Y. Park, Sens. Actuators, B, 2020, 321, 128494 CrossRef CAS PubMed.
- O. J. Achadu and T. Nyokong, New J. Chem., 2016, 40, 8727–8736 RSC.
- L. Zhou, Y. Lin, Z. Huang, J. Ren and X. Qu, Chem. Commun., 2012, 48, 1147–1149 RSC.
- A. Kumari, A. Kumar, S. K. Sahu and S. Kumar, Sens. Actuators, B, 2018, 254, 197 CrossRef CAS.
- C. A. Holstein, M. Griffin, J. Hong and P. D. Sampson, Anal. Chem., 2015, 87, 9795–9801 CrossRef CAS PubMed.
- F. Li, L. Koopal and W. Tan, Sci. Rep., 2018, 8, 2060 CrossRef PubMed.
- H. Qiu, S. Zhang, B. Pan, W. Zhang and L. Lv, Chem. Eng. J., 2013, 232, 167–173 CrossRef CAS.
- D. M. Cwiertny, G. J. Hunter, J. M. Pettibone, M. M. Scherer and V. H. Grassian, J. Phys. Chem. C, 2010, 113, 2175–2186 CrossRef.
- Y. Xu, H. Li and B. Wang, Microchim. Acta, 2018, 185, 252 CrossRef PubMed.
- W. Lv, M. Lin, R. Li, Q. Zhang, H. Liu, J. Wang and C. Huang, Chin. Chem. Lett., 2019, 30, 1410–1414 CrossRef CAS.
- C. Wang, K. Jiang, Z. Xu, H. Lin and C. Zhang, Inorg. Chem. Front., 2016, 3, 514–522 RSC.
Footnote |
| † Electronic supplementary information (ESI) available. See DOI: https://doi.org/10.1039/d2ma00567k |
| This journal is © The Royal Society of Chemistry 2022 |