
 Open Access Article
 This Open Access Article is licensed under a Creative Commons Attribution-Non Commercial 3.0 Unported Licence
Electrocatalytic CO2 reduction reaction on dual-metal- and nitrogen-doped graphene: coordination environment effect of active sites†
Peinan
He
,
Haisong
Feng
,
Si
Wang
,
Hu
Ding
,
Yujie
Liang
,
Min
Ling
and
Xin
Zhang
 *
*
State Key Laboratory of Chemical Resource Engineering, Beijing Advanced Innovation Center for Soft Matter Science and Engineering, Beijing University of Chemical Technology, Beijing 100029, China. E-mail: zhangxin@mail.buct.edu.cn
First published on 28th April 2022
Abstract
Electrochemical CO2 reduction reaction (CO2RR) is a promising method to convert CO2 to CO, and developing CO2RR electrocatalysts is essential to improve the conversion efficiency. Herein, the CO2RR catalytic performance of dual-metal–nitrogen–carbon catalysts (M1/M2–N6–Gra, Model 1, Model 2, and Model 3) with different bimetals and different coordination environments at active sites (the coordination number of metal and nitrogen ranges from 2 to 4) has been systematically studied through density functional theory (DFT). The calculated formation energies indicate that high-coordinated catalysts are thermodynamically stable. By calculating the Gibbs free energy changes of the CO2RR pathway and the selectivity of hydrogen evolution reaction (HER), we determine that the coordination environment of the active sites of the catalysts strongly affects the activity and selectivity of CO2 reduction to CO. The low-coordinated catalysts have strong *COOH and *CO adsorption capacity, and it is difficult for CO to desorb from the catalyst surface, resulting in the poor catalytic activity of CO2RR; the high-coordinated catalysts have moderate *COOH and *CO adsorption capacity, and have excellent catalytic activity for reducing CO2 to CO. In addition, the CO2RR reduction activity of most heteronuclear M1/M2–N6–Gra has been enhanced due to the synergy between heterometallic metals, and the synergy is effectively improved with the increase of the coordination number. In particular, using the limiting potential difference of CO2RR and HER as the selective descriptor, we have screened out four catalysts, including Co/Zn, Fe/Zn, Mn/Zn, and Fe/Mn–N6–Gra-Model 3 (the coordination number of metal and nitrogen is 4), which have favorable limiting potentials of −0.20, −0.24, −0.26, and −0.26 V, respectively. This work provides guidance for the development of effective bimetallic single-atom catalysts based on nitrogen-doped carbon materials for CO2RR.
1. Introduction
Excessive emission of carbon dioxide has made the concentration of CO2 in the atmosphere increase year by year, resulting in an increasingly serious greenhouse effect, and posing a serious threat to the ecological environment.1–5 Converting excess CO2 into high value-added chemicals is an effective strategy to achieve carbon neutrality and alleviate energy shortages. In recent years, the electrochemical reduction of CO2 has gradually become a research hotspot for its controllable reaction and simple operation.6–8 The process of electrochemical CO2 reduction reaction (CO2RR) involves the transition of multiple proton/electron pairs and can generate various products, such as CO, CH4, CH3OH, C2H4, C2H5OH, etc. Among them, the reduction of CO2 to CO only involves two proton/electron pairs transfer (CO2 + 2H+ + 2e− → CO + H2O), and greatly reduces the hindered process.8–10Generally, an ideal catalyst for reducing CO2 to CO should have the following characteristics: (1) Good CO2 adsorption activity. The strong chemical inertness of linear CO2 molecule makes it difficult to activate the C = O bond, and efficient CO2RR catalysts should effectively activate CO2. (2) Weak CO binding energy. The weak CO adsorption will make it easier for CO to desorb from the catalyst surface and avoid further hydrogenation. (3) Effectively inhibit the competitive HER. High HER activity leads to low Faraday efficiency of CO2RR.
According to previous studies, transition metals (e.g., Cu, Au, Ag, etc.) are the most widely used electrocatalysts for the reduction of CO2 to CO,11–15 nevertheless, they usually suffer from high overpotential, poor selectivity, and high cost.16,17 Recently, single-atom catalysts (SAC) have attracted attention due to their high atom utilization and excellent catalytic performance.2,10,18–21 Studies have shown that the dual-metal–nitrogen–carbon materials exhibit high catalytic activity in CO2RR due to the synergistic effect of the bimetallic centers.22–26 Ren et al.22 prepared a Ni/Fe–N–C catalyst with isolated diatomic Ni–Fe sites. The Faraday efficiency of CO (FECO) of the catalyst was 98%, which was higher than Ni–N–C and Fe–N–C. Guo et al.25 also synthesized a Cu–Co bimetallic nanoparticle that was well-dispersed on porous carbon, which could reduce CO2 to CO with high selectivity, and the FECO could reach 97.4%. However, so far, although bimetallic catalysts for the reduction of CO2 to CO have been developed, their research is still in a preliminary exploration stage, finding a proper and promising catalyst to improve the activity and selectivity of CO2RR remains a challenge.
The coordination environment of the active sites of the catalysts also has an important impact on the catalytic activity and selectivity of CO2RR. For example, the catalytic performance of Co–N–C is affected by the coordination of Co atoms. Wang et al.20 synthesized a series of Co–Nx (x = 2–4) single-atom catalysts with different N coordination numbers. The results showed that the Co–N2 site with a lower N coordination number exhibited significant activity and selectivity for the reduction of CO2 to CO. Pan et al.21 reported that the atomically dispersed Co–N5 site could also efficiently catalyze CO2RR with high CO Faraday efficiency (≈ 94%) and high stability. In addition, a previous study has also shown that FeCo bimetallic catalyst anchored with OH–ligand displayed unique geometric and electronic structure, and exhibited unparalleled ORR activity at the FeCoN5–OH active site.27 These works indicate that moderate regulation of the coordination environment around the active site is essential to enhance the performance of CO2RR. Therefore, it is of great significance to investigate the effect of the coordination environment of the bimetallic active sites on the catalytic activity for the rational design of high-efficiency CO2RR electrocatalysts.
In this work, we design a series of bimetallic single-atom catalysts embedded in N-doped graphene (M1/M2–N6–Gra) by adjusting the bimetal (M = Mn–Zn) and coordination environment (the coordination number of metal and nitrogen ranges from 2 to 4) of the active sites of the catalysts, and study the CO2RR mechanism by density functional theory (DFT). It is found that the coordination environment affects the stability of the catalysts and the catalytic performance of CO2RR. Compared with low-coordinated catalysts, high-coordinated catalysts have more negative formation energies and are more thermodynamically stable. The research on the reduction mechanism shows that the high-coordinated catalysts have moderate *COOH and *CO adsorption capacity, resulting in excellent catalytic activity for reducing CO2 to CO. Finally, the electrocatalysts Co/Zn, Fe/Zn, Mn/Zn, and Fe/Mn–N6–Gra-Model 3 with high activity and selectivity for CO production are screened out, and their limiting potentials are as low as −0.20, −0.24, −0.26, and −0.26 V. This work systematically presents the theoretical stability, activity, and selectivity of M1/M2–N6–Gra in three kinds of coordination environments, which inspires useful guidance for the further development of new low-cost and high-activity CO2RR electrocatalysts.
2. Computational methods and models
All the spin-polarized calculations were carried out by the Vienna Ab initio Simulation Package (VASP 5.4.4) software package.28–30 The GGA–PBE exchange–correlation functional was used to describe the electronic interactions.31 In the structural optimization, a 3 × 3 × 1 Monkhorst–Pack grid32 was used to sample the Brillouin zone, and a 12 × 12 × 1 denser k-point grid was used in the electronic structure calculations. The cutoff energy was set as 400 eV, and the energy and force convergence criteria of the self-consistent iteration were set to 10−5 eV and 0.02 eV Å−1, respectively. DFT-D3 method was used to describe van der Waals (vdW) interactions.33To model M1/M2–N6–Gra, we constructed monolayer graphene with a 4 × 3 supercell, and added a 15 Å vacuum space to reduce the interactions between adjacent layers. By removing four or six carbon atoms to create vacancies, introducing and replacing 6 N atoms around the carbon vacancies, and introducing M1 and M2 metal atoms in the center, M1/M2–N6–Gra structures with three different coordination environments were obtained. In addition, the corresponding single metal–nitrogen–carbon (M–N4–Gra) material models were established, in which one metal atom replaces two adjacent carbon atoms, and the four carbon atoms directly connected to the metal atom are replaced by nitrogen atoms.
The process of reducing CO2 to CO undergoes two electron transfers, including the following three steps (1)–(3):
| Step 1: CO2 + * + H+ + e− → *COOH (ΔG1) | (1) |
| Step 2: *COOH + H+ + e− → *CO + H2O (ΔG2) | (2) |
| Step 3: *CO → CO(g) + * (ΔG3) | (3) |
The formation energies (Ef) of the M1/M2–N6–Gra systems are calculated by
| Ef = EM1/M2–N6–Gra – EN6–Gra – EM1 – EM2 | (4) |
The adsorption energies (Ea) of the reactive intermediates are calculated by
| Ea = E*C – EM1/M2–N6–Gra – EC | (5) |
The Gibbs free energy changes (ΔG) of the reaction are calculated by the computational hydrogen electrode model (CHE) proposed by Nørskov et al.:34
| ΔG = ΔE + ΔZPE – TΔS + ΔGU + ΔGpH | (6) |
The adsorption free energies (ΔG*C) of the reaction intermediates (*CO, *COOH) on M1/M2–N6–Gra are calculated as
| ΔG*C = ΔEa + ΔZPE – TΔS | (7) |
The limiting potentials (UL) of CO2RR are defined as
| UL = −ΔGmax/e = −max{ΔG1, ΔG2, ΔG3}/e | (8) |
Additionally, in order to examine the influence of the supercell size of graphene, the Ni/Fe–N6–Gra models with adsorbed *COOH and *CO: (1) 4 × 3; (2) 5 × 3; (3) 6 × 4, were optimized. The optimized configurations and adsorption energies were shown in Fig. S1(ESI†), and we found that the adsorption energies of *COOH or *CO on the three supercells were relatively close. Therefore, in order to rationally utilize the computational resources, the 4 × 3 supercell models were employed in this work.
For solvation correction, starting from the random H2O configuration, we used the Forcite module of Materials Studio 8.0 software35 to run 2 nanoseconds of molecular dynamics (MD) simulations and then used VASP 5.4.4 to run 10.5 pic-second of ab initio molecular dynamics (AIMD) simulations at 298.15 K to obtain the water/catalyst equilibrium interface (Fig. S2, ESI†). In the AIMD simulations, we used the Nose–Hoover thermostat36 to maintain the temperature and sampled the Brillouin zone with a cutoff energy of 300 eV37 and a 3 × 3 × 1 k-point grid. The time step was set to 1.5 fs. After that, we used DFT calculations to get the adsorption energies of the intermediates in the aqueous solution, and further calculated the solvation correction values.
3. Results and discussion
3.1 Structure and Stability of M1/M2–N6–Gra
To explore the effect of the coordination environment around the active sites on CO2RR properties, three types of M1/M2–N6–Gra structures are constructed (Fig. 1(a)): the metal is bonded with two N atoms (Model 1), three N atoms (Model 2), and four N atoms (Model 3), respectively. The optimized substrate structures are given in Fig. S3 (ESI†).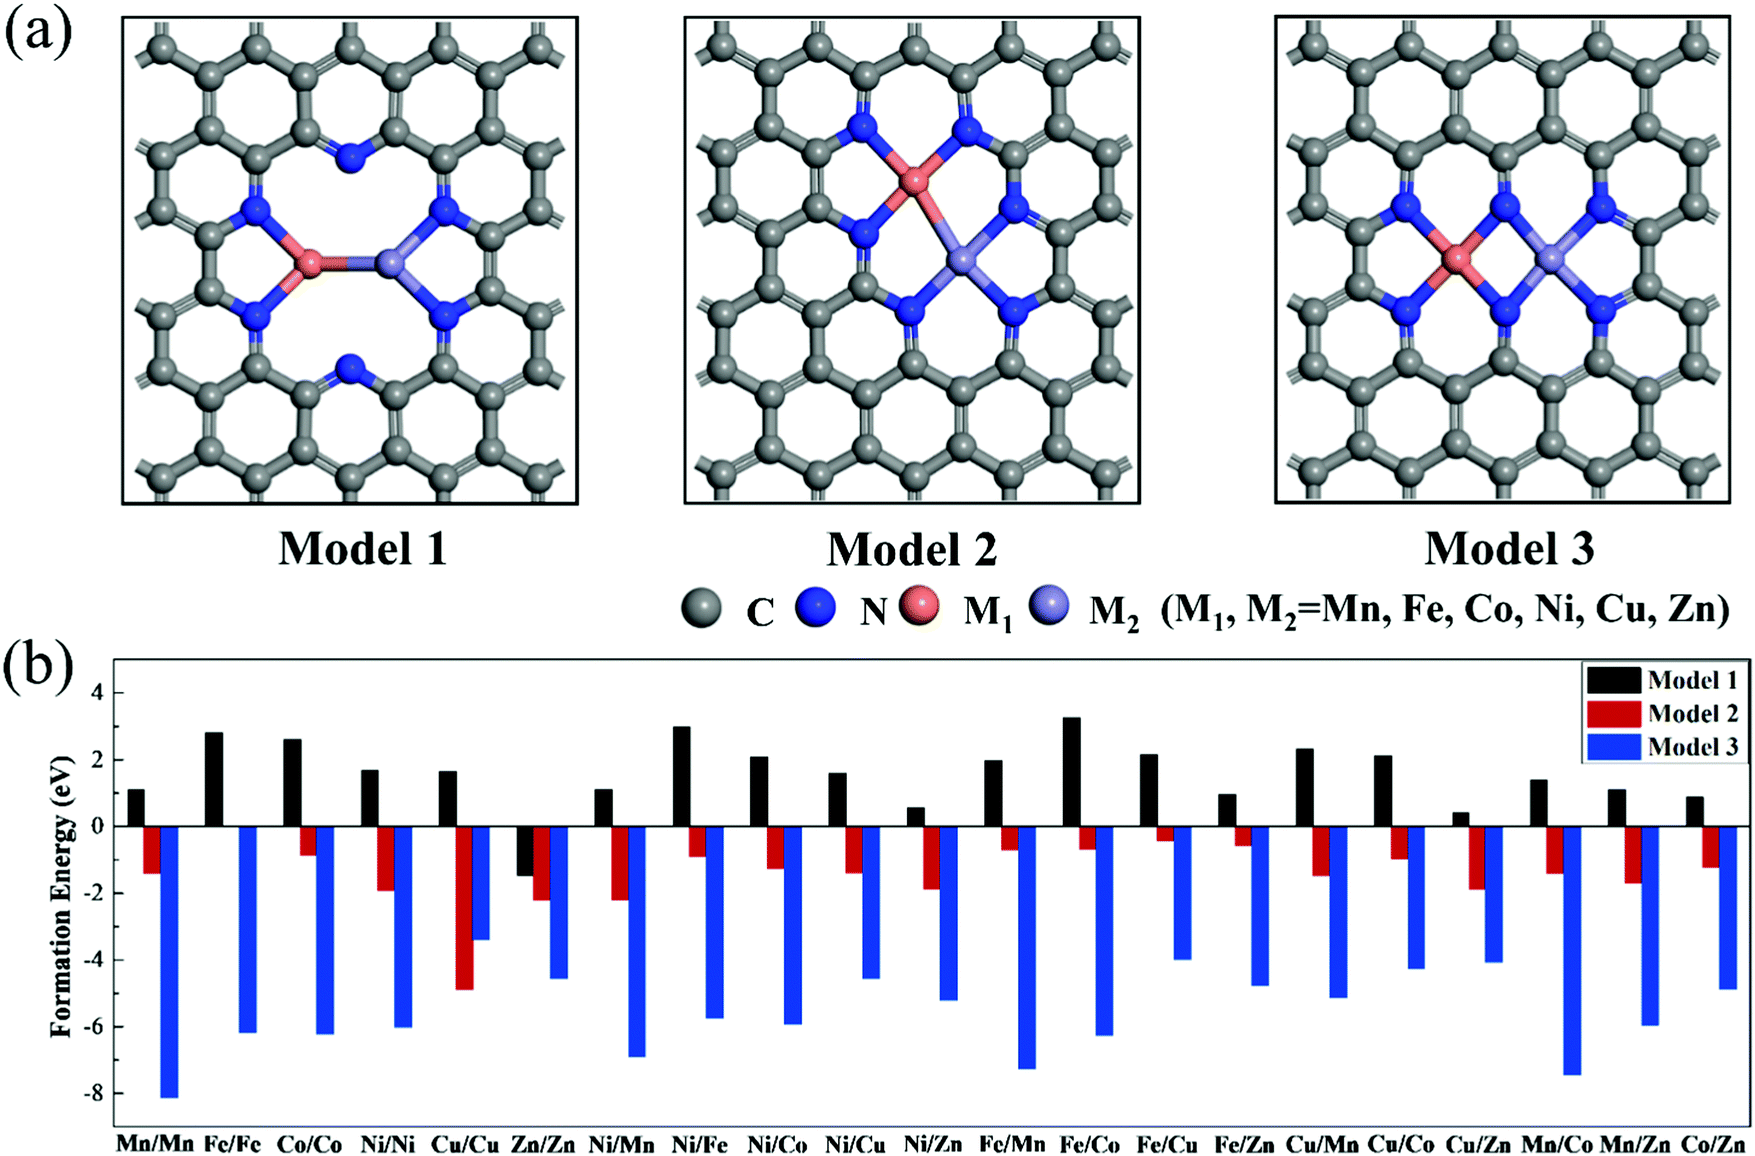 | ||
| Fig. 1 (a) Geometric structures and (b) formation energies of M1/M2–N6–Gra (M1/M2 = Mn−Zn). The gray, blue, orange, and purple atoms represent carbon, nitrogen, M1, and M2, respectively. | ||
To evaluate the stability, the formation energies of M1/M2–N6–Gra are calculated by eqn (4), and the calculation results are shown in Fig. 1(b) and Table S1 (ESI†). According to previous studies, the catalysts with Ef < 0 eV are considered to be thermodynamically stable.38,39 Interestingly, from Fig. 1(b), we find that the Ef values of the three models of M1/M2–N6–Gra are quite different. For Model 1, except Zn/Zn–N6–Gra has negative formation energy, all the other catalysts have positive formation energies, which may be ascribed to the fact that the relatively more valence electron and lower energy of Zn atom than other transition metal atoms we calculated,40 and can be more easily introduced into carbon vacancies. All the formation energies of Model 2 and Model 3 are negative. From the viewpoint of energy value, Model 3 have more negative formation energies than Model 2, indicating that Model 3 are more thermodynamically stable. This is probably due to the different coordination environments around the metals of the active sites in Model 2 and Model 3, leading to different sizes of pores surrounded by edge N atoms (Fig. S4, ESI†). The pore in Model 3 is relatively large, and the distance between the embedded two metal atoms is about 2.469 Å (half of the pore size), while that in Model 2 is about 2.029 Å (one-third of the pore size). The large pore size is more conducive to metal insertion. Additionally, the metal atoms in Model 1, Model 2, and Model 3 are coordinated with 2, 3, and 4 N atoms, respectively. The stability of the catalysts can be improved with the increase of the coordination number of metal atoms and N atoms, which is consistent with the results of previous studies.41 In general, from the perspective of thermodynamics, most M1/M2–N6–Gra catalysts can be easily synthesized through experiments.
3.2 Electrocatalytic activity for CO2RR of M1/M2–N6–Gra
The reduction of CO2 to CO process contains three steps (1)–(3) with two electron transfers. The activation of CO2 to *COOH on the catalysts is the first step of the reaction, and *COOH is the main intermediate in the CO2RR process. Therefore, we first study the adsorption configurations of *COOH on M1/M2–N6–Gra (Model 1–Model 3), and the most stable adsorption configurations are displayed in Fig. 2 and Fig. S5–S7 (ESI†).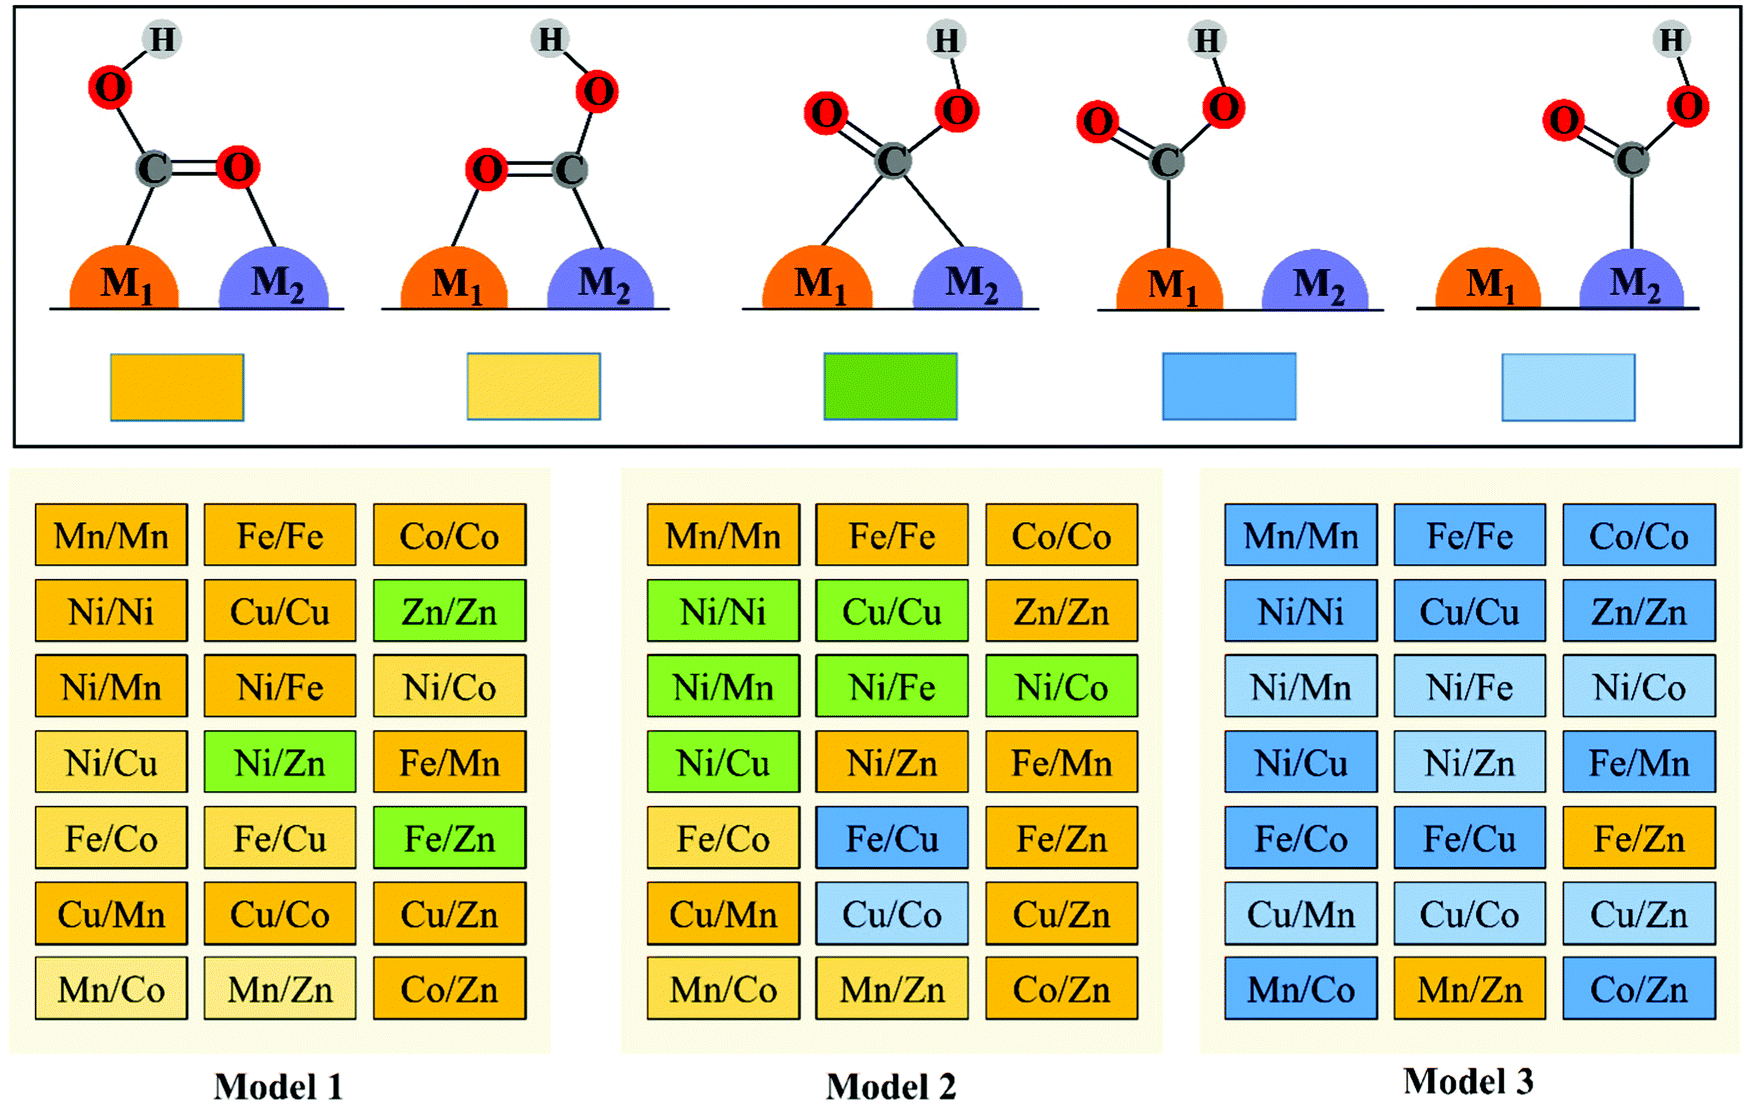 | ||
| Fig. 2 The adsorption configurations of *COOH on M1/M2–N6–Gra. | ||
Three main adsorption configurations of *COOH on M1/M2–N6–Gra are considered (Fig. 2): (a) the C and O atoms of *COOH are respectively attached to two adjacent metal atoms, that is, the two metal atoms are *C binding site and *O binding site, respectively; (b) the C atom of *COOH is attached to two metal atoms at the same time, that is, *COOH is adsorbed on the bridge site between the two metals; (c) the C atom of *COOH is only attached to one of the metal atoms, that is, *COOH is adsorbed on the metal top site.
Our calculation results demonstrate that the intermediate *COOH on Model 1 are mainly adsorbed on M1/M2–N6–Gra substrate through the first type of bridge adsorption pattern. In Model 2, the most stable adsorption configurations of the intermediate *COOH on M1/M2–N6–Gra substrate, all three adsorption patterns exist. In Model 3, *COOH are mainly adsorbed on the metal top site of M1/M2–N6–Gra (Fig. 2). The most stable adsorption configurations of *COOH on the three models are obviously different, which is probably attributed to the combined effects of the size of carbon vacancy, the properties of bimetal, the affinity of metals to C and O, the difference in the coordination number of metal and nitrogen at the active site and the significant differences in the bond lengths between bimetals (Table S2, ESI†) caused by the difference in the atomic radius of the bimetallic atoms and many other factors. For example, for Ni/Zn–N6–Gra, the bond lengths between bimetals on Model 1 and Model 2 are 2.294 and 2.425 Å, respectively, and the bond length of metal—C is smaller than that of metal—O bond. The *COOH of Model 1 is adsorbed on the bimetallic bridge site due to the closer bimetallic distance, and C bonds with Ni and Zn atoms. While the longer bimetallic distance of Model 2 causes the C atom of *COOH bonds with Ni atom and O atom bonds with Zn atom. For Zn/Zn–N6–Gra-Model 1 and Mn/Zn–N6–Gra-Model 1, *COOH is adsorbed on the bimetallic bridge site of Zn/Zn catalyst due to the lower oxophilicity of Zn atom, while the higher O-affinity on Mn atom, *COOH is adsorbed on the Mn/Zn catalyst surface in the first type of bridge adsorption pattern, O is bonded to Mn atom, and C is bonded to Zn atom.
Furthermore, on the M–N–C catalysts, *COOH can also exhibit the trans-COOH (H-down) adsorption configuration in addition to the cis-COOH (H-up) configuration.42,43 Thus, we examine the adsorption configurations and adsorption energies of trans-COOH (H-down) on Ni/Fe–N6–Gra and Fe/Zn–N6–Gra. The calculation results are shown in Fig. S8 (ESI†), and the adsorption energies of cis-COOH (H-up) are more negative than that of trans-COOH (H-down). Therefore, the cis-COOH (H-up) adsorption configurations are used for all 63 bimetallic catalysts.
Then, we explore the electrocatalytic performance of all the homonuclear and heteronuclear M1/M2–N6–Gra (Model 1–Model 3) catalysts for CO2RR. To determine the contribution of the solvation effect to the free energies of the electrochemical CO2 reduction reaction, we perform solvation corrections for the adsorption energies of the reaction intermediates (*COOH and *CO) calculated in vacuum. Here, we simulate the explicit aqueous-phase environment and put 37 H2O molecules on the surfaces of Ni/Fe–N6–Gra (Model 2 and Model 3, 10 Å vacuum layer), and estimate the magnitude of solvation based on the differences between the adsorption energies with and without water.44Fig. 3 shows the water layer models on the surfaces of NiFe–N6–Gra-Model 2 and Model 3, as well as the configurations and adsorption energies of *COOH and *CO in the aqueous solution. In Ni/Fe–N6–Gra-Model 2, the calculated free energy correction values of *COOH and *CO is −0.27 eV and −0.09 eV, respectively. In Ni/Fe–N6–Gra-Model 3, the values are −0.26 eV and −0.13 eV, respectively. In agreement with previous estimations of −0.25 eV and −0.10 eV.45 For consistency and convenience of comparison, the average free energy correction values of *COOH and *CO on Model 2 and Model 3 are added to all 63 M1/M2–N6–Gra for solvent corrections. The free energy correction values on Model 1 are not calculated because the calculation results indicate that the Model 1 catalysts have poor CO2RR activity and high limiting potentials (See subsequent Fig. 4 and Table 1 for details). Therefore, we finally correct the adsorption energies of *COOH by −0.27 eV and *CO by −0.11 eV.
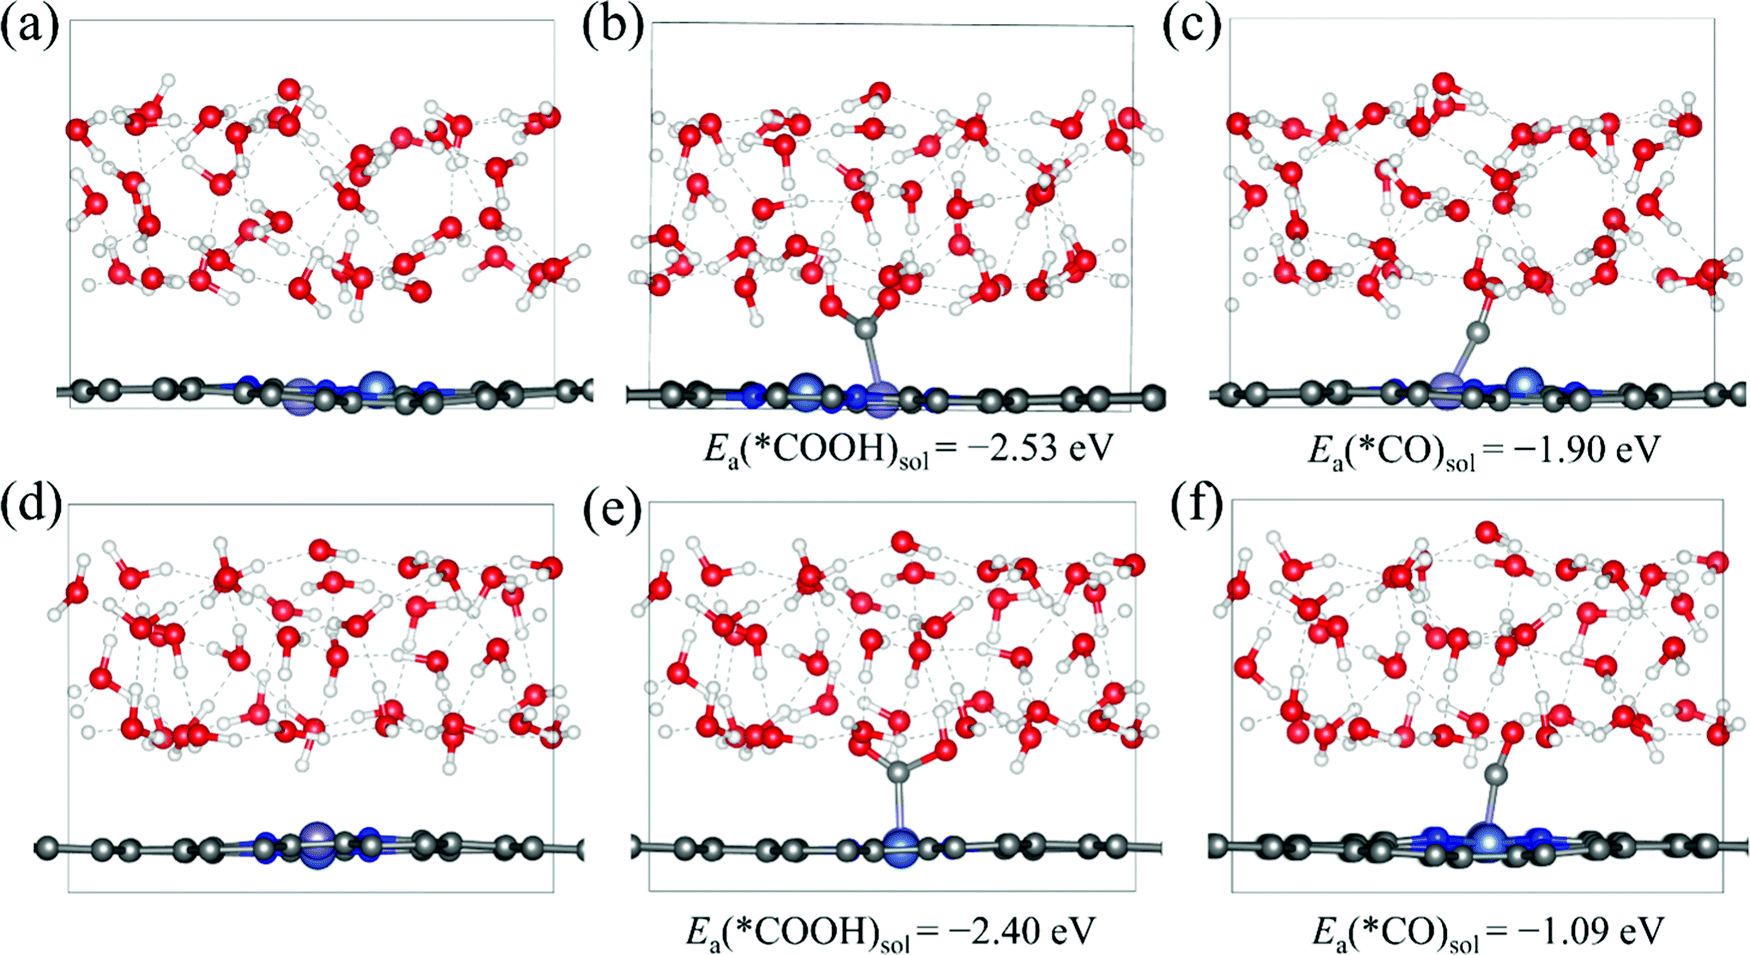 | ||
| Fig. 3 The explicit solvent models of the NiFe–N6–Gra (a) Model 2 and (d) Model 3 surface, *COOH and *CO configurations and adsorption energies at (b) and (c) water/Model 2 interface and (e) and (f) water/Model 3 interface. | ||
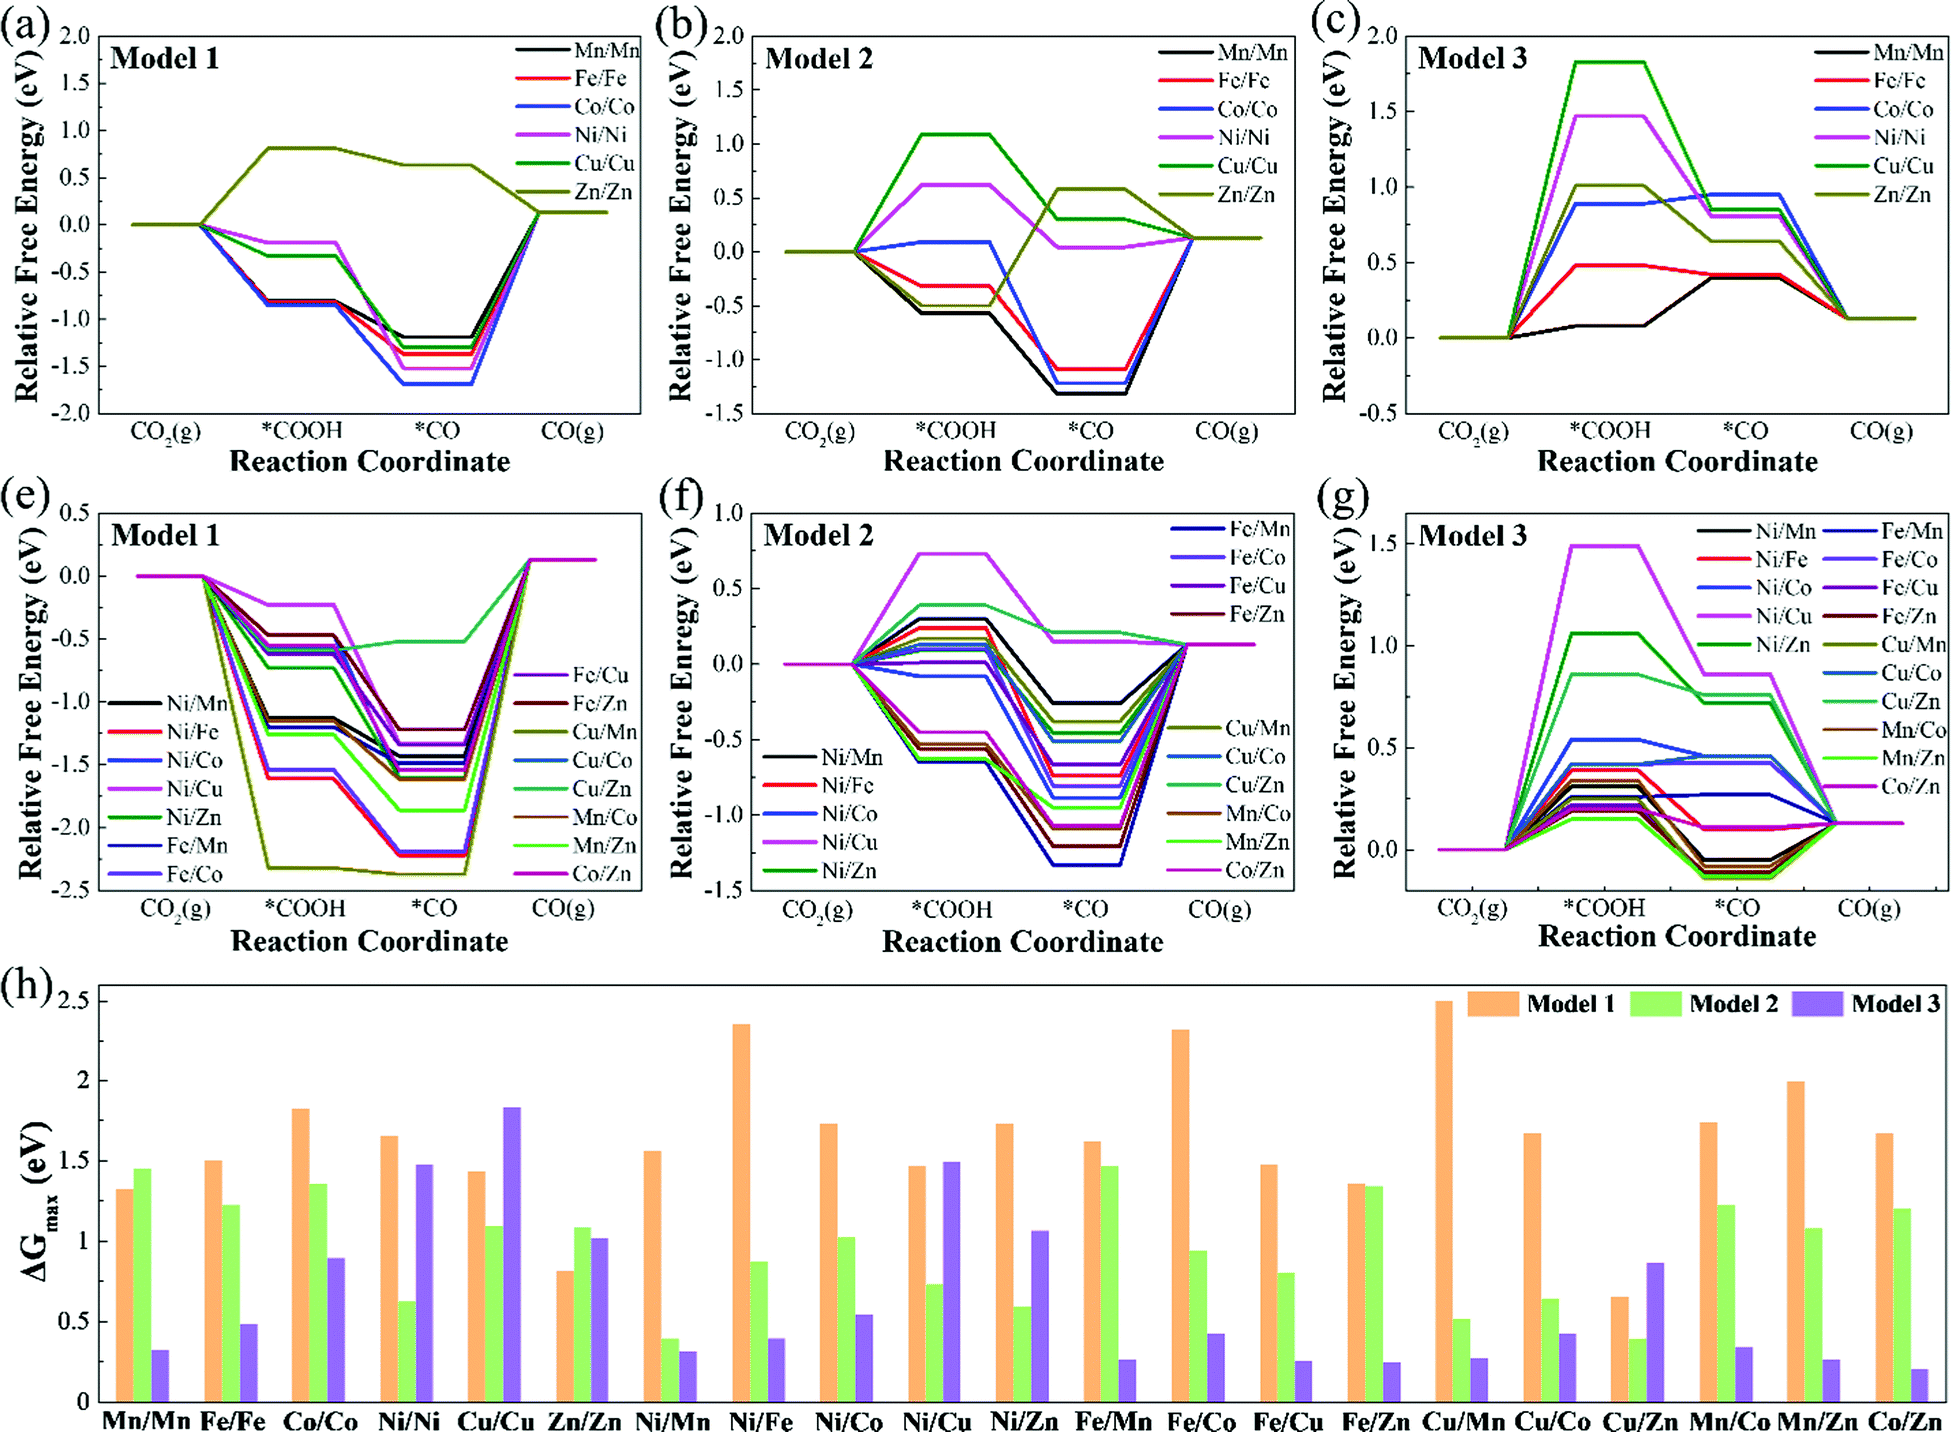 | ||
| Fig. 4 (a)–(g) Relative free energy profiles of CO2RR (for CO pathway) on Model 1, Model 2, and Model 3 at 0 V vs. RHE. (h) Summary of the maximum free energy change values (ΔGmax) for CO production on M1/M2–N6–Gra. | ||
| M1/M2–N6–Gra | Model 1 | Model 2 | Model 3 | |||
|---|---|---|---|---|---|---|
| U L (V) | Elementary steps | U L (V) | Elementary steps | U L (V) | Elementary steps | |
| Mn/Mn | −1.32 | *CO → CO | −1.45 | *CO → CO | −0.32 | *COOH → *CO |
| Fe/Fe | −1.50 | *CO → CO | −1.22 | *CO → CO | −0.48 | CO2 → *COOH |
| Co/Co | −1.82 | *CO → CO | −1.35 | *CO → CO | −0.89 | CO2 → *COOH |
| Ni/Ni | −1.65 | *CO → CO | −0.62 | CO2 → *COOH | −1.47 | CO2 → *COOH |
| Cu/Cu | −1.43 | *CO → CO | −1.09 | CO2 → *COOH | −1.83 | CO2 → *COOH |
| Zn/Zn | −0.81 | CO2 → *COOH | −1.08 | *COOH → *CO | −1.01 | CO2 → *COOH |
| Ni/Mn | −1.56 | *CO → CO | −0.39 | *CO → CO | −0.31 | CO2 → *COOH |
| Ni/Fe | −2.35 | *CO → CO | −0.87 | *CO → CO | −0.39 | CO2 → *COOH |
| Ni/Co | −1.73 | *CO → CO | −1.02 | *CO → CO | −0.54 | CO2 → *COOH |
| Ni/Cu | −1.46 | *CO → CO | −0.73 | CO2 → *COOH | −1.49 | CO2 → *COOH |
| Ni/Zn | −1.73 | *CO → CO | −0.59 | *CO → CO | −1.06 | CO2 → *COOH |
| Fe/Mn | −1.62 | *CO → CO | −1.46 | *CO → CO | −0.26 | CO2 → *COOH |
| Fe/Co | −2.32 | *CO → CO | −0.94 | *CO → CO | −0.42 | CO2 → *COOH |
| Fe/Cu | −1.47 | *CO → CO | −0.80 | *CO → CO | −0.25 | *CO → CO |
| Fe/Zn | −1.35 | *CO → CO | −1.34 | *CO → CO | −0.24 | *CO → CO |
| Cu/Mn | −2.50 | *CO → CO | −0.51 | *CO → CO | −0.27 | *CO → CO |
| Cu/Co | −1.67 | *CO → CO | −0.64 | *CO → CO | −0.42 | CO2 → *COOH |
| Cu/Zn | −0.65 | *CO → CO | −0.40 | CO2 → *COOH | −0.86 | CO2 → *COOH |
| Mn/Co | −1.74 | *CO → CO | −1.22 | *CO → CO | −0.34 | CO2 → *COOH |
| Mn/Zn | −1.99 | *CO → CO | −1.08 | *CO → CO | −0.26 | *CO → CO |
| Co/Zn | −1.67 | *CO → CO | −1.20 | *CO → CO | −0.20 | CO2 → *COOH |
Table S3 (ESI†) lists the Gibbs free energy changes (ΔG) of each elementary reaction step of the CO2RR. Fig. 4 displays the free energy diagrams and the maximum free energy change values (ΔGmax) of CO2RR at 0 V. As can be seen from Fig. 4(a)–(g), for Model 1, except for Zn/Zn–N6–Gra, the potential limiting step (PLS) of CO2RR is CO2 + H+ + e− → *COOH, and the other catalysts are all *CO → CO + *. For Model 2, the potential limiting steps of most catalysts are *CO → CO + *, except for Ni/Ni, Cu/Cu, Ni/Cu, and Cu/Zn–N6–Gra, which are CO2 + H+ + e− → *COOH, and Zn/Zn–N6–Gra is *COOH + H+ + e− → *CO + H2O. But for Model 3, the potential limiting steps of most catalysts are CO2 + H+ + e− → *COOH, except for Fe/Cu, Fe/Zn, Cu/Mn, Mn/Zn–N6–Gra, which are *CO → CO + *, and Mn/Mn–N6–Gra is *COOH + H+ + e− → *CO + H2O. This is caused by the significantly different adsorption strength of *COOH and *CO on Model 1, Model 2, and Model 3.
Fig. 4(h) summarizes the maximum free energy change values (ΔGmax) on M1/M2–N6–Gra along with the CO2 reduction to CO. The larger the ΔGmax value, the more heat the reaction absorbs, and the worse the CO2 reduction activity. For most M1/M2–N6–Gra (except Mn/Mn, Ni/Ni, Cu/Cu, Zn/Zn, Ni/Cu, Ni/Zn, and Cu/Zn–N6–Gra), as the coordination number of metal and nitrogen increases from 2 to 4 (Model 1–Model 3), the ΔGmax values greatly decrease and the CO2 reduction activity increases. For Ni/Ni, Cu/Cu, Ni/Cu, Ni/Zn, and Cu/Zn–N6–Gra, as the coordination number of metal and nitrogen increases from 2 to 4, the ΔGmax values show a trend of the first decrease and then increase, and the CO2 reduction activity first increases and then decreases. However, for Zn/Zn–N6–Gra, as the coordination number of metal and nitrogen increases, the ΔGmax values increase and the reduction activity decreases. And the ΔGmax values for the three models of Zn/Zn–N6–Gra are 0.81, 1.08, 1.01 eV, respectively, Zn/Zn–N6–Gra-Model 1 has the best reduction activity. Overall, we identify that Cu/Zn–N6–Gra-Model 1, Ni/Mn–N6–Gra-Model 2, and Co/Zn–N6–Gra-Model 3 have the best CO2 reduction activity on Model 1, Model 2, and Model 3 with ΔGmax values of 0.65, 0.39, and 0.20 eV, respectively. Particularly, among all the bimetallic catalysts we calculated, Co/Zn–N6–Gra-Model 3 exhibits the highest CO2 reduction activity.
Theoretically, the catalytic activity of the electrocatalysts is usually evaluated by the limiting potential (UL).38Table 1 lists the theoretical limiting potential values for 21 M1/M2–N6–Gra on the three models and the corresponding elementary reaction steps. In general, The CO2RR catalytic activity of Model 3 is obviously better than that of Model 1 and Model 2. Notably, most of the catalysts of Model 3 exhibit excellent activity for the reduction of CO2 to CO, and with low UL values of −0.20 – −0.54 V. Compared with Mn–N4–Gra (the calculated best catalytic activity and selectivity in M–N4–Gra, UL = −0.36 V, Fig. S9, ESI†), Mn/Mn, Ni/Mn, Fe/Mn, Fe/Cu, Fe/Zn, Cu/Mn, Mn/Co, Mn/Zn, and Co/Zn–N6–Gra-Model 3 have better catalytic activity. Especially, three systems, including Fe/Cu, Fe/Zn, and Co/Zn–N6–Gra-Model 3, the UL values of CO production are only −0.25, −0.24, and −0.20 eV, respectively.
It is noteworthy that, compared with homonuclear M1/M1–N6–Gra and M2/M2–N6–Gra, most heteronuclear M1/M2–N6–Gra have higher CO2RR catalytic activity than at least one of the homonuclear catalysts due to the synergistic effect of bimetals (Table 1). Fig. 5 demonstrates the limiting potential difference between 15 heteronuclear M1/M2–N6–Gra and their corresponding homonuclear M1/M1–N6–Gra, M2/M2–N6–Gra (UL(M1/M2) − UL(M/M)) on Model 1, Model 2, and Model 3. The positive (UL(M1/M2) − UL(M/M)) values correspond to the high CO2RR activity of heteronuclear catalysts. With the increase of coordination number between metal and nitrogen (Model 1–Model 3), the catalytic activity of heteronuclear catalysts is significantly improved, which is reflected in that (UL(M1/M2) − UL(M/M)) values of more heteronuclear catalysts are greater than zero and the values are more positive. For Model 1, only Cu/Zn has higher CO2RR activity than Cu/Cu and Zn/Zn. For Model 2, the CO2RR activity of most heteronuclear catalysts is higher than that of homonuclear catalysts. For Model 3, except for Ni/Cu, Ni/Zn, Mn/Co, the CO2RR activity is only higher than one of the homonuclear catalysts, and the catalytic activities of the other heteronuclear catalysts are higher than those of the two homonuclear catalysts. Overall, the increase of coordination number between metal and nitrogen effectively promotes the synergistic effect of heteronuclear bimetals, which may be due to the different adsorption energies and adsorption configurations of *COOH and *CO on the three models. The adsorption energies of *COOH and *CO of Model 1 catalysts are relatively large (Table S4, ESI†), and most of the limiting steps are CO desorption (Table 1). *COOH are mainly adsorbed on the bimetallic bridge site with C and O as binding sites, *CO are mainly adsorbed on the bimetallic bridge site (Fig. S5, ESI†). The synergistic effect of bimetals makes some heteronuclear catalysts have larger adsorption energies of *COOH and *CO (Ni/Fe, Ni/Zn, Fe/Mn, Fe/Co, Cu/Mn, Mn/Zn–N6–Gra-Model 1), while the *CO adsorption energies of some catalysts are weakened, but CO is still difficult to desorb. For Cu/Zn, the synergistic effect of Cu and Zn atoms makes the adsorption energy of *COOH greater than Zn/Zn and Cu/Cu, while the adsorption energy of *CO is weaker than Cu/Cu (the limiting step of Cu/Cu is CO desorption, and Zn/Zn is CO2 activation), CO2 can be easily activated to *COOH, and *CO is also easier to desorb. The adsorption energies of *COOH and *CO of Model 3 are relatively small, *COOH and *CO are mainly adsorbed on the metal top site. The synergistic effect of bimetals makes the heteronuclear catalysts have moderate *COOH and *CO adsorption energies, and CO2 activation and CO desorption are easier. The *COOH and *CO adsorption energies of Model 2 are between Model 1 and Model 3, the adsorption configurations of bridge site and metal top site are all existed, and the synergistic effect of bimetals are also between Model 1 and Model 3.
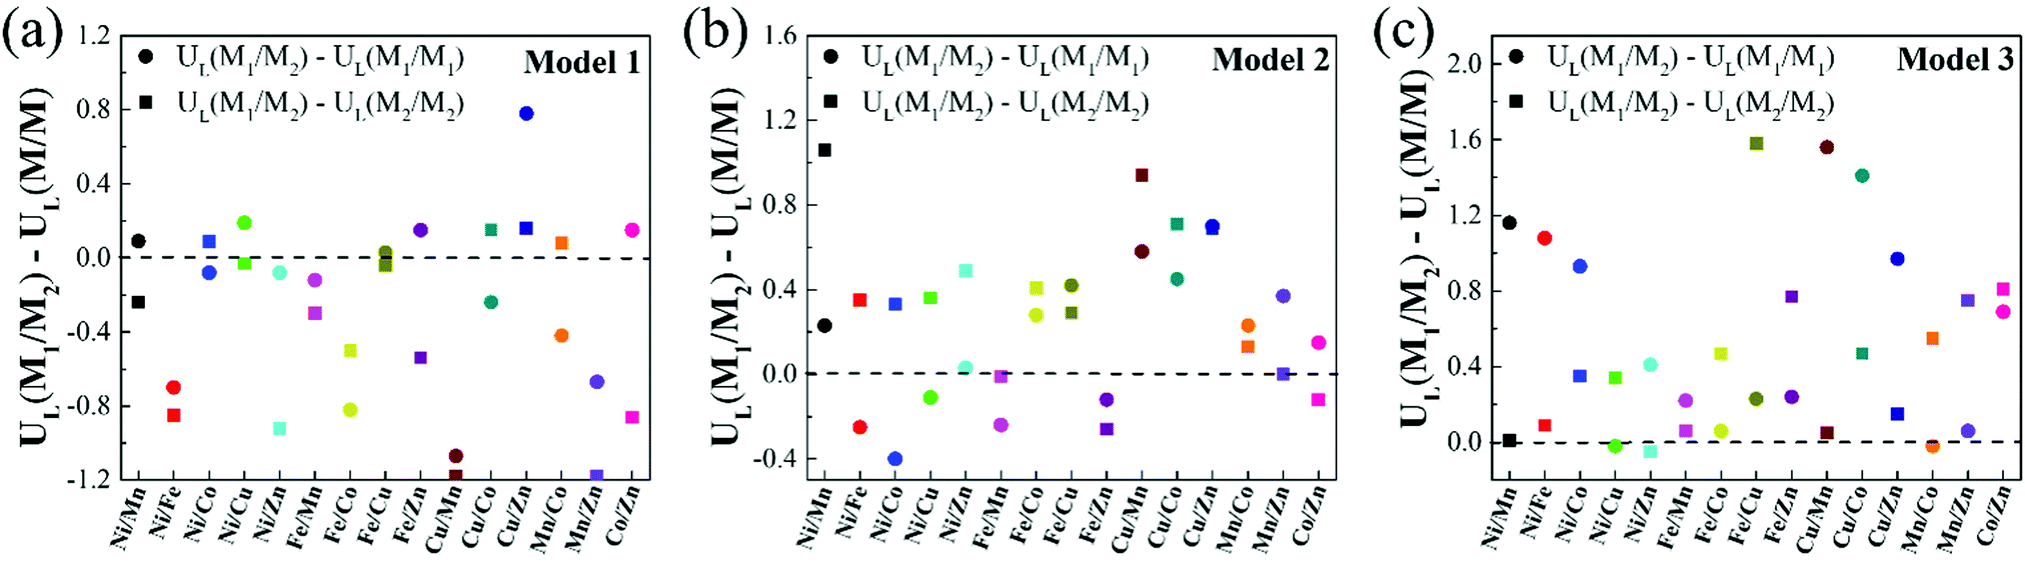 | ||
| Fig. 5 (a)–(c) The limiting potential difference between heteronuclear M1/M2–N6–Gra and homonuclear M/M–N6–Gra (M1/M1–N6–Gra, M2/M2–N6–gra) for Model 1, Model 2 and Model 3. (UL(M1/M2) − UL(M/M)) > 0 means that the catalytic activity of heteronuclear M1/M2–N6–Gra catalysts are higher than the homonuclear M/M–N6–Gra. | ||
3.3 Scaling relationship and volcano curve
Investigating the relationship between the adsorption free energies of reaction intermediates and catalytic activity is of great significance for searching for more effective catalysts. For the process of CO2 reduction to CO, *COOH and *CO are the most important reaction intermediates for CO2 activation and CO production. Therefore, in this study, we calculate the adsorption free energies of *COOH and *CO (Table S5, ESI†), and investigate the relationship between the Gibbs adsorption free energies of *COOH and *CO.Fig. 6(a) shows there is a roughly linear scaling relationship between ΔG*COOH and ΔG*CO, and the fitting coefficient (R2) is 0.80. Our result is in line with previous research conclusions.46 In addition, we find that most catalysts in Model 1 are located in the bottom left region of Fig. 6(a), with strong *COOH and *CO adsorption strength; and the catalysts in Model 2 are located in the middle-upper region with moderate *COOH and *CO adsorption strength; while the catalysts in Model 3 are located in the upper right region with moderate and weak *COOH and *CO adsorption strength. The larger the *COOH adsorption free energy, the smaller the free energy change value required for CO2 activation. The greater the *CO adsorption free energy, the harder the CO desorption. These results are consistent with the previous conclusion that we calculated that the catalytic activity of CO2RR in Model 3 is significantly better than that in Model 1 and Model 2.
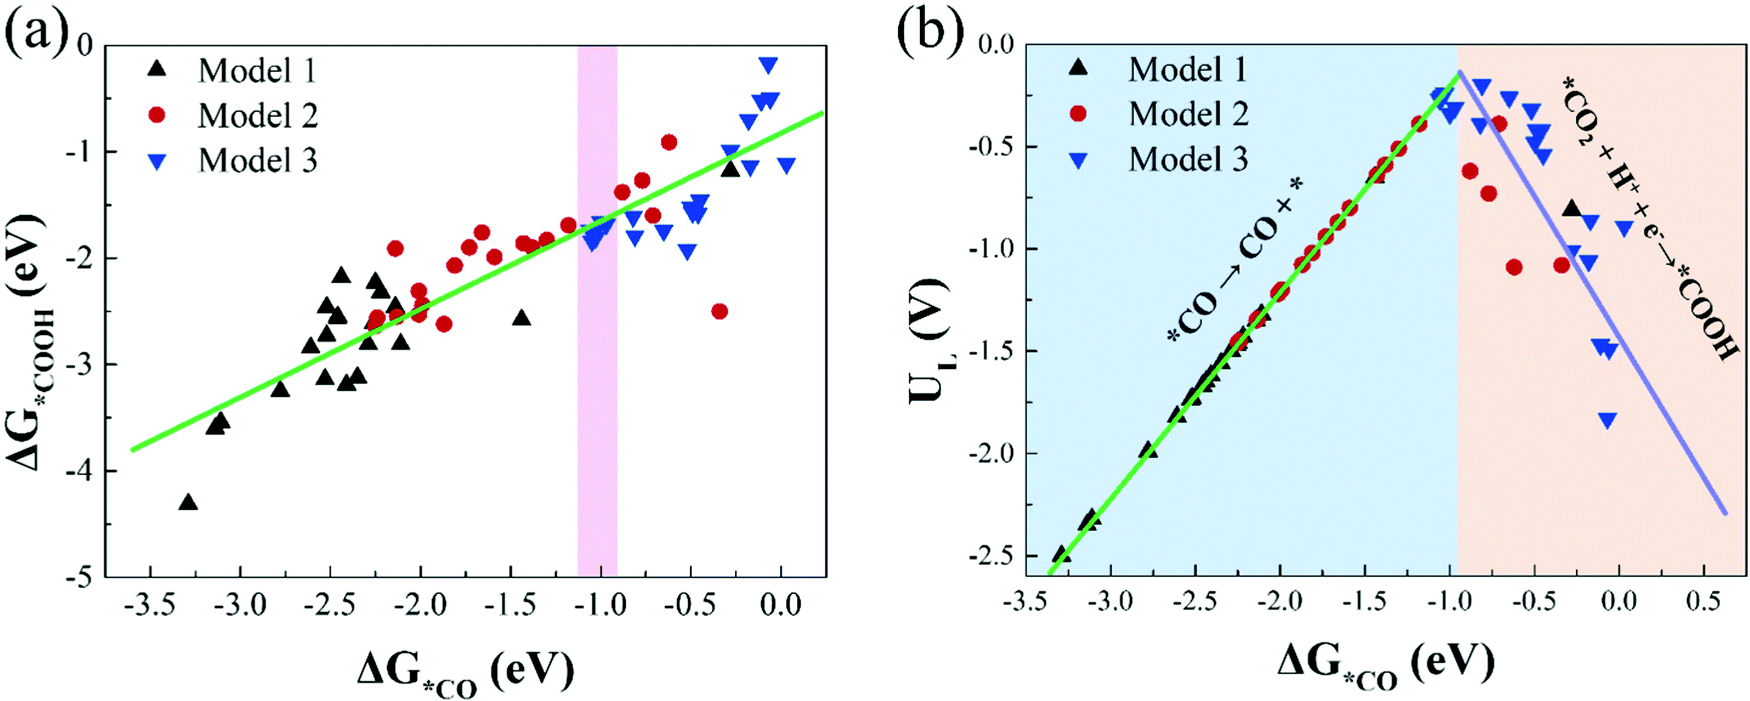 | ||
| Fig. 6 (a) The scaling relations of the adsorption free energies of *COOH (ΔG*COOH) and *CO (ΔG*CO), (b) the volcano plot between the limiting potentials (UL) and ΔG*CO. | ||
Moreover, based on the scaling relationship, we construct the volcano plot between UL and ΔG*CO of CO2RR on all M1/M2–N6–Gra catalysts, as displayed in Fig. 6(b). The left side of Fig. 6(b) exhibits strong *CO adsorption, the larger adsorption free energy of CO molecule makes it difficult to desorb, and the potential limiting step is *CO → CO + *; while the right side of Fig. 6(b) exhibits weak *CO adsorption, the smaller adsorption free energy of CO is more conducive to its desorption from the catalyst surface, but too weak CO binding will hinder the formation of *COOH, changing the PLS to CO2 + H+ + e− → *COOH, and limiting the reaction activity. Notably, catalysts located near the top of the volcano have moderate adsorption strengths of *CO and *COOH, and exhibit favorable CO2RR catalytic activity.
3.4 Competition between CO2RR and HER
In addition to having high activity, an ideal CO2RR catalyst should also be able to effectively inhibit the competitive side reaction—hydrogen evolution reaction (HER),47,48 which could greatly affect the Faraday efficiency of CO production. Thus, we further study the HER catalytic activity of 21 catalysts on Model 2 and Model 3, and the results are shown in Fig. 7(a) and (c). With regard to Model 1, the previous calculation results have shown that catalysts on Model 1 have poor CO2RR activity, and the limiting potentials of most catalysts are above −1.00 eV (Table 1). The optimal Cu/Zn–N6–Gra-Model 1 catalyst has a limiting potential of −0.65 eV, which is significantly lower than Mn–N4–Gra (UL = −0.36 V). Therefore, we do not consider the calculation of HER performance on Model 1.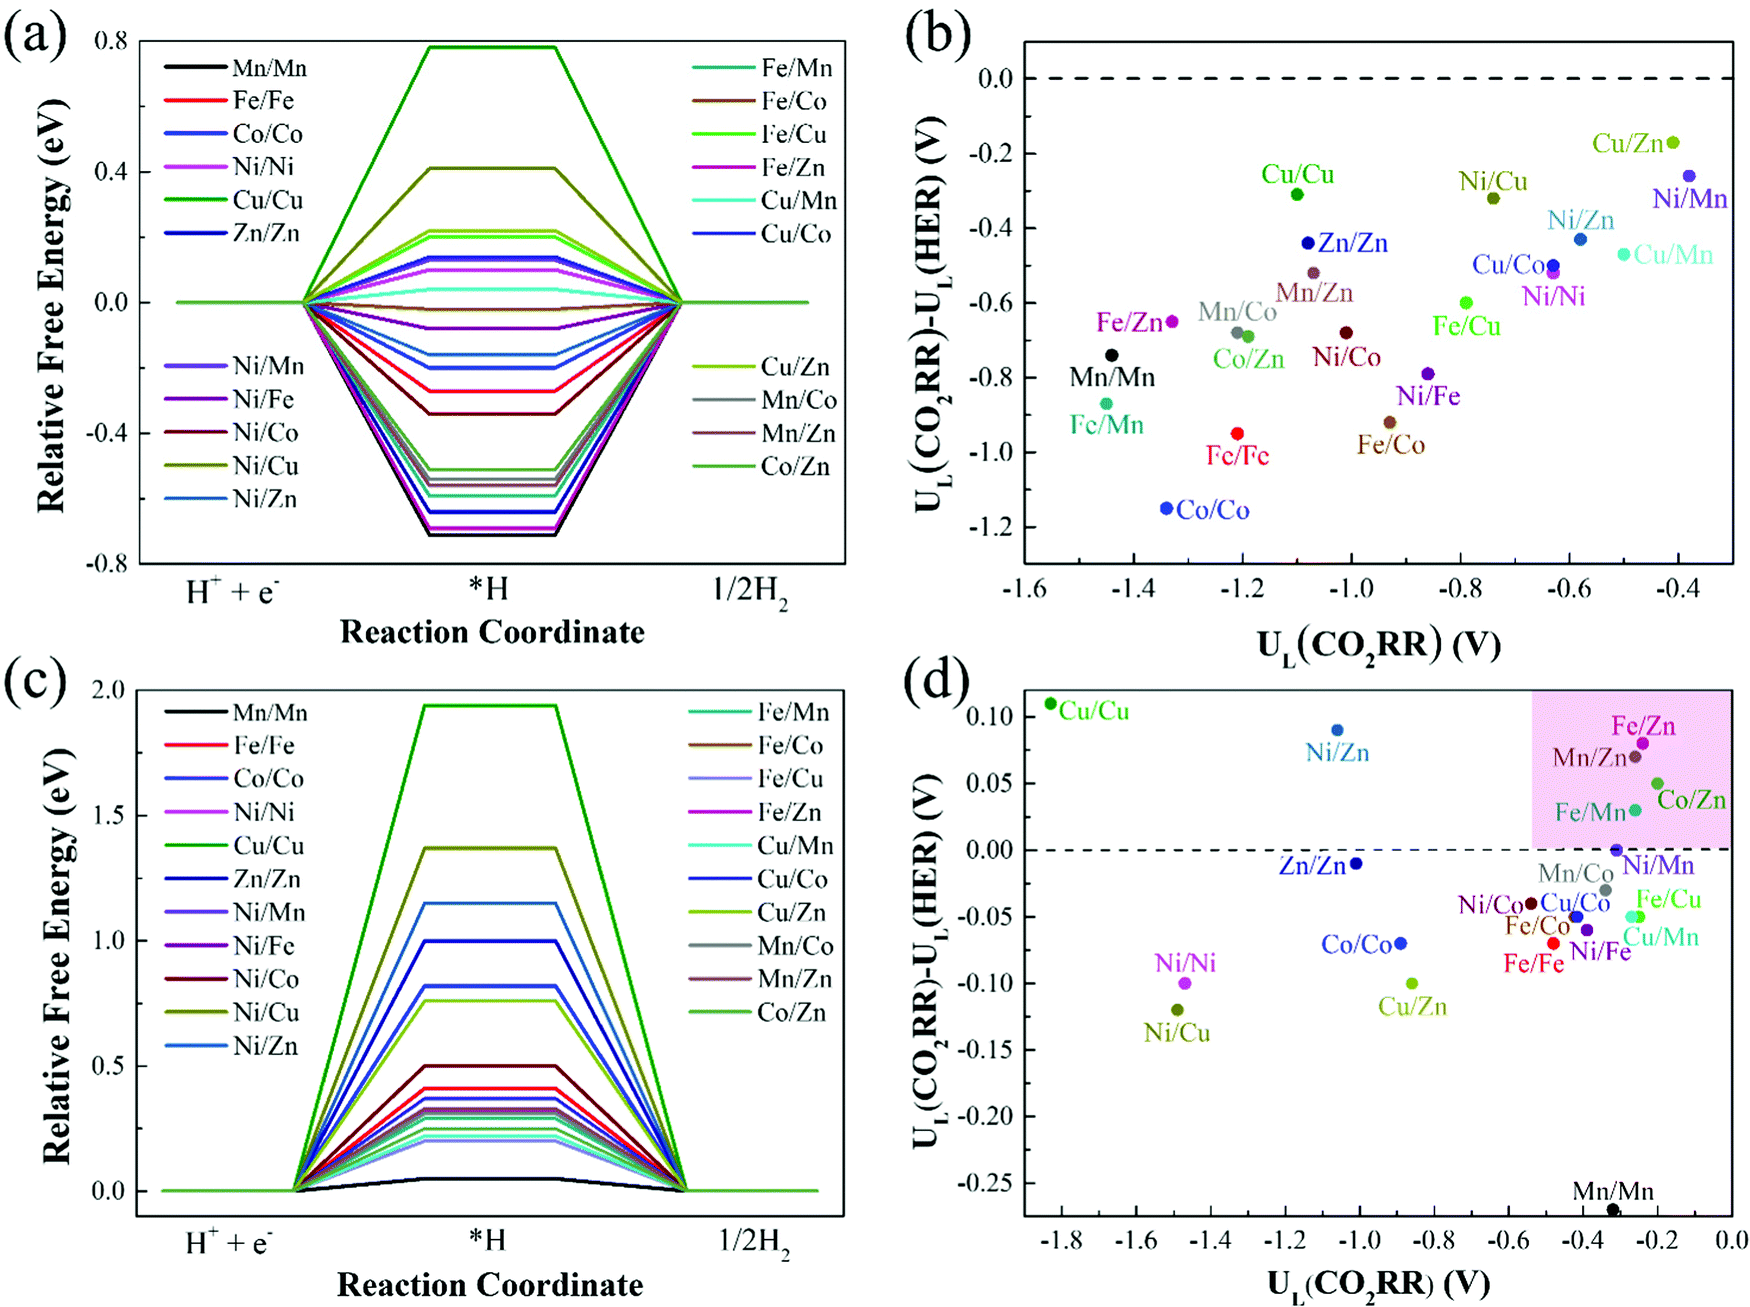 | ||
| Fig. 7 Relative free energy profiles for HER on (a) Model 2 and (c) Model 3, and limiting potential difference between CO2RR and HER for (b) Model 2 and (d) Model 3. | ||
The catalysts with ΔG*H values that deviate from zero are considered to be the appropriate CO2RR electrocatalysts.49,50 Our calculation results show that the adsorption free energies of H* species(ΔG*H) on the catalysts of Model 2 range from −0.71 (Mn/Mn-Model 2) to 0.78 eV (Cu/Cu-Model 2), Fe/Co (ΔG*H = −0.02 eV) and Cu/Mn (ΔG*H = 0.04 eV) are the best HER electrocatalysts. The ΔG*H on the catalysts of Model 3 ranges from 0.20 (Fe/Cu-Model 3) to 1.94 eV (Cu/Cu-Model 3), and Mn/Mn (ΔG*H = 0.05 eV) is the best HER electrocatalyst. More interestingly, ΔG*H values on the catalysts of Model 3 are all positive, while that on the catalysts of Model 2 are half positive and generally negative. This is caused by the different adsorption capacities of different bimetallic for *H. The coordination number of the metal on Model 3 is high, *H is difficult to adsorb on the catalyst surface, and usually requires additional energy. The lower coordination number of Model 2 makes the catalyst can effectively bind H. In addition, for Cu/M2–N6–Gra-Model 2, the fully-filled d-orbital of Cu and the less charge on the metal make the adsorption of *H weak, resulting in a positive value of ΔG*H.
To investigate the catalytic selectivity of CO2RR and HER on the active sites, we calculate the limiting potentials of HER on these catalysts (Model 2 and Model 3) and compare them with the limiting potentials of CO2RR (UL(CO2RR) – UL(HER)). The larger the (UL(CO2RR) – UL(HER)) value, the higher the selectivity of CO2RR.51,52Fig. 7(b) shows the (UL(CO2RR) − UL(HER)) vs. UL(CO2RR) of the Model 2 catalysts. The (UL(CO2RR) − UL(HER)) values of the catalysts are all negative, demonstrating poor selectivity of CO2RR. For the catalysts of Model 3, as shown in Fig. 7(d), the catalysts in the top right region (pink area) represent excellent CO2RR catalytic activity and selectivity. Fe/Zn, Mn/Zn, Co/Zn, and Fe/Mn–N6–Gra-Model 3 are promising CO2RR catalysts with high activity and selectivity. In addition, the high selectivity also requires rapid desorption of CO to prevent further hydrogenation.53 Therefore, we calculate the free energy change values from *CO to *CHO/*COH on the four selected catalysts, and the results are shown in Fig. S10 (ESI†). The ΔG values of *CO → *CHO/*COH on Fe/Zn, Mn/Zn, Co/Zn, and Fe/Mn–N6–Gra-Model 3 are 0.46/2.06, 0.49/1.80, 0.12/1.86, and 0.63/1.99 eV, respectively, which are larger than the corresponding free energies of *CO → CO + * (0.24, 0.26, 0.02, and −0.14 eV). Therefore, the possibility of further hydrogenation of CO on these four catalysts is very small.
3.5 Origin of catalytic activity on M1/M2–N6–Gra systems
To deeply understand the origin of different catalytic activities of M1/M2–N6–Gra materials, we have studied the electronic structures of several promising CO2RR electrocatalysts (Fe/Zn, Mn/Zn, Co/Zn, and Fe/Mn–N6–Gra-Model 3). For pure M1/M2–N6–Gra surface, the charge density difference and Bader charge analysis (Fig. S11, ESI†) demonstrate that there is an electron transfer between the metal atoms and the graphene substrate. In Fe/Zn, Mn/Zn, and Co/Zn–N6–Gra-Model 3, 1.14 e− is transferred from the Zn atom to the substrate, while 1.05 e−, 1.28 e−, and 0.89 e− are transferred from another metal atom (Fe, Mn, and Co) to the substrate, respectively. In Fe/Mn–N6–Gra, 0.87 e− and 1.21 e− are transferred from Fe and Mn atoms to the substrate, respectively. This indicates that the metal atoms are positively charged, which can effectively activate CO2 molecules, and promote the CO2RR process.For Fe/Zn and Mn/Zn–N6–Gra-Model 3 systems, CO desorption is the limiting step, and for Co/Zn and Fe/Mn–N6–Gra-Model 3, CO2 activation is the limiting step. To gain further insights into the difference in catalytic performance, the partial density of states (PDOS) diagrams before and after *CO adsorption on Fe/Zn and Mn/Zn–N6–Gra-Model 3, and before and after *COOH adsorption on Co/Zn and Fe/Mn–N6–Gra-Model 3 are further investigated. According to previous reports,54,55 the closer the d-band center is to the Fermi level, the higher the electron occupation of the bonding state is, and the stronger the adsorption strength of the adsorbed molecules on the catalyst surface is. As shown in Fig. 8(a) and (b), before *CO adsorption, the d-band center of Mn/Zn (εd(Mn), −0.76 eV) is closer to the Fermi level than Fe/Zn (εd(Fe), −1.55 eV), resulting in the higher CO binding strength of Mn/Zn, and CO is more difficult to desorb. Similarly, as can be seen in Fig. 8(c) and (d), before *COOH adsorption, the d-band center of Co/Zn (εd(Co), −1.18 eV) is closer to the Fermi level than Fe/Mn (εd(Fe), −1.42 eV). Co/Zn has higher *COOH binding strength, and CO2 is more easily converted to *COOH. This is consistent with the calculated result in Fig. 4(g). After *CO and *COOH adsorption, the 3d orbital of metals is hybridized with the 2p orbital of C. To further reveal the binding strength of the metal—C bond, the crystal orbital Hamilton population (COHP) analysis is performed.56–59 The more negative the ICOHP value (band states integrate to Fermi level), the stronger the bond between the metal and C atom. From Fig. 8(a)–(d), Mn/Zn (−4.71) has a more negative ICOHP value than Fe/Zn (−3.18), indicating that the binding strength of C and Mn is stronger than that of Fe. Co/Zn (−2.52) has a more negative ICOHP value than Fe/Mn (−2.15), indicating that the binding strength of C and Co is stronger than that of Fe. This is also consistent with the distances between the *CO, *COOH species and their corresponding catalysts (Fe/Zn is 1.721 Å, Mn/Zn is 1.765 Å, Co/Zn is 1.886 Å, and Fe/Mn is 1.882 Å, Tables S6 and S7, ESI†).
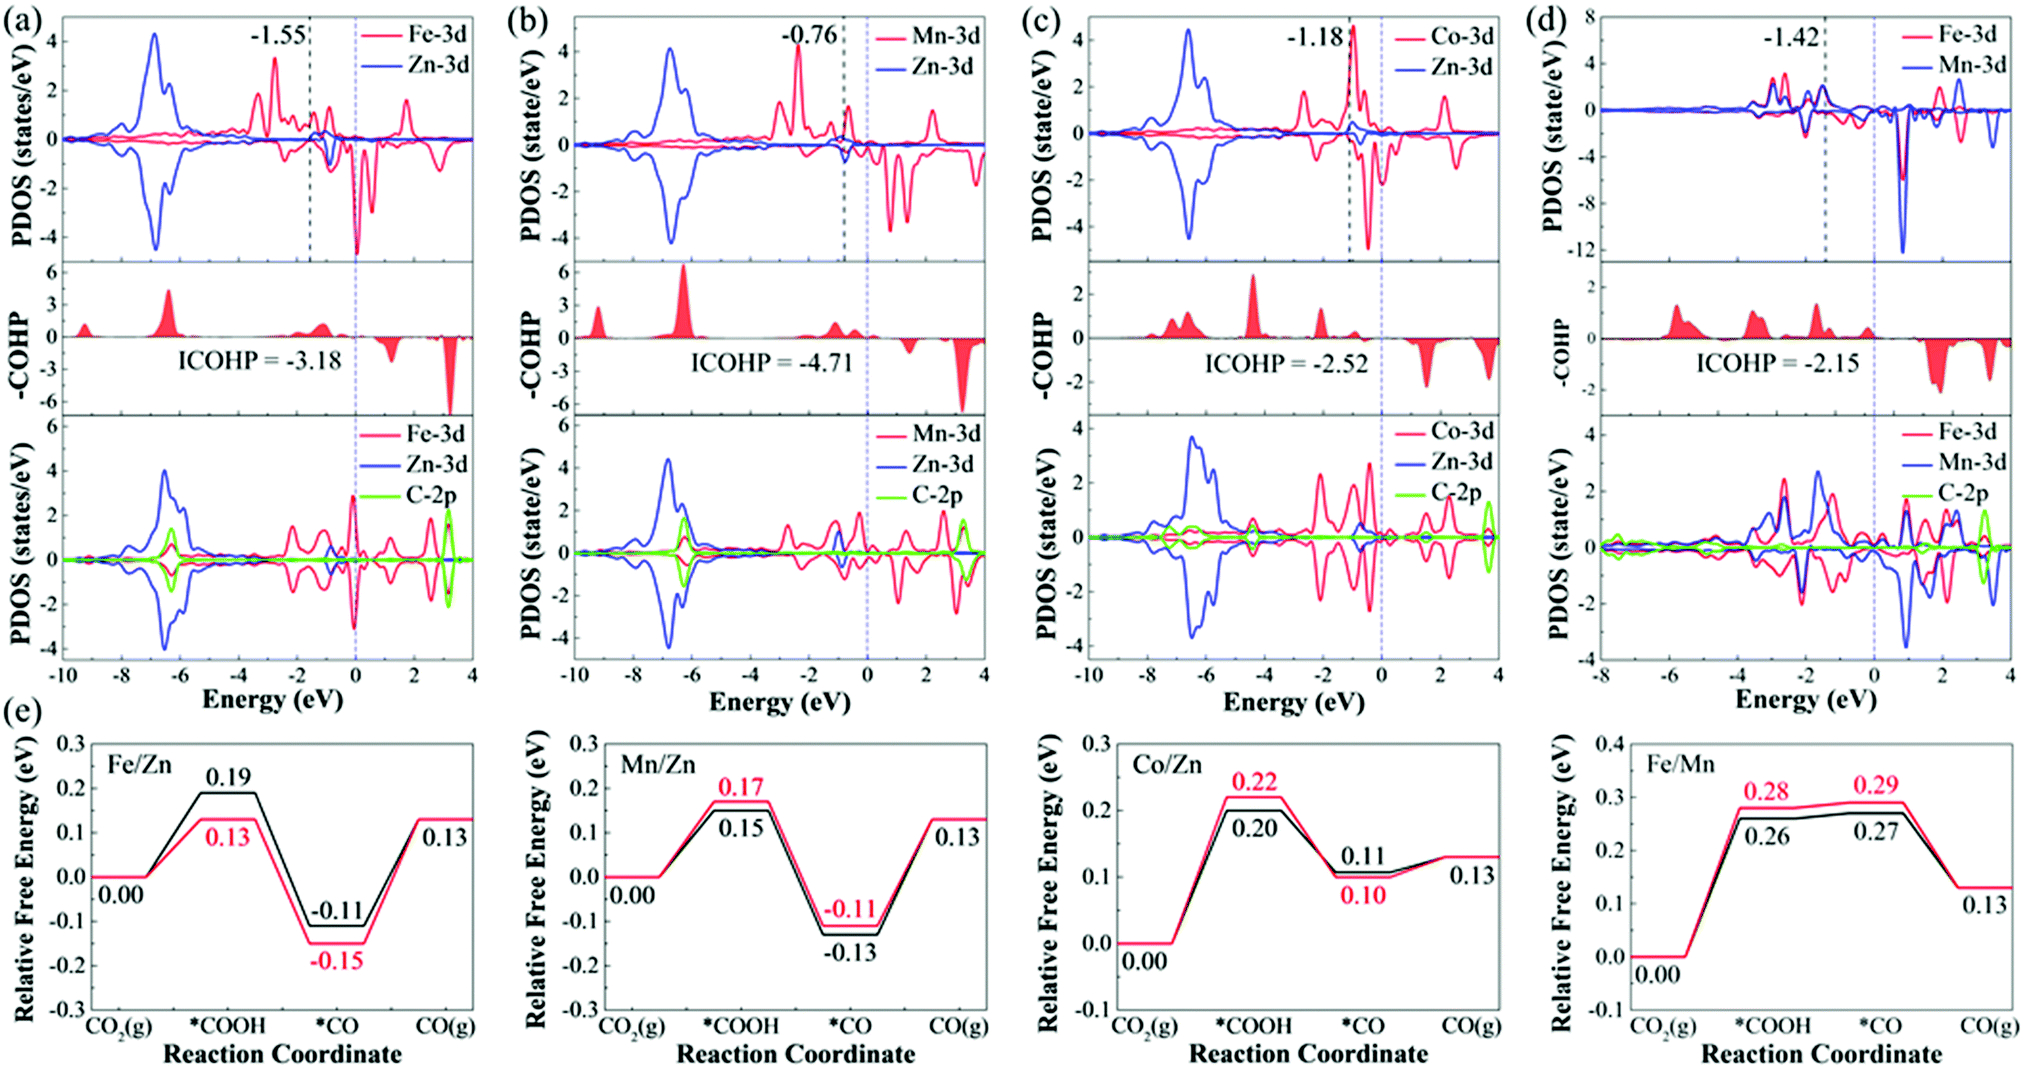 | ||
| Fig. 8 The PDOS of (a) Fe/Zn and (b) Mn/Zn–N6–Gra-Model 3 before and after *CO adsorption, (c) Co/Zn and (d) Fe/Mn–N6–Gra-Model 3 before and after *COOH adsorption. The blue dotted lines represent the Fermi level. The black dotted lines represent the d-band center. (e) Comparison of CO2RR pathways on Fe/Zn, Mn/Zn, Co/Zn, and Fe/Mn–N6–Gra-Model 3 by using the default magnetic configuration values of VASP 5.4.4 software (black lines) and magnetic coupling method (red lines). | ||
Similarly, taking Fe/Zn–N6–Gra as an example, we study the origin of different catalytic behaviors of heteronuclear bimetallic catalysts. For Fe/Fe–N6–Gra, the d-band center is close to the Fermi level (−1.53 eV, Table S9, ESI†), and the interaction between *COOH/*CO and the Fe/Fe–N6–Gra surface is relatively strong, resulting in easy activation of CO2 to *COOH. For Zn/Zn–N6–Gra, the d-band center is far away from the Fermi level (−5.86 eV), and the interaction between *COOH/*CO and the Zn/Zn–N6–Gra surface is relatively weak, making CO easy to desorb. Due to the synergistic effect of Fe and Zn atoms, the interaction between *COOH/*CO and Fe/Zn–N6–Gra surface is stronger than Fe/Fe and Zn/Zn–N6–Gra (the adsorption energy of *COOH/*CO and Fe/Zn surface is greater than that of Fe/Fe and Zn/Zn), but it makes *COOH and *CO have moderate adsorption strength, which promotes the activation of CO2 to *COOH, while CO desorption is slightly difficult, and CO desorption is the limiting step. Therefore, the Fe/Zn–N6–Gra catalyst shows the highest CO2RR catalytic performance compared with Fe/Fe and Zn/Zn–N6–Gra.
In addition, the magnetic coupling between the two metal atoms in bimetallic center catalysts also has an effect on the catalytic performance,60 therefore, we calculate the CO2RR pathways under the magnetic coupling, as displayed in Fig. 8(e). Although the limiting potential values calculated after considering the magnetic coupling are very close to the values calculated using the default magnetic configuration values (spin-polarized configuration) of VASP 5.4.4 software (FeZn, −0.28/−0.24 V; MnZn, −0.24/−0.26 V; CoZn, −0.22/−0.20 V; FeMn, −0.28/−0.26 V), but there is still a certain difference in energy, and magnetic coupling is an issue we need to pay attention to in our subsequent work.
4. Conclusion
In summary, by using first-principles calculations, we have comparatively studied the CO2RR catalytic performance of M1/M2–N6–Gra with different coordination environments of active sites. Our results show that: (1) the formation energies of M1/M2–N6–Gra are more negative as the increase of metal and N coordination number (2–4), and M1/M2–N6–Gra-Model 3 have the highest stability. (2) The reaction thermodynamics analysis indicates that from Model 1 to Model 3, the adsorption configurations of *COOH on M1/M2–N6–Gra have changed from the bridge adsorption to the metal top adsorption. Most low-coordinated catalysts have strong adsorption capacity for *COOH and *CO, CO desorption is difficult, and the PLS step is the CO desorption (*CO → CO(g) + *). While most high-coordinated catalysts have weak adsorption of *COOH and *CO, CO2 activation are difficult, and the PLS step is CO2 + H+ + e− → *COOH. The catalysts with moderate adsorption strength of *CO and *COOH are located on the top of the (ΔG*CO – UL) volcano and are conducive to CO generation. (3) Due to the synergistic effect between the two metals, most heteronuclear M1/M2–N6–Gra have better CO2RR catalytic activity than homonuclear catalysts, and the synergy increases with the increase of coordination number. (4) In all M1/M2–N6–Gra systems, Co/Zn, Fe/Zn, Mn/Zn, and Fe/Mn–N6–Gra-Model 3 (bonding with four N atoms) are the most active and selective catalysts for reducing CO2 to CO with low limiting potentials (−0.20, −0.24, −0.26, and −0.26 V) and obvious inhibitory effect on HER. Therefore, adjusting the coordination environment of the active sites can effectively improve the catalytic performance, which will provide useful guidance for future design and development of efficient CO2 electroreduction catalysts.Conflicts of interest
There are no conflicts to declare.Acknowledgements
This work was supported by the National Natural Science Foundation of China (No. 22173003 and 91741104), and the National Key R&D Program of China (2021YFC2103501).References
- X. Li, J. Yu, M. Jaroniec and X. Chen, Chem. Rev., 2019, 119, 3962–4179 CrossRef CAS PubMed.
- S. Liang, L. Huang, Y. Gao, Q. Wang and B. Liu, Adv. Sci., 2021, 8, 2102886 CrossRef CAS PubMed.
- Y. Zhu, J. Sokolowski, X. Song, Y. He, Y. Mei and G. Wu, Adv. Energy Mater., 2019, 10, 1902844 CrossRef.
- A. Liu, M. Gao, X. Ren, F. Meng, Y. Yang, L. Gao, Q. Yang and T. Ma, J. Mater. Chem. A, 2020, 8, 3541–3562 RSC.
- Q. Zhang and J. Guan, Adv. Funct. Mater., 2020, 30, 2000768 CrossRef CAS.
- J. Fu, K. Liu, H. Li, J. Hu and M. Liu, Environ. Chem. Lett., 2022, 20, 243–262 CrossRef CAS.
- D. D. Zhu, J. L. Liu and S. Z. Qiao, Adv. Mater., 2016, 28, 3423–3452 CrossRef CAS PubMed.
- B. Khezri, A. C. Fisher and M. Pumera, J. Mater. Chem. A, 2017, 5, 8230–8246 RSC.
- R. Kortlever, J. Shen, K. J. P. Schouten, F. Calle-Vallejo and M. T. M. Koper, J. Phys. Chem. Lett., 2015, 6, 4073–4082 CrossRef CAS PubMed.
- A. S. Varela, N. R. Sahraie, J. Steinberg, W. Ju, H. S. Oh and P. Strasser, Angew. Chem., Int. Ed., 2015, 54, 10758–10762 CrossRef CAS PubMed.
- Y. Chen, C. W. Li and M. W. Kanan, J. Am. Chem. Soc., 2012, 134, 19969–19972 CrossRef CAS PubMed.
- R. Reske, H. Mistry, F. Behafarid, B. R. Cuenya and P. Strasser, J. Am. Chem. Soc., 2014, 136, 6978–6986 CrossRef CAS PubMed.
- S. Liu, H. Tao, L. Zeng, Q. Liu and Z. Xu, J. Am. Chem. Soc., 2017, 139, 2160–2163 CrossRef CAS PubMed.
- S. Mezzavilla, S. Horch, I. E. L. Stephens, B. Seger and I. Chorkendorff, Angew. Chem., Int. Ed., 2019, 58, 3774–3778 CrossRef CAS PubMed.
- D. Sun, X. Xu, Y. Qin, S. P. Jiang and Z. Shao, ChemSusChem, 2020, 13, 39–58 CrossRef CAS PubMed.
- A. Rendón-Calle, Q. H. Low, S. H. L. Hong, S. Builes, B. S. Yeo and F. Calle-Vallejo, Appl. Catal., B, 2021, 285, 119776 CrossRef.
- X. Wu, Y. Guo, Z. Sun, F. Xie, D. Guan, J. Dai, F. Yu, Z. Hu, Y.-C. Huang, C.-W. Pao, J.-L. Chen, W. Zhou and Z. Shao, Nat. Commun., 2021, 12, 660 CrossRef CAS PubMed.
- C. Zhang, S. Yang, J. Wu, M. Liu, S. Yazdi, M. Ren, J. Sha, J. Zhong, K. Nie, A. S. Jalilov, Z. Li, H. Li, B. I. Yakobson, Q. Wu, E. Ringe, H. Xu, P. M. Ajayan and J. M. Tour, Adv. Energy Mater., 2018, 8, 1703487 CrossRef.
- C. Lei, Y. Wang, Y. Hou, L. Pan, Y. Jian, Z. Tao, X. Zhuang, M. Chen, B. Yang and L. Lei, Energy Environ. Sci., 2019, 12, 149–156 RSC.
- X. Wang, Z. Chen, X. Zhao, T. Yao, W. Chen, R. You, C. Zhao, G. Wu, J. Wang and W. Huang, Angew. Chem., Int. Ed., 2018, 57, 1944–1948 CrossRef CAS PubMed.
- Y. Pan, R. Lin, Y. Chen, S. Liu, W. Zhu, X. Cao, W. Chen, K. Wu, W.-C. Cheong, Y. Wang, L. Zheng, J. Luo, Y. Lin, Y. Liu, C. Liu, J. Li, Q. Lu, X. Chen, D. Wang, Q. Peng, C. Chen and Y. Li, J. Am. Chem. Soc., 2018, 140, 4218–4221 CrossRef CAS PubMed.
- W. Ren, X. Tan, W. Yang, C. Jia, S. Xu, K. Wang, S. C. Smith and C. Zhao, Angew. Chem., Int. Ed., 2019, 58, 6972–6976 CrossRef CAS PubMed.
- C. Ding, C. Feng, Y. Mei, F. Liu, H. Wang, M. Dupuis and C. Li, Appl. Catal., B, 2020, 268, 118391 CrossRef CAS.
- F. Wang, H. Xie, T. Liu, Y. Wu and B. Chen, Appl. Energy, 2020, 269, 115029 CrossRef CAS.
- W. Guo, J. Bi, Q. Zhu, J. Ma, G. Yang, H. Wu, X. Sun and B. Han, ACS Sustainable Chem. Eng., 2020, 8, 12561–12567 CrossRef CAS.
- Z. Chen, X. Liao, C. Sun, K. Zhao, D. Ye, J. Li, G. Wu, J. Fang, H. Zhao and J. Zhang, Appl. Catal., B, 2021, 288, 120021 CrossRef CAS.
- M. Xiao, Y. Chen, J. Zhu, H. Zhang, X. Zhao, L. Gao, X. Wang, J. Zhao, J. Ge, Z. Jiang, S. Chen, C. Liu and W. Xing, J. Am. Chem. Soc., 2019, 141, 17763–17770 CrossRef CAS PubMed.
- G. Kresse and J. Hafner, Phys. Rev. B: Condens. Matter Mater. Phys., 1994, 49, 14251–14269 CrossRef CAS PubMed.
- G. Kresse and J. Furthmüller, Phys. Rev. B: Condens. Matter Mater. Phys., 1996, 54, 11169–11186 CrossRef CAS PubMed.
- G. Kresse and J. Furthmüller, Comput. Mater. Sci., 1996, 6, 15–50 CrossRef CAS.
- J. P. Perdew, K. Burke and M. Ernzerhof, Phys. Rev. Lett., 1996, 77, 3865–3868 CrossRef CAS PubMed.
- H. J. Monkhorst and J. D. Pack, Phys. Rev. B: Solid State, 1976, 13, 5188–5192 CrossRef.
- S. Grimme, J. Antony, S. Ehrlich and H. Krieg, J. Chem. Phys., 2010, 132, 154104 CrossRef PubMed.
- J. K. Nørskov, J. Rossmeisl, A. Logadottir, L. Lindqvist, J. R. Kitchin, T. Bligaard and H. Jónsson, J. Phys. Chem. B, 2004, 108, 17886–17892 CrossRef.
- Accelrys Software. Materials Studio 8.0., Accelrys Software Inc., 2014 Search PubMed.
- W. G. Hoover, Phys. Rev. A: At., Mol., Opt. Phys., 1985, 31, 1695–1697 CrossRef PubMed.
- X. Zhao and Y. Liu, J. Am. Chem. Soc., 2020, 142, 5773–5777 CrossRef CAS PubMed.
- X. Guo, J. Gu, S. Lin, S. Zhang, Z. Chen and S. Huang, J. Am. Chem. Soc., 2020, 142, 5709–5721 CrossRef CAS PubMed.
- H. Niu, X. Wan, X. Wang, C. Shao, J. Robertson, Z. Zhang and Y. Guo, ACS Sustainable Chem. Eng., 2021, 9, 3590–3599 CrossRef CAS.
- C. Guo, T. Zhang, X. Liang, X. Deng, W. Guo, Z. Wang, X. Lu and C.-M. L. Wu, Appl. Surf. Sci., 2020, 533, 147466 CrossRef CAS.
- R. Hu, Y. Li, Q. Zeng and J. Shang, Appl. Surf. Sci., 2020, 525, 146588 CrossRef CAS.
- M. D. Hossain, Y. Huang, T. H. Yu, W. A. G. III and Z. Luo, Nat. Commun., 2020, 11, 2256 CrossRef CAS PubMed.
- Y. Wang, L. You and K. Zhou, Chem. Sci., 2021, 12, 14065–14073 RSC.
- F. Calle-Vallejo and M. T. M. Koper, Angew. Chem., Int. Ed., 2013, 52, 7282–7285 CrossRef CAS PubMed.
- A. A. Peterson, F. Abild-Pedersen, F. Stud, J. Rossmeisla and J. K. Nørskov, Energy Environ. Sci., 2010, 3, 1311–1315 RSC.
- F. Lia and Q. Tang, J. Mater. Chem. A, 2021, 9, 8761–8771 RSC.
- Y. J. Zhang, V. Sethuraman, R. Michalsky and A. A. Peterson, ACS Catal., 2014, 4, 3742–3748 CrossRef CAS.
- L. Zhang, Z. J. Zhao and J. Gong, Angew. Chem., Int. Ed., 2017, 56, 11326–11353 CrossRef CAS PubMed.
- H. Wang, C. Tsai, D. Kong, K. Chan, F. A. Pedersen, J. K. Nørskov and Y. Cui, Nano Res., 2015, 8, 566–575 CrossRef CAS.
- T. Zhang, H. Zhu, C. Guo, S. Cao, C.-M. L. Wu, Z. Wang and X. Lu, Catal. Sci. Technol., 2020, 10, 458–465 RSC.
- K. Chan, C. Tsai, H. A. Hansen and J. K. Nørskov, ChemCatChem, 2014, 6, 1899–1905 CrossRef CAS.
- Y. Ouyang, L. Shi, X. Bai, Q. Li and J. Wang, Chem. Sci., 2020, 11, 1807–1813 RSC.
- X. Zhang, W. Wang and Z. Yang, ACS Sustainable Chem. Eng., 2020, 8, 6134–6141 CrossRef CAS.
- H. Xu, D. Cheng, D. Cao and X. C. Zeng, Nat. Catal., 2018, 1, 339–348 CrossRef CAS.
- L. Gong, D. Zhang, Y. Shen, X. Wang, J. Zhang, X. Han, L. Zhang and Z. Xia, J. Catal., 2020, 390, 126–134 CrossRef CAS.
- V. L. Deringer, A. L. Tchougréeff and R. Dronskowski, J. Phys. Chem. A, 2011, 115, 5461–5466 CrossRef CAS PubMed.
- S. Maintz, V. L. Deringer, A. L. Tchougréeff and R. Dronskowski, J. Comput. Chem., 2013, 34, 2557–2567 CrossRef CAS PubMed.
- R. Dronskowski and P. E. Bloechl, J. Phys. Chem. B, 1993, 97, 8617–8824 CrossRef CAS.
- R. Nelson, C. Ertural, J. George, V. Deringer, G. Hautier and R. Dronskowski, J. Comput. Chem., 2020, 41, 1931–1940 CrossRef CAS PubMed.
- L. Yu, F. Li, J. Zhao and Z. Chen, Adv. Power Mater, 2020, 1, 100031 Search PubMed.
Footnote |
| † Electronic supplementary information (ESI) available: Optimized structures and parameters, formation energies, adsorption energies and adsorption free energies, reaction free energy change values, limiting potentials and electronic structure. See DOI: https://doi.org/10.1039/d2ma00192f |
| This journal is © The Royal Society of Chemistry 2022 |