 Open Access Article
A one-pot strategic construction of functionalized nanomaterial ZIF-90-Rhn for stepwise detection and capturing of Ag+ and formaldehyde from an aqueous solution†
Xiaoyu
Du
a,
Mengwen
Li
a,
Man
Du
*b,
Ao
Shen
a,
Xiaohui
Hao
a,
Jiaxin
Yuan
a,
Shufeng
Ma
a,
Yongwei
Zhao
a,
Lala
Hou
a,
Ziqi
Li
a and
Yunxu
Yang
 *a
*a
aDepartment of Chemistry and Chemical Engineering, School of Chemistry and Biological Engineering, University of Science and Technology Beijing, Beijing 100083, China. E-mail: yxyang@ustb.edu.cn
bSchool of Chemical and Pharmaceutical Engineering, Hebei University of Science and Technology, Shijiazhuang, 050018, China
First published on 19th February 2022
Abstract
In this work, a new functionalized nanomaterial, ZIF-90-Rhn, was designed, synthesized and characterized. The synthesis was performed by one-pot strategic construction, post-modification and pre-modification synthesis methods. After encapsulating cyanine dye, Cy-N, into ZIF-90-Rhn, a multi-functional complex of ZIF-90-Rhn@Cy-N was successfully obtained and could be used to detect Ag+ in dual-signals (fluorescence signal and visual color signal) by forming an intermedial product of ZIF-90-Rhn@Ag+/Cy-N in an aqueous solution. Subsequently, the intermediate product ZIF-90-Rhn@Ag+/Cy-N could detect formaldehyde (FA) via a stepwise redox recognition reaction through dual-signals. A smartphone portable online detection platform for Ag+ and FA using Bluetooth for the color changes under visible light was not realized, and the results are consistent with the fluorescence sensing assay results. Moreover, a chitosan non-woven fabric coated with ZIF-90-Rhn@Cy-N on its surface was considered to evaluate its efficient capturing and removing effects on Ag+ and FA in a stepwise actual procedure in water.
1. Introduction
Heavy metal ions are not biodegradable and tend to accumulate in organisms, and their beneficial or detrimental effect is concentration-dependent. Heavy metal ions have toxic effects on the human body and increase the risk of cancer.1 Among heavy metal ions, Ag+ has been discharged in the environment in large quantities via industrial wastes and emissions every year; this has led to serious environmental pollution and affected the production safety of food and agriculture.2,3 When the concentration of Ag+ in drinking water is higher than 0.9 μM, it will be toxic to the human body and can cause damage to the brain and even the immune system.4,5 Therefore, detecting the trace amount of Ag+ in the environment and industrial samples in time and effectively is extremely important. Nowadays, typical techniques for detecting Ag+ include atomic absorption spectrometry (AAS), inductively coupled plasma mass spectrometry (ICP-MS), optical emission spectrometry (OES), and voltammetry,6,7 but there are deficiencies such as complicated sample pretreatment steps or expensive instruments. However, fluorescent probes have attracted considerable attention because of their high sensitivity, high selectivity, short response time and easy real-time monitoring.Because of the structure of the activated formyl group, formaldehyde (FA) is one of the biologically-active strong substances and will not only pollute the environment but also cause irritation to the eyes and nose, parts of the human body, damage the central nervous system, cause immune system disorders and respiratory system diseases, and is one of the main carcinogens in the human body.8–10 Current FA detection methods depend on gas chromatography,11–13 high-performance liquid chromatography14 and spectroscopy,15,16 which are highly selective and sensitive but are time-consuming and require expensive testing equipment and technicians.
In the past few decades, nanomaterials, such as functionalized MOFs, have been the subject of extensive research. They were developed appropriately to many practical applications such as sensing, catalysis, biomedicine, gas storage, hydrogen storage, and drug delivery, green chemical etc.17–21 due to their high designability, the high specific surface area of the flexible, tunable porosity and morphology. Various luminescent MOFs have been extensively developed for the detection of ions, gas molecules, solvents, dyes and explosives.22 Moreover, MOFs such as MIL-12123 and ZIF-6724 are one of the ideal platforms, and have been developed and utilized in diversified fluorescent forms for Ag+ capture and removal. Nano-fluorescent probe technology can quickly and specifically identify FA in a porous nano-system, such as UIO-66-NH2,25 Al-MIL-53-N2H2,26 ZIF-8,27 ZIF-90-LW,28 and Ag-MOFs.29 Therefore, designing and developing new efficient nano-fluorescence probes to realize the detection of Ag+ and FA with convenient equipment, simple operation and easy signal identification has considerable significance.
Generally, MOFs can be functionalized by introducing different functional groups in their organic components. When the guests of specific ions or molecules enter the channel or cavity of MOFs to interact with the ligand functional groups, metal sites, or the doped molecules, the fluorescent properties of nano-functionalized MOFs would change and thus achieve the fluorescence assay of specific substrate molecules. The development of functionalized MOFs involves multiple strategies and methods.30,31 By mixing guests and precursors of MOFs in one-pot with certain strictly controlling of various parameters (temperature, solvent concentration ratio, surfactant, etc.),32–37 a homogeneous complex can be formed rather than a discrete structure. So, one-pot synthesis in situ packaging is one of the simplest fabrication methods of MOFs compared to the pre-modification and post-modification synthesis strategies.
With the above information in mind, herein, we designed and synthesized a functionalized nanomaterial ZIF-90-Rhn using one-pot strategic in situ synthesis construction. The post-modification of MOFs or the pre-modification of ligands can be performed and could stepwise detect and capture Ag+ and FA from the aqueous solution. The logic for the detection of Ag+ and FA by stepwise recognition reactions is based on the following design: (1) Using a synthetic strategy, such as one-pot generation, ZIF-90-Rhn was synthesized using imidazole-2-carboxaldehyde (ICA), Zn2+ with rhodanine-3-acetic acid (Rhn) in situ. ZIF-90-Rhn should demonstrate certain characteristics of acidity and the ability to provide carboxyl protons because of the carboxyl groups in Rhn. ZIF-90-Rhn could bind with the secondary amine of heptamethine cyanine (Cy-N, λem = 722 nm). Although there was no fluorescence of its own, ZIF-90-Rhn could synchronize and quench the fluorescence of Cy-N as cyanine was doped in the pores and formed a non-fluorescence ZIF-90-Rhn@Cy-N complex. (2) Based on the synergism of carboxyl and thioketone groups in Rhn of ZIF-90-Rhn, ZIF-90-Rhn could recognize and coordinate with Ag+ to form ZIF-90-Rhn@Ag+.38 Thus, the addition of Ag+ destroyed the ZIF-90-Rhn@Cy-N complex and simultaneously followed the formation of ZIF-90-Rhn@Ag+, thus resulting in the liberation of free Cy-N with the consequent restoration of the fluorescent emission of Cy-N. Finally, the recognition system demonstrate an enhanced fluorescent intensity because of the generation of ZIF-90-Rhn@Ag+/Cy-N. (3) When FA encountered the new system of ZIF-90-Rhn@Ag+/Cy-N, the unique redox activity of FA induced a reduction reaction and transformed Ag+ to Ag0. Thus, the redox destroyed the coordination of ZIF-90-Rhn@Ag+ after sequential addition of FA and freed or restored the proton providing capacity of carboxyl functional groups of ZIF-90-Rhn again. The new combination of ZIF-90-Rhn and Cy-N resulted in the rebuilding of the non-fluorescent ZIF-90-Rhn@Cy-N complex too.
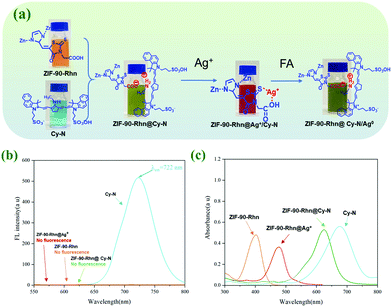
To our delight, from the continuous step by step recognitions of Ag+ and FA, there were interesting visual color changes that were accompanied except for the mentioned stepwise changes of fluorescence signals in the system (Fig. 1). As ZIF-90-Rhn (orange) was mixed with Cy-N (ultramarine), a new grass-green complex of ZIF-90-Rhn@Cy-N was produced. With the addition of Ag+ to the complex, the grass-green complex of ZIF-90-Rhn@Cy-N changed to a new brick-red ZIF-90-Rhn@Ag+/Cy-N mixture. A return change to the grassy green of ZIF-90-Rhn@Cy-N complex was then followed with the addition of FA (Fig. 1a). So, a dual signal (fluorescent signal and visual color signal) of ZIF-90-Rhn@Cy-N/Ag+/FA was observed as the stepwise detecting and removal of Ag+ and FA were performed (Fig. 1b and c). The results indicated great utilization potentiality in environmental monitoring and pollutant removal for Ag+ and FA.
2. Experimental section
2.1. Materials and instrumentations
The details are shown in the ESI.†2.2. Synthesis
![[thin space (1/6-em)]](https://www.rsc.org/images/entities/char_2009.gif) :
:![[thin space (1/6-em)]](https://www.rsc.org/images/entities/char_2009.gif) 2 mol ratio) in DMF at 100 °C for 18 h (0.248 g, 62%).
2 mol ratio) in DMF at 100 °C for 18 h (0.248 g, 62%).
3. Results and discussion
3.1. The synthesis of the functionalized nano-material of ZIF-90-Rhn
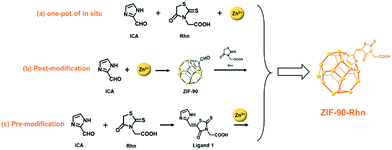
The post-modified synthesis is the best modification method to ensure the original morphology of a MOFs material, while pre-modified construction is the best modification method to ensure its really chemical structure. So, considering the advanced nature of one-pot for synthesis in situ tactics, ZIF-90-Rhn (a) was first synthesized by the one-pot synthesis process in situ, then we speculated that the pore size of ZIF-90-Rhn (a) was ∼3.55 nm (Fig. S5, ESI†), which was suitable for certain guest molecules to be doped in. Moreover, to confirm the chemical structure and the original morphology of this tentatively synthesized ZIF-90-Rhn (a), a post-modified condensation reaction of Rhn and ZIF-90 was adopted to synthesize ZIF-90-Rhn (b) in order to maintain the morphology structural features of ZIF-90. Then, the organic ligand 1 was synthesized by condensation reaction between Rhn and ICA; a pre-modification of ligand 1 was used to synthesize ZIF-90-Rhn (c) using a thermal solution method with Zn2+ (as shown in Scheme 1a–c). The synthesis of ZIF-90-Rhn (b) by post-modified method and ZIF-90-Rhn (c) by pre-modified method were proved and compared, and similarity, homogeneity and characteristics were the same as ZIF-90-Rhn (a) and ZIF-90 contributing to the structural morphology.3.2. Characterization of ZIF-90-Rhn a, b, c
The structural characterization of ZIF-90, including FT-IR spectra, PXRD, SEM, and XPS, were reported.40–42 The morphology characterization of ZIF-90-Rhn (a–c) was performed using the following structural characterization methods.First, FT-IR measurements on ICA, Rhn and ZIF-90-Rhn (a) were performed as shown in Fig. 2. The aldehydic carbonyl of ICA appeared at 1685 cm−1, the shift of carbonyl (–COOH, –RN–CO) and thione (–C![[double bond, length as m-dash]](https://www.rsc.org/images/entities/char_e001.gif) S) in Rhn appeared at 1720 cm−1, 1624 cm−1 and 1197 cm−1. The characteristic peaks of carbonyl (–COOH, –RN–CO), thione (–C
S) in Rhn appeared at 1720 cm−1, 1624 cm−1 and 1197 cm−1. The characteristic peaks of carbonyl (–COOH, –RN–CO), thione (–C![[double bond, length as m-dash]](https://www.rsc.org/images/entities/char_e001.gif) S) and C
S) and C![[double bond, length as m-dash]](https://www.rsc.org/images/entities/char_e001.gif) C groups belonging to ZIF-90-Rhn (a) changed and formed new peaks at 1726 cm−1, 1630 cm−1, 1200 cm−1 and 1600 cm−1 (Fig. 2, left). This indicated that ZIF-90-Rhn was generated by the abovementioned one-pot route in situ from ICA, Rhn and Zn2+.
C groups belonging to ZIF-90-Rhn (a) changed and formed new peaks at 1726 cm−1, 1630 cm−1, 1200 cm−1 and 1600 cm−1 (Fig. 2, left). This indicated that ZIF-90-Rhn was generated by the abovementioned one-pot route in situ from ICA, Rhn and Zn2+.
Similarly, the aldehydic carbonyl of ZIF-90 appeared at 1671 cm−1, and the shifts of carbonyl (–COOH, –RN–CO) and thione (–C![[double bond, length as m-dash]](https://www.rsc.org/images/entities/char_e001.gif) S) of Rhn appeared at 1720 cm−1, 1624 cm−1 and 1197 cm−1. However, the characteristic peaks of carbonyl (–COOH, HN–CO), thione (–C
S) of Rhn appeared at 1720 cm−1, 1624 cm−1 and 1197 cm−1. However, the characteristic peaks of carbonyl (–COOH, HN–CO), thione (–C![[double bond, length as m-dash]](https://www.rsc.org/images/entities/char_e001.gif) S) and C
S) and C![[double bond, length as m-dash]](https://www.rsc.org/images/entities/char_e001.gif) C groups belonged to ZIF-90-Rhn (b) changed and formed new peaks in 1721 cm−1, 1614 cm−1, 1200 cm−1 and 1600 cm−1, which indicated that Rhn had successfully post-modified to ZIF-90, and ZIF-90-Rhn (b) had been generated by the abovementioned post-modified tactics (Fig. 2, middle).
C groups belonged to ZIF-90-Rhn (b) changed and formed new peaks in 1721 cm−1, 1614 cm−1, 1200 cm−1 and 1600 cm−1, which indicated that Rhn had successfully post-modified to ZIF-90, and ZIF-90-Rhn (b) had been generated by the abovementioned post-modified tactics (Fig. 2, middle).
For organic ligand 1, the peaks of carbonyl (–COOH, HN–CO), thione (–C![[double bond, length as m-dash]](https://www.rsc.org/images/entities/char_e001.gif) S) and C
S) and C![[double bond, length as m-dash]](https://www.rsc.org/images/entities/char_e001.gif) C groups appeared at 1733 cm−1, 1620 cm−1, 1194 cm−1 and 1605 cm−1, respectively, all of which are attributed to the condensation reaction of ICA and Rhn. The peaks of carbonyl (–COOH, HN–CO), thione (–C
C groups appeared at 1733 cm−1, 1620 cm−1, 1194 cm−1 and 1605 cm−1, respectively, all of which are attributed to the condensation reaction of ICA and Rhn. The peaks of carbonyl (–COOH, HN–CO), thione (–C![[double bond, length as m-dash]](https://www.rsc.org/images/entities/char_e001.gif) S) and C
S) and C![[double bond, length as m-dash]](https://www.rsc.org/images/entities/char_e001.gif) C groups belonging to ZIF-90-Rhn (c) changed and newly shifted to 1703 cm−1, 1620 cm−1, 1200 cm−1 and 1605 cm−1 (Fig. 2, right), which indicated that ZIF-90-Rhn (c) had been generated from the organic ligand 1 and Zn2+ by the abovementioned pre-modified synthesis. It was not difficult to observe that the FT-IR results of ZIF-90-Rhn (a–c) were consistent, indicating that the chemical structure of ZIF-90-Rhn (a–c) was consistent, and there was the same original morphology between ZIF-90-Rhn and ZIF-90.
C groups belonging to ZIF-90-Rhn (c) changed and newly shifted to 1703 cm−1, 1620 cm−1, 1200 cm−1 and 1605 cm−1 (Fig. 2, right), which indicated that ZIF-90-Rhn (c) had been generated from the organic ligand 1 and Zn2+ by the abovementioned pre-modified synthesis. It was not difficult to observe that the FT-IR results of ZIF-90-Rhn (a–c) were consistent, indicating that the chemical structure of ZIF-90-Rhn (a–c) was consistent, and there was the same original morphology between ZIF-90-Rhn and ZIF-90.
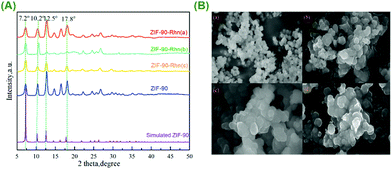
The powder X-ray diffraction (PXRD) patterns demonstrated that the data were consistent with the simulated ZIF-90 and ZIF-90-Rhn (a–c) pattern in Fig. 3(A). The sharp diffraction peaks in the PXRD pattern of ZIF-90-Rhn (a–c) demonstrated that not only was there an excellent crystallinity but also the same crystallographic structure was observed with the pristine ZIF-90.
Moreover, the morphology characterization of ZIF-90 and ZIF-90-Rhn (a–c) was performed using scanning electron microscopy (SEM) as shown in Fig. 3(B). The data indicated that ZIF-90 included an exceptionally uniform morphology and an extraordinary cubic close-packed structure (Fig. 3(B-a). Although the morphology of ZIF-90-Rhn (a, b, c) had a slight change compared to that of ZIF-90 because of the modification reactions, the obtained ZIF-90-Rhn (a, b, c) still maintained a uniform cubic structure (Fig. 3(B-b–d). With the abovementioned results, we could confirm that the nanomaterial ZIF-90-Rhn (a, b, c) had the same skeleton and morphology, and they were the same molecules.
For the purpose of determining the chemical composition and element state of ZIF-90-Rhn, XPS was performed as shown in Fig. 4a–f. In the XPS experiment, the samples were exposed to monochromic X-radiation, and the properties of inner-shell electrons were to be probed. As per the spectrum of ZIF-90-Rhn (Fig. 4a), five kinds of elements (C, O, N, S and Zn) were detected and the C 1s emission spectrum could be divided into four main peaks, as shown in Fig. 4b. With the binding energy of C 1s at 284.8 eV obtained in the XPS analysis as the reference standardized for specimen charging, three peaks with binding energies of 292.09 eV, 288.11 eV, 286.13 eV, were obtained from C–S bonds, C![[double bond, length as m-dash]](https://www.rsc.org/images/entities/char_e001.gif) O bonds and C–N bonds, respectively. The O 1s emission spectrum (Fig. 4c) could be divided into two primary peaks by the Gaussian fitting method. The peak at 531.3 eV was attributed to the –OH bonds in the organic ligand, while the peak at 532.57 eV could be attributed to C
O bonds and C–N bonds, respectively. The O 1s emission spectrum (Fig. 4c) could be divided into two primary peaks by the Gaussian fitting method. The peak at 531.3 eV was attributed to the –OH bonds in the organic ligand, while the peak at 532.57 eV could be attributed to C![[double bond, length as m-dash]](https://www.rsc.org/images/entities/char_e001.gif) O bonds. The N 1s emission spectrum (Fig. 4d) could be divided into two primary peaks. The peak at 399.98 eV was attributed to N–Zn bonds, while the peak at 398.32 eV was attributed to C–N bonds. The S 2p emission spectrum could be divided into two primary peaks, as shown in Fig. 4e. The binding energy at 161.37 eV was attributed to C
O bonds. The N 1s emission spectrum (Fig. 4d) could be divided into two primary peaks. The peak at 399.98 eV was attributed to N–Zn bonds, while the peak at 398.32 eV was attributed to C–N bonds. The S 2p emission spectrum could be divided into two primary peaks, as shown in Fig. 4e. The binding energy at 161.37 eV was attributed to C![[double bond, length as m-dash]](https://www.rsc.org/images/entities/char_e001.gif) S bonds, while the peaks at 163.32 eV could be attributed to C–S bonds. In Fig. 4f, the Zn 2p and Zn 2p1/2 spin-orbital photoelectrons were located at 1021.84 eV and 1044.87 eV, respectively. These results showed that ICA was successfully coordinated with Zn2+, and was successfully modified by the Rhnin situ synthesis method for ZIF-90-Rhn.
S bonds, while the peaks at 163.32 eV could be attributed to C–S bonds. In Fig. 4f, the Zn 2p and Zn 2p1/2 spin-orbital photoelectrons were located at 1021.84 eV and 1044.87 eV, respectively. These results showed that ICA was successfully coordinated with Zn2+, and was successfully modified by the Rhnin situ synthesis method for ZIF-90-Rhn.
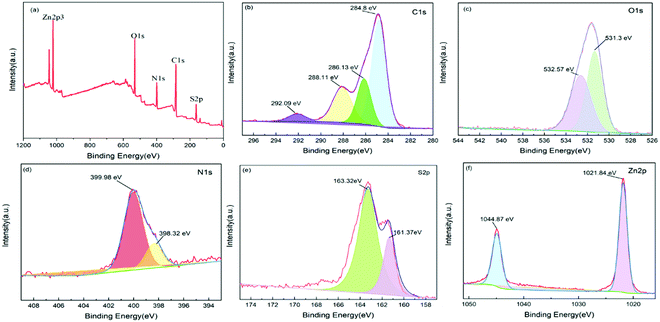 | ||
| Fig. 4 XPS spectra of ZIF-90-Rhn sample: (a) the survey scan; (b) C 1s; (c) O 1s; (d) N 1s; and (e) S 2p; (f) Zn 2p. | ||
For checking the thermal stability, the thermogravimetric analysis (TGA) of ZIF-90-Rhn was carried out in an air atmosphere in a temperature range from 30–800 °C, as shown in Fig. S7 (ESI†). According to the TG curve, ZIF-90-Rhn displayed high thermal stability up to 156.31 °C under an air atmosphere. The first weight loss of 0.01 wt% in the temperature range of 30–156.31 °C could be attributed to the elimination of guest solvent molecules in MOF holes. The next weight loss of 18.557 wt% in the temperature of 156.31–431.85 °C could be attributed to the pentacyclic decomposition from Rhn. The next weight loss of 27.64 wt% in the temperature of 431.85–643.90 °C could be attributed to the pentacyclic decomposition from the ICA. After 643.90 °C, the ligand molecules were separated from the skeleton and a residue of zinc dioxide remained.
To prove permanent microporosity, we investigated the specific surface area and pore volume of the material using N2 adsorption isotherm analysis. The graphs were obtained by testing the N2 physical adsorption isotherms of the materials, as shown in Fig. S8 (ESI†). The adsorption amount of ZIF-90-Rhn slowly increased and almost stopped rising after the relative pressure (p/p0) reached 0.98, and the material was saturated with adsorption. Brunauer–Emmett–Teller (BET) surface area was 343.767 m2 g−1 (p/p0 = 0.30), micropore volume was 0.15 cm3 g−1 (p/p0 = 0.99), and the average pore diameter was 3.55 nm. The BET test results showed that the synthesized ZIF-90-Rhn was a mesoporous nanomaterial and its pore size was suitable for the related guest molecules adsorption.
3.3. Fluorescence sensing and visual reading signal experiments of ZIF-90-Rhn@Cy-N
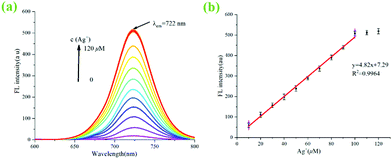
A previous report has shown that Rhn could recognize and coordinate Ag+ to produce a Rhn@Ag+ coordination complex.35 However, in our original experiment, ZIF-90-Rhn (orange) and Ag+ only produced ZIF-90-Rhn@Ag+ (crimson) alone (Fig. S9, ESI†) under the recognition reaction progress. Unfortunately, neither ZIF-90-Rhn nor ZIF-90-Rhn@Ag+ had fluorescence emission spectra. However, the primary objectives of the present endeavor were a one-pot synthesis of the ZIF-90-Rhn complex in situ and its applications as a fluorescent platform for Ag+ and FA. Thus, a secondary amine dye of heptamethine cyanine (Cy-N, color was ultramarine, λem = 722 nm) was selected and doped in the pores of ZIF-90-Rhn, which would show certain characteristics of acidity and had the ability to provide carboxyl protons due to the carboxyl group in Rhn. Interestingly, a grass-green new color ZIF-90-Rhn@Cy-N complex was formed when ZIF-90-Rhn (orange) was mixed with Cy-N (ultramarine), and the fluorescence of Cy-N (λem = 722 nm) was quenched after the ZIF-90-Rhn@Cy-N complex was generated.With the ZIF-90-Rhn@Cy-N in hand, and based on the synergism of carboxyl and thioketone groups of Rhn, ZIF-90-Rhn recognized and coordinated with Ag+ to form ZIF-90-Rhn@Ag+ with the addition of Ag+, of which the decomposition of the ZIF-90-Rhn@Cy-N complex simultaneously happened, resulting in the liberation of free Cy-N with the consequent restoration of the fluorescent-emitting Cy-N. Finally, the recognition system shared a turn-on fluorescence due to the generation of ZIF-90-Rhn@Ag+/Cy-N, and the grass-green complex of ZIF-90-Rhn@Cy-N changed into a brick-red ZIF-90-Rhn@Ag+/Cy-N mixture with the addition of Ag+ (Fig. 1).
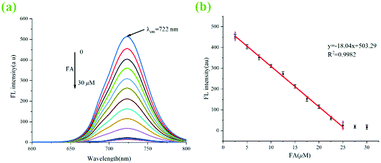
Correspondingly, the redox activity of Ag+ to FA is a well-known fact. So, a stepwise recognition detection for FA was adopted using the abovementioned new fluorescent system of ZIF-90-Rhn@Ag+/Cy-N. Indeed, when FA encountered the fluorescent system of ZIF-90-Rhn@Ag+/Cy-N, the unique redox activity between Ag+ and FA resulted in a reduction reaction and transformed Ag+ to Ag0. The coordination compound of ZIF-90-Rhn@Ag+ was thus destroyed, and freed or restored the proton providing capacity of the functional carboxyl groups in ZIF-90-Rhn again. Therefore, the interaction between ZIF-90-Rhn and Cy-N was re-generated with the formation of the non-fluorescent ZIF-90-Rhn@Cy-N complex. The redox reaction of ZIF-90-Rhn@Ag+ and FA induced a turn-off fluorescence. Moreover, a return change of the grassy green color of the ZIF-90-Rhn@Cy-N complex was followed upon the addition of FA. The foregoing results and discussion indicated that dual-signals (fluorescent signal and visual color signal) of ZIF-90-Rhn@Cy-N/Ag+/FA could be observed with this stepwise detecting of Ag+ and FA (Fig. 1).
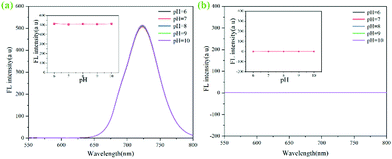
Similarly, ZIF-90-Rhn@Cy-N (100 μM) and FA (30 μM) were dispersed in 25 mL of methanol and sonicated for 5 min, and the fluorescent intensity was measured in a pH range from 6.0 to 10.0. The results demonstrated that pH had no obvious effects on fluorescent intensity (Fig. 5b).
| Sample (μM) | Fluorescence method (μM) | Colorimetric method (μM) | RSD (n = 3) (%) |
|---|---|---|---|
| 20.0 | 20.2 | 20.3 | 0.76 |
| 30.0 | 30.1 | 29.9 | 0.33 |
| 50.0 | 49.5 | 50.1 | 0.64 |
| 80.0 | 80.2 | 80.3 | 0.19 |
| Sample (μM) | Fluorescence method (μM) | Colorimetric method (μM) | RSD (n = 3) (%) |
|---|---|---|---|
| 1.0 | 1.1 | 1.1 | 5.59 |
| 10.0 | 9.9 | 10.2 | 1.52 |
| 15.0 | 14.5 | 15.1 | 2.16 |
| 20.0 | 19.8 | 19.9 | 0.5 |
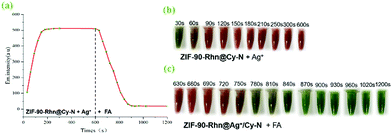
At the time of 600 s instantaneously, FA (25 μM) was added. The emission intensity at 722 nm was collected from 630 s to 1200 s (Fig. 11a) and the color changes at different moments were recorded (Fig. 11c). The fluorescence intensity decreased gradually with time and reached a stable level after about 5 min, which showed that the best responding time of ZIF-90-Rhn@Ag+/Cy-N to FA was 5 min. This indicated that ZIF-90-Rhn@Cy-N could be used in a stepwise detection for Ag+ and for FA based on ZIF-90-Rhn@Ag+/Cy-N.
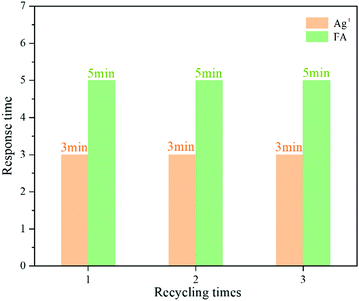
The ZIF-90-Rhn@Cy-N′ product was employed to detect Ag+ and FA by the same methods as described in section 2.2.8, and this process was repeated for three recycles. It could be seen in Fig. 12 that ZIF-90-Rhn@Cy-N′ was able to detect Ag+ and FA; after three recycles, the response time was still kept at 3 min and 5 min, respectively, which demonstrated that probe ZIF-90-Rhn@Cy-N could be reused for the detection of Ag+ and FA.
3.4. The sensing mechanism of Ag+ and FA
The redox activity of Ag+ to FA is a well-known fact. However, the interaction between FA and Ag+ is often ignored due to the environmental and biological hazards of Ag+.13 With the functionalized ZIF-90-Rhn that was generated by one-pot synthesis in situ, pre-modification, or post-modification synthesis, a secondary amine dye of heptamethine cyanine Cy-N was encapsulated into the pores of this mesoporous nanomaterial. ZIF-90-Rhn should display certain characteristics of acidity and has the ability to provide carboxyl protons due to the carboxyl groups in Rhn. So, the driving force of encapsulation was the interaction between carboxyl groups in Rhn and secondary amine groups in Cy-N. It was interesting that the NIR heptamethine cyanine dye of Cy-N could be quenched by ZIF-90-Rhn. We considered that it was an ICT mechanism and the pore steric hinders of MOFs materials to NIR Cy-N inducing the fluorescent quenching for the ion pair complex of the non-fluorescence ZIF-90-Rhn@Cy-N. Depending on the strong coordination ability of S and –COOH with Ag+, ZIF-90-Rhn@Ag+ formed upon the addition of Ag+, and the coordination reaction destroyed the ion-pair complex of the non-fluorescence ZIF-90-Rhn@Cy-N. The simultaneous decomposition of ZIF-90-Rhn@Cy-N induced the release of free Cy-N, and the system of ZIF-90-Rhn@Ag+/Cy-N shared a turn-on fluorescence with the addition of Ag+.When FA encountered the new system of ZIF-90-Rhn@Ag+/Cy-N, the unique redox activity of FA would induce a reduction reaction to ZIF-90-Rhn@Ag+, and transformed Ag+ to Ag0. Thus, the redox would destroy the coordination compound of ZIF-90-Rhn@Ag+ and free or restore the proton providing capacity of carboxyl functional groups in ZIF-90-Rhn again. The new combination of ZIF-90-Rhn and Cy-N resulted in the rebuilding of the non-fluorescent ZIF-90-Rhn@Cy-N complex again. With the addition of FA, the system of ZIF-90-Rhn@Cy-N/Ag0 showed a turn-off fluorescence.
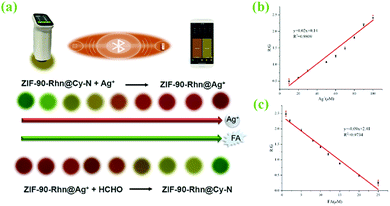
A series of interesting visual color changes were accompanied by the mentioned stepwise detection of Ag+ and FA. A new grass-green complex of ZIF-90-Rhn@Cy-N was produced as ZIF-90-Rhn (orange) was mixed with Cy-N (ultramarine). With the addition of Ag+, the grass-green complex of ZIF-90-Rhn@Cy-N changed into a new brick-red ZIF-90-Rhn@Ag+/Cy-N mixture, and a return color change was followed after the addition of FA. By the doped complex of ZIF-90-Rhn@Cy-N from ZIF-90-Rhn and NIR Cy-N, the stepwise detecting of ZIF-90-Rhn@Cy-N to Ag+ and ZIF-90-Rhn@Ag+/Cy-N mixture to FA was fulfilled, and dual-signals (fluorescent signals and visual color signals were observed (Fig. 13).
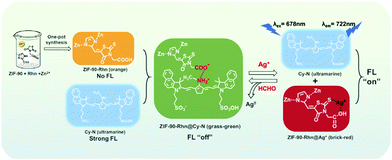 | ||
| Fig. 13 Schematic illustration of ZIF-90-Rhn@Cy-N structure and visual detection principle for Ag+ and FA. | ||
The theoretical calculation used the B3LYP/6-31G(d) basis set in the Gaussian 09 package was adopted to explain the absorption spectra changes in the abovementioned stepwise detection (Fig. 14). Based on the density functional theory, the structure of ZIF-90-Rhn, ZIF-90-Rhn@Cy-N and ZIF-90-Rhn@Ag+ were optimized by Gaussian software to calculate the energy difference between HOMO and LUMO, so as to determine the influence of compound changes on the spectral properties. After ZIF-90-Rhn was combined with Cy-N dye, the energy difference of HOMO–LUMO changed from 3.09 eV to 2.73 eV, indicating that the energy gap band was smaller. The position of the maximum absorption peak changed from 400 nm to 640 nm, and a large degree of red shift occurred. The color changed from orange (ZIF-90-Rhn) to grass-green (ZIF-90-Rhn@Cy-N). When ZIF-90-Rhn@Ag+ was formed, the energy difference between HOMO and LUMO changed from 0.33 eV to 2.73 eV, and the energy gap band became larger. At this time, the maximum absorption peak of ZIF-90-Rhn@Ag+ was at 480 nm, the color turned to brick-red of ZIF-90-Rhn@Ag+/Cy-N mixture. The phenomena of red shifts and blue shifts were consistent with the actual spectra, as shown in Fig. S10 (ESI†).
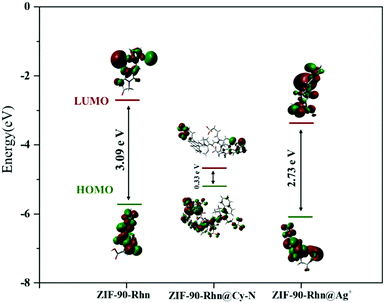 | ||
| Fig. 14 Molecular amplitude plots of HOMO and LUMO of related compounds calculated using the B3LYP/6-31G(d) basis set. | ||
To further study the mechanism of recognition and coordination mechanism of Ag+ and ZIF-90-Rhn, FT-IR spectra and XPS analysis of ZIF-90-Rhn@Ag+ were carried out (Fig. 15). FT-IR spectra of ZIF-90-Rhn showed that the peaks of –CO–OH appeared in 3000–3300 cm−1, 1320 cm−1, and the peaks of carbonyl (–COOH, HN–CO), –C![[double bond, length as m-dash]](https://www.rsc.org/images/entities/char_e001.gif) C and thione (–C
C and thione (–C![[double bond, length as m-dash]](https://www.rsc.org/images/entities/char_e001.gif) S) appeared in 1726, 1630, 1600, 1200 cm−1 (Fig. 15A-a). The peaks of –OH and carbonyl (–COOH, HN–CO), –C
S) appeared in 1726, 1630, 1600, 1200 cm−1 (Fig. 15A-a). The peaks of –OH and carbonyl (–COOH, HN–CO), –C![[double bond, length as m-dash]](https://www.rsc.org/images/entities/char_e001.gif) C and thione (–C
C and thione (–C![[double bond, length as m-dash]](https://www.rsc.org/images/entities/char_e001.gif) S) of ZIF-90-Rhn@Ag+ were weakened, and the peaks of carbonyl (–COOH, HN–CO), C
S) of ZIF-90-Rhn@Ag+ were weakened, and the peaks of carbonyl (–COOH, HN–CO), C![[double bond, length as m-dash]](https://www.rsc.org/images/entities/char_e001.gif) C and thione (–C
C and thione (–C![[double bond, length as m-dash]](https://www.rsc.org/images/entities/char_e001.gif) S) groups in the ZIF-90-Rhn molecule shifted to 1750, 1657, 1629, 1157 cm−1 due to the coordination of Ag+ to ZIF-90-Rhn (Fig. 15A-b).
S) groups in the ZIF-90-Rhn molecule shifted to 1750, 1657, 1629, 1157 cm−1 due to the coordination of Ag+ to ZIF-90-Rhn (Fig. 15A-b).
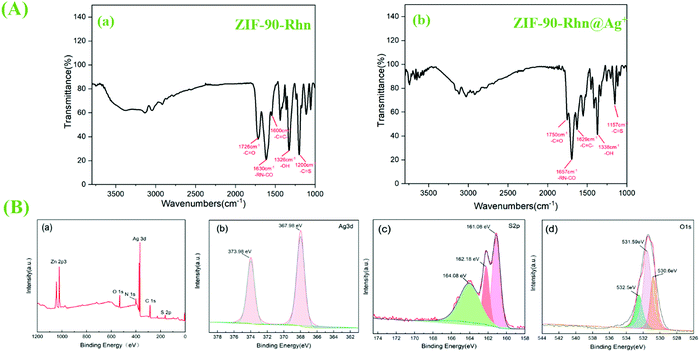 | ||
| Fig. 15 (A-a) FT-IR spectra of ZIF-90-Rhn; (A-b) FT-IR spectra of ZIF-90-Rhn@Ag+; (B) XPS spectra of ZIF-90-Rhn@Ag+ sample: (a) the survey scan; (b) Ag 3d; (c) S 2p; (d) O 1s. | ||
The XPS analysis of ZIF-90-Rhn@Ag+ shows that there was the appearance of Ag 3d orbitals, which proved that Ag+ had been successfully coordinated with S and O (Fig. 15B-a). The spin–orbit photoelectrons of Ag 3d3/2 and Ag 3d5/2 were located at 367.98 eV and 373.98 eV, respectively (Fig. 15B-b). In Fig. 15B-c, the emission spectrum of S 2p could be divided into two main peaks: the binding energy at 161.08 eV was attributed to the S–Ag bond, the binding energy at 162.18 eV was attributed to the C![[double bond, length as m-dash]](https://www.rsc.org/images/entities/char_e001.gif) S bond, and the binding energy at 164.08 eV was attributed to the C–S bond. The O 1s emission spectrum could be divided into three main peaks (Fig. 15B-d): binding energy of 530.6 eV of the O–Ag bond, peak at 531.59 because of –OH bond in the organic ligand, and peak at 532.5 eV because of the C
S bond, and the binding energy at 164.08 eV was attributed to the C–S bond. The O 1s emission spectrum could be divided into three main peaks (Fig. 15B-d): binding energy of 530.6 eV of the O–Ag bond, peak at 531.59 because of –OH bond in the organic ligand, and peak at 532.5 eV because of the C![[double bond, length as m-dash]](https://www.rsc.org/images/entities/char_e001.gif) O bond. Moreover, it was found that the binding energy of C
O bond. Moreover, it was found that the binding energy of C![[double bond, length as m-dash]](https://www.rsc.org/images/entities/char_e001.gif) S and –CO–OH from ZIF-90-Rhn@Ag+ was slightly larger than that of ZIF-90-Rhn (C
S and –CO–OH from ZIF-90-Rhn@Ag+ was slightly larger than that of ZIF-90-Rhn (C![[double bond, length as m-dash]](https://www.rsc.org/images/entities/char_e001.gif) S at 161.37 eV, –CO–OH at 531.3 eV), which could be attributed to the appearance of coordination bonds between O and S and Ag+, resulting in a decrease in electron density and an increase in the binding energy of O and S.
S at 161.37 eV, –CO–OH at 531.3 eV), which could be attributed to the appearance of coordination bonds between O and S and Ag+, resulting in a decrease in electron density and an increase in the binding energy of O and S.
Moreover, after the detection reaction and the removal process of Ag+ and FA, PXRD and SEM tests on recycled products of ZIF-90-Rhn@Ag+ and ZIF-90-Rhn@Cy-N′ were performed to confirm that the ZIF-90-based frameworks were not destroyed. Fig. S14a and b, (ESI†) ZIF-90-Rhn@Ag+ and ZIF-90-Rhn@Cy-N′ had a very regular morphology, which was similar to ZIF-90 (Fig. S14c, ESI†). In Fig. S14d, (ESI†) it is clear that PXRDs of ZIF-90-Rhn@Cy-N and ZIF-90-Rhn@Ag+/Cy-N are consistent with the simulated ZIF-90 pattern, and all the main diffraction peaks of ZIF-90-Rhn@Cy-N and ZIF-90-Rhn@Ag+/Cy-N at 7.2°, 10.2°, 12.5°, 17.8° demonstrated great similarity with those of the simulated ZIF-90 pattern. All the above results confirmed that the ZIF-based frameworks of ZIF-90-Rhn@Cy-N and ZIF-90-Rhn@Ag+/Cy-N were not destroyed and kept intact during the detection and removal of Ag+ and FA.
3.5. Capture of Ag+, FA in the actual samples
To evaluate the feasibility of the nano-composite ZIF-90-Rhn for Ag+ capturing and removing application and the effect to FA in the actual stepwise procedure, a coat of chitosan non-woven fabric was made by spreading ZIF-90-Rhn@Cy-N evenly on its surface (1.2 mg cm−2). The functionalized non-woven fabric was cut into a circle with a diameter of 5 cm, and the films were filled into a glass column (5 cm in diameter, 20 cm in height) layer by layer. The industrial wastewater and tap water were put in the filter as analytes. For a period of 5 min, the water ran through (Fig. 16a). As there was no Ag+ detected in the above industrial wastewater and the tap water samples before, we added a standard solution of Ag+ to it. The measurement was performed, and the recovered water was measured again. The results showed that the concentration of Ag+ in the recovery water reached a discharge standard of 4.7 μM, and the drinking water content was <0.9 μM (Table 3). Moreover, the coat colors of the functionalized non-woven fabric with ZIF-90-Rhn@Cy-N had changed from grass-green to brick-red color, meaning some complexity of ZIF-90-Rhn@Ag+/Cy-N was generated.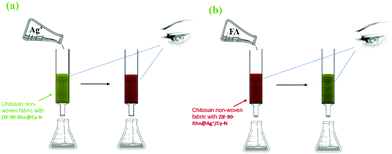 | ||
| Fig. 16 (a) Schematic for the sensing and capturing of ZIF-90-Rhn@Cy-N toward Ag+ in real samples. (b) The schematic for the sensing and capturing of ZIF-90-Rhn@Ag+/Cy-N toward FA in real samples. | ||
| Real sample | Removal rate (%) | Concentration of Ag+ (μM) | |
|---|---|---|---|
| Initial | Final | ||
| Industrial wastewater | 96 | 5.0 | 0.2 |
| 96 | 7.0 | 0.3 | |
| Tap water | 100 | 1.0 | 0 |
| 97 | 2.0 | 0.06 | |
Then, the removal application of FA was performed in a subsequent stepwise operation. By using the above set, the blank water samples, which had been added a constant concentration of FA ran through the brick-red color filter layers for 5 min (Fig. 16b). The results showed that the removal rate of FA was above 98% (Table 4), and the coat colors of the functionalized non-woven fabric rechanged a reverse color, showing FA had been filtered out. With the description above, ZIF-90-Rhn@Cy-N exhibited certain reliability and practicability in detecting or capturing Ag+ in water. Detecting or capturing of FA could also be achieved some satisfactory results with a stepwise variation of ZIF-90-Rhn@Ag+/Cy-N. Furthermore, the recycling of ZIF-90-Rhn@Cy-N for the removal of Ag+ and FA was explored as well, and the results are described in Fig. S15 (ESI†). The good results confirmed that ZIF-90-Rhn@Cy-N could realize the recycling use for removal of Ag+ and FA.
| Real sample | Removal rate (%) | Concentration of FA (μM) | |
|---|---|---|---|
| Initial | Final | ||
| Formaldehyde solution | 98 | 3.0 | 0.06 |
| 98 | 5.0 | 0.09 | |
4. Conclusions
In conclusion, we designed, synthesized and characterized a new functionalized nanomaterial of ZIF-90-Rhn using one-pot strategic construction for in situ synthesis, and the post-modification of MOFs or the pre-modification of ligands synthesis method were procured, respectively, to confirm the chemical structure and the morphology of ZIF-90-Rhn. With the encapsulating of cyanine dye of Cy-N to ZIF-90-Rhn, a multi-functional complex of ZIF-90-Rhn@Cy-N was successfully obtained, which could detect and capture Ag+ and FA by stepwise redox recognition reactions from the intermedial complex of ZIF-90-Rhn@Ag+/Cy-N in dual-signals (fluorescence signals and visual color signals) in an aqueous solution. While a smartphone and a spectrophotometer formed a portable detection platform to test the color changes of ZIF-90-Rhn@Cy-N for Ag+ and ZIF-90-Rhn@Ag+/Cy-N for FA sensing under visible light. The platform could connect a smartphone by Bluetooth online. More importantly, the above online results of the portable detection platform are consistent with the fluorescence sensing detection for Ag+ and FA. Moreover, using a chitosan non-woven fabric spread on which there was ZIF-90-Rhn@Cy-N coat evenly deposited on the surface, the feasibility of the nano-composite ZIF-90-Rhn for Ag+ capturing and removing the application, and the effect of ZIF-90-Rhn@Ag+/Cy-N on FA in actual stepwise procedure was evaluated. The results showed that ZIF-90-Rhn@Cy-N exhibited certain reliability and practicability in stepwise detecting or capturing Ag+ and FA from water.Author contributions
Xiaoyu Du: conceptualization, writing – original draf. Mengwen Li: validation. Man Du: conceptualization. Xiaohui Hao: investigation. Ao Shen: project administration. Lala Hou: software. Shufeng Ma and Jiaxin Yuan: resources. Yongwei Zhao and Ziqi Li: methodology. Yunxu Yang: project administration, writing – review and editing.Conflicts of interest
The authors declare no competing financial interest.Acknowledgements
This research was supported by the National Science Foundation of China (No. 21575012), the Natural Science Foundation of Beijing (No. 2212010), and the Fundamental Research Funds for the Central Universities (FRF-BR-19-003B).Notes and references
- Z. Yuanyuan, J. Hui and W. Xuemei, Anal. Chim. Acta, 2015, 870, 1–7 CrossRef PubMed.
- W. Su, C. Tiantian, L. Qian, L. Zhongyu and X. Song, Optik, 2016, 127(2), 890–895 CrossRef.
- J. Yuliang, K. Weiwei, S. Yongmiao and W. Bingxiang, Tetrahedron, 2015, 71(34), 5584–5588 CrossRef.
- L. Chun-Ze, A. F. Melissa, C. Rosenildo Corrêa da Costa, J. A. Gladysz, S. Andreas and B. Philippe, Anal. Chem., 2010, 82(18), 7634–7640 CrossRef PubMed.
- B. Shiyue, S. Chao, Q. Yuting, L. Jiyang, X. Fengna and D. Xiaoping, J. Fluoresc., 2016, 26(1), 297–305 CrossRef PubMed.
- P. D. Howe and S. Dobson, IPCS Concise International Chemical Assessment Documents 44, 2002 Search PubMed.
- Y. Xuan and W. Erkang, Anal. Chem., 2011, 83(12), 5005 CrossRef PubMed.
- M. N. Descamps, T. Bordy, J. Hue, S. Mariano, G. Nonglaton, E. Schultz, T. H. Tran-Thi and S. Vignoud-Despond, Procedia Eng., 2010, 5, 1009–1012 CrossRef CAS.
- G. Xiao-Liang, C. Yan, J. Hong-Lan, Q. Xian-Bo and Y. Du-Li, Sensors, 2018, 18(9), 3141 CrossRef PubMed.
- B. Opas, D. Frank, K. Proespichaya, T. Panote and H. P. J. Seamus, Anal. Chim. Acta, 2010, 659(1–2), 251–257 Search PubMed.
- S. Patrik, S. David, H. A. Tracey, S. Waleed Al and E. B. James, Rapid Commun. Mass Spectrom., 1999, 13, 1354 CrossRef.
- K. Shuji, B. J. Patrick, K. H. Tad and B. M. Veronica, Anal. Chem., 2001, 73, 2992 CrossRef PubMed.
- G. R. Möhlmann, Appl. Spectrosc., 1985, 39, 98–101 CrossRef.
- J. R. Hopkins, T. Still, S. Al-Haider, I. R. Fisher, A. C. Lewis and P. W. Seakins, Atmos. Environ., 2003, 37, 2557–2565 CrossRef CAS.
- L. Xiaoyong, L. Peng, Y. Tianlin, T. Jinchun and X. Ping, Scr. Mater., 2012, 67, 293–296 CrossRef.
- C. Er-Xia, Y. Hui and Z. Jian, Inorg. Chem., 2014, 53, 5411–5413 CrossRef PubMed.
- F. Jing Mei, L. Fei, Z. Xi Juan, H. Xiao Li and L. Yuan Fang, Analyst, 2014, 139, 801–806 RSC.
- K. Peramaiah, P. Alagarsamy, P. Mani, K. Mariyappan and N. Bernaurdshaw, Microchim. Acta, 2017, 184, 2265–2273 CrossRef.
- K. Xiang-Jing and L. Jian-Rong, Engineering, 2021, 7, 1115–1139 CrossRef.
- W. Bin, L. Xiu-Liang, F. Dawei, X. Lin-Hua, Z. Jian, L. Ming, X. Yabo, L. Jian-Rong and Z. Hong-Cai, J. Am. Chem. Soc., 2016, 138(19), 6204–6216 CrossRef PubMed.
- H. Tao, K. Xiang-Jing and L. Jian-Rong, Acc. Chem. Res., 2021, 54, 3083–3094 CrossRef PubMed.
- L. P. William, M. Soumya, R. D. Nathan, D. V. Aamod, L. Jing and G. K. Sujit, Chem. Soc. Rev., 2017, 46, 3242–3285 RSC.
- H. Ji-Na and Y. Bing, J. Mater. Chem. A, 2015, 3(9), 4788–4792 RSC.
- R. Ayyanu, P. Perumal and M. Norhashimah, ACS Appl. Mater. Interfaces, 2018, 10, 20550–20558 CrossRef PubMed.
- V. Kowsalya, D. Akash, K. Ki-Hyun, B. W. Danil, K. Pawan and Y. Qu, Sens. Actuators, B, 2017, 241, 938–948 CrossRef.
- N. Soutick, S. Ena, T. Vishal and B. Shyam Biswas, Inorg. Chem., 2018, 57(24), 15149–15157 CrossRef PubMed.
- Z. Huimin, L. Xiaojing, L. Wanze, W. Peng, C. Shuo and Q. Xie, RSC Adv., 2014, 4(69), 36444–36450 RSC.
- L. Mengwen, S. Ao, L. Yueqi, Z. Hao, H. Xiaohui, L. Xueliang, S. Xinchao and Y. Yunxu, Anal. Methods, 2020, 12(29), 3748–3755 RSC.
- L. Mengwen, A. Shen, D. Man, H. Xiaohui, W. Hongquan, D. Xiaoyu, M. Shufeng, Y. Jiaxin and Y. Yunxu, RSC Adv., 2021, 11(54), 34291–34299 RSC.
- C. Liyu, L. Rafael and L. Yingwei, Chem. Soc. Rev., 2017, 46(15), 4614–4630 RSC.
- C. Liyu Chen, C. Huirong, L. Rafael and L. Yingwei, Chem. Sci., 2014, 5(10), 3708–3714 RSC.
- L. Yucheng Luo, F. Shiyan, Y. Wenqian, W. Zili, C. A. David, L. Chaolun, S. Jianying and S. Chengyong, Adv. Mater., 2018, 30(6), 1704576 CrossRef PubMed.
- H. Huajun, M. En, C. Yuanjing, Y. Jiancan, Y. Yu, S. Tao, W. Chuan-De, C. Xueyuan, C. Banglin and Q. Guodong, Nat. Commun., 2016, 7, 11087 CrossRef PubMed.
- J. Shengye, S. Ho-Jin, F. K. Omar, W. P. Gary and H. T. Joseph, J. Am. Chem. Soc., 2013, 135(3), 955–958 CrossRef PubMed.
- D. Xiaoping, L. Mengzhao, L. Zhanzhao, J. Axiang Jin, M. Yangde, H. Xingliang, S. Hui, W. Hai and Z. Xin, J. Phys. Chem. C, 2016, 120(23), 12539–12548 CrossRef.
- H. Huajun, C. Yuanjing, L. Bin, W. Bo, J. Chuanhong, Y. Jiancan, Y. Lijia, Y. Yu, C. Banglin and Q. Guodong, Adv. Mater., 2019, 31(6), e1806897 CrossRef PubMed.
- L. Haibin, M. Li, Z. Liya, G. Jing, H. Zhihong, H. Ying and J. Yanjun, Chem. Commun., 2018, 54(76), 10754–10757 RSC.
- T. Pichandi, D. Natarajan, K. Manikantan Syamala and E. Shanmugam, ACS Sustainable Chem. Eng., 2019, 7(11), 9865–9874 CrossRef.
- M. William, D. J. Christian, F. Hiroyasu, B. Rahul and Y. M. Omar, Am. Chem. Soc., 2008, 130, 12626–12627 CrossRef PubMed.
- S. Fa-Kuen, W. Shao-Chun, L. Sin-Yen and W. C.-W. Kevin, Chem. – Eur. J., 2013, 19, 11139–11142 CrossRef PubMed.
- Z. Feng-Ming, D. Hong, Z. Xin, S. Xiao-Jun, L. Ming, Y. Dou-Dou, L. Xin Liu and W. Jin-Zhi, ACS Appl. Mater. Interfaces, 2017, 9, 27332–27337 CrossRef PubMed.
- X. Wenlei and W. Fei, Energy Convers. Manage., 2019, 198, 111922 CrossRef.
Footnote |
| † Electronic supplementary information (ESI) available. See DOI: 10.1039/d2ma00047d |
| This journal is © The Royal Society of Chemistry 2022 |

