 Open Access Article
Graphitization induced structural transformation of candle soot carbon into carbon nano-onion as a functional anode for metal-ion batteries†
Anil D.
Pathak‡
 *,
Darshna
Potphode‡
and
Chandra S.
Sharma

Creative & Advanced Research Based On Nanomaterials (CARBON) Laboratory, Department of Chemical Engineering, Indian Institute of Technology Hyderabad, Kandi-502285, Telangana, India. E-mail: anildaliprasad@iith.ac.in
First published on 11th March 2022
Abstract
This work reports for the first time the structural transformation of glassy spherical candle soot carbon into graphitic polyhedral carbon nano-onions (multilayer fullerenes) by simple graphitization of candle soot carbon at varying temperatures from 1500 to 2400 °C. This structural transformation of candle soot carbon is thoroughly investigated by high-resolution transmission electron microscopy, X-ray diffraction, and Raman spectroscopy, with the aid of first-principles calculation based on density functional theory to understand the effect on physiochemical properties. Further, this understanding of structural transformation enables a promising pathway to tune the electrochemical properties of graphitized candle soot carbon to develop it as a functional anode for metal-ion (Li-ion as well K-ion) battery applications.
1. Introduction
Fullerenes, especially C60, have attracted great interest in different fields of science and technology due to their appealing chemical, physical, biological, and electrochemical properties.1 Nano-onion-like fullerenes, also called carbon nano-onions (CNOs), are important members of the fullerene family that have been widely studied and used in various applications, including energy storage materials, high-performance and high-temperature wear-resistant materials, superconductive materials, and biomaterials.2 CNOs are zero-dimensional spherical or concentric shell structures of closed carbon shells, multi-layered quasi-spherical, and polyhedral-shaped shells.3 A few methods have been reported to produce carbon onions, including arc-discharge,4 electron irradiation,5 chemical vapor deposition (CVD),6 and nano-diamond annealing.7 Recently, the graphitization of amorphous carbon into a polycrystalline graphitic structure has been reported. Liu et al.8 proposed a strategy to enhance the graphitization and surface area of carbonaceous materials simultaneously, besides N, P co-doping. However, the quality of the obtained graphitized material was poor compared to other reported techniques, such as arc-discharge grown CNTs and mechanically exfoliated graphene.9 Additionally, understanding of the graphitization of amorphous carbon into a polycrystalline graphitic structure is still unclear and remains highly debatable.10However, the cost-effective large-scale production of CNOs is still a challenging task. Therefore, it has limited their commercial availability. It has been reported11 that quasi-spherical carbon nano-onions have an extrapolated price of $3350 million per ton. The huge cost of carbon onions could be due to the high price of nano-diamond precursors (∼$2.4 million per ton) and the production process.11 Therefore, the cost-effective mass production of carbon onions with uniform morphology and size is a bottleneck for their commercial viability and use in device applications.
Here, we report a facile method to produce spherical and polyhedral (hexagonal) carbon nano-onion structured materials by the cost-effective graphitization of low-cost candle soot carbon. Carbon soot is a relatively novel and not-so-well explored carbon nanomaterial among existing carbonaceous materials, consisting of small and ordered graphitic nanostructures and particle sizes ranging from 10 to 50 nm.12,13 Here, we use the graphitization process to transform the amorphous nature of candle soot carbon to the spherical and polyhedral morphology of carbon nano-onions (multi-layer fullerenes) by improvising its lattice order and graphitic content. We comprehensively study the graphitization temperature dependence of the candle soot carbon micro-structure. Candle soot carbon is transformed into spherical carbon and graphitic polyhedral onions as the graphitization temperature increases (1500 to 2400 °C). This provides a toolkit to enhance its applications further. For example, in this work, we report the graphitization of candle soot carbon as a promising way to develop and tune its structural properties to enable its use as a functional anode material for energy storage applications, particularly for lithium and potassium-ion battery development.
2. Results and discussion
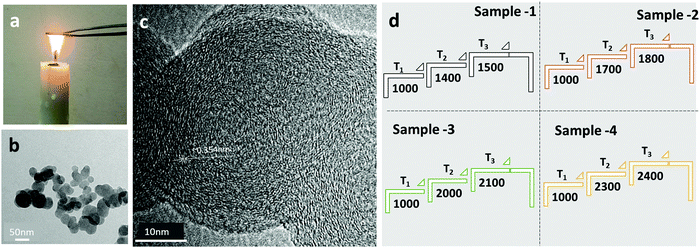
The candle soot carbon was prepared by a flame synthesis process, i.e., direct combustion of a commercial candle in air, as shown in Fig. 1a. The calculated candle soot carbon deposition rate on a stainless-steel sheet (20 cm × 30 cm) is ∼85 mg min−1. The physical and chemical properties of the candle soot carbon depend on the collection of soot from two different regions of the flame. For example, candle soot deposited from the tip of the flame is oxidized, conductive, and contains a lower amount of wax and organic compounds compared to the soot collected from the middle of the flame.14 In this work, carbon candle soot was collected from the tip of the flame over a stainless-steel sheet, as shown in Fig. 1a. The low-resolution transmission electron micrograph (TEM) image (Fig. 1b) indicates that the carbon soot consists of interconnected nanoparticles, forming a fractal (branched) like a network of nanoparticles. At higher magnification (Fig. 1c), candle soot particles (∼45 nm in size) have a short-range ordered graphitic layer with an interlayer spacing of 0.354 nm. Later, high-resolution transmission electron microscope (HRTEM) analysis was used to observe the structural change in candle soot carbon over/after each graphitization temperature. The HRTEM micrograph was also utilized to calculate the interlayer spacing of the microstructure and particle size.The collected candle soot carbon powder was cold-pressed into 12 mm diameter pellets with a uniaxial press. The resultant candle soot pellets were used for graphitization at different temperatures. Graphitization of candle soot pellets was carried out in a graphitization furnace (Make: Nabertherm GMBH) in an inert and high-purity nitrogen (99.99%) atmosphere. The pellet was placed into a tubular furnace with purging by 1.5 L min−1 of N2 gas flow for 15 min. After the initial purging, the N2 gas flow was maintained at 0.5 L min−1 throughout the graphitization process.
The graphitization of candle soot was carried out in a three-step process. (i) the temperature (T1) was raised at a ramp rate of 10 °C min−1, (ii) then, the temperature (T2) was reached at a ramp rate of 5 °C min−1, and (iii) finally, the graphitization temperature (T3) was raised at a ramp rate of 3 °C min−1 and allowed to dwell there for 120 min. The furnace cooled down to room temperature in N2 gas flow with a cooling rate of 30 °C min−1. The conditions for the entire graphitization process of candle soot are described in Fig. 1d.
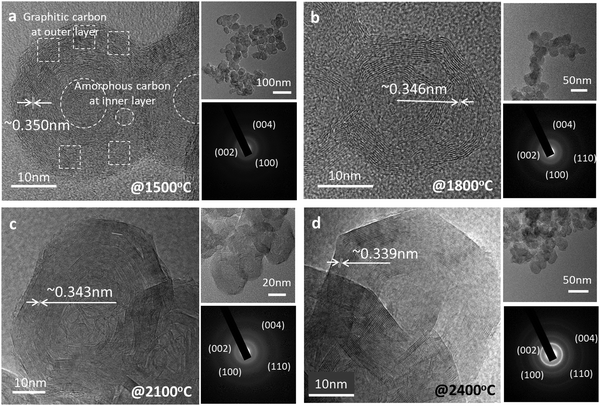
After graphitization at 1500 °C, the morphology of the candle soot particles becomes spherical (Fig. 2a), from quasi-spherical (not symmetrical) observed in the case of bare candle soot (collected directly from the flame). We can observe there is a start to concentric graphite layers with an interlayer distance of 0.350 nm. Still, there are a few amorphous carbon regions with a graphitization trend forming an onion-like structure that also indicates the partial (initial) graphitization of the candle soot carbon. Also, the SAED pattern of the graphitized candle soot at 1500 °C has clear diffraction rings which correspond to the (002), (110), and (004) crystal planes of graphite.15
As the graphitization temperature increases to 1800 °C, the morphology of graphitized candle soot carbon becomes (partially) polyhedral with concentric graphite layers having an interlayer distance of 0.346 nm (Fig. 2b). These (partially) polyhedral carbon onions form more concentric graphite layers at the surface of the onions and fewer at the center. As the graphitization temperature increases further to 2100 °C (Fig. 2c), the candle soot carbon becomes polyhedral and irregular in shape. It has more graphitic content with lattice fringes of 0.343 nm. The SAED pattern also supports this observation and confirms that polyhedral carbon onion has more graphitic content.
However, at 2400 °C, the morphology of the carbon onion is nearly perfectly polyhedral (hexagonal) around 40 nm in diameter without any significant amount of amorphous carbon particles in its structure (Fig. 2d). The polyhedron has a nearly uniform graphitic structure from the surface of the onion towards the center. Also, the lattice fringes of the polyhedral onions are more distinct and straighter than those of the spherical onions of candle soot carbon with an interlayer distance of about 0.339 nm, close to that of the (002) graphite plane. This indicates that candle soot carbon nanoparticles transformed to polyhedral onions have more ordered and concentric graphitic layers, as also shown in the SAED diffraction rings.
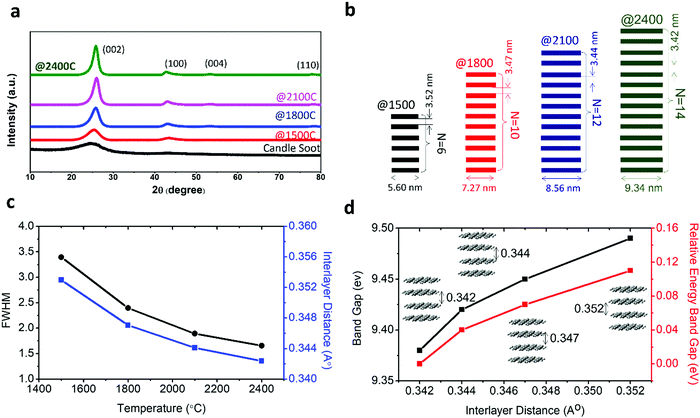
The change in crystallinity during the graphitization of candle soot carbon at varying temperatures was also analyzed using powder X-ray diffractometry with a step size of about 0.02°, as shown in Fig. 3a. A broad and weak diffraction peak at about 26.3° confirms that bare candle soot carbon is amorphous (disordered) with an interlayer spacing (d002) of 0.355 nm. The interlayer spacing (d002) (eqn (S1), ESI†) was calculated from Bragg's law,16 and crystallite height (Lc) along the c-axis (eqn (S2), ESI†) and crystallite size (La) along the a-axis (eqn (S3), ESI†) were evaluated by the Debye–Scherrer formula17 (see Section S1 for more details, ESI†). The calculated structural parameters, interlayer distance d(002), number of graphitic layers (N), and La and Lc of the graphitized candle soot carbon, with temperature are depicted in Fig. 3b.
Peaks at around 25°, 43°, 53° and 78° indicate the diffraction peaks corresponding to the (002) (100), (004) and (110) planes of graphitic carbon.15 The (002) peak is attributed to the stacking structure of graphene layers along the c-axis (i.e., the orientation of the aromatic ring carbon layers in a three-dimensional arrangement).18 The (100) plane mainly represents the hexagonal plane structure of carbon along the a-axis.19 The narrow and high intensities of the (002) and (100) peaks indicate the better orientation and the larger size of the aromatic layer slices, respectively.20 After graphitization at 1500 °C, the intensities of the (002) and (100) diffraction peaks increase; this indicates that the graphitic content in the candle soot carbon structure is enhanced with a closer interlayer spacing of 0.352 nm. The crystallite size (La) and the crystallite height (Lc) also increase, indicating the improvement in the stacking of aromatic ring carbon layers along the c- and a-axes. As the graphitization temperature increases from 1500 °C to 2100 °C, the FWHM peak width decreases, indicating an increase in sp2-bonded graphitic content in the graphitized carbon onion (Fig. 3c).
The calculated d-spacing of graphitized candle soot carbon from XRD analysis is also consistent with our observation from HRTEM (Fig. 2). With increasing temperature, the interlayer distance decreases and causes the two-dimensional microcrystallinity to grow gradually along the a- and c-axes. This is also supported by the calculated crystallite size (La) and the crystallite height (Lc) along the a- and c-axes, respectively. It is interesting to note that the (002) and (100) diffraction peaks become narrow and sharp, while other diffraction peaks of carbon corresponding to the (004) and (110) planes start evolving with increasing graphitization temperature (Fig. 3a). This indicates that the number of parallel graphitic layers increases, and the aromatic graphene layer becomes orderly with higher graphitization temperature.18 At 2400 °C, we achieved higher graphitization of candle soot carbon particles into polyhedral carbon onions with an interlayer spacing of 0.342 nm (comparable to pristine graphite), crystallite size (La) of 4.91 nm, and crystallite height (Lc) of 9.34 nm, with nearly 14 parallel graphitic layers along the c-axis.
To understand the effect of the change in interlayer distance of graphene layers in carbon onions during graphitization on the energy gap, we performed first-principles calculations based on the density functional theory (DFT) (see Section S2 for more details, ESI†). The variation in relative energy gap with interlayer distance is depicted in Fig. 3d. This result indicates that the relative energy gap increases with interlayer distance and can reach up to ∼110 meV at an interlayer distance of 3.52 Å (it is achieved by graphitization at 1500 °C). Thus, we can consider that graphitization is also a promising and controllable way to tune the energy gap of candle soot carbon onions for developing different electronic and semiconductor devices such as p–n junctions, transistors, photodiodes, and lasers.21
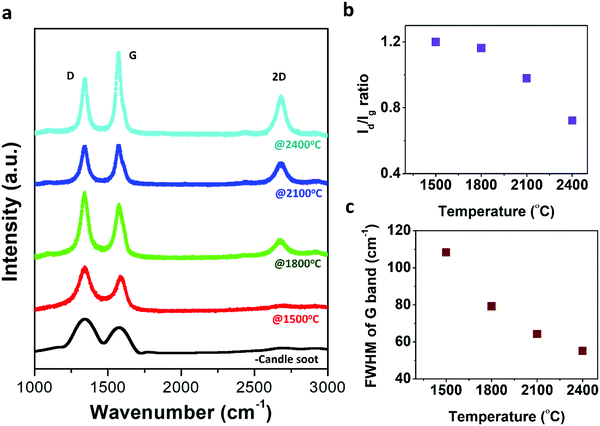
Raman spectroscopy, a non-destructive characterization technique, was applied to understand the microstructural changes occurring during the graphitization process from candle soot carbon to polyhedral carbon onions and to investigate the ordering of the carbon structure during the transformation. Raman spectra were recorded at room temperature on candle soot carbon after graphitization from 1500 °C to 2400 °C, as shown in Fig. 4a.
Raman spectra show two modes; the first-order mode is in the ranges 1000–1800 cm−1 and the second-order is in the range 2200–3100 cm−1. The first-order mode shows the G band and D band around 1347 cm−1 and 1589 cm−1, respectively. The positions of the D band and G band mostly rely on the qualities of the carbonaceous material structure, such as vacancies, grain size, edge defects, dangling bonds, and other disorders.22 The G band is related to the E2g vibrations corresponding to crystalline sp2 domains and bond stretching of all pairs of sp2 atoms in both rings and chains (it is indicative of crystalline graphite content).23 Whereas the D band is observed due to the radial A1g breathing mode of vibration (breathing modes of sp2 atoms in the ring), which, in turn, signifies the presence of defects along with the disordered amorphous carbon content.23 On increasing the graphitization temperature from 1500 °C to 2400 °C, the intensity of the G band monotonically increases with a reduction in the intensity of the D band, indicating an increase in the graphitic content and a reduction in defects with graphitization temperature. At 2400 °C, the intensity of the G band dominated over the D band. The sp2 content was 56% more than the sp3 content (46%), indicating that polyhedral onions consist of more ordered graphitic sp2 planes. This observation can be confirmed with clear and straight lattice fringes of polyhedral candle soot carbon onions, as observed in the HRTEM micrograph. The sp2 and sp3 content were evaluated by calculating the relative area under the D and G bands. The relative intensity of the D to G bands (Id/Ig) is widely used to trace the defects present on carbon structures (i.e., degree of graphitization).24,25Fig. 4b shows the ratio (Id/Ig) decreases with increasing graphitization temperature, indicating the polyhedral carbon onion structure has a more ordered structure and tends to be graphitic. Fig. 4c represents the change in full width at half maximum (FWHM) of the G band with graphitization temperature of the graphitized candle soot carbon material. FWHM of the G band mainly represents the disorder within the carbon sp2 sheets.26 As the graphitization temperature increased, the FWHM decreased, indicating the lower disordered content within the carbon sp2 sheets. The in-plane crystallite thickness for the graphitized carbon structure is calculated using the Tuinstra and Koenig relation La = 4.4(Ig/Id).27 The in-plane crystallite thickness for candle soot carbon increases from 3.6 nm to 6.0 nm, with graphitization temperature ranging from 1500 °C to 2400 °C. It is also implied that the graphitized candle soot carbon onion has a greater number of sp2 domains with less disordered content compared to non-graphitized candle soot carbon.28
Additional peaks (including 2D and combined (D + G)) are observed in the range 2500–2800 cm−1, which reflects the second-order two-phonon process associated with defects arising from all kinds of sp2 carbon materials.29 It can be observed that the 2D band starts evolving and becomes sharp as the graphitization temperature increases. The 2D band in this graphitized carbon material exhibits a doublet structure, which means that the stacking of graphene layers is ordered along the hexagonal axis. It is mainly associated with the splitting of the π and π* electronic states, as a result of interactions between the successive layer planes.23,30 In the case of a one-layer graphene structure, the 2D band forms a singlet, whereas, for two-layer graphene, it exhibits a quadruplet structure.30 Here, the Raman spectrum (2D band) of graphitized carbon onion at 1500 °C is almost indistinguishable from that of a polyhedral carbon onion at 2400 °C. This is due to the 2D band splitting merging into a doublet.30
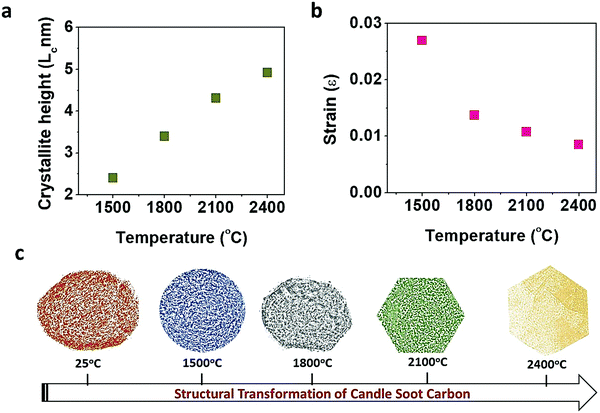
At temperatures above 1500 °C, the transformation of candle soot carbon nanoparticles to carbon nano-onions is initiated by the thermal energy associated with graphitization temperature. As the graphitization temperature increases, more ordered graphitic content develops with decreasing distance between the graphene layer and increasing crystallite size (Lc), as shown in Fig. 5a. The calculated activation energy (please refer eqn (S4) and (S5), ESI†) for the transformation of candle soot carbon nanoparticles to polyhedral carbon nano-onions is 8.74 kcal mol−1 with a pre-exponential constant of 0.002 (see Section S3 for more details, ESI†). Here, the activation energy for the graphitization of candle soot carbon particles is comparably lower than for the graphitization of other precursor materials.31 This may be due to the nano-effect of candle soot carbon particles, as the kinetics of nanomaterials is much faster than for bulk materials.32
The change in lattice orientation during graphitization can also be analyzed using the XRD pattern. Williamson and Hall reported that the observed XRD diffraction line broadening (FWHM) is due to crystallite size and micro-strain. Therefore, we used the diffraction patterns of graphitized candle soot carbon to evaluate the average crystallite size (dXRD) and microstrain (ε) at each graphitization temperature using the Williamson–Hall (W–H) relation (eqn (S6), ESI†)33,34 (see Section S4 for more details, ESI†). The W–H curve for candle soot carbon with graphitization temperature (Fig. 5b) indicates that the strain present in the sample is compressive. This compressive strain in the material leads to the overall contraction of a particle with a reduction in interlayer spacing, which induces curvature across the carbon nano-onion and may form polyhedral (hexagonal) rings, as observed in the TEM images. As the graphitization temperature increases, the decrease in compressive strain may be due to the reduction in lattice imperfections, as observed in TEM, XRD, SAED, and Raman analyses.35 Similarly, it has been observed that when a carbon onion is exposed to electron irradiation it undergoes self-compression, leading to the formation of pentagonal and heptagonal rings that induce curvature in the network.36
The observed size of hexagonal carbon onions in the TEM micrograph is slightly smaller than the initial size of candle soot carbon nanoparticles. The decrease in the volume/size of the graphitized polyhedral carbon onion may be caused by the compressive stress and difference in the densities between the hard carbon nature of candle soot carbon (the density of hard carbon is ∼1.45–1.55) and the more graphitic nature of the polyhedral carbon onion (the density of graphite is ∼2.15–2.25).37 The present study also clarifies that the polyhedral onions have a more ordered graphitic sp2 content and are energetically favorable at a higher temperature of graphitization (2400 °C) than spherical carbon onions obtained from graphitization of candle soot carbon at 1500 °C. A similar type of transformation and behavior is also observed in the case of CNTs.38 It has been observed that normal nanotubes with circular shapes are energetically favorable at low temperatures. However, the configurational entropy accompanied by Stone–Wales defect creation at high temperatures makes polygonal nanotubes or nanofibers. These polygonal structures are thermodynamically more stable and contain less aromatic graphene interlayer spacing.38 Here, spherical candle soot carbon onion is also energetically more stable at low temperature, as observed through TEM analysis. However, at high temperatures the polygonal (hexagonal) onion structure is more favorable with a reduction in graphene interlayer spacing, as observed in TEM and XRD patterns.
The TEM micrograph and Raman spectra show that the candle soot carbon and graphitized spherical carbon nano-onions consist of small domains of graphitic sp2 sheets with defects in the structure. Therefore, π-electrons in candle soot carbon and spherical carbon onions are mostly localized in small domains, which cannot actively take part in the conduction of electrons.39 However, the graphitization temperature increases the polyhedral carbon onion form with more graphitic sp2 sheets, reduces graphene interlayer spacing, and decreases the number of defects, resulting in the delocalization of π electrons.37 Therefore, our studies along with other findings37,39 strongly confirm that the structure of spherical onions is energetically favoured at low temperatures and far from the perfectly closed graphitic structure. In contrast, polyhedral carbon onions at high temperatures are thermodynamically more stable (Fig. 5c), accompanied by a highly ordered graphitic structure, with a reduction in the graphene interlayer spacing and more conduction π electrons within it. Further, we have measured the electrical conductivities of directly collected candle soot carbon (CCSC) and graphitized candle soot carbon at 2400 °C (GCSC). The electrical conductivities of CCSC and GCSC measured from the I–V characteristic curves obtained by linear sweep voltammetry. The current response is recorded by varying the voltage from 1 to 4.0 V with a scan rate of 0.01 V s−1. The current response varies linearly with the applied voltage between the two probes at a fixed distance. The slope of the linear fit of the curves is used to obtain the conductivity of the samples. The conductivities for CCSC and GCSC are calculated to be 0.13 and 0.20 S cm−1. The electrical conductivity of GCSC was found to be the higher due to the high amount of ordered graphitic domains obtained during the graphitization process, as discussed in the previous section.
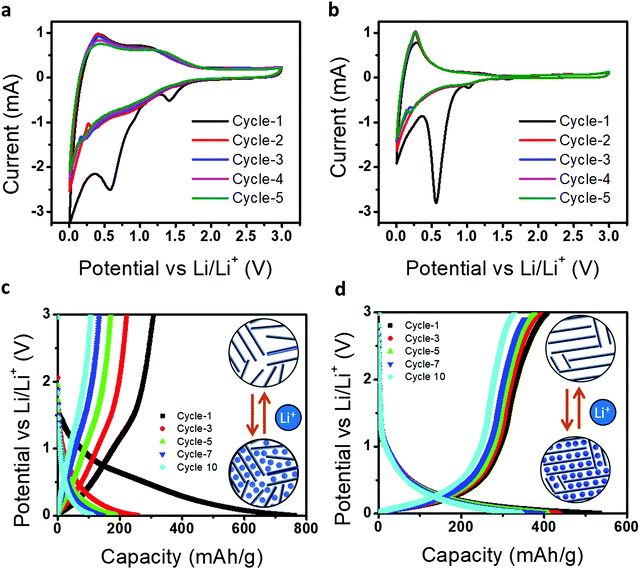
Further, we demonstrated graphitized candle soot carbon as an anode material for a metal-ion battery and how their structural transformation engineered the tuning of the electrochemical performance. Fig. 6a and b represents the cyclic voltammetry curves of directly collected candle soot carbon (CCSC) and graphitized candle soot carbon at 2400 °C (GCSC) at a scan rate of 0.1 mV s−1 between 0.05 and 3.0 V. Galvanostatic charge–discharge was carried out at 50 mA g−1 for all measurements. In the first discharge cycle for CCSC, there are two distinct reduction peaks at approximately 1.40 and 0.60 V (vs. L i+/Li) and for GCSC they are at 1.0 and 0.55 V, which is mainly attributed to electrolyte decomposition and the formation of a protective solid electrolyte interphase (SEI).40 However, the peak (0.15–0.25 V) during the anodic scan indicates the removal of adsorbed/de-intercalation of Li-ions from the carbon structure.41
After the first cycle, GCSC shows stable CV curves in terms of shape and current density over the CCSC, indicating that the graphitization of CCSC at 2400 °C (GCSC) increases the graphitic content and efficient lithiation/de-lithiation over the GCSS. Fig. 6c and d show the electrochemical charge–discharge profiles of CCSC and GCSC, with a cut-off voltage of 0.005 to 3.0 V at a current density of 100 mA g−1, respectively. In the first cycle, CCSC offers high discharge capacity (762 mA h g−1) but suffers from low Coulombic efficiency (40.2%). Whereas GCSC shows an initial discharge capacity of 534 mA h g−1 with an improved Coulombic efficiency of 76.4%. Here CCSC offers a high initial discharge capacity (762 mA h g−1) but shows low capacity in the following cycles compared to GCSC because CCSC has a more disordered structure consisting of numerous structural defects (e.g., defects, edges, and residual heteroatoms) which provide plenty of storage sites with a wide distribution of binding energies for metal-ions.42 The presence of a more disordered structure in CCSC results in a high initial discharge capacity with SEI formation, electrolyte decomposition and irreversible Li+ capture. Furthermore, CCSC and GCSC have graphitic as well as disordered contents (from Raman analysis); therefore metal-ion storage in CCSC and GCSC materials possesses both sloping and plateau voltage regions, involving an intercalation mechanism, adsorption mechanism, and capacitive mechanism. However, CCSC achieved more capacity (discharge/charge curve) in the sloping voltage region because of the adsorption of ions on the surface of active sites (edge carbon fragments and heteroatoms such as oxygen and hydrogen) while the GCSC achieved the capacity in a low-voltage plateau region which is attributed to metal-ion intercalation/deintercalation into the graphitic layers.43
Further, during cycling of GCSC over CCSC, the discharge plateaus shift down (positively) and the charge plateaus shift up (negatively), indicating that the structural transformation of candle soot carbon into carbon nano-onion lowers the polarization and increases the Li-ion cell reversibility.
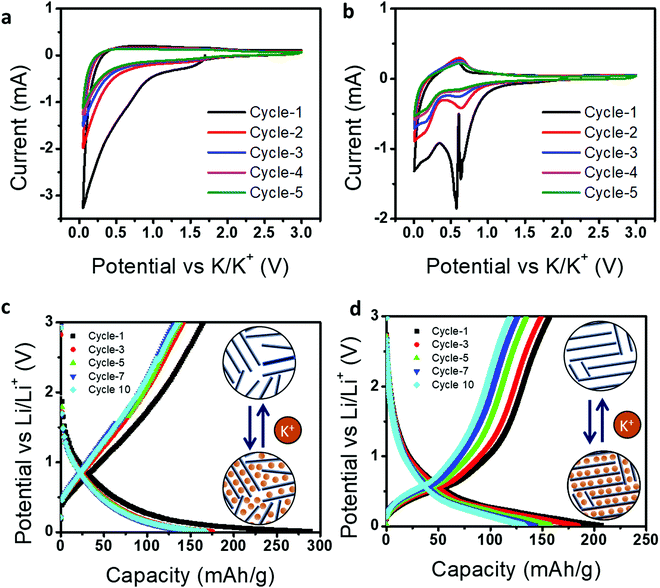
Next, we demonstrated the use of CCSC and GCSC in a K-ion battery and their relative electrochemical performances. The graphite anode used in a potassium-ion battery has a limited theoretical capacity of 279 mA h g−1 with poor cyclic stability compared to an Li-ion battery;44 therefore, it may be advantageous to use glassy carbon as an anode. Fig. 7a and b represent cyclic voltammetry (CV) curves for five cycles at a scan rate of 0.1 mV s−1 in a voltage range of 0.01–3.0 V (vs. K+/K).
For CCSC, the broad cathodic reduction peaks located at ∼0.6 and ∼0.01 V and anodic peaks located at 0.3 V correspond to the formation of a solid–electrolyte interface (SEI), intercalation, and de-intercalation of K-ions in CCSC, respectively.45 Whereas GCSC has a cathodic peak located at ∼0.78 V and 0.65–0.7 V, and an anodic peak located at 0.68 V, representing the formation of SEI,46 insertion of potassium ions, and extraction of potassium ions in GCSC,47 respectively. Here, CCSC shows relatively broad cathodic and anodic profiles for the CV curves compared to GCSC. This indicates that CCSC has high surface-driven storage of K-ions due to the presence of disordered carbon and multiple defects, as revealed in Fig. 2 and 3.
Further the K-ion storage performance of CCSC and GCSC was analyzed by galvanostatic charge–discharge, as shown in Fig. 7c and d. In the first cycle, CCSC shows a lower Coulombic efficiency (56.9%) than GCSC because CCSC contains many defective structures, leading to irreversible K-ion trapping and more SEI formation. We should also note that the initial Coulombic efficiency of CCSC is improved for the K-ion system (56.9%) compared to the Li-ion system (40.2%). This shows the advantage of the glassy nature of CCSC as an anode for a K-ion battery. However, as GCSC has a better degree of graphitization with limited defective structures, it still leads in terms of reversible and more efficient K-ion intercalation with higher Coulombic efficiency (76.2%). Further, it can be observed that charge–discharge curves of CCSC contain a highly sloping region with higher voltage, whereas GCSC shows a low sloping region at a lower voltage. This GCD behavior indicates that CCSC possesses surface-induced K-ion storage due to the presence of defects with amorphous carbon content. Whereas GCSC shows K-ion intercalation/de-intercalation due to the presence of a more graphitic structure. Thus, this study suggests that the electrochemical behaviors of energy storage devices are highly dependent on structural transformation and, therefore, by simply tuning the graphitization conditions of candle soot carbon materials, one can extend their utilization for wider electrochemical applications.
3. Conclusion
This work reports a facile method of preparing a spherical and polyhedral (hexagonal) carbon nano-onion structure by graphitization of candle soot carbon in the temperature range 1500 °C–2400 °C. The structural transformation of candle soot carbon with graphitization temperature was thoroughly investigated and it was observed that the structure of spherical onions is energetically favored at low graphitization temperature (1500 °C). However, the structure of polyhedral carbon onions is thermodynamically more stable at high graphitization temperature (2400 °C). Polyhedral carbon onions have a highly graphitic ordered structure, reduced graphene interlayer spacing, and greater crystallite size along the a- and c-axes compared to spherical onions. Thus, this work provides a mechanistic understanding and structural transformation of candle soot amorphous carbon into spherical and polyhedral graphitic carbon nano-onions. This study will also open new and unprecedented avenues for future research in graphitized candle soot carbon and tune its properties as a functional material, as described in this work as a case study for Li-ion and K-ion battery applications.Conflicts of interest
Authors have no conflicts of interest to disclose.Acknowledgements
The authors acknowledge Dr Akhilesh Kumar Singh at IIT Bhubaneswar for providing computational resources for DFT calculations.References
- H. Gergeroglu, S. Yildirim and M. F. Ebeoglugil, SN Appl. Sci., 2020, 2, 603 Search PubMed.
- B. Xu, New Carbon Mater., 2008, 23, 289–301 Search PubMed.
- A. Albu-Yaron, M. Levy, R. Tenne, R. Popovitz-Biro, M. Weidenbach, M. Bar-Sadan, L. Houben, A. N. Enyashin, G. Seifert, D. Feuermann, E. A. Katz and J. M. Gordon, Angew. Chem., Int. Ed., 2011, 50, 1810–1814 Search PubMed.
- N. Sano, H. Wang, I. Alexandrou, M. Chhowalla, K. B. K. Teo, G. A. J. Amaratunga and K. Iimura, J. Appl. Phys., 2002, 92, 2783–2788 Search PubMed.
- H. E. Troiani, A. Camacho-Bragado, V. Armendariz, J. L. Gardea Torresday and M. Jose Yacaman, Chem. Mater., 2003, 15, 1029–1031 Search PubMed.
- C. Ruan, Z. Li, D. Zhang, X. Yuan, C. Liang, Y. Chang, H. Huang, L. Xu and M. Chen, Carbon, 2020, 161, 622–628 Search PubMed.
- L. Hawelek, A. Brodka, S. Tomita, J. C. Dore, V. Honkimäki and A. Burian, Diamond Relat. Mater., 2011, 20, 1333–1339 Search PubMed.
- H. Liu, W. Zeng, Y. Yang, J. Chen, Y. Zhao and S. Mu, J. Mater. Chem. A, 2021, 9, 1260–1268 Search PubMed.
- A. Barreiro, F. Börrnert, S. M. Avdoshenko, B. Rellinghaus, G. Cuniberti, M. H. Rümmeli and L. M. K. Vandersypen, Sci. Rep., 2013, 3, 1115 Search PubMed.
- G. C. Loh and D. Baillargeat, J. Appl. Phys., 2013, 114, 33534 Search PubMed.
- X. Liu, J. Ren, G. Licht, X. Wang and S. Licht, Adv. Sustainable Syst., 2019, 3, 1900056 Search PubMed.
- S. Singh and N. Verma, Int. J. Hydrogen Energy, 2015, 40, 1145–1153 Search PubMed.
- S. Singh and N. Verma, Int. J. Hydrogen Energy, 2015, 40, 5928–5938 Search PubMed.
- C.-J. Liang, J.-D. Liao, A.-J. Li, C. Chen, H.-Y. Lin, X.-J. Wang and Y.-H. Xu, Fuel, 2014, 128, 422–427 Search PubMed.
- T. Ungár, J. Gubicza, G. Ribárik, C. Pantea and T. W. Zerda, Carbon, 2002, 40, 929–937 Search PubMed.
- K. T. Jeng, S. F. Lee, G. F. Tsai and C. H. Wang, J. Power Sources, 2004, 138, 41–50 Search PubMed.
- C. Ganesh Kumar, S. Pombala, Y. Poornachandra and S. V. Agarwal, Synthesis, characterization, and applications of nanobiomaterials for antimicrobial therapy, in Nanobiomaterials in Antimicrobial Therapy, ed. A. M. Grumezescu, William Andrew Publishing, 2016, pp. 103–152 Search PubMed.
- T. Qiu, J.-G. Yang, X.-J. Bai and Y.-L. Wang, RSC Adv., 2019, 9, 12737–12746 Search PubMed.
- J. L. Santos, M. A. Centeno and J. A. Odriozola, J. Anal. Appl. Pyrolysis, 2020, 148, 104821 Search PubMed.
- W. Li and Y. Zhu, Energy Fuels, 2014, 28, 3645–3654 Search PubMed.
- Y. Zhang, T.-T. Tang, C. Girit, Z. Hao, M. C. Martin, A. Zettl, M. F. Crommie, Y. R. Shen and F. Wang, Nature, 2009, 459, 820–823 Search PubMed.
- S. Stankovich, D. A. Dikin, R. D. Piner, K. A. Kohlhaas, A. Kleinhammes, Y. Jia, Y. Wu, S. T. Nguyen and R. S. Ruoff, Carbon, 2007, 45, 1558–1565 Search PubMed.
- L. Bokobza, J.-L. Bruneel and M. Couzi, C, 2015, 1(1), 77–94 Search PubMed.
- T. Palaniselvam, H. B. Aiyappa and S. Kurungot, J. Mater. Chem., 2012, 22, 23799–23805 Search PubMed.
- V. M. Samoilov, D. B. Verbets, I. A. Bubnenkov, N. N. Steparyova, A. V. Nikolaeva, E. A. Danilov, D. V. Ponomareva and E. I. Timoshchuk, Inorg. Mater. Appl. Res., 2018, 9, 890–899 Search PubMed.
- D. S. Knight and W. B. White, J. Mater. Res., 1989, 4, 385–393 Search PubMed.
- P. Puech, M. Kandara, G. Paredes, L. Moulin, E. Weiss-Hortala, A. Kundu, N. Ratel-Ramond, J.-M. Plewa, R. Pellenq and M. Monthioux, C, 2019, 5(4), 69 Search PubMed.
- G. Irmer and A. Dorner-Reisel, Adv. Eng. Mater., 2005, 7, 694–705 Search PubMed.
- R. Pathak, K. Chen, A. Gurung, K. M. Reza, B. Bahrami, F. Wu, A. Chaudhary, N. Ghimire, B. Zhou, W.-H. Zhang, Y. Zhou and Q. Qiao, Adv. Energy Mater., 2019, 9, 1901486 Search PubMed.
- A. C. Ferrari and D. M. Basko, Nat. Nanotechnol., 2013, 8, 235–246 Search PubMed.
- J. A. Newell, D. D. Edie and E. L. Fuller Jr., J. Appl. Polym. Sci., 1996, 60, 825–832 Search PubMed.
- Q.-S. Fu, Y.-Q. Xue, Z.-X. Cui and M.-F. Wang, J. Nanomater., 2014, 2014, 856489 Search PubMed.
- G. K. Williamson and W. H. Hall, Acta Metall., 1953, 1, 22–31 Search PubMed.
- I. F. Cruz, C. Freire, J. P. Araújo, C. Pereira and A. M. Pereira, in Micro and Nano Technologies, ed. A. A. El-Gendy, J. M. Barandiarán and R. L. B. T.-M. N. M. Hadimani, Elsevier, 2018, pp. 59–116 Search PubMed.
- A. K. Kole and P. Kumbhakar, Results Phys., 2012, 2, 150–155 Search PubMed.
- Y. Gan and F. Banhart, Adv. Mater., 2008, 20, 4751–4754 Search PubMed.
- S. Tomita, T. Sakurai, H. Ohta, M. Fujii and S. Hayashi, J. Chem. Phys., 2001, 114, 7477–7482 Search PubMed.
- M. Yoon, J. Howe, G. Tibbetts, G. Eres and Z. Zhang, Phys. Rev. B: Condens. Matter Mater. Phys., 2007, 75, 165402 Search PubMed.
- G. Treboux, P. Lapstun and K. Silverbrook, Chem. Phys. Lett., 1999, 302, 60–64 Search PubMed.
- X.-L. Wu, Q. Liu, Y.-G. Guo and W.-G. Song, Electrochem. Commun., 2009, 11, 1468–1471 Search PubMed.
- T. Wang, Y. Wang, G. Cheng, C. Ma, X. Liu, J. Wang, W. Qiao and L. Ling, Energy Fuels, 2020, 34, 8911–8918 Search PubMed.
- Y. Huang, Y. Wang, P. Bai and Y. Xu, ACS Appl. Mater. Interfaces, 2021, 13, 38441–38449 Search PubMed.
- R. Ding, Y. Huang, G. Li, Q. Liao, T. Wei, Y. Liu, Y. Huang and H. He, Front. Chem., 2020, 8, 1175 Search PubMed.
- Z. Tang, Y. Wang, Z. Zheng and X. Luo, J. Mater. Chem. A, 2021, 9, 9191–9202 Search PubMed.
- G. Wang, X. Xiong, D. Xie, Z. Lin, J. Zheng, F. Zheng, Y. Li, Y. Liu, C. Yang and M. Liu, J. Mater. Chem. A, 2018, 6, 24317–24323 Search PubMed.
- E. Zhang, X. Jia, B. Wang, J. Wang, X. Yu and B. Lu, Adv. Sci., 2020, 7, 2000470 Search PubMed.
- M. Wang, Y. Zhu, Y. Zhang, T. Yang, J. Duan and C. Wang, Electrochim. Acta, 2021, 368, 137649 Search PubMed.
Footnotes |
| † Electronic supplementary information (ESI) available. See DOI: 10.1039/d2ma00042c |
| ‡ Equal contribution. |
| This journal is © The Royal Society of Chemistry 2022 |

