
 Open Access Article
 This Open Access Article is licensed under a Creative Commons Attribution-Non Commercial 3.0 Unported Licence
Eldfellite-type cathode material, NaV(SO4)2, for Na-ion batteries†
Akira
Nishio
 *a,
Yuji
Ishado
b,
Kosuke
Nakamoto
b,
Eiichi
Kobayashi
c,
Atsushi
Inoishi
*b,
Hikari
Sakaebe
b and
Shigeto
Okada
b
*a,
Yuji
Ishado
b,
Kosuke
Nakamoto
b,
Eiichi
Kobayashi
c,
Atsushi
Inoishi
*b,
Hikari
Sakaebe
b and
Shigeto
Okada
b
aInterdisciplinary Graduate School of Engineering Sciences, Kyushu University, 6-1 Kasuga-koen, Kasuga, Fukuoka 816-8580, Japan. E-mail: an40uvd@gmail.com; inoishi@cm.kyushu-u.ac.jp
bInstitute for Materials Chemistry and Engineering, Kyushu University, 6-1 Kasuga-koen, Kasuga, Fukuoka 816-8580, Japan
cKyushu Synchrotron Light Research Center, 8-7 Yayoigaoka, Tosu, Saga 841-0005, Japan
First published on 30th June 2022
Abstract
In this research, an eldfellite-type material containing V as a transition metal, NaV(SO4)2, was investigated to achieve higher potentials and capacities through the use of a multi-redox pair. Average working potentials of 3.9 and 2.1 V vs. Na/Na+ were observed, and a large reversible capacity of 102 mA h g−1 was obtained over a wide potential range. Moreover, X-ray absorption near-edge structure and near-edge X-ray absorption fine structure measurements revealed that only V contributes to the charge compensation in the sodiation/desodiation process at low potentials, whereas both V and O contribute to the desodiation/sodiation process at high potentials. This phenomenon was also supported by the density of states and Bader charge analysis based on the DFT calculations.
Introduction
With the spread of renewable energy, the demand for large storage batteries as buffers is increasing. For this need, minor metal free Na-ion batteries are attractive as rechargeable batteries with excellent cost performance. However, since the ionic volume of Na is twice that of Li, the Na+ diffusivity in the electrodes of Na-ion batteries is less favorable than that of Li-ion batteries. In addition, because the standard electrode potential of Na (−2.71 V vs. standard hydrogen electrode (SHE)) is ∼0.3 V higher than that of Li (−3.04 V vs. SHE), the working voltage of a sodium-ion battery is lower than that of a lithium-ion battery.To overcome these defects, polyanionic materials have been investigated as promising cathode active material groups for Na-ion batteries that fulfil the two requirements of the corner-sharing framework with a large bottleneck for Na+ diffusion and an increase of the redox potential through an inductive effect.1–4 The corner-sharing structures of MO6 (M is a 3d transition metal) octahedra and XO4 (X is a heteroelement such as Si, P, S, As, Mo, W, etc.) tetrahedra such as NASICON-type NaaM2(XO4)3 form a suitable bottleneck for the three-dimensional diffusion of Na+ ions. Among these heteroelements, polyanions with highly electro-negative heteroelements such as sulfur have an inductive effect on the electrode potential due to their strong electronic attraction.5–8
So far, the following sulfates with a Fe2+/Fe3+ redox couple have been reported as cathode active materials for Na-ion batteries: Na2Fe2(SO4)3 (3.8 V (vs. Na/Na+)),9 Na2Fe(SO4)2 (3.6 V),10 NaFeSO4F (3.5 V),11,12 NaFe(SO4)2 (3.3 V),13 Na2Fe(SO4)2·2H2O (3.25 V),14 Fe2(SO4)3 (3.2 V),15,16 and NaF–FeSO4 (3.0 V).17 Although there are some variations in the potential, it is noteworthy that sulfates show a higher potential of about 1 V than phosphates such as Na3Fe2(PO4)3 (2.5 V).18–20 On the other hand, the disadvantage of the polyanionic cathode is that the theoretical capacity is limited by the heavy molecular weight. In particular, eldfellite-type NaFe(SO4)2 (theoretical capacity: 99 mA h g−1), which contains a large amount of polyanions relative to Fe, has a theoretical capacity 25% smaller than NASICON-type Na2Fe2(SO4)3 (theoretical capacity: 134 mA h g−1). However, this disadvantage of eldfellite can be reversed by replacing Fe with V, which is capable of not only M2+/M3+ but also the M3+/M4+ redox. This is because eldfellite-type NaxV(SO4)2 has a theoretical capacity of 201 mA h g−1 in the composition range of 0 < x < 2, while NASICON-type NaxV2(SO4)3 has only a theoretical capacity of 137 mA h g−1 in the composition range of 0 < x < 2.
For NaV(SO4)2, crystallographic studies and simple synthesis methods have already been reported.21–23 High potentials of 2.42 and 4.61 V against Na/Na+ have been predicted for the V2+/V3+ and V3+/V4+ redoxes by DFT calculations by Banerjee et al.24 However, to the best of our knowledge, no experimental studies on the electrochemical properties of NaV(SO4)2 have yet been reported.
In the present study, eldfellite-type NaV(SO4)2 was synthesized using a sol–gel method and the reversible capacity exceeding one electron reaction was confirmed in a wide voltage range between 1.5 and 4.8 V. The charge–discharge reaction mechanism was clarified through various ex situ measurements using X-rays in a laboratory or a synchrotron light facility, and these results were confirmed by computational calculations.
Experimental
Materials synthesis
NaV(SO4)2 powder was synthesized according to the reported method.23 H2C2O4·2H2O (FUJIFILM Wako; min 99.5–102.0%) and V2O5 (Nacalai Tesque; min 99.0%) were mixed and agitated in ultrapure water at 80 °C for 1 h using a hotplate stirrer. The solution was initially orange and changed to green and then blue, indicating that V was reduced from the pentavalent to the tetravalent state. (NH4)2SO4 (FUJIFILM Wako; min 99.5%) and Na2SO4 (FUJIFILM Wako; min 99.0%) were then added, and the resultant aqueous solution was continuously stirred at 80 °C for 4 h. The solution was evaporated to dryness in an electric furnace at 120 °C for 12 h, resulting in a precursor powder. Finally, 0.8 g of the precursor powder was placed in an alumina crucible and heated in a tubular furnace at 375 °C (0.5 °C min−1 heating rate) for 9 h under flowing Ar + 5% H2 gas. Each reaction process in this synthesis, as previously reported,23 is shown below:| V2O5 + 3H2C2O4·2H2O → 2VOC2O4 + 9H2O + 2CO2 |
| 2VOC2O4 + Na2SO4 + 3(NH4)2SO4 → 2NaV(SO4)2 + 6NH3 + 3H2O + 3CO2 + CO |
Materials characterization
The powder X-ray diffraction (XRD) patterns of NaV(SO4)2 were recorded to identify its crystal structure at room temperature. The profiles were obtained using an X-ray diffractometer (TTRIII; Rigaku) equipped with a Cu Kα radiation source. The samples were measured in steps of 0.01° in the 2θ angular range from 10° to 130° at a scan rate of 0.1° min−1. An enclosed sample holder was used to exclude the effects of moisture in the air. The crystal structure was refined using the RIETAN-FP program,25 and the crystal models were visualized using the VESTA software.26 The sample morphology was observed by field-emission scanning electron microscopy (FE-SEM, JSM-IT700HR; JEOL).Electrochemical characterization
NaV(SO4)2 and acetylene black (AB, Denka) were mixed in a ratio of 70![[thin space (1/6-em)]](https://www.rsc.org/images/entities/char_2009.gif) :25 (by weight) using the ball-milling method (Premium line P-7; Fritsch) at 200 rpm for 3 h under an Ar atmosphere to increase the electronic conductivity of the electrode. The cathode was then prepared by blending the composite with a polytetrafluoroethylene (PTFE, Daikin) binder in a ratio of 95:5 (by weight) and then drying the electrode material at 80 °C under vacuum for 12 h. For electrochemical measurements, 2032 coin-type cells (Hohsen Co.) were washed ultrasonically with acetone and dried at 120 °C under vacuum before being transferred to a glove box for cell assembly. Na metal (Sigma-Aldrich) was used as the counter and reference electrode. A polypropylene separator (Celgard) and a glass-fiber filter (GA-55; Advantec) were used as a separator in the cell. A 1 M NaPF6 solution in ethylene carbonate (EC):diethyl carbonate (DEC) (1:1 by volume) (Tomiyama Pure Chemical) or a 1 M NaClO4 solution in EC:dimethyl carbonate (DMC) (1:1 by volume) (Tomiyama Pure Chemical) was used as the electrolyte. All cathodes and cells were produced and assembled in an Ar-filled glove box (dew point < −80 °C). Electrochemical charge–discharge measurements were conducted via the galvanostatic method using a charge–discharge cycle instrument (BTS2400W; Nagano Electric Co.). The current density was 0.2 mA cm−2, and the galvanostatic measurements were conducted in a thermostat chamber at 25 °C.
:25 (by weight) using the ball-milling method (Premium line P-7; Fritsch) at 200 rpm for 3 h under an Ar atmosphere to increase the electronic conductivity of the electrode. The cathode was then prepared by blending the composite with a polytetrafluoroethylene (PTFE, Daikin) binder in a ratio of 95:5 (by weight) and then drying the electrode material at 80 °C under vacuum for 12 h. For electrochemical measurements, 2032 coin-type cells (Hohsen Co.) were washed ultrasonically with acetone and dried at 120 °C under vacuum before being transferred to a glove box for cell assembly. Na metal (Sigma-Aldrich) was used as the counter and reference electrode. A polypropylene separator (Celgard) and a glass-fiber filter (GA-55; Advantec) were used as a separator in the cell. A 1 M NaPF6 solution in ethylene carbonate (EC):diethyl carbonate (DEC) (1:1 by volume) (Tomiyama Pure Chemical) or a 1 M NaClO4 solution in EC:dimethyl carbonate (DMC) (1:1 by volume) (Tomiyama Pure Chemical) was used as the electrolyte. All cathodes and cells were produced and assembled in an Ar-filled glove box (dew point < −80 °C). Electrochemical charge–discharge measurements were conducted via the galvanostatic method using a charge–discharge cycle instrument (BTS2400W; Nagano Electric Co.). The current density was 0.2 mA cm−2, and the galvanostatic measurements were conducted in a thermostat chamber at 25 °C.
Ex situ X-ray measurements
Ex situ XRD measurements were performed to characterize the phase transitions during the charge–discharge processes. The XRD patterns were recorded at room temperature using an X-ray diffractometer (TTRIII; Rigaku) equipped with a Cu Kα radiation source. The measurements were performed in steps of 0.01° in the 2θ angular range from 10° to 40° at a scan rate of 0.02° min−1. The samples were obtained from coin cells disassembled in an Ar-filled glove box (dew point < −80 °C) after the electrochemical measurements and were dried under vacuum after being washed with DMC (Kishida Chemical) to remove the electrolyte on the pellet surface. An enclosed sample holder was used to exclude the effects of moisture in the air.Ex situ X-ray photoelectron spectroscopy (XPS) measurements were conducted with Al Kα radiation using an ESCA 1600 (ULVAC-PHI) spectrometer. The samples were prepared in the same manner as those for ex situ XRD analysis. The obtained binding-energy data were corrected using the signal of adventitious carbon added to prevent charging up of the sample.
Ex situ X-ray absorption near-edge structure (XANES) measurements and ex situ near-edge X-ray absorption fine structure (NEXAFS) measurements were performed at the BL11 beamline (2100–23000 eV), BL12 beamline (40–1500 eV), and BL15 beamline (3500–23000 eV) of the Saga Light Source. Synchrotron radiation was used in the transmission mode (TM) for XANES measurements and the total fluorescence yield (TFY) mode for NEXAFS measurements at room temperature to determine the oxidation state of V during the charging and discharging processes. The samples were prepared using the same procedure described for the XPS samples, including washing with DMC. XANES data analysis was performed using the Athena software.27
For the XPS and NEXAFS measurements, a sample transfer vessel was used to avoid exposure to the air and to achieve a high-vacuum condition before the sample was introduced into the apparatus.28,29
Computational calculations
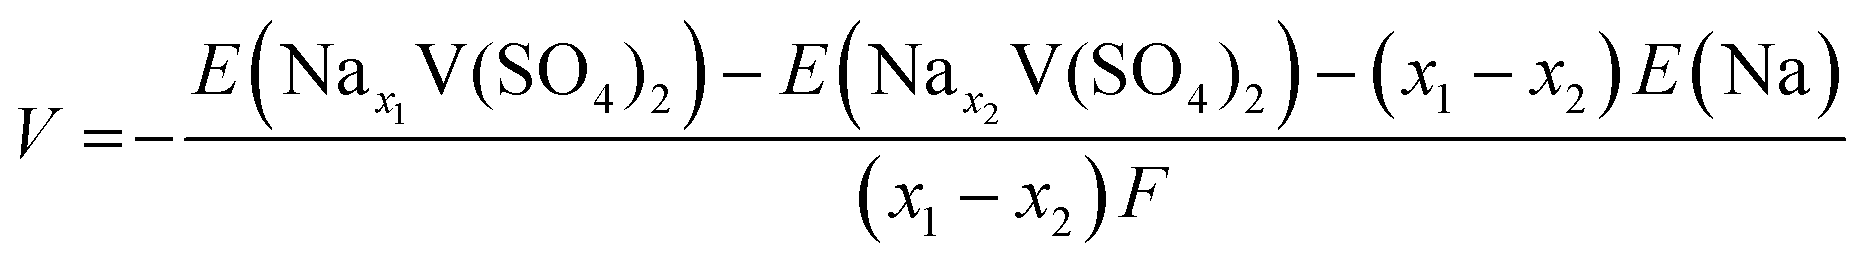
First-principles calculations using density functional theory (DFT) were performed with the Vienna Ab initio Simulation Package (VASP).30,31 The projector augmented-wave (PAW) method was used,32,33 and the plane-wave cutoff energy was set to 520 eV. The Perdew–Burke–Ernzerhof (PBE) exchange–correlation functional was applied.34 The Hubbard U value for vanadium was set to 4.0 eV. The pymatgen package in Python was used for all DFT calculations to generate input files and analyze the results.35 A unit cell (C2/m) was used for the calculations, and a Γ-centered 4 × 4 × 4 k-point mesh was used for the density of state (DOS) and electronic structure calculations. The 30 structures with the lowest electrostatic energies for each composition were subjected to the DFT calculations using the Supercell program,36 and the most stable configuration was determined. The average voltage between each composition of NaxV(SO4)2 was obtained using the equationwhere E(Nax1V(SO4)2), E(Nax2V(SO4)2), and E(Na) are DFT energies of Nax1V(SO4)2, Nax2V(SO4)2, and Na metal, respectively. The Bader charge analysis was conducted on the basis of the calculation results of DOS using the Bader analysis program developed by Henkelman et al.37–39
Results and discussion
Computational calculations for NaxV(SO4)2
The structural optimization was performed to evaluate the characteristics of NaV(SO4)2 for each sodiated/desodiated composition. The first state formed a stable eldfellite structure with a monoclinic prismatic crystal class. Fig. 1a shows the formation energy convex hull construction of NaxV(SO4)2. The formation energy of the composition x = 1.5 is above the convex hull line, which means that this composition is unstable. Therefore, the compositions of x = 0, 0.5, 1, and 2 in NaxV(SO4)2 were adopted for further calculations and analyses. Fig. 1b shows the DFT-calculated average potential profiles of NaxV(SO4)2 (x = 0, 0.5, 1, and 2). Two potential plateaus are identified at ∼2.2 and ∼4.6 V, with two more-detailed potential plateaus at the higher potential of ∼4.6 V. Starting from the initial state of NaV(SO4)2, the theoretical capacities were estimated to be 101 mA h g−1 for a one-electron reaction and 202 mA h g−1 for a two-electron reaction. The results of the potential calculations show good agreement with previously reported results.24 For the desodiation from NaV(SO4)2, we expected operation at a high potential such as ∼4.7 V vs. Na/Na+ using common electrolytes to be feasible because some materials have been reported to operate at higher potentials.40–42 | ||
| Fig. 1 (a) Formation energy convex hull construction and (b) potential profile for each composition of NaxV(SO4)2 (x = 0, 0.5, 1.0, 1.5, and 2.0). | ||
Materials characterization
NaV(SO4)2 was synthesized using the previously reported sol–gel method. We optimized the sintering time and temperature at 9 h and 375 °C by attempting several sinter time/temperature combinations, although some small unknown impurities remained. The crystal structure of the synthesized NaV(SO4)2 was determined by powder XRD via the Rietveld refinement using RIETAN-FP25 (Fig. 2a). The results revealed that the compounds could be indexed to a monoclinic lattice of the space group C2/m and that the lattice parameters were a = 8.09(1), b = 5.180(6), c = 7.185(9), β = 92.067(7)°, and V = 300.9(6) Å3, which is larger than the unit-cell volume of NaFe(SO4)213 because of the larger ionic radius of V3+ (0.640 Å) compared with that of Fe3+ (0.61 Å) in a hexagonal system. These parameters are consistent with the previous research on the synthesis of NaV(SO4)2.23 The Rietveld-refined parameters were satisfactory, with Rwp = 6.16%, Rp = 4.63%, and S = 1.29. However, ∼3 wt% of V2O3(SO4)2 was confirmed as a sub-phase material; this material has been reported to be lithiated between 1.95 and 4.20 V.43 The crystal structure was obtained from the Rietveld refinement results (Fig. 2b). Na ions were connected to the VO6 octahedra and SO4 tetrahedra via six surrounding oxygen atoms. The morphologies of the as-prepared NaV(SO4)2 powder were confirmed by SEM observation (Fig. 2c and d). The powder exhibited a moisture-absorbent character as shown in Fig. S1 (ESI†); the samples were therefore carefully transported to the measuring equipment without exposure to moisture in the air. The particle shape and grain size were dramatically changed and refined by ball milling. | ||
| Fig. 2 (a) XRD pattern and the results of the Rietveld refinement of the as-prepared NaV(SO4)2. (b) The crystal structure obtained from the Rietveld-refined NaV(SO4)2. The structure was visualized using VESTA. SEM images of the (c) as-prepared NaV(SO4)2 and (d) carbon-coated NaV(SO4)2 prepared by ball milling. | ||
Electrochemical properties
The galvanostatic properties of the composite electrode, including NaV(SO4)2 as the active material, are shown in Fig. 3. The measurement voltage ranges were found to be 1.5–3.2 V (vs. Na/Na+) for the sodiation/desodiation process (1 ≤ x ≤ 2 in NaxV(SO4)2) from the initial state of NaV(SO4)2 and 3.2–4.8 V with a theoretical capacity limitation of 101 mA h g−1 for the desodiation/sodiation process (0 ≤ x ≤ 1 in NaxV(SO4)2). For the sodiation/desodiation process in Fig. 3a, a potential plateau was observed at 2.3 V (vs. Na/Na+). From the reversible capacity and potential values, the average working potential was calculated to be 2.1 V, which is consistent with the average potential calculated by DFT. This value is the highest potential reported for the V2+/V3+ redox couple in any material because of the greater inductive effect of SO42− compared with that of other counter anions. The reversible capacity in the first cycle was 77 mA h g−1, which is greater than 75% of the theoretical capacity. After the second cycle, NaV(SO4)2 showed good cyclability, with better than 95% coulombic efficiency, and the capacity retention was 60% in the 30th cycle. The discharge–charge capacities of NaV(SO4)2 are comparable to those of NaFe(SO4)2 (Fe2+/Fe3+).13 The potential difference of 1 V between NaV(SO4)2 and NaFe(SO4)2 was reasonably attributed to the typical potential gap between V2+/V3+ and Fe2+/Fe3+, similar to the difference observed between the NASICON-type materials Na3V2(PO4)3 (1.5 or 1.6 V) and Na3Fe2(PO4)3 (2.5 V).18–20,44–46 Different electrolyte types did not affect the discharge–charge properties in the sodiation/desodiation process from the initial state of NaV(SO4)2, as shown in Fig. 3a and c. | ||
| Fig. 3 Charge–discharge profiles of NaV(SO4)2 showing sodiation and desodiation in cells prepared with two different electrolytes: (a) and (b) 1 M NaPF6 in EC:DEC (1:1 by volume) and (c) and (d) 1 M NaClO4 in EC:DMC (1:1 by volume). (e) Charge–discharge profiles and (f) cycle performance of NaV(SO4)2 in the voltage region of 1.5–4.8 V; the electrolyte was 1 M NaClO4 in EC:DMC (1:1 by volume). | ||
However, in terms of the desodiation/sodiation process from the initial composition, different electrolyte types resulted in different galvanostatic charge–discharge profiles. Fig. 3b and d shows the charge–discharge profiles for the two electrolytes. For the NaPF6-type electrolyte as shown in Fig. S2 (ESI†), the potential of the NaV(SO4)2 cell decreased and remained ∼3.7 V; in addition, the cell charged beyond its theoretical capacity based on the one-electron reaction in NaV(SO4)2 after reaching 4.1 V at a charging capacity of 19 mA h g−1. By contrast, for the NaClO4-based electrolyte as shown in Fig. 3d, no potential decrease was observed even after the highest potential was reached in the charging process. These charging profiles likely indicate electrolyte decomposition even though the literature includes few examples of redox reactions that operate at equal or higher potentials than those in the present study.40,41 Therefore, the capacity was regulated at 101 mA h g−1 for this process to force this decomposition reaction to stop at the one-electron theoretical capacity of NaV(SO4)2. A small reversible capacity of 2 mA h g−1 was observed in the cell with 1 M NaPF6 in EC:DEC (1:1 by volume), whereas a reversible capacity of 25 mA h g−1 was obtained with an average working potential of 3.9 V in the cell with 1 M NaClO4 in EC:DMC (1:1 by volume) at the first cycle. In the second cycle, for the NaClO4-type electrolyte, the reversible capacity increased to 31 mA h g−1, which is 30% of the one-electron theoretical capacity of NaV(SO4)2, and then gradually decreased from the third cycle. Here, the types of solvent in the electrolytes did not significantly affect the voltage profiles while the cycling performance was slightly improved by using 1 M NaClO4 in EC:DMC:FEC (49:49:2 by volume) as the electrolyte (Fig. S3 and S4, ESI†). Oxidative decomposition of the electrolyte is unavoidable in this material during charge–discharge operations at high potentials, resulting in lower capacities and working potentials than those calculated. NaV(SO4)2 was found to be reversibly charged and discharged, at least in the NaClO4-based electrolyte. However, the longer the rest time after charging, the more the discharge capacity decreased according to Fig. S5 (ESI†). Thus, even in the NaClO4-based electrolyte, the progression of the side reactions or electrolyte decomposition caused by holding the electrolyte at high potentials cannot be suppressed. If the oxidative decomposition of the electrolyte can be prevented at high voltages, the working potential and reversible capacity should increase further because the capacity corresponding to the sloped part of the charging curve coincides with that corresponding to the discharging curve.
A charge–discharge diagram corresponding to a broader potential range (1.5–4.8 V) is shown in Fig. 3e. The charging capacity was found to be 101 mA h g−1 from the open-circuit potential at the first cycle; from the second cycle onward, the charging capacity was also found to be 101 mA h g−1 after charging from 1.5 V to 3.2 V. Both the charge and discharge capacities exceeded 101 mA h g−1, and the discharge capacity reached 102 mA h g−1 for the second cycle. Fig. S6 (ESI†) shows the dQ/dV curves obtained from the initial charge–discharge measurement. Two steps of the redox peak could be identified, although the decomposition of the electrolyte at high potentials made it difficult to distinguish the oxidation peak. As demonstrated in Fig. 3f, the decrease in the charge capacity with each cycle mostly stopped at a certain level; however, the discharge capacity and coulombic efficiency decreased with each cycle, likely because of the electrolysis of the electrolyte caused by repeated cycling at high potentials.
Crystal structure analysis
Fig. 4 shows the ex situ XRD patterns during the charge–discharge process for the first cycle. The states of charge during the sodiation/desodiation or desodiation/sodiation process are indicated in the charge–discharge profiles next to the XRD profiles. All the patterns were applied without any corrections because Soller slits were installed for the parallel-beam method for the XRD measurements as a consequence of the peak of PTFE appearing at the same angle (18°) for all the samples. For the sodiation/desodiation process (blue and sky-blue lines), peak shifts to lower angles were observed from the initial state to the 1.5 V discharged state, and the peaks were recovered to the original position by 3.2 V charging at 12.3°, 23.7°, 25.8°, and 32.1°, which were assigned as the (001), (11![[1 with combining macron]](https://www.rsc.org/images/entities/char_0031_0304.gif) ), (201), and (11
), (201), and (11![[2 with combining macron]](https://www.rsc.org/images/entities/char_0032_0304.gif) ) Bragg peaks, respectively. The shift to smaller angles indicates that the insertion of Na+ led to an increase in the lattice parameter. In addition, the peak intensity ratios for the peak groups at ∼12°, ∼25°, and ∼32.5° were reversibly changed. Therefore, they tended to be comparable to the simulated XRD patterns visualized by VESTA26 on the basis of the DFT calculations (Fig. S7, ESI†). Moreover, two new peaks appeared at 22.6° and 34° (pointed out by black stars), indicating a two-phase mechanism after discharge to 1.5 V; these peaks fully recovered after charging to 3.2 V.
) Bragg peaks, respectively. The shift to smaller angles indicates that the insertion of Na+ led to an increase in the lattice parameter. In addition, the peak intensity ratios for the peak groups at ∼12°, ∼25°, and ∼32.5° were reversibly changed. Therefore, they tended to be comparable to the simulated XRD patterns visualized by VESTA26 on the basis of the DFT calculations (Fig. S7, ESI†). Moreover, two new peaks appeared at 22.6° and 34° (pointed out by black stars), indicating a two-phase mechanism after discharge to 1.5 V; these peaks fully recovered after charging to 3.2 V.
 | ||
| Fig. 4
Ex situ XRD patterns during galvanostatic measurements using 1 M NaClO4 in EC:DMC (1:1 by volume) as the electrolyte for the initial state (black line), the desodiation/sodiation process (red and pink lines), and the sodiation/desodiation process (blue and light-blue lines). Black and white star icons show the new diffraction peaks on the discharging and charging process, respectively. | ||
Similarly, for the desodiation/sodiation process lined in red and pink, the intensity ratios between the peak groups of 12° and 25° were reversibly changed: the peak group at ∼12° increased after 101 mA h g−1 charging and then recovered to the initial state after discharge to 3.2 V. New peaks were also observed at ∼27.5° and ∼31.2° (pointed out by white stars) after desodiation by charging to 101 mA h g−1; the intensities of these peaks then decreased upon sodiation by discharging to 3.2 V, but the initial patterns were not fully recovered. These results confirm that single-phase and two-phase reactions occur during both the sodiation/desodiation and desodiation/sodiation processes from the initial composition.
Oxidation-state analysis
Oxidation-state analysis was conducted to investigate the redox center of NaV(SO4)2 during the charge–discharge process by ex situ XANES measurements using hard X-rays and ex situ NEXAFS measurements using soft X-rays. Here, we used two different beamlines for soft (40–1500 eV) and hard (2100–23000 eV) X-rays to cover the targeted energy range. The V K-edge XANES spectra were recorded in the hard X-ray range to determine the oxidation state of V during the charge–discharge measurements (Fig. 5b and c). Each state of charge was found to match the charge–discharge profiles in Fig. 5a. In the sodiation/desodiation process from the initial state (Fig. 5b), the K-edge of V shifted to lower energy upon discharge to 1.5 V and shifted to higher energy and returned to the initial position upon charging to 3.2 V. These results indicate that a reversible V redox reaction occurred. Compared with the standard samples of vanadium oxides of VO (V2+) and V2O3 (V3+) in Fig. S8 (ESI†), the initial oxidation state of V3+ changes to V2+ upon sodiation and then returns to the original V3+ upon desodiation. However, during the desodiation/sodiation process from the initial state, the shift at the absorption edge was negligible (Fig. 5c). However, the second-derivative profiles of the adsorption edge imply a minor shift toward higher energy by desodiation and toward lower energy upon sodiation (Fig. 5d). Moreover, from the pre-edge region at ∼5467 eV, which represents the forbidden transition from the 1s to 3d orbitals, the peak increased upon charging and decreased upon discharging, indicating the introduction and disappearance of a hole in the electronic state of V in the 3d orbitals. When 1 M NaPF6 in EC:DEC (1:1 by volume) was used (Fig. S8, ESI†), none of the spectra changed during the desodiation/sodiation process, indicating that no reaction occurred during charging/discharging, although a similar valence change was observed in the sodiation/desodiation process.
 | ||
| Fig. 5 (a) Charge–discharge profiles of NaV(SO4)2, showing the state of charge when 1 M NaClO4 EC:DMC (1:1 by volume) was used. V K-edge XANES spectra of NaV(SO4)2 at the different charge–discharge states during the first cycle for the (b) sodiation/desodiation process and (c) desodiation/sodiation process from the initial composition. (d) Second-derivative profiles during the desodiation/sodiation process to check the shift of the inflection point at the absorption edge. Transmission mode (TM) was used for the XANES measurements. (e) O K-edge NEXAFS spectra of NaV(SO4)2 at different charge–discharge states during the first cycle for the desodiation/sodiation process from the initial composition. The TFY mode was used for the NEXAFS measurements. | ||
The ex situ NEXAFS measurements using soft X-rays reveal that the oxidation states of O also changed at the respective states of charge (Fig. 5e). The photon energy values in the NEXAFS spectra were corrected on the basis of the binding energy of the adventitious carbon in another synchrotron XPS measurement. Fig. 5e shows the O K-edge TFY spectrum. The spectral features that originate from O 2p orbitals hybridized with surrounding elements are well known to reflect the electronic states around oxide ions.41,47–49 The NEXAFS O K-edge spectra of NaV(SO4)2 were likely constructed from the O 2p orbitals hybridized with V 3d (t2g and/or eg) and V 4sp, and S–O σ-bond signals appeared at approximately 529.6, 531.6, 545, and 538 eV.49 The peak at 529.6 eV corresponds to the unoccupied hybridized orbital of the O 2p orbital and V 3d (t2g) orbital,49–51 and this peak partially reversibly changed during the desodiation/sodiation process (i.e., increasing in the intensity during desodiation and decreasing during sodiation). Meanwhile, the spectra at 538 and 545 eV did not change, and the corresponding hybridized orbitals, which were S–O σ-bonding and O 2p–V 4sp, respectively, did not play a prominent role in the charge-transfer mechanism. These XANES and NEXAFS measurements imply the charge compensation of V and O during the desodiation/sodiation process in NaV(SO4)2. The ex situ XPS measurements dynamically revealed the redox reaction of V and O (Fig. S9, ESI†). Given the difference in the depth of detection for each measurement (i.e., through the entire sample in the case of XANES-TM, several hundred nanometers to one micrometer in the case of NEXAF-TFY, and several nanometers in the case of XPS), the redox reaction can be assumed to have proceeded best near the electrode surface.
The DFT calculations for the electronic structure support the assigned oxidation state of each element, as demonstrated in Fig. 6 for the projected density of states (pDOS) diagrams. The overall diagrams of the pDOS are shown in Fig. S10 (ESI†). The pDOS in NaxV(SO4)2 reveals that NaV(SO4)2 holds the V 3d and O 2p hybridization state just below the Fermi level and that the V–O hybridized bands emerge above the bandgap upon desodiation. Notably, the S bands were configurated at the deep level and the S element did not play roles in the charge compensation (Fig. S10, ESI†). In addition, the Bader charge analysis (Fig. 7; the raw values are shown in Table S2, ESI†) undoubtedly suggests that charge transfer occurred at the V–O hybridized orbitals. The Bader charges increased with the decreasing amount of Na ions in NaxV(SO4)2, and the charge compensation by V and O was assumed, whereas V mainly compensated for the charge transfer in the sodiation process from NaV(SO4)2 to Na2V(SO4)2. In addition, the magnetic moments (Table S2, ESI†) enable us to estimate the electron configurations of the ions, and the oxidation states of the redox-centric element can therefore be assumed for compositions with various Na contents.52 In NaV(SO4)2, the magnetic moment on V is 1.912, corresponding to a d-electron configuration of d2. Upon desodiation, the magnetic moments on both V and O decreased, indicating the oxidation of V and O ions even though the decrease in the magnetic moment in O was not dramatic. These NEXAFS spectral changes and DFT calculation results indicate that charge transfer occurred during the desodiation/sodiation process and provide evidence for the charge compensation of V 3d and O 2p.
 | ||
| Fig. 6 Calculated partial density of states (pDOS) of NaxV(SO4)2 (x = 0, 0.5, 1, and 2), as obtained using DFT calculations. The dashed line is the Fermi energy level. | ||
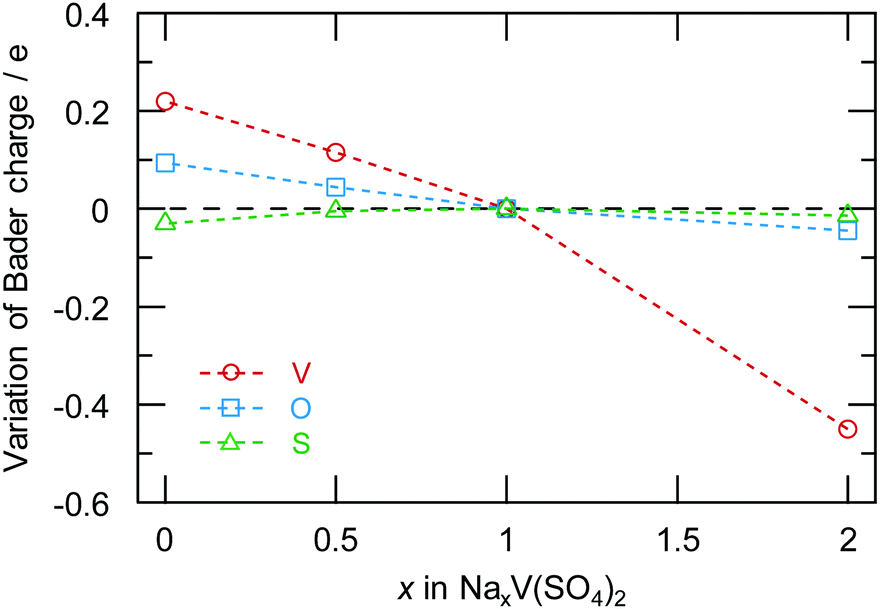 | ||
| Fig. 7 Variation of the Bader charge for V, O, and S in NaxV(SO4)2 (x = 0, 0.5, 1, 2), as obtained using DFT calculations. The Bader charges were normalized on the basis of the Bader charge of NaV(SO4)2. The raw data for the Bader charges for O and V are shown in Table S2 (ESI†). | ||
Conclusions
Eldfellite-type NaV(SO4)2 was investigated via experimental measurements and computational calculations. First-principles calculations predicted NaxV(SO4)2 to act at average potentials of 2.2 and 4.6 V for the process of Na2V(SO4)2 → NaV(SO4)2 → V(SO4)2. NaV(SO4)2 electrochemically delivered maximum reversible capacities of 77 and 31 mA h g−1 with working potentials of 2.1 and 3.9 V for the sodiation/desodiation and desodiation/sodiation processes, respectively. By enlarging the regulation potential to employ a two-step redox reaction, we obtained a maximum discharge capacity of 102 mA h g−1. The energy density of 266 W h kg−1 is less than that of other polyanionic cathode materials, but, in consideration of the theoretical value (708 W h kg−1), NaV(SO4)2 may target very excellent properties by improving the electrolyte (Fig. S11, ESI†). Ex situ XRD measurements revealed phase transitions, including a reversible expansion/contraction or a transformation to an unknown phase, during the charge–discharge process. The charge compensation in the charge–discharge process was carried out by V in sodiation/desodiation and by strong V and small O contributions in desodiation/sodiation. This mechanism was supported by the variation of the pDOS and the Bader charges for NaxV(SO4)2.Author contributions
Akira Nishio: conceptualization, formal analysis, investigation, methodology, validation, and writing – original draft preparation. Yuji Ishado: software. Kosuke Nakamoto: investigation. Eiichi Kobayashi: formal analysis and investigation. Atsushi Inoishi: conceptualization, funding acquisition, investigation, methodology, and supervision. Hikari Sakaebe: methodology. Shigeto Okada: funding acquisition and supervision. All the authors contributed to writing – review and editing, and approved the final report. The author contributions were noted using CRediT.Conflicts of interest
There are no conflicts to declare.Acknowledgements
This work was financially supported by the MEXT, Japan (ESICB program (JPMXP0112101003) and “Five-star Alliance”) and the JSPS (KAKENHI Grant no. JP20H05297). The experiments using synchrotron radiation were performed at beamlines BL11, BL12, and BL15 of the SAGA Light Source (Proposal No. 1911107R, 2006052R/BL11, 2007070R, 2102009A/BL12, and 2109085R/BL15). DFT calculations were carried out using the computer resources offered under the category of General Projects by the Research Institute for Information Technology, Kyushu University.References
- C. Masquelier and L. Croguennec, Chem. Rev., 2013, 113, 6552–6591 CrossRef CAS PubMed.
- P. Barpanda, L. Lander, S. I. Nishimura and A. Yamada, Adv. Energy Mater., 2018, 8, 1703055 CrossRef.
- T. Jin, H. Li, K. Zhu, P. F. Wang, P. Liu and L. Jiao, Chem. Soc. Rev., 2020, 49, 2342–2377 RSC.
- S. K. Sapra, J. Pati, P. K. Dwivedi, S. Basu, J. Chang and R. S. Dhaka, WIREs Energy Environ., 2021, 10, 37 Search PubMed.
- A. Manthiram and J. B. Goodenough, J. Solid State Chem., 1987, 71, 349–360 CrossRef CAS.
- A. Manthiram and J. B. Goodenough, J. Power Sources, 1989, 26, 403–408 CrossRef CAS.
- K. S. Nanjundaswamy, A. K. Padhi, J. B. Goodenough, S. Okada, H. Ohtsuka, H. Arai and J. Yamaki, Solid State Ionics, 1996, 92, 1–10 CrossRef CAS.
- S. Okada, H. Arai and J. Yamaki, Denki Kagaku, 1997, 65, 802–808 CrossRef CAS.
- D. Dwibedi and P. Barpanda, Mater. Today: Proc., 2018, 5, 23439–23442 CAS.
- W. Pan, W. Guan, S. Liu, B. Bin Xu, C. Liang, H. Pan, M. Yan and Y. Jiang, J. Mater. Chem. A, 2019, 7, 13197–13204 RSC.
- P. Barpanda, J. N. Chotard, N. Recham, C. Delacourt, M. Ati, L. Dupont, M. Armand and J. M. Tarascon, Inorg. Chem., 2010, 49, 7401–7413 CrossRef CAS PubMed.
- R. Tripathi, T. N. Ramesh, B. L. Ellis and L. F. Nazar, Angew. Chem., Int. Ed., 2010, 49, 8738–8742 CrossRef CAS PubMed.
- P. Singh, K. Shiva, H. Celio and J. B. Goodenough, Energy Environ. Sci., 2015, 8, 3000–3005 RSC.
- P. Barpanda, G. Oyama, C. D. Ling and A. Yamada, Chem. Mater., 2014, 26, 1297–1299 CrossRef CAS.
- S. C. Chung, J. Ming, L. Lander, J. Lu and A. Yamada, J. Mater. Chem. A, 2018, 6, 3919–3925 RSC.
- C. W. Mason, I. Gocheva, H. E. Hoster and D. Y. W. Yu, Chem. Commun., 2014, 50, 2249–2251 RSC.
- A. Kitajou, H. Momida, T. Yamashita, T. Oguchi and S. Okada, ACS Appl. Energy Mater., 2019, 2, 5968–5974 CrossRef CAS.
- Y. Uebou, T. Kiyabu, S. Okada and J. Yamaki, Rep. Inst. Adv. Mater. Study, Kyushu Univ., 2002, 16, 1–5 CAS.
- R. Rajagopalan, B. Chen, Z. Zhang, X. L. Wu, Y. Du, Y. Huang, B. Li, Y. Zong, J. Wang, G. H. Nam, M. Sindoro, S. X. Dou, H. K. Liu and H. Zhang, Adv. Mater., 2017, 29, 1605694 CrossRef PubMed.
- Y. Liu, Y. Zhou, J. Zhang, Y. Xia, T. Chen and S. Zhang, ACS Sustainable Chem. Eng., 2017, 5, 1306–1314 CrossRef CAS.
- R. Fehrmann, S. Boghosian, G. N. Papatheodorou, K. Nielsen, R. W. Berg, N. J. Bjerrum and A. E. Underhill, Acta Chem. Scand., 1991, 45, 961–964 CrossRef CAS.
- S. Boghosian, R. Fehrmann, K. Nielsen, G. Liptay, R. Snoeck, J. Balzarini, B. Fransson, U. Ragnarsson and G. W. Francis, Acta Chem. Scand., 1994, 48, 724–731 CrossRef CAS.
- L. L. Driscoll, A. J. Wright and P. R. Slater, Dalton Trans., 2018, 47, 13535–13542 RSC.
- A. Banerjee, R. B. Araujo and R. Ahuja, J. Mater. Chem. A, 2016, 4, 17960–17969 RSC.
- F. Izumi and K. Momma, Solid State Phenom., 2007, 130, 15–20 CAS.
- K. Momma and F. Izumi, J. Appl. Crystallogr., 2011, 44, 1272–1276 CrossRef CAS.
- B. Ravel and M. Newville, J. Synchrotron Radiat., 2005, 12, 537–541 CrossRef CAS PubMed.
- E. Kobayashi, J. Meikaku, H. Setoyama and T. Okajima, J. Surf. Anal., 2012, 19, 2–5 CrossRef CAS.
- E. Kobayashi, D. Yoshimura, H. Setoyama and T. Okajima, J. Vac. Soc. Jpn., 2016, 59, 341–345 CrossRef CAS.
- G. Kresse and J. Furthmüller, Comput. Mater. Sci., 1996, 6, 15–50 CrossRef CAS.
- G. Kresse and J. Furthmüller, Phys. Rev. B: Condens. Matter Mater. Phys., 1996, 54, 11169–11186 CrossRef CAS PubMed.
- P. E. Blöchl, Phys. Rev. B: Condens. Matter Mater. Phys., 1994, 50, 17953–17979 CrossRef PubMed.
- D. Joubert, Phys. Rev. B: Condens. Matter Mater. Phys., 1999, 59, 1758–1775 CrossRef.
- J. P. Perdew, K. Burke and M. Ernzerhof, Phys. Rev. Lett., 1996, 77, 3865–3868 CrossRef CAS PubMed.
- S. P. Ong, W. D. Richards, A. Jain, G. Hautier, M. Kocher, S. Cholia, D. Gunter, V. L. Chevrier, K. A. Persson and G. Ceder, Comput. Mater. Sci., 2013, 68, 314–319 CrossRef CAS.
- K. Okhotnikov, T. Charpentier and S. Cadars, J. Cheminf., 2016, 8, 17 Search PubMed.
- G. Henkelman, A. Arnaldsson and H. Jónsson, Comput. Mater. Sci., 2006, 36, 354–360 CrossRef.
- W. Tang, E. Sanville and G. Henkelman, J. Phys.: Condens. Matter, 2009, 21, 084204 CrossRef CAS PubMed.
- M. Yu and D. R. Trinkle, J. Chem. Phys., 2011, 134, 064111 CrossRef.
- K. Kawai, W. Zhao, S. Nishimura and A. Yamada, ACS Appl. Energy Mater., 2018, 1, 928–931 CrossRef CAS.
- K. Kawai, D. Asakura, S. I. Nishimura and A. Yamada, Chem. Mater., 2021, 33, 1373–1379 CrossRef CAS.
- M. Sun, G. Rousse, M. Saubanère, M. L. Doublet, D. Dalla Corte and J. M. Tarascon, Chem. Mater., 2016, 28, 6637–6643 CrossRef CAS.
- S. F. Linnell, J. L. Payne, D. M. Pickup, A. V. Chadwick, A. R. Armstong and J. T. S. Irvine, J. Mater. Chem. A, 2020, 8, 19502–19512 RSC.
- Y. Ishado, A. Inoishi and S. Okada, Electrochemistry, 2020, 88, 457–462 CrossRef CAS.
- Q. Wang, J. Xu, W. Zhang, M. Mao, Z. Wei, L. Wang, C. Cui, Y. Zhu and J. Ma, J. Mater. Chem. A, 2018, 6, 8815–8838 RSC.
- J. N. Chotard, G. Rousse, R. David, O. Mentré, M. Courty and C. Masquelier, Chem. Mater., 2015, 27, 5982–5987 CrossRef CAS.
- D. Asakura, E. Hosono, M. Okubo, Y. Nanba, H. Zhou, P. A. Glans and J. Guo, Chem. Phys. Chem., 2016, 17, 4110–4115 CrossRef CAS PubMed.
- D. Asakura, Y. Nanba, Y. Makinose, H. Matsuda, P. A. Glans, J. Guo and E. Hosono, Chem. Phys. Chem., 2018, 19, 988–992 CrossRef CAS PubMed.
- C. J. Patridge, C. Jaye, T. A. Abtew, B. Ravel, D. A. Fischer, A. C. Marschilok, P. Zhang, K. J. Takeuchi, E. S. Takeuchi and S. Banerjee, J. Phys. Chem. C, 2011, 115, 14437–14447 CrossRef CAS.
- M. Abbate, H. Pen, M. T. Czyzyk, F. M. F. de Groot, J. C. Fuggle, Y. J. Ma, C. T. Chen, F. Sette, A. Fujimori, Y. Ueda and K. Kosuge, J. Electron Spectrosc. Relat. Phenom., 1993, 62, 185–195 CrossRef CAS.
- Y. Kim, G. Y. Song, R. Nandi, J. Y. Cho, J. Heo and D. Y. Cho, RSC Adv., 2020, 10, 26588–26593 RSC.
- H. Gao, I. D. Seymour, S. Xin, L. Xue, G. Henkelman and J. B. Goodenough, J. Am. Chem. Soc., 2018, 140, 18192–18199 CrossRef CAS PubMed.
Footnote |
| † Electronic supplementary information (ESI) available. See DOI: https://doi.org/10.1039/d2ma00031h |
| This journal is © The Royal Society of Chemistry 2022 |