
 Open Access Article
 This Open Access Article is licensed under a Creative Commons Attribution-Non Commercial 3.0 Unported Licence
Controlled optimization of Mg and Zn in Al alloys for improved corrosion resistance via uniform corrosion
Jaehyoung
Lim†
 a,
Geonwoo
Jeong†
b,
Kookjeong
Seo
c,
Jungsoo
Lim
c,
Sangjun
Park
c,
Won
Ju
c,
Gnanaprakasam
Janani
a,
Dong-Kyu
Lee
a,
Joon Young
Kim
ad,
Mi-Kyung
Han
b,
Tae-Hoon
Kim
b,
Sungtae
Park
*c,
Hoonsung
Cho
*b and
Uk
Sim
*ad
a,
Geonwoo
Jeong†
b,
Kookjeong
Seo
c,
Jungsoo
Lim
c,
Sangjun
Park
c,
Won
Ju
c,
Gnanaprakasam
Janani
a,
Dong-Kyu
Lee
a,
Joon Young
Kim
ad,
Mi-Kyung
Han
b,
Tae-Hoon
Kim
b,
Sungtae
Park
*c,
Hoonsung
Cho
*b and
Uk
Sim
*ad
aHydrogen Energy Technology Laboratory, Korea Institute of Energy Technology (KENTECH), 200 Hyeoksin-ro, Naju, Jeonnam 58330, Republic of Korea. E-mail: usim@kentech.ac.kr
bDepartment of Materials Science & Engineering, Chonnam National University, Gwangju 61186, South Korea. E-mail: cho.hoonsung@jnu.ac.kr
cSamsung Electronics Co., Ltd., Suwon-si, Gyeonggi-do 16677, South Korea. E-mail: st0728.park@samsung.com
dResearch Institute, NEEL Sciences, INC., 58326 Jeollanamdo, South Korea
First published on 22nd April 2022
Abstract
Aluminum alloys are the predominant metal used in various industrial applications due to their light weight, excellent corrosion resistance, high strength, and good plasticity. The aim of this work is to develop an Al alloy with high corrosion resistance while maintaining its mechanical properties. In this work, we investigated the effect of the addition of small amounts of Mg and Zn on the corrosion properties of the Al1XXX series alloys by preparing Al–xMg–yZn (0.10 < wt% of x < 1.00, 0.10 < wt% of y < 0.55) samples and compared them to conventional commercial Al1070 alloys. The addition of a comparatively small amount of Mg and Zn led to the formation of β and τ phases. We found that the formation of phases at the grain boundary of the Al–Mg–Zn alloy leads to the transition from pitting corrosion to intergranular corrosion thus increasing the overall corrosion resistance. This study contributes to providing new and further insights into the development of excellent corrosion characteristics in Al1XXX alloys.
Introduction
Global primary aluminum production in 2017 was 63.4 million metric tons.1 This is the highest amount of any metal other than Fe. Aluminum has been applied in various industries such as transportation, machinery, equipment, building, and construction. This is due to its outstanding properties such as low density, high mechanical strength, and good machinability. In particular, corrosion resistance brings the most competitive differentiation among industrial metals.2,3 The Al1XXX series aluminum alloys have pure aluminum with over 99.00% content by weight. Furthermore, Al 1070 has the aluminum content with the highest purity of 99.7%, and shows the best corrosion resistance in general environments.4,5 Alloys of these series are used for manufacturing electric wires, chemical tanks, piping, and foil due to their superior corrosion resistance, good formability, weldability, and high electrical/thermal conductivity.3,6–9 However, it is observed that in aqueous environments with chlorine ions or a restricted range of pH conditions, these alloys exhibit relatively poor corrosion resistance and low mechanical properties.10,11 Therefore, simultaneously improving the mechanical properties and corrosion resistance of Al alloys is an urgent challenge to expand the application of Al alloys.It is well known that the passivation properties of the Al oxide film significantly improve the corrosion resistance of Al alloys under normal conditions. Although the oxide film of Al is relatively stable, Al oxide is destroyed in an aggressive ion-rich environment, causing pitting corrosion.12–18 In general, the addition of other elements to pure Al improves the mechanical properties but is vulnerable to staining corrosion due to heterogeneity. For example, when Mg is added to Al, Mg atoms diffuse into the grain boundary forming a secondary phase called the β-(Al3Mg2) phase.19–23 This is a direct cause of intergranular corrosion, which leads to stress corrosion cracking.24–29 When Zn is added to this Al–Mg alloy, another secondary phase called the τ-(Mg32 (Al, Zn)49) phase is formed.23,30–32 In addition, an intermetallic compound called Al3Fe causes galvanic corrosion due to the potential difference with the Al matrix.33–35 Al metals that include Fe, and Mg oxide films are known to be vulnerable to pitting corrosion.36–39 In addition, the corrosion pitting is prevented by the addition of small quantities of metals because of the formation of a secondary phase which acts to generate a potential difference with the Al matrix. However, the corrosion resistance tends to decrease when the content exceeds a certain amount. In order to manufacture highly corrosion-resistant Al alloys, it is important to find the optimal content of additional metals.
From the metallurgical point of view, in various metallic systems and materials, the resulting microstructure arrays have an important role in the properties, e.g., mechanical behavior and corrosion resistance.40–42 It is also recognized that the solute content provides a resulting refinement in the microstructural array, i.e., both grain size and dendritic arm spacings.40–45 This improves the attained mechanical properties. Also, it is reported that the applied or imposed cooling rate can also be used to improve the mechanical behavior. The resulting corrosion resistance is also significantly affected by the imposed cooling rate.42,43,45
In this work, the effect of addition of small amounts of Mg and Zn on the corrosion resistance and pitting properties of Al1XXX alloys was investigated in order to identify the most promising compositions. The β-Al3Mg2 phase and τ-Mg32(Al,Zn)49 phase are formed in the grain boundary by the addition of Mg and Zn and improve the corrosion resistance of Al1070 alloys. Under these experimental conditions, the Al–0.30Mg–0.43Zn alloy has higher negative potentials and a slower corrosion rate than the commercial Al1070 alloy.
Experimental
Materials preparation
The Al–xMg–yZn (0.10 < wt% of x < 1.00, 0.10 < wt% of y < 0.55) alloy extrusion tubes were manufactured as follows: First, Al1070, a commercial alloy, Mg and Zn were purchased. Second, the prepared Al1070, Mg and Zn alloys were heated, melted, mixed well, and cooled to prepare billets. Here, the Mg and Zn alloys were prepared for each component ratio for Al–xMg–yZn. After that, the prepared Al–xMg–yZn billet was preheated to 490 degrees and extruded at an initial extrusion pressure of 230 kgf cm−2 with a production speed of approximately 150 m min−1 to a size of 8.45 mm/6.85 mm (OD/ID). The Al–xMg–yZn tube manufactured through the extrusion method was cooled and finally it has an outer diameter (OD) of 8.5 mm, an inner diameter (ID) of 6.9 mm, and a thickness of 0.8 mm.Corrosion tests
The SWAAT (seawater acidified test) of the ASTM G85-11 Modified Salt Spray test was conducted to measure the corrosion performance of Al 1070 and Al–Mg–Zn alloys using a Q-FOG Cyclic Corrosion Tester (Q-Fog; Q-Lab, Westlake, OH). The solution used in the SWAAT has a pH of 2.8–3.0 and is produced by adding 5% sodium chloride and 10 ml glacial acetic acid to 1 L of water. The SWAAT was conducted by continuously spraying the solution for 24 hours to accelerate corrosion.Electrochemical measurements
The electrochemical setup consisted of a three-cell electrode with a Pt mesh (2.54 cm × 2.54 cm) as a counter electrode and an Ag/AgCl electrode as a reference electrode and the VersaSTAT4 multi-channel potentiostat (AMETEK, USA). All the electrochemical measurements were performed at room temperature. Electrochemical impedance spectroscopy (EIS) measurements were employed to examine the corrosion resistance of Al 1070 and Al–Mg–Zn alloys. Impedance was examined using the Nyquist plot to compare the charge transfer resistance of each alloy. Potentiodynamic polarization was performed from −250 mV (vs. open circuit potential) to 250 mV potential at a scan rate of 1 mV s−1. Samples were cut into 26.7 mm × 20 mm pieces and were made into flat plates for measurement. Although 1 mV s−1 is adopted, it is remarked that this selection has not provided substantial distortions in the polarization curves obtained.46–48 In this sense, it is worth noting that the potential scan rate has an important role in minimizing the effects of distortions in Tafel slope and corrosion current density analyses.Microstructure examination
To investigate the elemental composition on the surface and microstructural characteristics of the alloys, an X-ray photoelectron spectroscopy system (XPS; K-ALPHA+, Thermo Scientific, USA), an X-ray diffractometer (XRD; EMPYREAN, PANalytical, Nederland), an optical microscope (OM; Leica DVM2500, Leica Microsystems, UK), and a transmission electron microscope (TEM; JEM-ARM200f, JEOL, Japan) with a spherical aberration corrector and a scanning electron microscope (SEM; JSM-7500F, JEOL, Japan) were adopted. The samples were prepared by removing NaCl and oxide from the surface and then cutting them into 5 × 5 mm2 (OM, SEM sample) and 10 × 10 mm2 (XPS, XRD sample) sizes. The TEM samples were prepared using a focused ion beam (FIB, JIB-4601F, JEOL, Japan) and the lift-out approach. The scanning TEM (STEM) high angle annular dark field (HAADF) images were collected using a convergence semi-angle of 21 mrad and a collection semi-angle of 54–220 mrad at 200 kV. The samples were cut into 10 × 10 × 10 mm3 pieces and were made into flat plates for measurement. The alloy sample after the corrosion test was washed using deionized water and ethanol to remove the residual NaCl crystals on the alloy surface.Results and discussion
To depict the corrosion form and depth of the samples, we have photographed the samples using OM after the 48 days SWAAT experiment (Fig. 1a–h). The OM image data were arranged in a direction where the Mg component increases towards the right, and the Zn component increases downwards.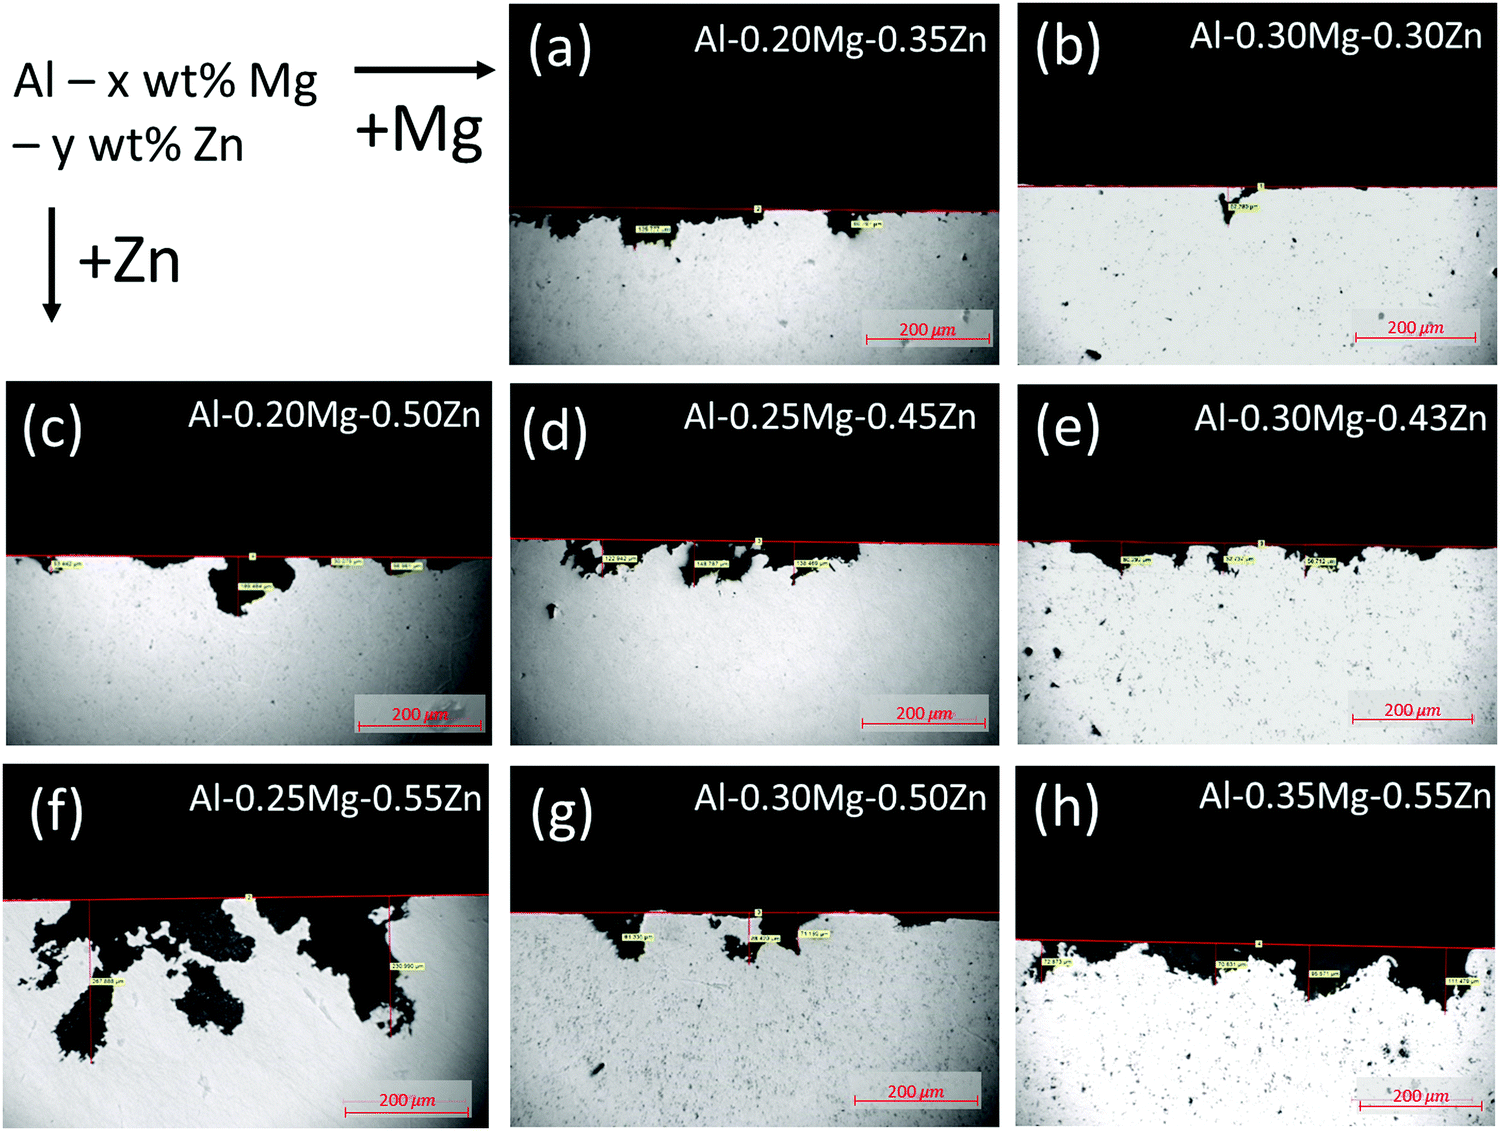 | ||
| Fig. 1 Optical microscope image to check the form and depth of corrosion after the 48 days SWAAT experiment. | ||
The phase fraction in Al–xMg–yZn alloys is thermodynamically calculated using JMatPro software (Fig. 2). The calculation results show that no β-(Al3Mg2) phase has been formed in the Al–0.20Mg–0.35Zn, Al–0.20Mg–0.50Zn, Al–0.25Mg–0.45Zn, and Al–0.25Mg–0.55Zn samples (Fig. 1a, c, d and f). The samples in which the β-(Al3Mg2) phase is not formed have a smoother corrosion cross-section than the samples in which the β-(Al3Mg2) phase is formed (Fig. 1b, e, g and h). In particular, this property is greatly exhibited by the Al–0.25Mg–0.55Zn sample, which shows that the form of corrosion is close to pitting corrosion, indicating that corrosion does not occur at the grain boundaries in the sample. From the above results, it was found that the β-(Al3Mg2) phase can be observed only when the Mg component was 0.30 or more, and the τ-(Mg32 (Al, Zn)49) phase was also formed for the samples with the β-(Al3Mg2) phase. Comparison of Al–0.25Mg–0.55Zn and Al–0.35Mg–0.55Zn samples that possess the same Zn component reveals a slight difference in corrosion resistance. The disparity indicates that the transition from pitting corrosion to intergranular corrosion through β-(Al3Mg2) phase formation plays an important role in the corrosion resistance of Al–xMg–yZn samples.
 | ||
| Fig. 2 Phase fraction calculation data of Al–xMg–yZn (0.10 < wt% of x < 1.00, 0.10 < wt% of y < 0.55) samples. | ||
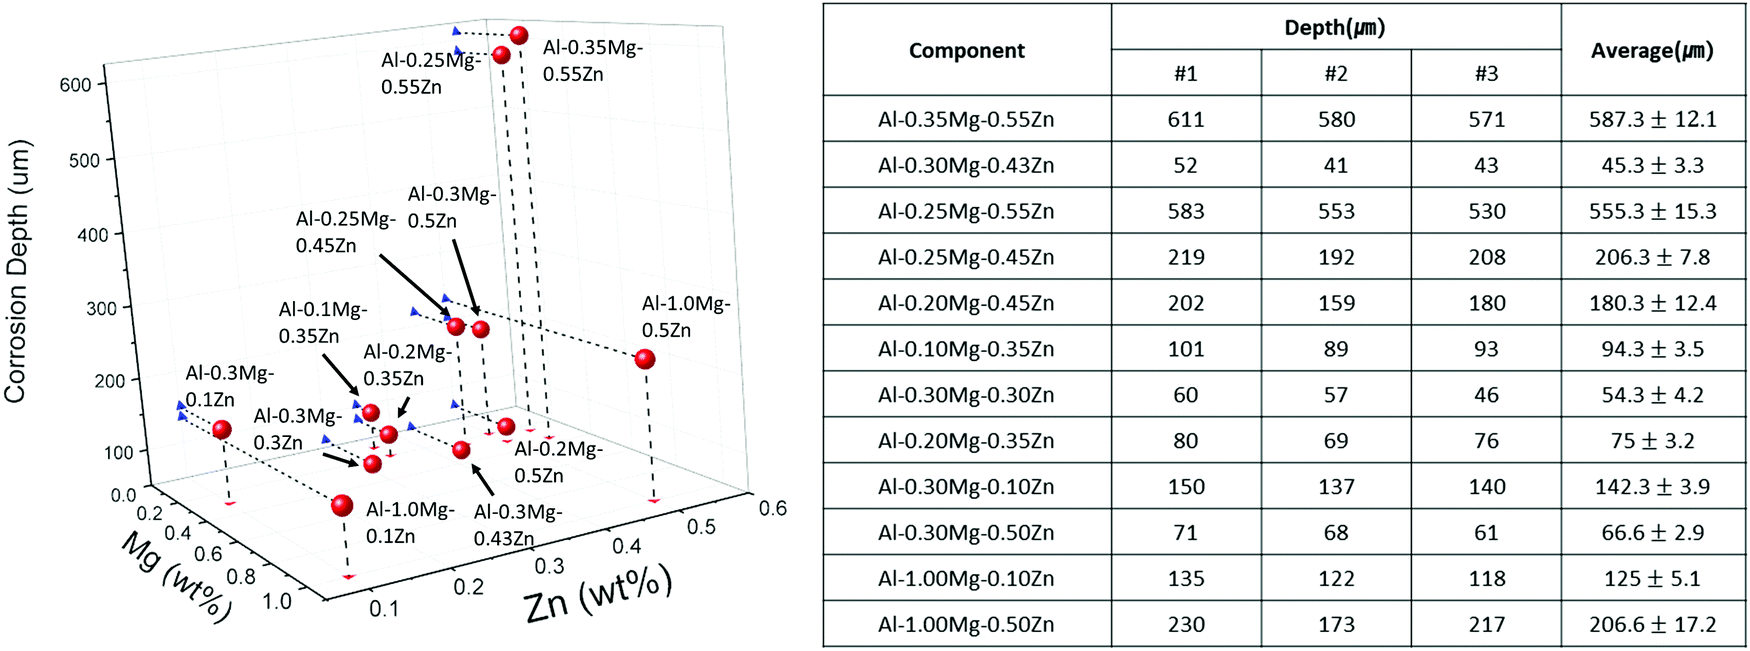
The corrosion depth profiles of Al–xMg–yZn (0.10 < wt% of x < 1.00, 0.10 < wt% of y < 0.55) samples are shown in Fig. 3. The sample with the smallest depth of 45.3 ± 3.3 was found to be Al–0.30Mg–0.43Zn. When comparing the Al–0.30Mg–0.43Zn sample and other samples with a similar depth of 45.3 ± 3.3, the depth seems to decrease as the Mg content increases. However, through the Al–0.35Mg–0.55Zn sample, it was confirmed that the corrosion resistance is different depending on the ratio of the Zn component, even if there is a lot of Mg component. The Al–0.35Mg–0.55Zn samples with large corrosion depths of 555.3 ± 15.3 affirm that although the Mg value is in an appropriate ratio, a Zn component exceeding a certain amount has been found to rather degrade the corrosion resistance. This is due to the formation of excessive τ-Mg32(Al,Zn)49 phases.
 | ||
| Fig. 3 Corrosion depth data of Al–xMg–yZn (0.10 < wt% of x < 1.00, 0.10 < wt% of y < 0.55). | ||
To measure the corrosion performance of Al1070 and Al–0.30Mg–0.43Zn in the form of extruded tubes for commercial use, a SWAAT experiment was conducted for a total of 24 days, and the surface of the samples was checked through OM (Fig. 4a–h). From the 10th-day image of each sample it was confirmed that grain boundaries were formed in the Al–0.30Mg–0.43Zn sample, unlike in Al1070 (Fig. 4b and f).
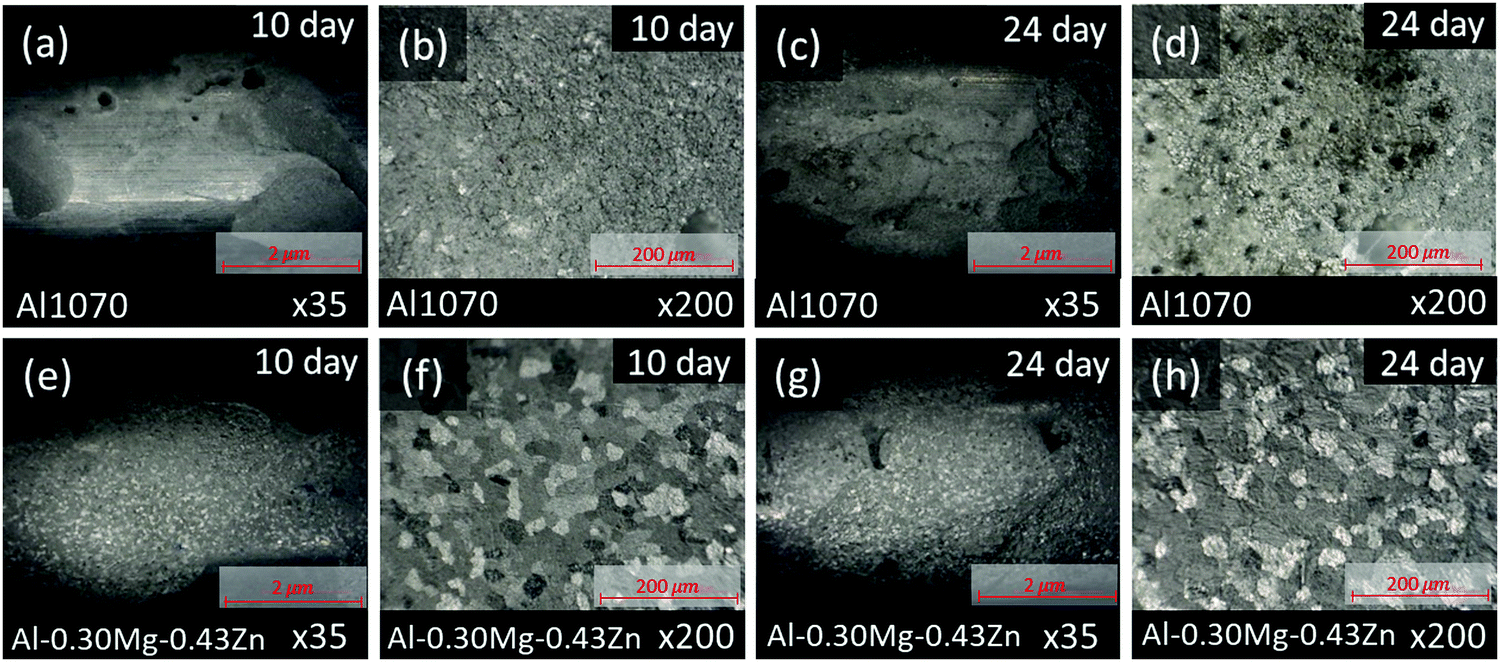 | ||
| Fig. 4 Surface view observation of the corroded specimens after the SWAAT; (a and b) Al 1070 on the 10th day of the SWAAT experiment. (c and d) Al 1070 on the 24th day of the SWAAT experiment. (e and f) Al–0.30Mg–0.43Zn on the 10th day of the SWAAT experiment. (g and h) Al–0.30Mg–0.43Zn on the 24th day of the SWAAT experiment. | ||
It can be expected that the corrosion resistance of the Al–0.30Mg–0.43Zn sample will be improved by the phases generated at the grain boundary, and it can be confirmed by comparing the samples on the 24th day (Fig. 4d, h). In the case of the 24th day sample, it was confirmed that pitting corrosion occurred, and pits were formed in the Al1070 sample, and in the case of the Al–0.30Mg–0.43Zn sample, corrosion occurred uniformly in the form of intergranular corrosion, confirming that grain boundaries were not clearly seen compared to the 10th day OM image.
STEM-HAADF microstructures reveal distinct differences in Al1070 and Al–0.30Mg–0.43Zn (Fig. 5). Both samples have an oxidized region at the surface. The low magnification images clearly show that Al–0.30Mg–0.43Zn is invulnerable to oxidation compared to Al1070. The thickness of the surface oxidized region of Al–0.30Mg–0.43Zn is thinner than that of Al1070. The thick oxidized region of Al1070 makes it easy to cause pitting corrosion.49 Moreover, Al–0.30Mg–0.43Zn showed a smaller Al3Fe phase than Al1070 (Fig. 5a and b) while the grain sizes of both samples are similar.
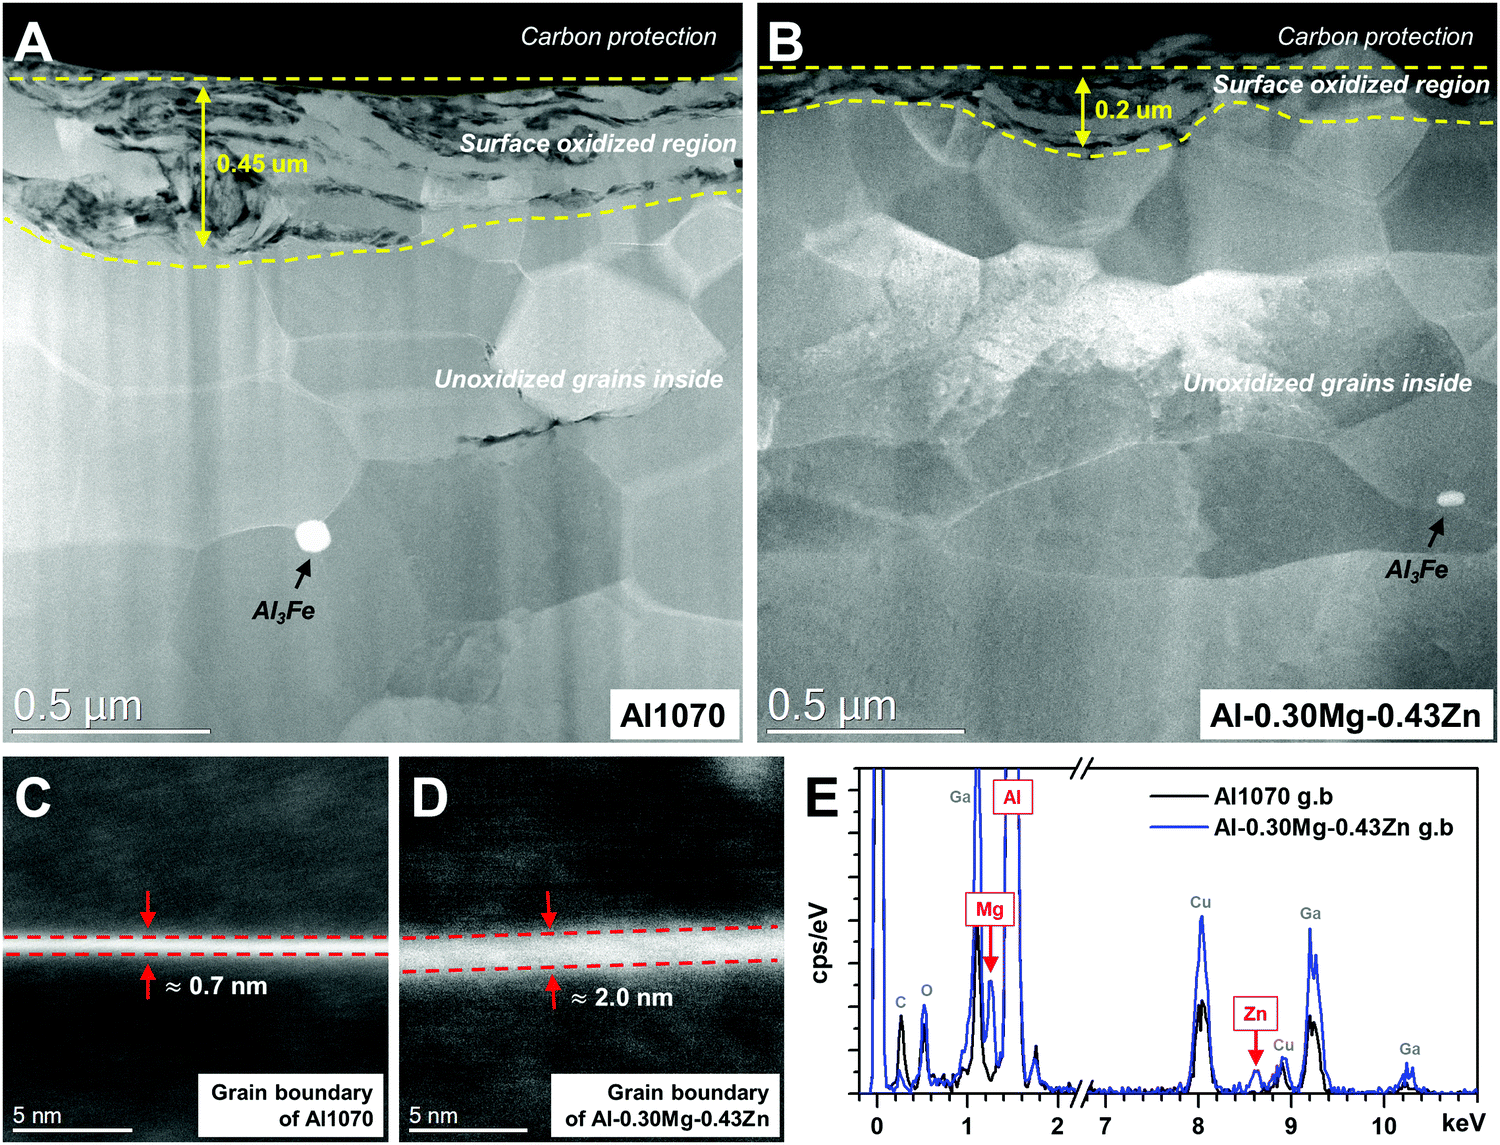 | ||
| Fig. 5 Microstructures of Al1070 and Al–0.30Mg–0.43Zn. Low magnification STEM-HAADF images of (a) Al1070 and (b) Al–0.30Mg–0.43Zn. The grain boundaries of (c) Al1070 and (d) Al–0.30Mg–0.43Zn. (e) STEM-EDS analysis results at the grain boundary of Al1070 (black spectrum) and Al–0.30Mg–0.43Zn (blue spectrum). | ||
The smaller Al3Fe phase contributes to the improvement of the corrosion resistance of the metal by reducing the potential difference.33 The high magnification images at the grain boundary of both samples compare the very thin grain boundary phases (0.7 ∼ 2 nm) of Al1070 and Al–0.30Mg–0.43Zn (Fig. 5c and d). It seems that Al–0.30Mg–0.43Zn tends to have a thicker grain boundary than Al1070. The chemical composition results obtained by EDS at the grain boundary and the grains of both samples are summarized in Table 1. It is clear that Mg and Zn are only concentrated at the grain boundary. The existence of Mg and Zn at the grain boundary of Al–0.30Mg–0.43Zn was clearly confirmed as shown in the spectra in Fig. 5e. Cu and Ga in the spectra are artifacts due to TEM grid and FIB-induced contamination, respectively.
| At% | Al1070 | Al–0.30Mg–0.43Zn | ||
|---|---|---|---|---|
| Grain boundary | Grain | Grain boundary | Grain | |
| Al | 98.9 ± 1.0 | 99.4 ± 0.1 | 95.9 ± 0.9 | 99.2 ± 0.3 |
| Mg | 1.2 ± 1.0 | 0.6 ± 0.1 | 3.6 ± 0.8 | 0.8 ± 0.3 |
| Zn | 0 | 0 | 0.6 ± 0.1 | 0.03 ± 0.01 |
Considering our calculation and corrosion results with previous reports,19–23,30–32 we assume that the Mg- and Zn-rich grain boundary phase in Al–0.30Mg–0.43Zn is due to the formation of β-Al3Mg2 and τ-Mg32(Al,Zn)49 phases at the grain boundary. It is considered that very low fractions of β-Al3Mg2 and τ-Mg32(Al,Zn)49 phases were formed at the grain boundary, resulting in the formation of a thicker grain boundary, and a higher Mg and Zn composition only at the grain boundary in Al–0.30Mg–0.43Zn. These abundant Mg and Zn at the grain boundary resulting from β-Al3Mg2 and τ-Mg32(Al,Zn)49 phases induce the intergranular corrosion rather than pitting corrosion and improve the corrosion resistance.
X-Ray diffraction (XRD) patterns were studied for Al1070 and Al–0.30Mg–0.43Zn. The resulting pattern was matched with that of the Al alloy JCPDS No. 98-005-2255. There is no difference in the samples before and after the addition of Mg and Zn in the Al alloy as shown in Fig. 6. The indifferent XRD results of Al1070 and Al–0.30Mg–0.43Zn indicate that there is no change in the bulk of Al–0.30Mg–0.43Zn, due to the presence of Mg and Zn. Overall, it can be considered that the added Mg and Zn are present on the surface of Al–0.30Mg–0.43Zn.
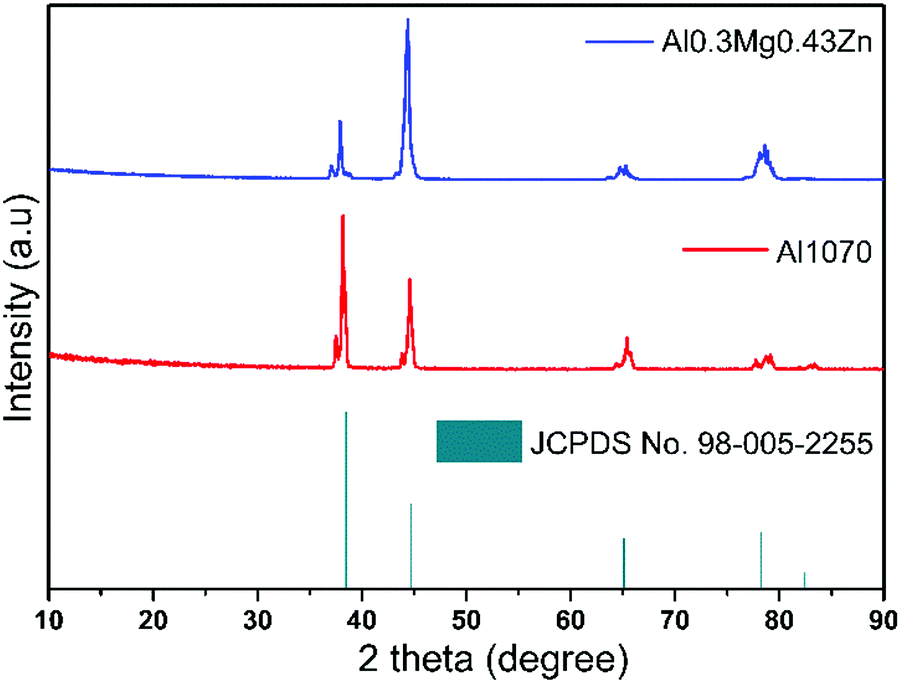 | ||
| Fig. 6 X-Ray diffraction patterns of Al1070 and Al–0.30Mg–0.43Zn. | ||
XPS was used to examine the surface composition of elements and oxidation states of the samples (Fig. 7). The XPS results show indirect identification of the components present on the surface. Since the manufactured alloy has very low components of Mg and Zn, it was necessary to check whether each component was present on the surface. All components of Al, Mg, and Zn were identified on the surface of the sample before corrosion, and it was confirmed that Mg and Zn components were distributed on the surface even with a small number of components. The high-resolution XPS spectra of Al 2p before corrosion were deconvoluted into two components, metallic Al (72.87 eV) and partially surface oxidized Al (74.51 eV) corresponding to the Al0+ and Al3+ oxidation states, respectively (Fig. 7a).50
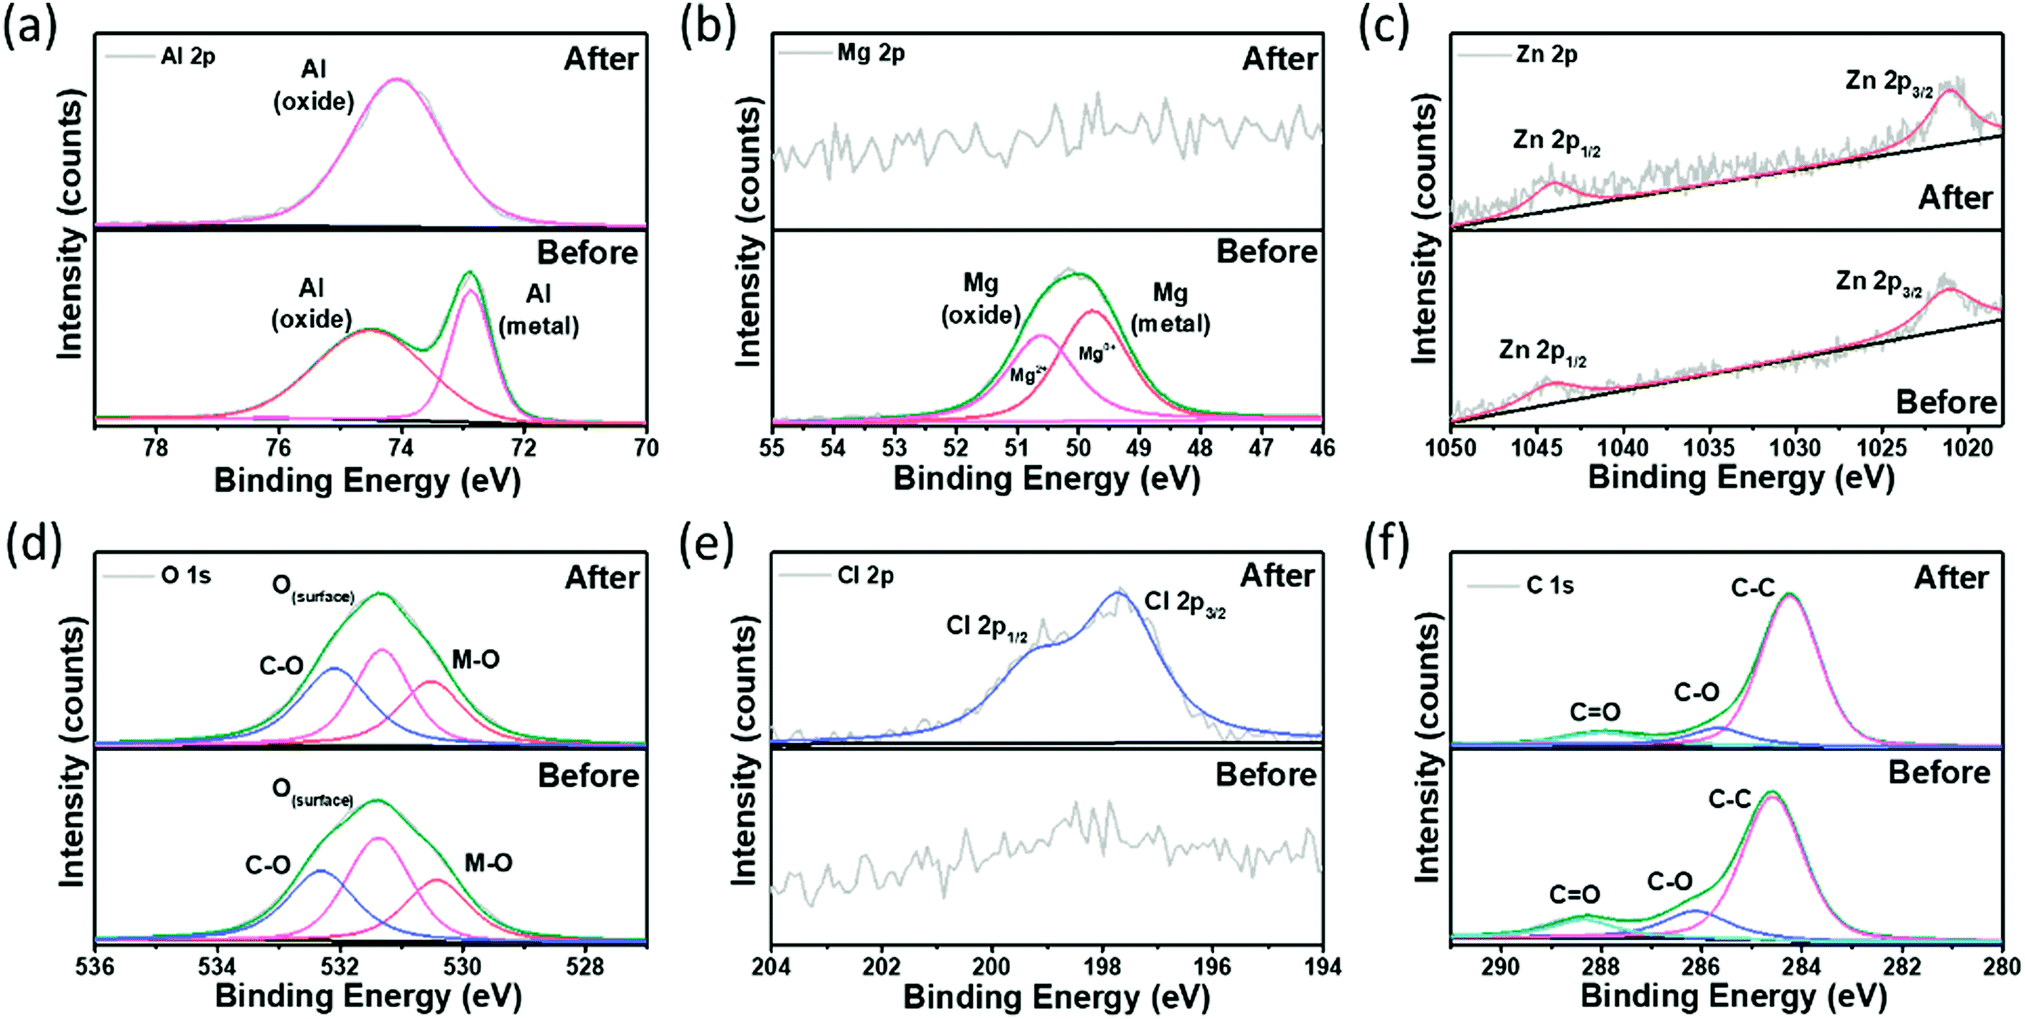 | ||
| Fig. 7 X-Ray photoelectron spectroscopy scans of the Al–Mg–Zn alloy: (a) Al 2p, (b) Mg 2p, (c) Zn 2p, (d) O 1s, (e) Cl 2p, and (f) C 1s. | ||
The Al 2p spectra observed after corrosion revealed a positively shifted deconvoluted signal located at 74.08 eV, which can be ascribed to the change in oxidation states (Al0+ to Al3+) due to the presence of surface adsorbed Cl− ions.60 Similarly, the Mg 2p spectra in Fig. 7b indicate the existence of two components at 49.77 eV (metallic Mg) and 50.63 eV (partially surface oxidized Mg) corresponding to the Mg0+ and Mg2+ oxidation states, respectively.51 The Mg component was not identified in the sample after corrosion, which is believed to have not been detected because Mg, which is more reactive than Al, was consumed in the process of corrosion. In contrast, the XPS spectrum of Zn 2p in Fig. 7c reveals the two characteristic peaks of the Zn metal located at 1021.08 and 1044.08 eV corresponding to the 2p3/2 and 2p1/2 spin–orbital splitting, respectively, without any noticeable changes after corrosion.52 Here, the existence of Zn was detected even after corrosion because it was less reactive than Al. The O 1s XPS spectra of Al–0.30Mg–0.43Zn in Fig. 7d were deconvoluted into three peaks at 530.43 (M–O), 531.35 (O(surface)), and 532.33 eV (C–O/OH) corresponding to the signals of the oxygen atom associated with metals (lattice oxygen), surface oxygen atoms not associated with metals (non-lattice oxygen), and chemisorbed oxygen species (O/OH), respectively.53 The M–O and C–O sites were observed to increase after corrosion, while the O(surface) sites decrease, substantiating the oxidation of Al–0.30Mg–0.43Zn during corrosion activity. Furthermore, the Cl 2p XPS spectra of Al–0.30Mg–0.43Zn in Fig. 7e reveal the existence of Cl after corrosion, affirming the change in the oxidation state of Al after corrosion. The two characteristic peaks of Cl associated with the metal located at 197.71 eV and 199.31 eV correspond to the 2p3/2 and 2p1/2 spin–orbital splitting, respectively.54 The C 1s XPS spectra of Al–0.30Mg–0.43Zn in Fig. 7f show the standard C–C associated with adventitious carbon species at 284.54 eV and chemisorbed oxygen species at 286.12 eV and 288.31 eV, respectively.55 Hence, the XPS results validate the superior corrosion resistant property of the Al–0.30Mg–0.43Zn sample by revealing the surface composition before and after corrosion activity.
The corrosion depth and surface of Al1070 and Al–0.30Mg–0.43Zn alloys were precisely measured with OM and SEM images after the 15 days SWAAT experiment (Fig. 8a–d). When Fig. 8a and c were compared, it was confirmed that the corrosion depth of the Al–0.30Mg–0.43Zn alloy was significantly reduced compared to that of Al1070. Fig. 8b and d ensure that pitting corrosion has occurred in various parts of the surface of Al1070, but in the case of the Al–0.30Mg–0.43Zn alloy, the surface can be confirmed to be relatively clean.
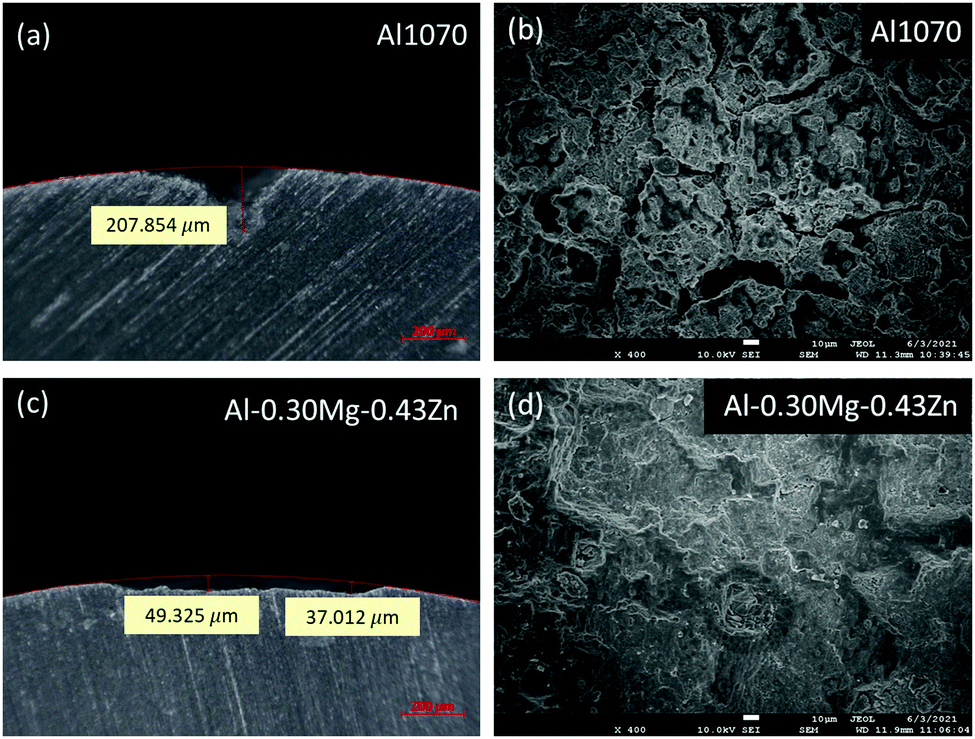 | ||
| Fig. 8 Optical microscope image showing the pitting depth of each sample after the 15 days SWAAT experiment: (a) Al 1070 and (c) Al–0.30Mg–0.43Zn. SEM image showing the surface of (b) Al 1070 and (d) Al–0.30Mg–0.43Zn. | ||
It is known that the pitting corrosion of Al1070 is initiated by the destruction of the passivation layer by Cl−, and Cl− accumulates.12–18 Accumulation of Cl− ions in the pit creates a layer of chloride at the surface of the pit.2,56 Al3+ ions generated in the pits combine with OH− ions.57 This combination causes the inside of the pit to become more acidic.58 Al3+ hydrolysis forms an alumina hydroxide cap on the outside of the pit. The alumina hydroxide cap suppresses the solution inside the pit from escaping to the outside, creating an aggressive environment inside the pit.59 Pitting may still occur due to acids and Cl− ions. Therefore, the pitting corrosion of aluminum is an autocatalytic reaction.60
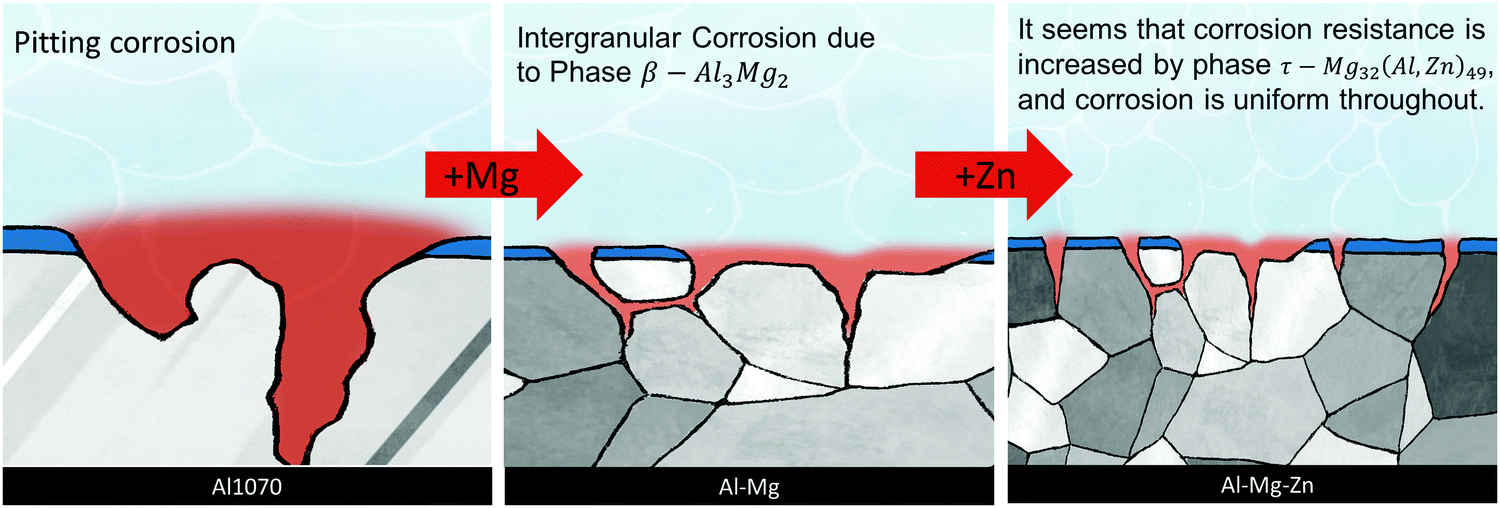
In general, when alloying elements are added to pure Al, the mechanical properties are improved, but heterogeneity occurs in the microstructure, making it weak against pitting corrosion.4,61–63 However, when Mg is added, solid solution strengthening occurs, and corrosion resistance increases simultaneously. The increased corrosion resistance is due to the fact that when Mg is in solid solution, the cathodic reaction is delayed due to the low exchange current density of Mg.5 But, when a Mg content of above 3% is exposed to high temperatures for a long time, Mg atoms diffuse into the grain boundaries, forming a secondary phase called the β-(Al3Mg2) phase.19–23 In the Al–Mg alloy, the β phase is arranged in a line along the grain boundary. Because the β phase is more anodic than the Al matrix, corrosion proceeds before Al. The β phase formation is a direct cause of intergranular corrosion, which further leads to stress corrosion cracking.24–29
When Zn is added to this Al–Mg alloy, another secondary phase called the τ-(Mg32 (Al, Zn)49) phase is formed.23,30–32 Like the β phase, the τ phase also precipitates at the grain boundary. This β-Al3Mg2 phase reduces corrosion resistance by generating a potential difference within the matrix.25,30 The formation of the τ phase reduces the potential gap caused by the β phase, thus improving the resistance to electrochemical corrosion (Scheme 1).
 | ||
| Scheme 1 The addition of Mg and Zn to Al1070 changed the pitting form of corrosion to the appearance of uniform corrosion by intergranular corrosion and increased corrosion resistance. | ||
By adding Mg and Zn, which improve the corrosion resistance of Al, we tried to increase the resistance to pitting corrosion. When the Mg component was 0.3 or more, the β phase was formed, and at the same time, the τ phase was also formed by adding Zn. Increasing the Mg content seems to improve the corrosion resistance. However, when Zn increases together, the τ phase is continuously precipitated, increasing the sensitivity to corrosion. The chemical composition of Al–0.30Mg–0.43Zn confirmed that Mg and Zn were concentrated at the grain boundary. The reason seems to be that the β phase and τ phase were formed at the grain boundary. As a result, the transition from pitting corrosion to intergranular corrosion was induced (Scheme 2).
 | ||
| Scheme 2 The schematic representation of the change in corrosion from pitting to intergranular corrosion on adding Mg and Zn with the Al1070 alloy. | ||
The corrosion resistance of the Al1070 sample and the Al–0.30Mg–0.43Zn sample was compared using electrochemical analysis (Fig. 9). The Nyquist plot reveals the presence of one capacitive loop for Al–0.30Mg–0.43Zn alloy with a larger diameter than Al1070 (Fig. 9a). This indicates good corrosion resistance due to high charge transfer resistance. The potentiostatic polarization measurements (Fig. 9b) show that Al–0.30Mg–0.43Zn has more negative corrosion potential (−760 mV) than Al1070 (−670 mV), has a lower corrosion current (82 μA cm−2) than Al1070 (110 μA cm−2), has a lower anodic Tafel slope (196 mV dec−1) than Al1070 (278 mV dec−1) and has more negative cathodic Tafel slope (−441 mV dec−1) than Al1070 (−336 mV dec−1). These results show that the negative corrosion potential and lower corrosion current are sufficiently increased by the β-Al3Mg2 and τ-Mg32(Al,Zn)49 phases formed by Mg and Zn addition to Al. The corrosion rate of Al 1070 (951 μm per year) is comparable to the Al–0.30Mg–0.43Zn (556 μm per year) as shown in Fig. 9c. These results show that the corrosion resistance of the Al–0.30Mg–0.43Zn sample is better than that of the Al1070 sample.
 | ||
| Fig. 9 (a) Nyquist impedance plot of electrochemical impedance spectroscopy (EIS), (b) potentiodynamic polarization curves, and (c) the potential and corrosion rate graph. | ||
During the SWAAT experiment, leakage was measured for Al1070 and Al–0.30Mg–0.43Zn (Fig. 10). For the Al–0.30Mg–0.43Zn alloy, it took an average of 73.6 days for the first leak to occur (Fig. 10a). Compared to the commercial Al1070 alloy, which took an average of 21 days until the first leak, it is confirmed that the Al–0.30Mg–0.43Zn alloy has very good performance (Fig. 10b).
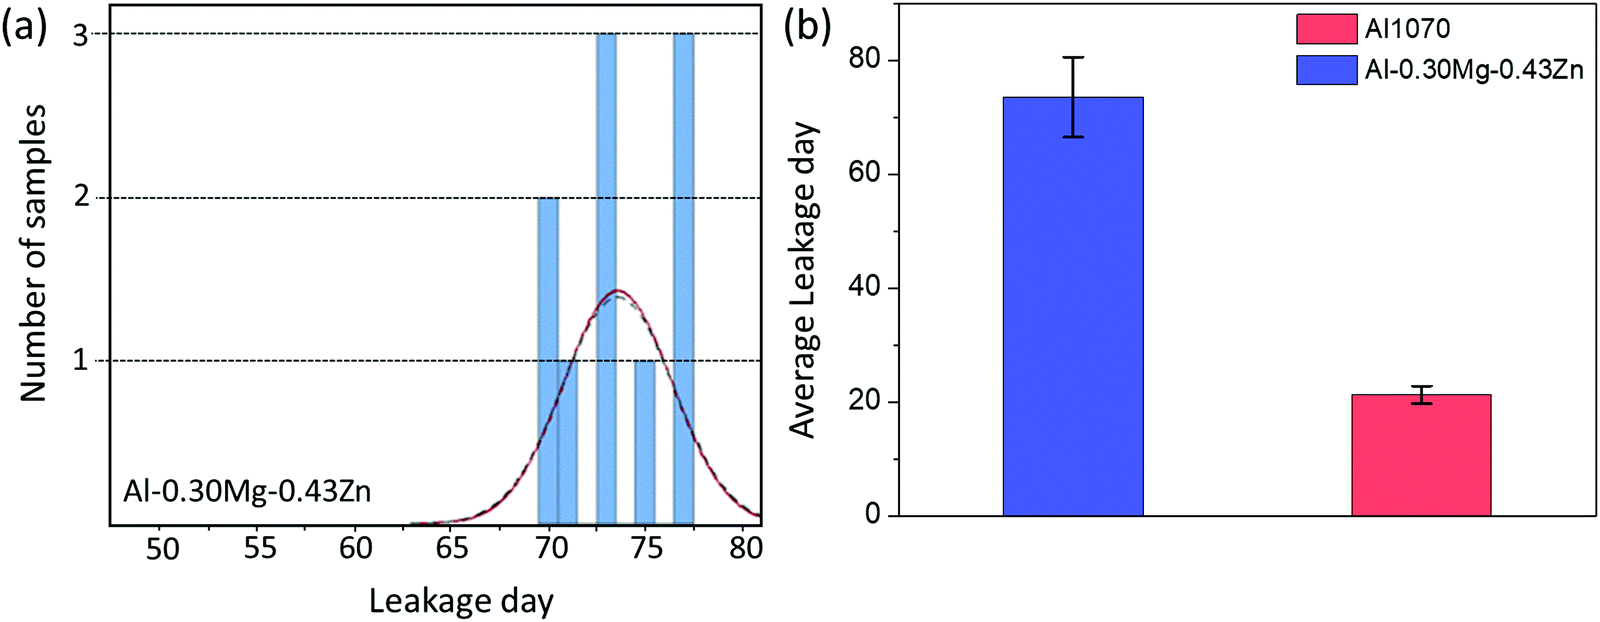 | ||
| Fig. 10 (a) The leakage day data of the Al–0.30Mg–0.43Zn alloy. (b) The histogram of the leakage day data of Al1070 and alloy Al–0.30Mg–0.43Zn. | ||
Conclusions
In this study, we found that β-Al3Mg2 and τ-Mg32(Al,Zn)49 phases were formed at the grain boundary in the Al–xMg–yZn alloy. The corrosion resistance of the Mg and Zn added samples was improved by harmonizing these two phases. Mg added to the Al alloy induced the transition from pitting corrosion to intergranular corrosion through the formation of a β-Al3Mg2 phase at the grain boundary, and Zn added to the Al–Mg alloy improved the corrosion resistance through potential difference changes in the matrix. Compared to the pristine Al1070 alloy, the corrosion potential of the Al–0.30Mg–0.43Zn alloy is decreased from −670 mV to −760 mV, the corrosion current is decreased from 110 μA cm−2 to 82 μA cm−2, the corrosion rate decreased from 951 μm per year to 556 μm per year, and the lifetime increased by 3.5 times from 21 days to 73.6 days in sea water acetic acid test solution. Therefore Al–0.30Mg–0.43Zn appears to be a desirable alloy candidate with improved corrosion resistance to replace Al1070.Author contributions
J. Lim: conceptualization, data curation, visualization, writing – original draft, writing – review & editing; G. Jeong: conceptualization, data curation, visualization, writing – original draft, writing – review & editing; K. Seo: conceptualization, data curation, funding acquisition, supervision, resources, validation, visualization, writing – review & editing; J. Lim: conceptualization, data curation, funding acquisition, supervision, resources, validation, visualization, writing – review & editing; S. Park: conceptualization, data curation, funding acquisition, supervision, resources, validation, visualization, writing – review & editing; W. Ju: conceptualization, data curation, funding acquisition, supervision, resources, validation, visualization, writing – review & editing; G. Janani: data curation, validation, writing – review & editing; D.-K. Lee: data curation, writing – review & editing; J. Y. Kim: conceptualization, supervision, validation, visualization, writing – original draft, writing – review & editing; M.-K. Han: conceptualization, data curation, supervision, validation, visualization, writing – original draft, writing – review & editing; T.-H. Kim: conceptualization, data curation, supervision, validation, visualization, writing – original draft, writing – review & editing; S. Park: conceptualization, data curation, funding acquisition, project administration, resources, supervision, validation, visualization, writing – review & editing; H. Cho: conceptualization, data curation, project administration, supervision, validation, visualization, writing – original draft, writing – review & editing; U. Sim: conceptualization, data curation, project administration, supervision, validation, visualization, writing – original draft, writing – review & editing.Conflicts of interest
There are no conflicts to declare.Acknowledgements
This research was supported by the Advanced R&D team of Digital Appliances Business by the Samsung Electronics and the National Research Foundation of Korea (NRF) Grant funded by the Korean Government (MSIP) (NRF-2021M3H4A6A01045764).References
- A. Milovanoff, I. D. Posen and H. L. MacLean, Quantifying environmental impacts of primary aluminum ingot production and consumption: A trade-linked multilevel life cycle assessment, J. Ind. Ecol., 2021, 25(1), 67–78, DOI:10.1111/jiec.13051.
- C. Vargel, Corrosion of aluminium, Elsevier, 2020 Search PubMed.
- J. R. Davis, Aluminum and aluminum alloys, ASM international, 1993 Search PubMed.
- M. Reboul and B. Baroux, Metallurgical aspects of corrosion resistance of aluminium alloys, Mater. Corros., 2011, 62(3), 215–233, DOI:10.1002/maco.201005650.
- N. Sukiman, X. Zhou, N. Birbilis, A. Hughes, J. Mol, S. Garcia, X. Zhou and G. Thompson, Durability and corrosion of aluminium and its alloys: overview, property space, techniques and developments, Alum. Alloys: New Trends Fabr. Appl., 2012, 5, 47–97, DOI:10.5772/53752.
- J. Lakshmipathy and B. Kulendran, Reciprocating wear behavior of 7075Al/SiC in comparison with 6061Al/Al2O3 composites, Int. J. Refract. Met. Hard Mater., 2014, 46, 137–144, DOI:10.1016/j.ijrmhm.2014.06.007.
- D. Wang and G. P. Bierwagen, Sol–gel coatings on metals for corrosion protection, Prog. Org. Coat., 2009, 64(4), 327–338, DOI:10.1016/j.porgcoat.2008.08.010.
- A. Patel, V. Panchal, G. Mudaliar and N. Shah, Impedance spectroscopic study of corrosion inhibition of Al-Pure by organic Schiff base in hydrochloric acid, J. Saudi Chem. Soc., 2013, 17(1), 53–59, DOI:10.1016/j.jscs.2011.06.003.
- M. A. Amin, S. S. Abd El Rehim, S. Moussa and A. S. Ellithy, Pitting corrosion of Al and Al–Cu alloys by ClO4− ions in neutral sulphate solutions, Electrochim. Acta, 2008, 53(18), 5644–5652, DOI:10.1016/j.electacta.2008.03.010.
- W. S. Tait, Corrosion prevention and control of chemical processing equipment, In Handbook of Environmental Degradation of Materials, Elsevier, 2005, pp. 565–581 Search PubMed.
- W. S. Tait, Controlling corrosion of chemical processing equipment, In Handbook of Environmental Degradation of Materials, Elsevier, 2018, pp. 583–600 Search PubMed.
- Z. Szklarska-Smialowska, Pitting corrosion of aluminum, Corros. Sci., 1999, 41(9), 1743–1767, DOI:10.1016/S0010-938X(99)00012-8.
- E. McCafferty, Sequence of steps in the pitting of aluminum by chloride ions, Corros. Sci., 2003, 45(7), 1421–1438, DOI:10.1016/S0010-938X(02)00231-7.
- R. Foley, Localized corrosion of aluminum alloys—a review, Corrosion, 1986, 42(5), 277–288, DOI:10.5006/1.3584905.
- T. Nguyen and R. Foley, The chemical nature of aluminum corrosion: III. the dissolution mechanism of aluminum oxide and aluminum powder in various electrolytes, J. Electrochem. Soc., 1980, 127(12), 2563 CrossRef CAS.
- F. Hunkeler and H. Bohni, Determination of pit growth rates on aluminum using a metal foil technique, Corrosion, 1981, 37(11), 645–650, DOI:10.1149/1.2129520.
- A. Sehgal, D. Lu and G. Frankel, Pitting in aluminum thin films: supersaturation and effects of dichromate Ions, J. Electrochem. Soc., 1998, 145(8), 2834 CrossRef CAS.
- C. Blanc and G. Mankowski, Susceptibility to pitting corrosion of 6056 aluminium alloy, Corros. Sci., 1997, 39(5), 949–959, DOI:10.1149/1.1838722.
- M. Starink and A.-M. Zahra, β′ and β precipitation in an Al–Mg alloy studied by DSC and TEM, Acta Mater., 1998, 46(10), 3381–3397, DOI:10.1016/S1359-6454(98)00053-6.
- Y. Ding, K. Gao, H. Huang, S. Wen, X. Wu, Z. Nie, S. Guo, R. Shao, C. Huang and D. Zhou, Nucleation and evolution of β phase and corresponding intergranular corrosion transition at 100–230 °C in 5083 alloy containing Er and Zr, Mater. Des., 2019, 174, 107778, DOI:10.1016/j.matdes.2019.107778.
- N. Bhargava, I. Samajdar, S. Ranganathan and M. Surappa, Role of cold work and SiC reinforcements on the β′/β precipitation in Al-10 pct Mg alloy, Metall. Mater. Trans. A, 1998, 29(11), 2835–2842, DOI:10.1007/s11661-998-0324-6.
- S. Nebti, D. Hamana and G. Cizeron, Calorimetric study of pre-precipitation and precipitation in Al-Mg alloy, Acta Metall. Mater., 1995, 43(9), 3583–3588, DOI:10.1016/0956-7151(95)00023-O.
- M. Carroll, P. Gouma, M. Mills, G. Daehn and B. Dunbar, Effects of Zn additions on the grain boundary precipitation and corrosion of Al-5083, Scr. Mater., 2000, 42(4), 335–340, DOI:10.1016/S1359-6462(99)00349-8.
- G. Scamans, N. Holroyd and C. Tuck, The role of magnesium segregation in the intergranular stress corrosion cracking of aluminium alloys, Corros. Sci., 1987, 27(4), 329–347, DOI:10.1016/0010-938X(87)90076-X.
- N. Birbilis and R. G. Buchheit, Electrochemical characteristics of intermetallic phases in aluminum alloys: an experimental survey and discussion, J. Electrochem. Soc., 2005, 152(4), B140, DOI:10.1149/1.1869984.
- R. Jones, D. Baer, M. Danielson and J. Vetrano, Role of Mg in the stress corrosion cracking of an Al-Mg alloy, Metall. Mater. Trans. A, 2001, 32(7), 1699–1711, DOI:10.1007/s11661-001-0148-0.
- J. Searles, P. Gouma and R. Buchheit, Stress corrosion cracking of sensitized AA5083 (Al-4.5 Mg-1.0 Mn), Metall. Mater. Trans. A, 2001, 32(11), 2859–2867 CrossRef.
- S. Jain, M. Lim, J. Hudson and J. Scully, Spreading of intergranular corrosion on the surface of sensitized Al-4.4 Mg alloys: A general finding, Corros. Sci., 2012, 59, 136–147, DOI:10.1007/s11661-001-1036-3.
- L. Tan and T. Allen, Effect of thermomechanical treatment on the corrosion of AA5083, Corros. Sci., 2010, 52(2), 548–554, DOI:10.1016/j.corsci.2009.10.013.
- C. Meng, D. Zhang, H. Cui, L. Zhuang and J. Zhang, Mechanical properties, intergranular corrosion behavior and microstructure of Zn modified Al–Mg alloys, J. Alloys Compd., 2014, 617, 925–932, DOI:10.1016/j.jallcom.2014.08.099.
- M. Kubota, Observation of beta phase particles in an isothermally aged Al-10 mass% Mg alloy with and without 0.5 mass% Ag, Mater. Trans., 2008, 0801150288, DOI:10.2320/matertrans.L-MRA2007885.
- A. Bigot, P. Auger, S. Chambreland, D. Blavette and A. Reeves, Atomic scale imaging and analysis of T'precipitates in Al-Mg-Zn alloys., Microsc., Microanal., Microstruct., 1997, 8(2), 103–113, DOI:10.1051/mmm:1997109.
- Y.-S. Kim, J. G. Park, B.-S. An, Y. H. Lee, C.-W. Yang and J.-G. Kim, Investigation of zirconium effect on the corrosion resistance of aluminum alloy using electrochemical methods and numerical simulation in an acidified synthetic sea salt solution, Materials, 2018, 11(10), 1982, DOI:10.3390/ma11101982.
- R. Ambat, A. J. Davenport, G. M. Scamans and A. Afseth, Effect of iron-containing intermetallic particles on the corrosion behaviour of aluminium, Corros. Sci., 2006, 48(11), 3455–3471, DOI:10.1016/j.corsci.2006.01.005.
- R. Buchheit and N. Birbilis, Electrochemical microscopy: An approach for understanding localized corrosion in microstructurally complex metallic alloys, Electrochim. Acta, 2010, 55(27), 7853–7859, DOI:10.1016/j.electacta.2010.04.046.
- J. R. Davis, Corrosion of aluminum and aluminum alloys, Asm International, 1999 Search PubMed.
- E. E. Oguzie, Corrosion inhibition of aluminium in acidic and alkaline media by Sansevieria trifasciata extract, Corros. Sci., 2007, 49(3), 1527–1539, DOI:10.1016/j.corsci.2006.08.009.
- E. Sherif and S.-M. Park, Effects of 1, 4-naphthoquinone on aluminum corrosion in 0.50 M sodium chloride solutions, Electrochim. Acta, 2006, 51(7), 1313–1321, DOI:10.1016/j.electacta.2005.06.018.
- A. S. Darmawan, T. W.-B. Riyadi, A. Hamid, B. W. Febriantoko and B. S. Putra, In Corrosion resistance improvement of aluminum under anodizing process, AIP Conf. Proc., 2018, 020006, DOI:10.1063/1.5042862 AIP Publishing LLC.
- L. F. Gomes, et al., Influences of alloying elements and dendritic spacing on the corrosion behavior of Al–Si–Ag alloys, J. Mater. Res. Technol., 2021, 15, 5880–5893, DOI:10.1016/j.jmrt.2021.11.043.
- N. C. Verissimo, et al., The effects of Zn segregation and microstructure length scale on the corrosion behavior of a directionally solidified Mg-25 wt% Zn alloy, J. Alloys Compd., 2017, 723, 649–660, DOI:10.1016/j.jallcom.2017.06.199.
- W. R. Osório, C. M. Freire and A. Garcia, The role of macrostructural morphology and grain size on the corrosion resistance of Zn and Al castings, Mater. Sci. Eng., A, 2005, 402(1-2), 22–32, DOI:10.1016/j.msea.2005.02.094.
- W. R. Osório, C. M. Freire and A. Garcia, The effect of the dendritic microstructure on the corrosion resistance of Zn–Al alloys, J. Alloys Compd., 2005, 397(1-2), 179–191, DOI:10.1016/j.jallcom.2005.01.035.
- Kleber S. Cruz, et al., Dendritic arm spacing affecting mechanical properties and wear behavior of Al-Sn and Al-Si alloys directionally solidified under unsteady-state conditions, Metall. Mater. Trans. A, 2010, 41(4), 972–984, DOI:10.1007/s11661-009-0161-2.
- W. R. Osorio, P. R. Goulart and A. Garcia, et al., Effect of dendritic arm spacing on mechanical properties and corrosion resistance of Al 9 Wt Pct Si and Zn 27 Wt Pct Al alloys, Metall. Mater. Trans. A, 2006, 37, 2525–2538, DOI:10.1007/BF02586225.
- W. R. Osório, E. S. Freitas and A. Garcia, EIS and potentiodynamic polarization studies on immiscible monotectic Al–In alloys, Electrochim. Acta, 2013, 102, 436–445, DOI:10.1016/j.electacta.2013.04.047.
- X. L. Zhang, Z. H. Jiang, Z. P. Yao, Y. Song and Z. D. Wu, Effects of scan rate on the potentiodynamic polarization curve obtained to determine the Tafel slopes and corrosion current density, Corros. Sci., 2009, 51, 581–587, DOI:10.1016/j.corsci.2008.12.005.
- E. McCafferty, Validation of corrosion rates measured by the Tafel extrapolation method, Corros. Sci., 2005, 47, 3202–3215, DOI:10.1016/j.corsci.2005.05.046.
- P. K. Rastogi, B. K. Shah, A. K. Sinha and P. G. Kulkarni, Effect of oxide film on pitting susceptibility of 304 austenitic stainless steel, Br. Corros. J., 1994, 29(1), 78–80, DOI:10.1179/000705994798267953.
- D. A. Kaplowitz, G. Jian, K. Gaskell, R. Jacob and M. R. Zachariah, Synthesis and Reactive Properties of Iron Oxide–Coated Nanoaluminum, J. Energ. Mater., 2014, 32(2), 95–105, DOI:10.1080/07370652.2013.767288.
- H.-H. Huang, W.-C. Shih and C.-H. Lai, Nonpolar resistive switching in the Pt/MgO/Pt nonvolatile memory device, Appl. Phys. Lett., 2010, 96(19), 193505, DOI:10.1063/1.3429024.
- D. Xu, D. Fan and W. Shen, Catalyst-free direct vapor-phase growth of Zn 1− x Cu x O micro-cross structures and their optical properties, Nanoscale Res. Lett., 2013, 8(1), 1–9, DOI:10.1186/1556-276X-8-46.
- L. Zhao, H. Liu, X. Wang, X. Feng and C. Fei, Band alignments of O 3-based and H 2 O-based amorphous LaAlO 3 films on silicon by atomic layer deposition, J. Mater. Sci.: Mater. Electron., 2017, 28(1), 803–807, DOI:10.1007/s10854-016-5593-z.
- D. Sóvári, A. Kormos, O. Demeter, A. Dancsó, G. M. Keserű, M. Milen and P. Ábrányi-Balogh, Synthesis and fluorescent properties of boroisoquinolines, a new family of fluorophores, RSC Adv., 2018, 8(67), 38598–38605, 10.1039/C8RA08241C.
- G. Janani, S. Yuvaraj, S. Surendran, Y. Chae, Y. Sim, S.-J. Song, W. Park, M.-J. Kim and U. Sim, Enhanced bifunctional electrocatalytic activity of Ni-Co bimetallic chalcogenides for efficient water-splitting application, J. Alloys Compd., 2020, 846, 156389, DOI:10.1016/j.jallcom.2020.156389.
- K. Mutombo and M. Du Toit, Corrosion fatigue behaviour of aluminium 5083-H111 welded using gas metal arc welding method, Arc Welding, 2011, vol. 139, p. 105789. DOI:10.5772/25991.
- M. Kciuk, A. Kurc and J. Szewczenko, Structure and corrosion resistance of aluminium AlMg2. 5; AlMg5Mn and AlZn5Mg1 alloys, J. Achiev. Mater. Manuf. Eng., 2010, 41(1/2), 74–81 Search PubMed.
- K. S. Rao and K. P. Rao, Pitting corrosion of heat-treatable aluminium alloys and welds: a review, Trans. Indian Inst. Met., 2004, 57(6), 593–610 CAS.
- K. Xhanari and M. Finšgar, Organic corrosion inhibitors for aluminum and its alloys in chloride and alkaline solutions: a review, Arabian J. Chem., 2019, 12(8), 4646–4663, DOI:10.1016/j.arabjc.2016.08.009.
- M. Reboul, T. Warner, H. Mayer and B. Barouk, A ten step mechanism for the pitting corrosion of aluminium alloys, Corros. Rev., 1997, 15(3-4), 471–496, DOI:10.1515/CORRREV.1997.15.3-4.471.
- F. Eckermann, T. Suter, P. J. Uggowitzer, A. Afseth and P. Schmutz, The influence of MgSi particle reactivity and dissolution processes on corrosion in Al–Mg–Si alloys, Electrochim. Acta, 2008, 54(2), 844–855, DOI:10.1016/j.electacta.2008.05.078.
- A. Boag, A. Hughes, A. Glenn, T. Muster and D. McCulloch, Corrosion of AA2024-T3 Part I: Localised corrosion of isolated IM particles, Corros. Sci., 2011, 53(1), 17–26, DOI:10.1016/j.corsci.2010.09.009.
- N. Birbilis, M. K. Cavanaugh and R. G. Buchheit, Electrochemical behavior and localized corrosion associated with Al7Cu2Fe particles in aluminum alloy 7075-T651, Corros. Sci., 2006, 48(12), 4202–4215, DOI:10.1016/j.corsci.2006.02.007.
Footnote |
| † These authors contributed equally to this work. |
| This journal is © The Royal Society of Chemistry 2022 |