DOI:
10.1039/D1MA01193F
(Paper)
Mater. Adv., 2022,
3, 2222-2233
Nanohybrid biosensor based on mussel-inspired electro-cross-linking of tannic acid capped gold nanoparticles and enzymes†
Received
16th December 2021
, Accepted 24th January 2022
First published on 25th January 2022
Abstract
Complementary tools to classical analytical methods, enzymatic biosensors are widely applied in medical diagnosis due to their high sensitivity, potential selectivity, and their possibility of miniaturization/automation. Among the different protocols of enzyme immobilization, the covalent binding and cross-linking of enzymes ensure the great stability of the developed biosensor. Obtained manually by drop-casting using a specific cross-linker, this immobilization process is not suitable for the specific functionalization of a single electrode out of a microelectrode array. In the present work, we developed a nanohybrid enzymatic biosensor with high sensitivity by a mussel-inspired electro-cross-linking process using a cheap and abundant natural molecule (tannic acid, TA), gold salt, and native enzymes. Based on the use of a cheap natural compound and gold salt, this electro-cross-linking process based on catechol/amine reaction (i) is versatile, likely to be applied on any kind of enzymes, (ii) does not require the synthesis of a specific cross-linker, (ii) gives enzymatic biosensors with high and very stable sensitivity over two weeks upon storage at room temperature and (iv) is temporally and spatially controlled, allowing the specific functionalization of a single electrode out of a microelectrode array. Besides the development of microbiosensors, this process can also be used for the design of enzymatic biofuel cells.
1. Introduction
In the fields of environmental monitoring, food industry, or clinical analyses, the development of selective tools with rapid analysis time for biomolecule detection is more and more required. The interest in biosensors has grown exponentially in recent decades.1 According to the definition of IUPAC, a biosensor is composed of (i) an immobilized biological element (protein, DNA) able to recognize and detect a specific analyte (organic (bio)molecule or ions) and (ii) a transducer that converts the (bio)chemical recognition into electrical, thermal or optical signals. They are complementary tools to classical analytical methods (e.g. high-performance liquid chromatography) due to their inherent simplicity, rapid response, and the possibility of miniaturization. In particular, the electrochemical enzymatic biosensor has shown great promise as a miniaturized real-time controller for human health (diabetes)2 and environment monitoring (organopesticides pollution)3 with new opportunities discovered year after year.4,5 Enzyme immobilization on the working electrode is a key factor to develop mechanically robust biosensors which retain their selectivity, sensitivity, and reproducibility over time. Most of the protocols are almost restricted to drop-casting or electrodeposition routes based on adsorption, covalence, entrapment, cross-linking, or affinity strategies. Each immobilization method presents advantages and drawbacks.6 Even if their activity is often decreased in comparison to its native form, covalent binding and cross-linking of enzymes ensure great stability of the biosensor. Obtained manually drop-casting, these immobilization processes are not suitable for the specific functionalization of a single electrode out of a microelectrode array. The electrodeposition of macromolecules is a simple and attractive bottom-up approach to finely control the immobilization of enzymes on electrode surfaces using an electrical stimulus. However, the enzymes are usually entrapped within a polymeric matrix or adsorbed on the electrode. Recently, we reported the first electro-cross-linking of enzymes process allowing the localized immobilization of glucose oxidase (GOx) on microelectrodes.7 In this mussel-inspired process, a synthesized homobifunctionalized catechol cross-linker was electro-oxidized to react with amine moieties of GOx by using ferrocene methanol (FcOH) as a mediator. The cross-linked enzymatic film (i) was obtained in a one-pot process using a native enzyme, (ii) was strongly linked to the metallic electrode surface thanks to catechol moieties, and (iii) presented no leakage issues. The sensitivity of the biosensor was similar to the ones obtained by manual drop-casting of GOx and glutaraldehyde cross-linker. Nanomaterials, such as metal nanoparticles, have been widely used to improve the detection limits and sensitivity of enzymatic biosensors. Their large surface-to-volume ratio and good electron transfer ability allow them to amplify the electrochemical signal and to improve the accuracy and lifetime of the glucose biosensors.8
In this work, we have extended the electro-cross-linking of the enzyme process towards the use of natural and abundant molecules, i.e. tannic acid (TA), and metallic nanoparticles to obtain an enzymatic biosensor with high sensitivity. For this purpose, TA capped gold nanoparticles (TA@AuNPs) and GOx were electro-cross-linked by the application of an anodic potential (Scheme 1). TA is a polyphenol composed of five gallol moieties which have the same chemical properties as catechol. To avoid any use of synthesized cross-linker in the process, TA was used as both reducing of Au3+ ions and capping agent to synthesize TA@AuNPs. The presence of gallol moieties on the surface of TA@AuNPs allowed the adsorption of GOx around the NPs, through hydrogen bonds and hydrophobic interactions. When an anodic potential is applied, gallol moieties are oxidized into quinones able to react covalently with amine moieties of GOx and gallol moieties of TA@AuNPs. An efficient immobilization of GOx/TA@AuNPs is obtained which allows the electrochemical detection of glucose using FcOH as a free mediator in solution with high sensitivity and selectivity. Finally, the film buildup, occurring exclusively from the surface, can be prepared on microelectrodes. This polyphenol based electro-cross-linking process (i) is versatile, likely to be applied on any kind of enzymes, (ii) does not require the synthesis of a specific cross-linker, (ii) give enzymatic biosensors with high and very stable sensitivity over two weeks upon storage at room temperature and (iv) is temporally and spatially controlled.
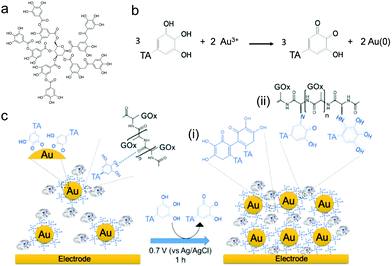 |
| | Scheme 1 (a) Chemical formula of tannic acid (TA), (b) mechanism of TA@AuNPs synthesis by reduction of Au3+ ions by TA in water. (c) Schematic representation of the electro-cross-linking of GOx/TA@AuNPs through electro-oxidation of gallol moieties of TA@AuNPs into quinone moieties followed by their chemical reaction with (i) gallol moieties of TA@AuNPs and (ii) free amino moieties of GOx through Michael addition and a Schiff's base condensation reaction. | |
2. Experimental
2.1 Chemicals
Glucose oxidase from Aspergillus Niger sp. type X–S (GOx, ∼168 U mg−1, Mw = 160 kDa, G7141, CAS 9001-37-0), horseradish peroxidase (HRP, ∼250 U mg−1, Mw = 44 kDa, CAS 9003-99-0), tannic acid (TA, Mw = 1701.23 g mol−1, CAS 1401-55-4), Hydrogen peroxide solution 30 wt% (H2O2, Mw = 34.01 g mol−1, CAS 7722-84-1), iron(III) chloride hexahydrate ≥ 99% (FeCl3, Mw = 270.3 g mol−1, CAS 10025-77-1) gum arabic from branched tree (CAS 9000-01-5), phosphoric acid ≥85% (H3PO4, Mw = 98 g mol−1, CAS 57664-38-2) and phosphate buffered saline tablets (PBS) were purchased from Sigma-Aldrich.
Hydrogen tetrachloroaurate(III) hydrate (HAuCl4, Mw = 393.83 g mol−1, CAS 27988-77-8), D-(+) glucose anhydrous 99% (Mw = 180.16 g mol−1, CAS 50-99-7) were purchased from Alfa Aesar. Gallic acid (GA, Mw = 170.12 g mol−1, CAS 149-91-7), sodium chloride ≥99.5% (NaCl, Mw = 58.44 g mol−1, CAS 7631-99-4), potassium carbonate ≥99.5% (K2CO3, Mw = 138.21 g mol−1, CAS 209-529-3) were purchased from Fisher. Potassium hexacyanoferrate(III) (K3FeIIICN6, Mw = 329.25 g mol−1, CAS 13746-66-2) and ferrocene methanol ≥ 95% (FcOH, Mw = 216.1 g mol−1, CAS 1273-86-5) were purchased from Merck and FluoroChem respectively. All chemicals were used as received and solution were prepared using Milli-Q water with 18.2 MΩ cm resistivity.
2.2 Tannic acid capped gold nanoparticles synthesis (TA@AuNPs)
The gold nanoparticle synthesis procedure was adapted from Sivaraman et al.9 First, 2 mM HAuCl4 and 0.3 mM TA solutions were prepared separately in Milli-Q water. TA solution was adjusted à pH 7 with 150 mM K2CO3. Both solutions were then filtered on 0.45 μm Regenerated Cellulose (RC) filters and flushed with argon for 5 min. 8 mL of HAuCl4 solution were then slowly added in 12 mL of TA solution with a peristaltic pump (ISM596, Ismatec, Switzerland) at a constant flow rate of 500 μL min−1 under 750 rpm agitation. During the procedure, 20 μL of 150 mM K2CO3 were added every 2 min to compensate for the acidification caused by the addition of HAuCl4 solution as well as the oxidation of polyphenols. After 16 min of the addition step, a dark reddish solution was obtained with a final TA/Au ratio of 0.22. The obtained TA capped gold nanoparticles were denoted as TA@AuNPs, flushed with argon, and stored up to 2 months at 4 °C to prevent TA suroxidation due to dissolved oxygen. Before use, this solution was centrifuged for 60 min at 13![[thin space (1/6-em)]](https://www.rsc.org/images/entities/char_2009.gif) 500 rpm (12200 g) with a VWR Microstar 12 set-up to remove all unbound oxidized polyphenols from the solution and redispersed in water or the GOx mixture solution.
500 rpm (12200 g) with a VWR Microstar 12 set-up to remove all unbound oxidized polyphenols from the solution and redispersed in water or the GOx mixture solution.
2.3 TA@AuNPs characterizations
Dynamic Light Scattering experiments were carried out to retrieve hydrodynamic size as well as zeta potential with a Malvern Nanosizer ZS with a measurement angle of 173° by collecting five runs of the autocorrelation function per sample at 25 °C. TA@AuNPs concentration was accurately determined by three different methods. The first one is based on the measurement of the absorbance at the plasmon resonance maximum wavelength (526 nm for 12 nm TA@AuNPs) and the use of the extinction coefficient10 of 1.89 × 10⁸ M−1 cm−1. The second method is a gravimetric measurement by accurately weighting 1.5 mL of dried TA@AuNPs solution. The third method, the Turkevich method, is based on the use of the theoretical concentration obtained by the following equation by assuming a homogeneous distribution of nanoparticles in size:
With A524nm the absorbance of washed undiluted TA@AuNPs solution at 524 nm, l the optical length path, m the weighted mass in grams for an initial volume Vini (1.5 × 10⁻³ L), NA the Avogadro number, Mw(Au), the molar mass of gold (196.96 g mol−1), c(Au) = 0.8 mM the concentration of gold in solution, d(Au) the density of gold (19.32 g cm−3) and DTA@AuNPs the diameter of TA@AuNPs. TA@AuNPs and GOx/TA@AuNPs mixture suspensions were characterized by Transmission Electron Microscopy (TEM, FEI Tecnai G2). A 5 μL drop of the solution is applied on a freshly glow discharge carbon covered after 1 min a 5 μL drop of 1% uranyl acetate solution is added and finally the excess is removed after 1 min. The grids are observed under 200 kV and the image acquired with an Eagle slow-scan CCD camera (FEI). The reactivity of TA@AuNPs towards amine was determined with a Prussian Blue assay adapted from Graham11 to evaluate the quantity of gallol moieties present at the surface of TA@AuNPs. This assay is based on the reduction of FeIII(CN)63− to FeII(CN)64− by gallol moieties which then produce Prussian Blue compound with Fe3+ from FeCl3, depicted below:
| Gallol + 2 FeIII(CN)63− → Quinone + 2H+ + 2 FeII(CN)64− |
| 4 Fe3+ + 3 FeII(CN)64− → FeIII4[FeII(CN)6]3 |
Briefly, 10 μL of the washed TA@uNPs solution was mixed in 96-well plates with 20 μL of 25 mM FeCl3, prepared in 0.1 M HCl, quickly followed by the addition of 20 μL of 20 mM K4Fe(CN)6, prepared in Milli-Q water. Subsequently, the mixture solution was orbitally shaken for 10 min and 150 μL of a stabilizing solution was added 5 min later. The stabilizing solution was a 3:1:1 mixture of 85% wt H3PO4, 10% wt gum arabic, and water. Immediately after the addition of the stabilizing solution, the absorbance was read at 690 nm with a SAFAS Xenius XML reader corresponding to the maximum absorbance of Prussian Blue. An equivalent of 4.8 gallol moieties (GA) per TA was determined with this test, in agreement with the chemical formulae of TA composed of 5 outer GA moieties.
2.4 Colorimetric enzymatic tests
Before the enzymatic tests, enzyme concentration was determined (Tables S1 and S2, ESI†). All tests were performed in PBS 10 mM at room temperature to mimic the operating condition in a physiological medium. GOx assay was a dual enzymes system using Horseradish Peroxidase (HRP) and a chromogen substrate 2,2′-azino-bis(3-ethylbenzothiazoline-6-sulfonic acid) (ABTS) both in large excess to regards with GOx concentration. GOx concentration was calculated taking into account that 80% of the weighted mass is the enzyme according to a Bradford test and the absorbance at 280 nm (ε = 263 mM−1 cm−1).12 The calibration curve was obtained by mixing 10 μL of GOx (concentration ranging from 0.01 to 10 μg mL−1), 10 μL of 1 mg mL−1 HRP both prepared in water and dispersed with 40 μL of water/inhibitors. 140 μL of 1 mM ABTS and 10 mM glucose solution, prepared in PBS 10 mM was added at the end. GOx/TA@AuNPs and GOx/TA suspension activities were determined by replacing the 40 μL of water with 40 μL of TA@AuNPs or TA solution allowing a one-hour rest period before the addition of ABTS/glucose solution. The activity of GOx bounded to TA@AuNPs was determined after a centrifugation procedure (13500 rpm, 60 min) and a redispersion in an equivalent volume of water, as the retrieved supernatant.
2.5 Aggregation tests
GOx solution and TA@AuNPs suspension were mixed at different molar ratios from 10 to 150 in water at room temperature. After a resting time of 30 min, the aggregation test was performed at a final concentration of 1 M NaCl by adding 50 μL of 5 M NaCl solution to the mixture of 100 μL NPs solution and 100 μL GOx solution. The absorbance spectra of GOx/TA@AuNPs suspensions were then recorded with a spectrophotometer (SAFAS Xenius, Monaco). The shift of λmax allowed to follow the aggregation of GOx/TA@AuNPs. The size of the aggregates was also determined by DLS (Malvern Panalytical, UK).
2.6 Electrodeposition solution
A 5 mM FcOH solution was prepared in water using an ultrasonic bath for 30 min to quicken the dissolution with a temperature kept below 50 °C. To avoid the presence of aggregates, the solution was filtered with a 0.2 μm RC syringe filter after cooling at room temperature. The filtration has a negligible effect on the redox peaks intensities of FcOH, measured by cyclic voltammetry. The enzyme (GOx) was dissolved in the FcOH solution at 5 μM by taking into account that 80% of the weighted mass correspond to the mass of an enzyme (Section S1, ESI†). 3 mL TA@AuNPs suspension was centrifuged for 60 min at 13500 rpm to remove the supernatant and redispersed in 300 μL FcOH/GOx mixture solution to reach 30 in GOx/NPs molar ratio, close to the theoretical optimal ratio to obtain a monolayer of enzyme on the NPs (Paragraph S2 in the ESI†). After 30 min, 1 M NaCl solution (15 μL) was added to reach 50 mM NaCl in FcOH/GOx/TA@AuNPs suspension.
2.7 Electrochemical quartz crystal microbalance (EC-QCM)
Q-Sense E1 from Q-Sense AB (Sweden) was used to perform the electrochemical quartz microbalance (EC-QCM) experiments by monitoring the changes in the resonance frequency fν and the dissipation factor Dν of an oscillating gold-coated quartz crystal (QCM5140TiAu120-050-Q, QuartzPro, Sweden) upon adsorption of a viscoelastic layer (ν, the overtone number, equal to 1, 3, 5 and 7). The measurements were done at 5 (ν = 1), 15 (ν = 3), 25 (ν = 5) and 35 (ν = 7) MHz after the excitation of the quartz crystal at its fundamental frequency (5 MHz). For clarity purposes, only the evolution of −Δf3/3, the opposite of the third overtone of the frequency shift, measured at 15 MHz, is presented. Thus, an increase of −Δf3/3 corresponds to an increase of the mass adsorbed. The evolution of the dissipation value is not presented here as it was following the same trend as the frequency shift. Electrochemical measurements were performed on a CHI660E apparatus from CH instrument (Austin, Texas) coupled on the Q-Sense E1 apparatus with a three-electrode system: The gold-coated QCM sensor acted as the working electrode. A platinum electrode (counter electrode) on the top wall of the chamber and a no-leak Ag/AgCl reference electrode fixed in the outlet flow channel were used respectively as counter and reference electrodes. The internal volume of the EC-QCM cell was 100 μL and the electrode distance was fixed at 0.8 mm for WE/CE and 5 mm for WE/RE. Before any experiments, the crystals were cleaned for 30 min using a UV/Ozone cleaner (ProCleaner, BioForce Nanoscience). Before every deposition, RE potential was carefully checked against FcOH/Fc+OH and the stabilization of all the frequencies was achieved. The deposition was performed by applying a constant + 0.7 V bias for one hour. After the deposition, the sample was washed inside the cell with at least 4 mL of the supporting electrolyte (NaCl 50 mM) until no more electrochemical signature for FcOH was observed. The GOx/TA@AuNPs coating was then washed with water before the electrochemical measurements or kept in a dry state at room temperature for further characterization with Scanning Electron Microscopy (SEM, Hitachi SU8010) or XPS characterizations.
2.8 Scanning electron microscopy (SEM)
A Hitachi SU 8010 Ultra High-Resolution Field Emission Scanning Electron Microscope was used to characterize the morphology of GOx/TA@AuNPs coating. Micrographs were retrieved with an accelerating voltage of 1 kV and a working distance of 3 mm. Emission current was respectively 5 μA for Secondary electron (SE) micrographs and 20 μA for low-angle backscattered electron (LA-BSE) micrographs.
2.9 X-Ray photoelectron spectroscopy (XPS)
Thermo Scientific K-alpha+ spectrometer was used to acquire the XPS spectra. The monochromatic AlKα line was used as X-ray excitation (1486.6 eV) with a pass energy of 50 eV to obtain high-resolution spectra. The samples were analyzed using a microfocused, monochromated Al Kα X-ray source (400 μm spot size). XPS spectra were fit with one or more Voigt profiles (binding energy uncertainty: ±0.2 eV) and Scofield sensitivity factors were applied for quantification.13 All spectra were referenced to the C 1s peak (C–C, C–H) at 285.0 eV binding energy controlled using the photoelectron peaks of metallic Cu, Ag, and Au, respectively. Carbon (C 1s) spectra were done at the beginning and after each resolution analysis, to check the absence of any sample degradation under irradiation. Argon cluster ion beam irradiations were performed using the Thermofisher Scientific MAGCIS dual-beam ion source. The average kinetic energy and cluster size of each cluster were fixed to 8000 eV and 300 atoms, respectively. The incoming argon clusters reach the sample with an angle of 30° from the surface normal, and the ion current density is fixed to ∼ 10 μA cm−2. The samples are irradiated on a square area of ∼ 2 × 2 mm2, while the size of the XPS analysis zone is 400 × 400 μm2 in the center of this irradiated area (Non-linear bombardment “from 10 seconds to 481 seconds” is performed between 2 sets of recorded spectra on all profiles).
2.10 Electrodeposition on microelectrodes
The same solution described in Section 2.6 was used to electrodeposit the GOx/TA@AuNPs coating on gold interdigitated array electrode (IDA ref: A-0.12125, ALS, Japan). One gold interdigitated electrode was used as a working electrode with the large gold electrode engraved on the device as the counter electrode and the no-leak Ag/AgCl reference electrode. The deposition was triggered by applying + 0.7 V (vs. Ag/AgCl) for 15 min.
2.11 Electroactive surface area
To evaluate the electroactive surface area, the following test was performed before and after the deposition of GOx/TA@AuNPs coatings. Cyclic voltammograms were registered at various scan rates from 5 to 500 mV s−1 on the bare gold crystal (working electrode) in contact with 0.5 mM FcOH in 50 mM NaCl solution. After the electrodeposition, the GOx/TA@AuNPs coatings were rinsed with 50 mM NaCl for 10 min to remove all the free FcOH until only the capacitive signal is visible. The faradaic CV cycles were then repeated on the electrodeposited coatings in contact with 0.5 mM FcOH/50 mM NaCl solution. The following Randles–Sevcik equation was then used to estimate the electroactive surface area.
2.12 Biosensing characterizations
All the electrochemical measurements were carried out in 10 mM PBS solution on the CHI 660E electrochemical workstation (CH Instruments, USA). The same electrode set-up used during the electrodeposition served to perform the electrochemical biosensor performance. The gold-coated QCM crystal was used as the working electrode. Cyclic Voltammetry measurements were performed by injecting 600 μL of solutions of different analyte solutions in the presence of FcOH. The chronoamperometric curves were performed at a constant potential of 0.25 V (vs. Ag/AgCl) with 0.5 mM FcOH for glucose and 0.19 V with 0.1 mM FcOH for H2O2 respectively. A surface area of 0.8 cm2, corresponding to the exposed area of the gold QCM sensor, was used for current density calculations.14 The sensitivity was monitored along a period of two weeks on three different glucose biosensors. The following characteristics of the biosensor were determined: the sensitivity (s), i.e. the slope of the linear range of current density vs. analyte concentration, and the limit of detection (LOD), i.e. 3 × stdintercept/s with stdintercept the standard deviation of the intercept. Michaelian constants were determined electrochemically to retrieve the affinity of glucose toward GOX/TA@AuNPs film using the following Lineweaver–Burk linearization of Michaelis–Menten equation:
with KappM the Michaelis constant, iSS the steady-state current for a given glucose concentration [S], and imax the current plateau in presence of 100 mM glucose and 0.5 mM FcOH.
3. Results and discussion
3.1 TA@AuNPs synthesis and characterization
Sivaraman et al.9 protocol synthesis was adapted to produce TA@AuNPs by a simple and rapid process at room temperature.
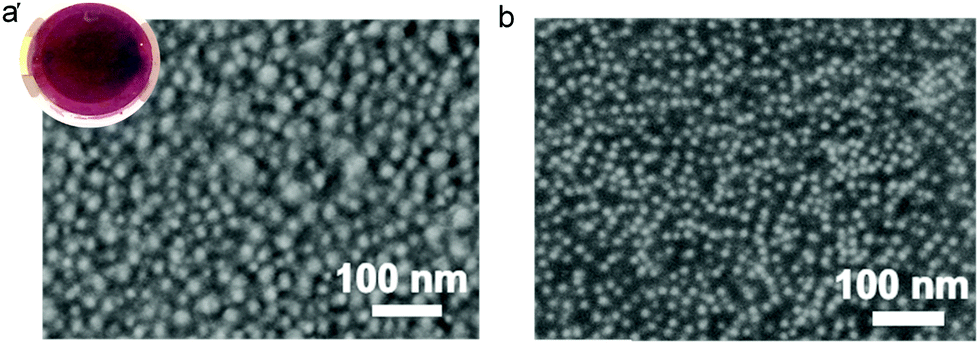
Thanks to its gallol moieties, TA was used as both reducing of Au3+ ions and stabilizing agent of Au metal (Scheme 1b). TA@AuNPs synthesis was performed at pH 7 by slow addition of 2 mM HAuCl4 solution into 0.3 mM TA solution. After 10 min of reaction, the suspension was centrifuged and redispersed in water. Negatively stained TEM images revealed regular and uniformly distributed metal species with a size of 12 ± 2 nm in diameter (Fig. 1a). The hydrodynamic diameter of the TA@AuNPs, measured by DLS in intensity, was 24 ± 3 nm. The hydrodynamic radius is directly related to the diffusive motion of the particles and is usually higher than the inorganic core of the NPs.15 The concentration of the suspension was 1.0 ± 0.1 × 10¹⁶ NPs L−1, i.e. 16 ± 2 nM, determined by UV-Visible spectroscopy (λmax = 526 nm) and confirmed by the Turkevich and gravimetric methods. The size of the TA@AuNPs remained stable over two months of storage under argon, highlighting the high stability of the suspension (Fig. S1 in the ESI†).
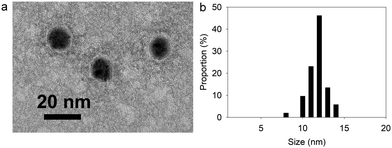 |
| | Fig. 1 Characterization of TA@AuNPs: (a) TEM image and (b) size distribution of TA@AuNPs determined from TEM images. | |
The reactivity of TA at the surface of the TA@AuNPs is a critical parameter for the mussel-inspired electro-cross-linking process. Indeed, this process is based on the reaction of electro-oxidized gallol moieties of TA with catechol moieties of TA and the amine moieties of the enzymes (Scheme 1).16 Thus, the content in gallol moieties, equivalent to gallic acid, was determined using a redox test based on the reduction of FeIII(CN)63− into FeII(CN)64− and the further formation of Prussian Blue (FeIII4[FeII(CN)6]3) in the presence of Fe3+ ions. Each TA@AuNPs presented 4.5 ± 0.7 × 10³ gallol moieties at their surface, corresponding to 10 moieties per nm2. With TA molecules equivalent to 4.73 gallol moieties, the NPs surface has approximatively 2 TA molecules per nm2. Knowing that TA has a hydrodynamic radius of around 1.0 ± 0.3 nm, it is likely that TA is not in its native form when on the surface of NPs.
3.2 GOx/TA@AuNPs complexes characterization
After synthesis, the TA@AuNPs suspension was mixed with a GOx solution at 60 in GOx/NPs molar ratio and directly observed by TEM after uranyl acetate negative staining (Fig. 2a). The gold NPs present a light grey corona (arrow) of ∼8 nm due to the attachment of the protein to the NPs (Fig. 2b). In the background, some free enzyme molecules are visible (black arrows) with a size of around 6 ± 2 nm (size of GOx deglycosylated dimer: 6.0 × 5.2 × 7.7 nm3).17
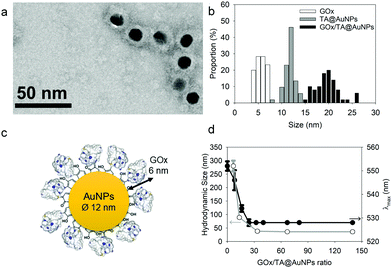 |
| | Fig. 2 Characterization of GOx/TA@AuNPs complexes: (a) typical TEM image, obtained after uranyl acetate staining, (b) size distribution of GOx, TA@AuNPs and GOx/TA@AuNPs determined from TEM images with (c) the schematic illustration of GOx/TA@AuNPs (d) Aggregation test upon addition of 1 M NaCl in the GOx/TA@AuNPs suspension: the hydrodynamic size (white circle) and maximum absorption wavelength (black circle) values as a function of GOx/NPs molar ratio. | |
The hydrodynamic size of GOx/TA@AuNPs, obtained by DLS in intensity, was measured at 35 ± 6 nm in agreement with the formation of a monolayer (Fig. 2c). It is known that full coverage of NPs by proteins prevents their aggregation in the presence of salt.18 To determine the optimal GOx/NPs molar ratio for full coverage of the NPs, an aggregation assay was performed at different molar ratios. With this aim, the maximum absorption wavelength (λmax) and the hydrodynamic size of GOx/TA@AuNPs suspensions were measured after the addition of 1 M NaCl by UV-Visible spectroscopy and by DLS, respectively (Fig. 2d). At GOx/NPs molar ratio of 10, the addition of salt induced the shift of the λmax from 528 to 548 nm and the formation of aggregates of 270 nm in size. Up to 33.5 in GOx/NPs molar ratio, the λmax reached a plateau at 528 nm and the size of the aggregates decreased to the values of isolated GOx/TA@AuNPs in water (Fig. S2, ESI†). The aggregation of NPs is then prevented for GOx/NPs molar ratio ≥ 33.5, in agreement with the theoretical value of 30 in GOx/NPs molar ratio corresponding to full coverage of the surface of the NPs (Section S2, ESI†). TA strongly interacts with enzymes through hydrogen bonds, hydrophobic interactions, or covalent adduct formation.16,19 It is known that TA and more generally tannins inhibit the catalytic activity of enzymes either by modification of their conformation16 or by substrate deprivation.20 Therefore, the enzymatic activity of GOx/TA@AuNPs was evaluated using a colorimetric assay and compared to GOx solution at the same enzyme concentration. Fig. 3a shows the percentage of inhibition of GOx at different GOx/NPs molar ratios.
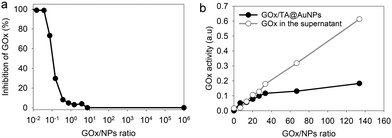 |
| | Fig. 3 GOx/TA@AuNPs activity (a) percentage of enzymatic inhibition in the presence of TA@AuNPs as a function of GOx/NPs ratio, in comparison to the same concentration of GOx in solution (b) enzymatic activity of rinsed GOx/TA@AuNPs, i.e. after centrifugation and redispersion in water, and the retrieved supernatant as a function of GOx/NPs ratio. | |
Above 0.5 GOx/NPs molar ratio, the GOx inhibition is less than 3% becoming completely negligible above the value of 30, the theoretical ratio value for full coverage. In comparison, TA free in the solution presented a similar inhibition towards GOx when reported in equivalent GA moieties (Fig. S3, ESI†). Adsorbed GOx on the surface of TA@AuNPs remained fully active. After 24 h, the GOx/TA@AuNPs mixture suspension was centrifuged to determine the GOx activity of redispersed GOx/TA@AuNPs in water and the retrieved supernatant containing the enzyme in excess (Fig. 3b). The enzymatic activity of the rinsed GOx/TA@AuNPs increased with the quantity of GOx introduced which confirms the adsorption of active enzymes on TA@AuNPs. Beyond 33 in GOx/NPs molar ratio, the enzymatic activity of GOx/TA@AuNPs reached a plateau with an increase of the supernatant. Above this value, the amount of GOx added in the mixture is almost not adsorbed on the surface of the NPs and eliminated in the supernatant at the rinsing step. These results confirmed the adsorption of only one monolayer of active GOx on the surface of the TA@AuNPs.
3.3 Electrodeposition and characterization of GOx/TA@AuNPs coating
To electrodeposit GOx and TA@AuNPs on the surface of the working electrode, the electrodeposition solution FcOH/GOx/TA@AuNPs mixture was prepared in 5 mM FcOH/50 mM NaCl aqueous solution at GOx/NPs molar ratio of 30, close to the theoretical value of full coverage of NPs by GOx. The salt acts as a supporting electrolyte and FcOH as an electron mediator to oxidize the gallol moieties of TA within a diffusion layer in the vicinity of the electrode. EC-QCM was used to monitor in situ during the applied voltage the evolution of the normalized frequency shifts. For clarity purposes, the evolution of the opposite value of the normalized frequency shift, at 15 MHz, is depicted in Fig. 4a which is proportional in a first approximation to the adsorbed mass (Fig. 4a). Thus, an increase of the signal is directly related to an increase in mass. After injection of the FcOH/GOx/TA@AuNPs mixture, an increase of the frequency shift of 60 Hz was observed which might originate from the physisorption of GOx/TA@AuNPs. After stabilization of the signal, the application of 0.7 V induced an instantaneous increase of the frequency shift towards 380 Hz followed by a slower phase reaching 910 Hz after 1 h (Fig. 4a). The following rinsing step decreased slightly the signal by 3%. When a GOx/TA@AuNPs mixture was used without the presence of FcOH, the EC-QCM signal remained stable when the electric potential was applied.
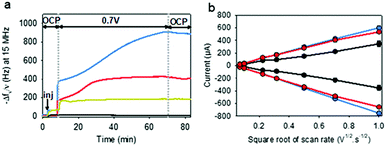 |
| | Fig. 4 (a) Evolution of the normalized frequency shift, measured by EC-QCM-D, of FcOH/GOx/TA@AuNPs (blue curve), FcOH/TA@AuNPs (red curve), FcOH/GOx/TA (yellow curve), and GOx/TA@AuNPs (grey curve) mixture solution as a function of time during the application of 0.7 V. OCP means open circuit potential where no electrical stimulus is applied. The arrow Inj indicates the time of injection of the electrodeposition solution. (b) Redox peak intensities of FcOH (0.5 mM) as a function of the square root of scan rate measured in NaCl 50 mM in contact before electrodeposition (black curve) and after electrodeposition of GOx/TA@AuNPs (blue curve) and TA@AuNPs (red curve) coatings, obtained from FcOH/GOx/TA@AuNPs and FcOH/TA@AuNPs mixtures, respectively. | |
The presence of the mediator is necessary to induce the buildup. In the case of the FcOH/TA@AuNPs mixture without GOx, the frequency shift increased reaching a value at 400 Hz after 1 h. The electrodeposition could be explained by the cross-linking reaction between TA molecules adsorbed on AuNPs as reported elsewhere.21 In the case of the TA/GOx sample, a fast increase of the frequency shift to 180 Hz was reached – seven times lower than TA@AuNPs/GOx coatings. On the contrary to the polymer-complexing ferricyanides process,22 the covalent cross-linking process is favored for more branched NPs than TA molecules. The electroactive surface area is a critical parameter for an electrochemical biosensor as it has an impact on the electrochemical reaction rate and thus its sensitivity. This parameter was measured for the obtained GOx/TA@AuNPs and TA@AuNPs coatings by applying cyclic voltammograms at different scan rates in the presence of 0.5 mM FcOH in NaCl 50 mM. Fig. 4b illustrates the peak reduction and oxidation currents of FcOH versus the square root of the scan rate. This linear relation is described by Randles–Ševčik (paragraph 2.11 in the Experimental section). The obtained linear behavior highlights that the faradaic process with FcOH is diffusion-controlled. An increase of the slope at the oxidation and reduction peaks of 150% and 180%, respectively, was observed for GOx/TA@AuNPs coatings as compared to the bare surface of the gold-coated QCM crystal (Fig. 4b). This change is likely to be explained by the increase of electroactive surface area highlighting the importance of NPs to virtually extend the electrode surface in three-dimension even when coated by enzymes and TA. In comparison, a similar result was observed for the TA@AuNPs coating with a 160% and 190% increase of the slope at the oxidation and reduction peaks, respectively. At the lower scan rate (lower square root scan rate), the measured currents were the same. No differences are visible before and after the electrodeposition of the coatings. Meanwhile, the TA/GOx coating has a similar electroactive surface to clean crystal for all over the tested scan rate range (data not shown). After electrodeposition, the surface of the gold-coated QCM crystal became red due to the presence of TA@AuNPs (Fig. 5a inset). SEM observations of GOx/TA@AuNPs coatings clearly showed densely packed nanoparticles on the surface of the QCM crystal (Fig. 5a). The phenomenon of strong backscattering of electrons (BSE) on heavy elements was used to follow the distribution of AuNPs over the surface area of GOx/TA@AuNPs coatings. Heavier elements appear brighter due to the higher intensity of the secondary electrons backscattered from the surface. Isolated NPs significantly brighter than the rest of the surface were observed in BSE mode, which indicates the relatively high Au content with no aggregation phenomenon during the electrodeposition (Fig. 5b). The presence of several TA@AuNPs layers was visible when the voltage was increased. Similar SEM images were obtained for TA@AuNPs coatings (Fig. S4, ESI†).
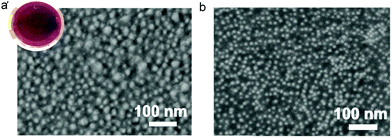 |
| | Fig. 5 SEM micrograph of the electrodeposited GOx/TA@AuNPs coating, with (a) secondary electron and (b) backscattered electron detector. GOx/TA@AuNPs coating was obtained from the electrodeposition of the FcOH/GOx/TA@AuNPs mixture. The inset is the photography of the gold QCM crystal after electrodeposition of the coating. | |
3.4 XPS analysis of TA@AuNPs and GOx/TA@AuNPs coatings
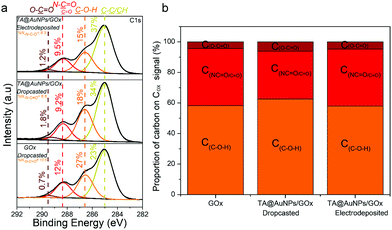
XPS analysis provides chemical information about the atomic and the chemical group composition of the surface coating. The TA@AuNPs coating was first compared to drop-casted TA@AuNPs solution. Both survey XPS spectra revealed the presence of seven main elements such as gold (Au 4f), carbon (C 1s), and oxygen (O 1s) (Fig. S5a, ESI†). The presence of Au 4f peak could be due to the presence of AuNPs and/or the signal of the gold-coated QCM crystal used as a working electrode and as a substrate for the drop-casted solution. The spectrum of drop-casted TA@AuNPs suspension presented K 2s, Cl 2p, and Na 2p peaks coming from the synthesis medium. The presence of trace iron signal on the spectrum of the TA@AuNPs coating is due to the use of FcOH as a mediator during the electrodeposition process. The C 1s spectrum of both samples comprises one component located around 285 eV (yellow peak) characteristic of hydrocarbon environment (C–C/C–H) and two peaks centered at 286.5 (orange peak) and 289 eV (brown peak) corresponding to mono (C–OH) and bi oxygenated (O![[double bond, length as m-dash]](https://www.rsc.org/images/entities/char_e001.gif) C–O) carbon environments, respectively (Fig. 6a). The peak at around 291 eV (grey peak) is attributed to π–π* shake-up, corresponding to the excitation of the π–π* transition by the outgoing photoelectron from unsaturated carbon of CC double bond.23 The peaks at 293 and 296 eV present on the drop-casted TA@AuNPs suspension are from carbonates environment from potassium carbonates compound. With a closer look at the oxidized organic carbon signal (Cox) gathering the peaks centered at 286.5, 287.5, 288.6, and 289.4 eV, we can notice that only the TA@AuNPs coating presents a peak around 287.5 eV corresponding to –CO bond, representing 29% of the Cox signal (Fig. 6b). This bond is linked to the formation of quinone from gallol moieties upon electro-oxidation and further reaction with non-oxidized gallol (Scheme 1c). This presence confirmed the electro-cross-linking of TA@AuNPs upon application of the electric potential on FcOH/TA@AuNPs suspension. The GOx/TA@AuNPs coating was then characterized by XPS in comparison to drop-casted GOx and GOx/TA@AuNPs solutions (Fig. 7).
C–O) carbon environments, respectively (Fig. 6a). The peak at around 291 eV (grey peak) is attributed to π–π* shake-up, corresponding to the excitation of the π–π* transition by the outgoing photoelectron from unsaturated carbon of CC double bond.23 The peaks at 293 and 296 eV present on the drop-casted TA@AuNPs suspension are from carbonates environment from potassium carbonates compound. With a closer look at the oxidized organic carbon signal (Cox) gathering the peaks centered at 286.5, 287.5, 288.6, and 289.4 eV, we can notice that only the TA@AuNPs coating presents a peak around 287.5 eV corresponding to –CO bond, representing 29% of the Cox signal (Fig. 6b). This bond is linked to the formation of quinone from gallol moieties upon electro-oxidation and further reaction with non-oxidized gallol (Scheme 1c). This presence confirmed the electro-cross-linking of TA@AuNPs upon application of the electric potential on FcOH/TA@AuNPs suspension. The GOx/TA@AuNPs coating was then characterized by XPS in comparison to drop-casted GOx and GOx/TA@AuNPs solutions (Fig. 7).
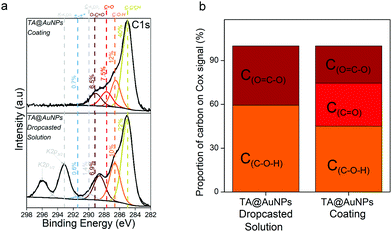 |
| | Fig. 6 (a) C 1s XPS spectra and (b) the relative contribution of each component in the oxidized organic carbon (Cox) signal of the TA@AuNPs coating, obtained by electrodeposition of FcOH/TA@AuNPs and the TA@AuNPs drop-casted solution. | |
 |
| | Fig. 7 (a) C 1s XPS spectra and (b) the relative contribution of each component in the oxidized organic carbon (Cox) signal of the GOx/TA@AuNPs coating, obtained by electrodeposition of FcOH/GOx/TA@AuNPs solution, the GOx/TA@AuNPs drop-casted electrodeposition solution and the GOx drop-casted solution. | |
XPS survey spectra revealed the presence of gold (Au 4f), carbon (C 1s), oxygen (O 1s), and nitrogen (N 1s) elements (Fig. S5b, ESI†). The N 1s peak, mainly composed of N–CO environment, confirmed the presence of enzymes in the GOx/TA@AuNPs coating. C1s spectra gather signals coming from carbon species in five main environments. The three studied samples presented the yellow peak at 285 eV (C–C/C–H), the orange one at 286.7 eV (C–O–H), the red one at 288.1 eV, and the brown one at 289.4 eV (O–CO). The red peak at 288.1 eV could correspond to the contribution of N–CO amide from the enzyme and the CO bond from oxidized TA (quinone). As nitrogen is only present on GOx, the percentage of nitrogen detected should be similar to the percentage of carbon coming from the N–CO environment (theoretical value of 1). This is the case for the GOx drop-casted solution where %NNCO/%CNCO is equal to 1.06. In the case of the GOx/TA@AuNPs coating and the GOx/TA@AuNPs drop-casted electrodeposition solution, it can be seen that the percentage of carbon centered at 288.1 eV is higher than the amount of nitrogen from the N–CO environment. This difference suggests that this peak included also the presence of the CO environment in the GOx/TA@AuNPs coating and electrodeposition solution. The presence of the CO environment confirmed the oxidation of gallol moieties of TA@AuNPs and their further cross-linking with non-oxidized catechol moieties of TA@AuNPs and with amine moieties of GOx. Before the application of the electric potential, it is likely that the oxygen of the air is already sufficient to oxidize gallol moieties of TA@AuNPs. It can be noticed also that C–OH relative proportion in Cox is also decreasing with the anodic deposition. To get more information, we performed depth profiling with a MAGCIS ion gun which allows cluster argon bombardments on the different layers of the three samples (Fig. 8). Cluster bombardment layer etching is mainly used on polymeric layers with the advantage of not destroying the structure of the analysed layers. In the case of GOx and GOx/TA@AuNPs drop-casted solutions, a fast decrease of Cox and nitrogen contributions was observed indicating weak stability of the deposition. On the contrary, GOx/TA@AuNPs coatings present a relatively stable evolution of Cox and nitrogen contributions, i.e. a stable signal until 1000s of etching followed by a small decrease.
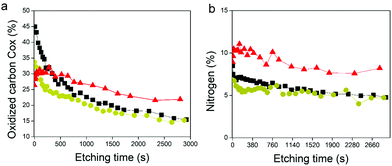 |
| | Fig. 8 Depth profiling of (a) Cox and (b) nitrogen contributions the GOx/TA@AuNPs coating (red triangle), the GOx/TA@AuNPs drop-casted electrodeposition solution (yellow circle), and the GOx drop-casted solution (black square). The evolution is plotted as a function of the etching time by cluster argon bombardments at 8 keV and 300 atoms. | |
This suggests a homogeneous distribution of GOx all over the thickness of the coating and a strong interaction between GOx and TA@AuNPs, protecting the enzyme against argon cluster bombardment. In summary, the electrodeposition process induced the appearance of a CO peak and allowed to obtain a stable coating towards etching with a strong interaction between the enzyme and the NPs. These observations are the indirect signature of the electro-cross-linking of GOx and TA@AuNPs.
3.5 Biosensing characterization of GOx/TA@AuNPs coating
The electrochemical biosensing capability of GOx/TA@AuNPs coating was evaluated using standard enzyme-catalyzed glucose oxidation in the presence of FcOH in physiological conditions (10 mM PBS pH 7.4). FcOH was used to enhance the electron transfer rate between GOx and the electrode because of the inaccessible enzymatic active site. The sensing mechanism of glucose is based on the following equations:
| FcOH → FcOH+ + e− (at electrode) |
| GOx(FAD) + β-D-Glucose → GOx(FADH2) + D-glucono-δ-lactone |
| GOx(FADH2) + 2 FcOH+ → GOx(FAD) + 2 H+ + 2 FcOH |
A potential is applied to the working electrode in order to oxidize FcOH into FcOH+. In the presence of glucose, GOx catalytically oxidizes glucose into gluconolactone and its cofactor (flavin adenine dinucleotide, FAD) is reduced into GOx–FADH2. As already reported elsewhere,7 FcOH+ is likely to retrieve electrons from the buried cofactor to the electrode through a spontaneous redox reaction. Indeed, 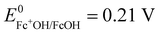 24,25 is higher than the formal potential
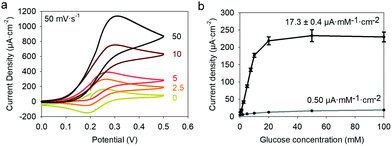
 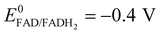 26vs. Ag/AgCl. Fig. 9a shows the different cyclic voltammograms of GOx/TA@AuNPs coating in contact with 0.5 mM FcOH, prepared in PBS 10 mM pH 7.4 in the presence of different concentrations in glucose. The oxidation and reduction peaks of FcOH were observed at 0.25 V and 0.19 V. The introduction of glucose triggered an increase of the oxidation peak and a decrease of the reduction peak, due to the regeneration of FcOH and the depletion of FcOH+, respectively. A good bioelectrochemical catalytic activity of the GOx/TA@AuNPs coating was obtained towards glucose. Indeed, complete disappearance of the reduction peak was observed for 10 mM glucose at 50 mV s−1 (Fig. 9a) and 5 mV s−1 (Fig. S6a, ESI†). This indicates a complete consumption of FcOH+ by the enzyme cofactor allowing the regeneration of GOx. The saturation plateau at 20 mM glucose arises from the typical hyperbolic Michaelian–Menten kinetic. At this concentration, GOx catalytic sites are saturated and the maximal glucose catalytic rate is reached. Thus, the amperometric response of the coating was measured at 0.25 V at different concentrations of glucose (Fig. S6b, ESI†).
 |
| | Fig. 9 (a) Cyclic voltammograms, performed at a scan rate of 50 mV s−1, of GOx/TA@AuNPs coating in contact with 0 to 100 mM of glucose solution prepared in 0.5 mM FcOH/10 mM PBS. (b) Average current density, measured at 0.25 V, as a function of the glucose concentration of GOx/TA@AuNPs (black curve) and GOx/TA (grey curve) coatings. The average and error bars of GOx/TA@AuNPs coatings were evaluated on six independent experiments. | |
Each fluid replacement led to an electrical current overshoot followed by a period of stabilization at a steady-state value after 200 s. The overshoot happened in the transient period because of a local rise of glucose and FcOH concentration at the injection step. The calibration curve, i.e. the current density measured after 200 s vs. glucose concentration, showed a linear range that extends up to 10 mM with a typical saturation plateau of 220 μA cm−2 (Fig. 9b) caused by the saturation of the enzymes by the substrate. The average sensitivity, calculated from the slope of the calibration curve of 6 different samples, was 17.3 ± 0.4 μA mM−1 cm−2 (R2 = 0.999) with a limit of detection at 0.3 mM (LOD at a signal to noise ratio 3). These coatings would distinguish between healthy (3.8 and 6.5 mM) and hyperglycemic subjects (>7 mM). A great improvement of the sensitivity of electro-crosslinked enzymatic biosensor was reached thanks to the presence of NPs. Indeed, the sensitivity of TA/GOx (0.5 μA mM−1 cm−2) and biscatechol/GOx7 (0.66 μA mM−1 cm−2) coatings were found to be 34 and 28 times lower than GOx/TA@AuNPs coatings, respectively. Ramanavicius and coll. achieved higher sensitivity by electrochemical nucleation of dendritic AuNPs followed by drop-casting of GOx27 or electropolymerization of a conducting polymer and covalent immobilization of GOx.28 The covalent immobilization of GOx was proven by performing the chronoamperometry test before and after consecutive washes with 0.01% Tween-20 prepared in 10 mM PBS. These washes are expected to remove any physisorbed GOx.29 No loss of mass was observed and the sensitivity remained stable after the Tween 20 treatment (Fig. S7, ESI†). Regarding durability, the biosensor can be stored up to 14 days in 10 mM PBS buffer at room temperature with a loss in sensitivity lower than 0.6% per day of storage (Fig. S8, ESI†) which is very competitive in regards to literature (Table 1). The biological affinity of the immobilized GOx was determined by estimating the Michaelis–Menten constant. The following Lineweaver–Burk equation30 was used to fit the double reciprocal plot of current density vs. concentration of glucose (paragraph 2.11 in the Experimental section). A low Kappm indicates a high enzymatic activity of the immobilized GOx.31 We found a KappM value of 19 mM in good accordance with the literature value of 26 mM32 for glucose in solution. For comparison, the reported values of KappM are 10.36 mM for GOX/polyaniline33 and 19 mM for GOX/ZnO34 nanotubes biosensors obtained by drop-casting and reticulation with glutaraldehyde. The biosensor selectivity was tested towards common interferents at their maximum standard blood concentration with a standard glucose concentration of 5 mM. The variation of the response was between 0.2 and 1.6% for salicylic acid (SA), uric acid (UA), ascorbic acid (AA), acetaminophen (AP), and all mixed 2% (Fig. 10a).
Table 1 Comparison of different biosensors, based on GOx and AuNPs coating deposited on gold electrode obtained by drop-casting and cross-linked or covalently immobilized to this work. AuNPs were either drop-casted or electrodeposited from gold salt
| Process |
Applied voltage V vs. Ag/AgCl |
Medium |
Linear range (mM) |
Sensitivity (μA mM−1 cm−2) |
Stability (day) |
Ref. |
| PB: phosphate buffer; RT: room temperature; Ti: titane |
| Electro-cross-linking catechol |
0.25 |
0.5 mM FcOH, 10 mM PBS pH 7.4 |
0.3–10 |
17.4 |
14 days 93% at RT |
This work |
| Dropcasting thiol |
0.34 |
0.1 mM FcOH, 0.1 M PB pH 7 |
0.020–5.7 |
8.8 |
30 days 4 °C |
35
|
| Dropcasting cysteiene and glutaraldehyde |
0.2 |
TTF 0.05 M PB pH 7.4 |
0.01–10 |
14 |
28 days 4 °C |
36
|
| Dropcasting glutaraldehyde |
0.29 |
0.25 mM FcOH, 0.1 M PBS pH 6.8 |
0.01–13 |
5.72 |
28 days 85% 4 °C |
37
|
| Dropcasting cystamine |
0.3 |
0.1 mM FcOH, 0.1 M PB pH 7 |
0.02–6 |
8.3 |
60 days |
38
|
| Ti patterned BSA glutaraldehyde |
1 direct H2O2 oxidation |
0.1 M PBS |
0.03–3.05 |
25.74 (CV) |
— |
39
|
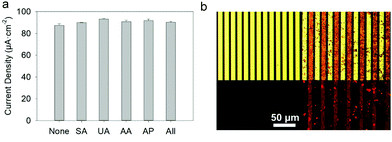 |
| | Fig. 10 GOx/TA@AuNPs coating: (a) current density, measured at +0.25 V, of 5 mM glucose prepared in 0.5 mM FcOH/10 mM PBS in the absence (None) and the presence of different interfering substances, salicylic acid (SA), uric acid (UA), ascorbic acid (AA), acetaminophen (AP) and all of them (All) (b) Optical microscope images, in (top) bright field and (bottom) fluorescent mode, (left) before and (right) after electrodeposition of GOxRho/TA@AuNPs coating. | |
In comparison, the standard deviation of the current density measured for glucose at 5 mM is 2% out of 6 samples. Therefore, no significant difference in the biosensor response was found with any interferents. Others biosensors found in the literature were obtained manually by drop-casting using a specific cross-linker and are not suitable for specific functionalization of a single electrode out of a microelectrode array. Using rhodamine labelled GOx (GOxRho), a GOxRho/TA@AuNPs film was built on interdigitated arrays (IDA) of electrodes by the application of 0.7 V on one of the two arrays for 15 min. The microelectrodes were imaged by optical microscopy in bright field and fluorescence to check the presence of GOXrho and to verify its spatial co-localization with TA@AuNPs (Fig. 10b). An excellent spatial-selectivity was obtained since a high fluorescence (GOxRho) was observed only on the addressed microelectrodes. The sensitivity of the obtained coating was 6.0 μA mM−1 cm−2 with a response time upon addition of 3.2 s at 0.4 mM glucose concentration change and 6.9 s at 7.5 mM addition (Fig. S9, ESI†). It should be noted that this electrodeposition was not optimized on the microelectrode and still give a good sensitivity.
3.6 Versatility of the process
To illustrate the versatility of the process, we also designed a hydrogen peroxide (H2O2) biosensor by immobilizing horseradish peroxidase (HRP), a significantly smaller enzyme (44 kDa with a DLS size of 5.5 nm).
H2O2 is a reactive oxygen species present in many biological processes including cell growth, apoptosis, inflammation, infection, or cancer.40–43 For instance, it is used at the early stage in wounds as an antibacterial and signaling danger agent. Indeed, H2O2 becomes detrimental at high concentrations slowing down the healing process. The electrodeposition solution was prepared by adjusting the HRP/TA@AuNPs molar ratio close to the full coverage of NPs by the enzyme which is 40. After the injection of the FcOH/HRP/TA@AuNPs electrodeposition solution, the application of 0.7 V for one hour led to an increase of the normalized frequency shift and a homogeneous distribution of HRP/TA@AuNPs on the electrode (Fig. 11a and b). The biosensing experiments were performed in 10 mM PBS at pH 7.4 using 0.1 mM FcOH as a mediator using chronoamperometry at 0.19 V. The reduction peak of the mediator was used because of the standard potential of the heme of HRP which is at 0.95 V.25 The sensing mechanism is based on the following reactions according to literature.44,45
| HRP(Red) + H2O2 → HRP(Ox) + H2O |
| HRP(Ox) + 2 FcOH → HRP(Red) + 2 H+ + 2 FcOH+ |
| FcOH+ + e− → FcOH (at the electrode) |
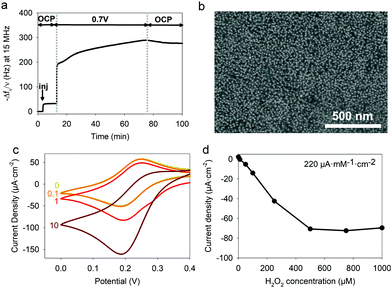 |
| | Fig. 11 HRP/TA@AuNPs coating: (a) Buildup with the evolution of the normalized frequency shift of FcOH/HRP/TA@AuNPs solution as a function of time during the application of 0.7 V (b) BSE-SEM micrograph of the coating, (c) Electrocatalytic reduction current, measured at 50 mV s−1, of 0 to 10 mM H2O2 prepared in 0.5 mM FcOH/10 mM PBS and (d) Current density, measured at 0.19 V, as a function of H2O2 concentration prepared in 0.1 mM FcOH/10 mM PBS. | |
The presence of H2O2 induced an increase in the reduction peak signal of FcOH+ at the electrode (Fig. 11c). The current density measured as a function of H2O2 concentration showed a typical linear range from 10 to 250 μM with a LOD at 10 μM and a sensitivity of 220 μA mM−1 cm−2 (Fig. 11d). Without further optimization, the obtained HRP/TA@AuNPs coating showed a better sensitivity as a biosensor for H2O2 in comparison to the ones reported based on manual cross-linking of HRP with sensitivities of 0.5 and 30 μA mM−1 cm−2 for HRP/cysteamine/glutaraldehyde46 and HRP/cysteine bonds cross-linker,47 respectively.
4. Conclusions
The electrochemical cross-linking of enzymes was generalized by the use of a natural and abundant polyphenol as a cross-linker and as a reductive agent to obtain gold nanoparticles. Thanks to gallol electro-oxidation at 0.7 V, the TA@AuNPs cross-linked and reacted chemically with amine moieties of enzymes.
This process allowed (i) the design of enzymatic biosensor with competitive sensitivity and stability upon storage with regards to other well-implemented techniques and (ii) the functionalization of a single electrode out of a microelectrode array. Two systems had been developed to highlight the versatility of the process – namely a peroxide and a glucose biosensor. One of the further steps will be to obtain a third-generation biosensor by cross-linking simultaneously the mediator47 or to incorporate a conductive polymer as supplementary components.48,49 Finally, both electrodes (GOX-based anode and HRP-based cathode) can also be used for the design of enzymatic biofuel cells.50,51
Author contributions
Rémy Savin: conceptualization, methodology, investigation, formal analysis, data curation, writing – review & editing. Nour-Ouda Benzaamia: investigation. Christian Njel: investigation. Sergey Pronkin: investigation. Christian Blanck: investigation. Marc Schmutz: investigation. Fouzia Boulmedais: conceptualization, data curation, supervision, writing – review & editing, funding acquisition, and project administration.
Conflicts of interest
There are no conflicts to declare.
Acknowledgements
The authors acknowledge Mélanie Legros from the platform of characterization of ICS for the training and the use of dynamic light scattering and zeta potential apparatus and Alain Carvalho from the platform of Microscopy of ICS for the training and access to the SEM microscopy. Institut Carnot MICA is acknowledged for the financial support of Biosensdress. This work of the Interdisciplinary Institute HiFunMat, as part of the ITI 2021-2028 program of the University of Strasbourg, CNRS, and INSERM, was supported by IdEx Unistra (ANR-10-IDEX-0002) and SFRI (STRAT’US project, ANR-20-SFRI-0012) under the framework of the French Investments for the Future Program. R. S. was supported by a fellowship from the “Ministère de l'Enseignement supérieur, de la Recherche et de l'Innovation”.
Notes and references
-
P. Bhattarai and S. Hameed, Basics of Biosensors and Nanobiosensors, in Nanobiosensors, Wiley, Weinheim, 2020, pp. 1–22 Search PubMed.
- L. C. Clark Jr and C. Lyons, Ann. N. Y. Acad. Sci., 1962, 102, 29–45 CrossRef CAS PubMed.
- C. S. Pundir and N. Chauhan, Anal. Biochem., 2012, 429, 19–31 CrossRef CAS PubMed.
- M. Z. H. Khan, M. R. Hasan, S. I. Hossain, M. S. Ahommed and M. Daizy, Biosens. Bioelectron., 2020, 166, 112–431 CrossRef PubMed.
- S. Szunerits, V. Mishyn, I. Grabowska and R. Boukherroub, Biosens. Bioelectron., 2019, 131, 287–298 CrossRef CAS PubMed.
- A. Sassolas, L. J. Blum and B. D. Leca-Bouvier, Biotechnol. Adv., 2012, 30, 489–511 CrossRef CAS PubMed.
- J. El-Maiss, M. Cuccarese, P. Lupattelli, L. Chiummiento, M. Funicello, P. Schaaf and F. Boulmedais, ACS Appl. Mater. Interfaces, 2018, 10, 18574–18584 CrossRef CAS PubMed.
- Y. Xie, T. Liu, Z. Chu and W. J. Jin, Electroanal. Chem., 2021, 893, 115328 CrossRef CAS.
- S. K. Sivaraman, S. Kumar and V. Santhanam, Gold Bull., 2010, 43, 275–286 CrossRef CAS.
- X. Liu, M. Atwater, J. Wang and Q. Huo, Colloids Surf., B, 2007, 53, 3–7 CrossRef PubMed.
- H. D. Graham, J. Agric. Food Chem., 2002, 40, 801–805 CrossRef.
- O. Courjean, V. Flexer, A. Prévoteau, E. Suraniti and N. Mano, ChemPhysChem, 2010, 11, 2795–2797 CrossRef CAS PubMed.
- J. H. Scofield, J. Electron Spectrosc. Relat. Phenom., 1976, 8, 129–137 CrossRef CAS.
- K. Singh, T. McArdle, P. R. Sullivan and C. F. Blanford, Energy Environ. Sci., 2013, 6, 2460–2464 RSC.
- J. Lim, S. P. Yeap, H. X. Che and S. C. Low, Nanoscale Res. Lett., 2013, 8, 1–14 CrossRef PubMed.
- A. E. Hagerman, Recent Adv. Polyphenol Res., 2012, 3, 71–97 CAS.
- H. J. Hecht, H. M. Kalisz, J. Hendle, R. D. Schmid and D. Schomburg, J. Mol. Biol., 1993, 229, 153–172 CrossRef CAS PubMed.
- Y. Wang, R. Jonkute, H. Lindmark, J. D. Keighron and A.-S. Cans, Langmuir, 2019, 36, 37–46 CrossRef PubMed.
- J. Yang, M. A. C. Stuart, M. Kamperman and J. Yang, Chem. Soc. Rev., 2014, 43, 8271–8298 RSC.
- S. Mole and P. G. Waterman, Phytochemistry, 1986, 26, 99–102 CrossRef CAS.
- A. Krywko-Cendrowska, L. Marot, D. Mathys and F. Boulmedais, ACS Appl. Nano Mater., 2021, 4, 5372–5382 CrossRef CAS.
- O. Mergel, P. T. Küh, S. Schneider, U. Simon and F. A. Plamper, Electrochim. Acta, 2017, 232, 98–105 CrossRef CAS.
- S. Tardio, M.-L. Abel, R. H. Carr and J. F. Watts, Surf. Interface Anal., 2016, 48, 556–560 CrossRef CAS.
-
J. Savéant and C. Costentin, Elements of Molecular and Biomolecular Electrochemistry, Wiley, Hoboken (USA), 2019 Search PubMed.
- K. Kano, Rev. Polarogr., 2002, 48, 29–46 CrossRef.
- S. Liu and H. Ju, Biosens. Bioelectron., 2003, 19, 177–183 CrossRef CAS PubMed.
- A. Ramanaviciene, N. German, A. Kausaite-Minkstimiene and A. Ramanavicius, Chemosensors, 2021, 9, 188 CrossRef CAS.
- N. German, A. Ramanaviciene and A. Ramanavicius, Polymers, 2021, 13, 2173 CrossRef CAS PubMed.
- S.-K. Kim, C. Jeon, G.-H. Lee, J. Koo, S. Hwi Cho, S. Han, M.-H. Shin, J.-Y. Sim and S. K. Hahn, ACS Appl. Mater. Interfaces, 2019, 11, 37347–37356 CrossRef CAS PubMed.
- A. S. Campbell, M. F. Islam and A. J. Russell, Electrochim. Acta, 2017, 246, 294–302 CrossRef CAS.
- Y. Yonemori, E. Takahashi, H. Ren, T. Hayashi and H. Endo, Anal. Chim. Acta, 2009, 633, 90–96 CrossRef CAS PubMed.
- S. Nakamura, S. Hayashi and K. Koga, Biochim. Biophys. Acta, Enzymol., 1976, 445, 294–308 CrossRef CAS.
- M. Barsan and C. A. Brett, Bioelectrochemistry, 2009, 76, 135–140 CrossRef CAS PubMed.
- T. Kong, Y. Chen, Y. Ye, K. Zhang, Z. Wang and X. Wang, Sens. Actuators, B, 2009, 138, 344–350 CrossRef CAS.
- S. Zhang, N. Wang, H. Yu, Y. Niu and C. Sun, Bioelectrochemistry, 2005, 67, 15–22 CrossRef CAS PubMed.
- M. L. Mena, P. Yáñez-Sedeño and J. M. A. Pingarrón, Anal. Biochem., 2005, 336, 20–27 CrossRef CAS PubMed.
- Y. Sun, F. Yan, W. Yang and C. Sun, Biomaterials, 2006, 27, 4042–4049 CrossRef CAS PubMed.
- S. Zhang, Y. Niu and C. Sun, Sens. Actuators, B, 2005, 109, 367–374 CrossRef CAS.
- W. Lipińska, K. Siuzdak, J. Ryl, P. Barski, G. Śliwiński and K. Grochowska, Mater. Res. Express, 2019, 6, 1150e3 CrossRef.
- C. C. Winterbourn, Methods Enzymol., 2013, 528, 3–25 CAS.
- S. Teramoto, T. Tomita, H. Matsui, E. Ohga, T. Matsuse and Y. Ouchi, Jpn. J. Pharmacol., 1999, 79, 33–40 CrossRef CAS PubMed.
- R. Schreck, P. Rieberl and P. A. Baeuerle, EMBO J., 1991, 10, 2247–2258 CrossRef CAS PubMed.
- M. Mittal, M. Siddiqui, K. Tran, S. Reddy and A. Malik, Antioxid. Redox Signaling, 2014, 20, 1126–1167 CrossRef CAS PubMed.
- A. Rondeau, N. Larsson, M. Boujtita, L. Gorton and N. El. Murr, Analysis, 1999, 27, 649–656 CAS.
- H.-S. Wang, Q.-X. Pan and G.-X. Wang, Sensors, 2005, 5, 266–276 CrossRef CAS.
- Y. Xiao, H. X. Ju and H. Y. Chen, Anal. Chim. Acta, 1999, 391, 73–82 CrossRef CAS.
- S. Chen, R. Yuan, Y. Chai, L. Xu, N. Wang, X. Li and L. Zhang, Electroanalysis, 2006, 18, 471–477 CrossRef CAS.
- S. Ramanavicius and A. Ramanavicius, Nanomaterials, 2021, 11, 371 CrossRef CAS PubMed.
- N. German, A. Ramanaviciene and A. Ramanavicius, Polymers, 2021, 13, 2173 CrossRef CAS PubMed.
- A. Ramanavicius, A. K-Minkstimiene, I. M-Vilkonciene, P. Genys, R. Mikhailova, T. Semashko, J. Voronovic and A. Ramanaviciene, Chem. Eng. J., 2015, 264, 165–173 CrossRef CAS.
- A. Ramanavicius, A. Kausaite and A. Ramanaviciene, Biosens. Bioelectron., 2005, 20, 1962–1967 CrossRef CAS PubMed.
Footnote |
| † Electronic supplementary information (ESI) available: Enzyme characterization, Theoretical molar ratio of GOx/TA@AuNPs of an adsorbed monolayer, TA@AuNPs stability upon storage, GOx/TA@AuNPs aggregation test in 1 M NaCl, GOx/TA and GOx/TA@AuNPs enzymatic inhibition, SEM micrographs of bare QCM crystal and TA@AuNPs coating, XPS surveys of drop-casted and electrodeposited samples, electrocatalytic current and chronoamperogram of GOx/TA@AuNPs coatings, Tween 20 stability test on GOx/TA@AuNPs coating, stability upon storage at room temperature, glucose response and sensitivity of GOx/TA@AuNPs coatings deposited on microelectrodes. See DOI: 10.1039/d1ma01193f |
|
| This journal is © The Royal Society of Chemistry 2022 |
Click here to see how this site uses Cookies. View our privacy policy here. 
 Open Access Article
 This Open Access Article is licensed under a Creative Commons Attribution-Non Commercial 3.0 Unported Licence
 a and
Fouzia
Boulmedais
a and
Fouzia
Boulmedais


 24,25 is higher than the formal potential
  26vs. Ag/AgCl. Fig. 9a shows the different cyclic voltammograms of GOx/TA@AuNPs coating in contact with 0.5 mM FcOH, prepared in PBS 10 mM pH 7.4 in the presence of different concentrations in glucose. The oxidation and reduction peaks of FcOH were observed at 0.25 V and 0.19 V. The introduction of glucose triggered an increase of the oxidation peak and a decrease of the reduction peak, due to the regeneration of FcOH and the depletion of FcOH+, respectively. A good bioelectrochemical catalytic activity of the GOx/TA@AuNPs coating was obtained towards glucose. Indeed, complete disappearance of the reduction peak was observed for 10 mM glucose at 50 mV s−1 (Fig. 9a) and 5 mV s−1 (Fig. S6a, ESI†). This indicates a complete consumption of FcOH+ by the enzyme cofactor allowing the regeneration of GOx. The saturation plateau at 20 mM glucose arises from the typical hyperbolic Michaelian–Menten kinetic. At this concentration, GOx catalytic sites are saturated and the maximal glucose catalytic rate is reached. Thus, the amperometric response of the coating was measured at 0.25 V at different concentrations of glucose (Fig. S6b, ESI†).

