 Open Access Article
Coating liposomes with ring-like PEG: the synthesis and stealth effect of cholesterol–PEG–cholesterol
Yufang
Wang
 a,
Jianzhu
Wang
a,
Mingshuang
Sun
a,
Jiyan
Zhang
b and
Yanping
Bi
a,
Jianzhu
Wang
a,
Mingshuang
Sun
a,
Jiyan
Zhang
b and
Yanping
Bi
 *a
*a
aSchool of Pharmaceutical Sciences, Shandong First Medical University, China. E-mail: biyanpingtsmc@163.com
bTai An TSCM Hospital, China
First published on 6th January 2022
Abstract
Escaping from the immune system to achieve a long circulation time is an essential prerequisite for targeting liposomes. Monomethoxy-poly(ethylene glycol)–distearoylphosphatidylethanolamine (mPEG–DSPE) is the most commonly used stealth polymer for long circulating liposomes. With its monomethoxy end moving freely on the liposomal surface, the linear PEG chains of mPEG–DSPE construct a hydration layer to repel complement proteins and thus evade immune clearance. We describe in this work a new kind of PEG derivative whose two ends were grafted with cholesterol (cholesterol–PEG–cholesterol, CPC). According to the in vitro and in vivo results, the presence of CPC in liposomes was shown to reduce the uptake by phagocyte cells while extending the circulation time. The stealth performance of CPC liposomes is closely related to the molecular weight of PEG moieties. CPC6k performed better than CPC2k, CPC4k and the commonly used mPEG2k–DSPE. CPC on the liposomal surface would not let the free end of PEG act as the immune recognition site, meanwhile, the PEG chain of CPC tends to adopt a twisted ring-like conformation rather than a linear conformation, which is considered to be associated with the stealth effect. This finding adds to the range of stealth liposomes and may be valuable for developing new drug carriers.
1. Introduction
Nanoscale drug carriers injected intravenously unavoidably suffer from the rapid uptake by the mononuclear phagocyte system (MPS) before reaching the target site, which causes the off-target effect of drug delivery. The size and surface properties of nanocarriers have been regarded as the most important factors that influence MPS uptake.1 Opsonization induced by the adsorption of circulating proteins onto the surface of nanocarriers plays a crucial role in MPS recognition.2 Therefore a long circulation time can be achieved by decorating nanocarriers with hydrophilic polymers such as poly(ethylene glycol) (PEG), poly(2-oxazoline) (POx)3 and hyaluronic acid,4 among which PEG is the most widely-used polymer.5–7PEG chains repel proteins due to their high hydrophilicity and flexibility, so an intact PEG hydration layer with enough thickness on the nanoparticle surface is essential for preventing the adsorption of plasma proteins. The length (molecular weight, MW), density and conformation of PEG chains, which correlate with each other on the nanoparticle surface, strongly affect the circulation time of nanoparticles. A reasonably higher MW of PEG chains leads to a thicker hydration layer on the nanoparticle surface and thus a lower level of opsonization.2,8,9 A low ratio of surface coverage may bring about the interaction between the proteins and exposed surface.
The PEG chains on the particle surface could show a “mushroom” or “brush” conformation depending on their grafting density. In order to achieve a better stealth-like behavior, the PEG conformation needs to be optimized between the “mushroom” and “brush” because the over-high coverage ratio and density, which result in a “brush” conformation, may reduce the flexibility of PEG chains.1,2 In addition, there is easily overlooked relevance between the end-group of PEG chains and MPS uptake. Compared with hydroxyl- or mannoside-terminated PEG, methoxy-terminated PEG can protect nanocarriers from MPS recognition more effectively,10 which implies that the end group of PEG is an important recognition site for MPS clearance.
PEGylated liposomes have been widely used as a kind of long circulating nanocarrier for drug targeting especially after the approval of Doxil® by the FDA. It is necessary for a PEG chain to anchor at least one of its two ends onto the surface of liposomes, so that a stable hydration layer can be preserved. In previous reports, the other end of the PEG, usually capped with a methoxy group or a targeting ligand, can move freely within the hydration layer. For example, monomethoxy-poly(ethylene glycol)–distearoylphosphatidylethanolamine (mPEG–DSPE), the most commonly used stealth polymer for stealth liposomes,11 could be fastened to a liposome by inserting its distearoyl group into a phospholipid bilayer. As compared to its homologues, PEG2k–DSPE attracts more attention due to its low toxicity and stabilization effect on liposomes.12–14 The superiorities of the PEG2k–DSPE unit in fabricating stealth liposomes are rooted in its suitable hydrophile–lipophile balance (HLB) value which is decided by the MW ratio of PEG to DSPE. That is to say, extending the PEG chain might not bring about a better stealth effect but cause unpredictable toxicity or self-assembly of mPEG–DSPE.
If the other end of mPEG–DSPE was also grafted with a lipophilic group, the MW of the PEG chain could be doubled with the HLB value remaining unchanged. From a thermodynamics perspective, both ends of the lipophilic groups tend to insert into a liposomal membrane to construct a ring-like PEG chain (Fig. 1). The unique ring-like conformation of the PEG chain would endow liposomes with improved properties. Cholesterol can be a suitable alternative to anchoring into liposomal membranes,15 so in this work, cholesterol molecules were attached to both ends of PEG to obtain cholesterol–PEG–cholesterol (CPC). Subsequently, CPC-containing liposomes were prepared and their physicochemical properties, cellular uptake and pharmacokinetic behaviors were also studied.
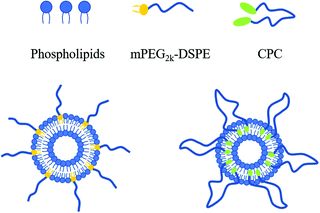 | ||
| Fig. 1 Schematic representation of linear (left) and ring-like (right) conformations of PEG moieties on the liposomal surface. | ||
2. Materials and methods
2.1 Materials
Cholesterol was supplied by Source Leaf Biology Co., Ltd. N,N′-Dicyclohexylcarbodiimide (DCC) and 4-dimethylaminopyridine (DMAP) were purchased from Shanghai Aladdin Biochemical Technology Co., Ltd. mPEG2k–DSPE and lecithin were purchased from AVT Pharmaceutical Tech Co., Ltd (Shanghai, China). Methyl thiazolyl tetrazolium (MTT) was purchased from Hebei Bailingwei Superfine Material Co., Ltd (Beijing, China). Coumarin-6 (Cou-6) was obtained from Sigma-Aldrich (Shanghai) Trading Co., Ltd. Dulbecco's modified eagle medium (DMEM) was purchased from Jiangsu KGI Biotechnology Co., Ltd (China). PEG of different MWs (2 kD, 4 kD and 6 kD), succinic anhydride (SA), and other chemical regents were purchased from Sinopharm Chemical Reagent Co., Ltd (Shanghai, China).2.2 Synthesis and characterization of CPC
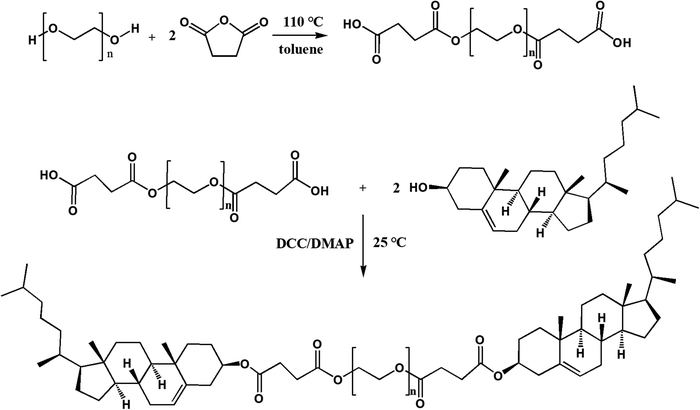
PEG2k, PEG4k and PEG6k were used to synthesize CPC of different MWs by the same two-step reaction. PEG of 5 mmol was dissolved into 20 mL of toluene and heated to 85 °C to distill the toluene–water azeotrope. Then 50 mmol SA was added and the solution was stirred for 3 h at 110 °C. After the addition of 20 mL of water (to remove the residual of SA), the reaction system was extracted three times with dichloromethane. The dichloromethane layer was washed in triplicate using water, dehydrated using anhydrous sodium sulfate for 24 h, and poured into 200 mL of petroleum ether to obtain PEG diacid as a precipitate. The obtained PEG diacid precipitate was analyzed by thin-layer chromatography (TLC) eluted with dichloromethane–methanol–aqueous ammonia (8.5![[thin space (1/6-em)]](https://www.rsc.org/images/entities/char_2009.gif) :
:![[thin space (1/6-em)]](https://www.rsc.org/images/entities/char_2009.gif) 1.5
1.5![[thin space (1/6-em)]](https://www.rsc.org/images/entities/char_2009.gif) :
:![[thin space (1/6-em)]](https://www.rsc.org/images/entities/char_2009.gif) 0.1, v/v/v).
0.1, v/v/v).
In the second step, PEG diacids (2 mmol), cholesterol (8 mmol), DMAP (1.955 g) and DCC (3.3 g) were dissolved into 60 mL of anhydrous dichloromethane. The mixture was stirred under nitrogen at room temperature for 24 h and then filtered. The filtrate was washed with 0.1 M HCl, 1% aqueous ammonia and distilled water in turn until pH = 7, then was dehydrated using anhydrous sodium sulfate for 24 h and re-precipitated using petroleum ether to obtain CPC. The detailed synthetic scheme is illustrated in Fig. 2.
Fourier transform infrared (FT-IR) spectra of CPC samples were recorded using a Shimadzu IRAffinity-1 spectrometer at frequencies ranging from 400 to 4000 cm−1 with a 4 cm−1 resolution. Typically, 1 mg of each sample was mixed with 20 mg KBr and compressed into tablets before determination. 1H and13C nuclear magnetic resonance (NMR) spectra of samples in DMSO-d6 were recorded on a Bruker Avance NEO400 at frequencies of 400 MHz at 298 K.
2.3 Preparation and characterization of CPC liposomes
CPC synthesized with PEG2k, PEG4k and PEG6k (CPC2k, CPC4k and CPC6k) were respectively used as stealth polymers to prepare liposomes along with lecithin. Typically, 100 mg of lecithin and 10 mg of CPC were dissolved in a mixed solvent consisting of ethyl acetate and ethanol (1![[thin space (1/6-em)]](https://www.rsc.org/images/entities/char_2009.gif) :
:![[thin space (1/6-em)]](https://www.rsc.org/images/entities/char_2009.gif) 1) before 1000 μL of Cou-6 solution (100 μg mL−1) in dichloromethane was added. The organic solvent was removed in a rotary evaporator to yield a thin lipid film. Then the film was hydrated with 10 mL of physiological saline and treated with a high pressure homogenizer at 10
1) before 1000 μL of Cou-6 solution (100 μg mL−1) in dichloromethane was added. The organic solvent was removed in a rotary evaporator to yield a thin lipid film. Then the film was hydrated with 10 mL of physiological saline and treated with a high pressure homogenizer at 10![[thin space (1/6-em)]](https://www.rsc.org/images/entities/char_2009.gif) 000–15
000–15![[thin space (1/6-em)]](https://www.rsc.org/images/entities/char_2009.gif) 000 psi for 5 min.
000 psi for 5 min.
The size, polydispersity index (PDI) and zeta potential of liposomes were analyzed with a Malvern Zetasizer Nano ZSE. For each test, 100 μL of liposomal suspension was mixed with 1.000 mL of ultrapure water at 25 °C. A JEM-1200 EX II transmission electron microscope (TEM, JEOL Ltd.) was used to observe the morphology of liposomes. Before observation, about 5 μL of diluted liposomal suspension was dripped onto a carbon-film-coated copper grid and dried in a vacuum, and then stained with 2.0% (w/w) phosphotungstic acid solution for 2 min.
2.4 Determination of Cou-6
The concentration of Cou-6 in liposomes or plasma was determined by high performance liquid chromatography (HPLC). The HPLC system was composed of a Shimadsu LC-20AD pump and a RF-20A fluorescent detector. A GL-sciences Intersil column (ODS-3, 5 μm, 4.6 × 200 mm) was used with the mobile phase of acetonitrile/water (80/20) at a flow rate of 1.000 mL min−1. The excitation and emission wavelengths of detection are 466 nm and 504 nm, respectively. Each sample of liposomes or plasma of 100 μL was mixed intensively with 400 μL of acetonitrile and then centrifuged at 10![[thin space (1/6-em)]](https://www.rsc.org/images/entities/char_2009.gif) 000 rpm for 10 min before loading into the HPLC system.
000 rpm for 10 min before loading into the HPLC system.
The concentration of Cou-6 was calculated using a standard curve. In the range of 0.08–16 ng mL−1, the concentration of Cou-6 (Y, ng mL−1) correlated well with its peak area (X): Y = 1.3469X + 0.0358 (R2 = 0.9999). Three samples of Cou-6 at concentrations of 0.4, 4.0 and 8.0 ng mL−1 were selected for methodology validation. The recovery of this method ranges from 97% to 105% and the relative standard deviation (RSD) is smaller than 2% for 48 h.
2.5 Drug loading and leakage rate of Cou-6 in liposomes
The drug loading of Cou-6 in liposomes was calculated as follows:Before acetonitrile pretreatment and HPLC analysis (see 2.4), the samples of liposomes were centrifuged at 3000 rpm for 5 min and diluted with ultrapure water 1000 times.
In order to investigate the leakage of Cou-6 in cell culture media, the dialysis test was conducted at 37 °C in a horizontal diffusion cell. The donor and receptor compartments were separated by a dialysis membrane (3.5 kD) and filled with 2.0 mL of liposomes and 7.0 mL of culture media, respectively. After magnetic stirring (100 rpm) for 24 h, 100 μL of the culture media was withdrawn and mixed with 400 μL of acetonitrile for HPLC determination. The leakage rate was calculated by the following equation:
2.6 In vitro cytotoxicity
Murine macrophage cell line Raw 264.7 was cultured in a high-glucose DMEM substrate containing 10% fetal bovine serum in an incubator under a humidified atmosphere of 5.0% CO2 at 37 °C. The in vitro cytotoxicity of different kinds of liposomes was assessed by MTT assay. Briefly, Raw 264.7 cells were seeded in a 96-well microplate at a density of 104 cells per well and incubated overnight to allow them to attach. Liposomal suspensions were added to arrive at concentrations ranging from 0.1 to 10 μg mL−1 (here the concentration refers to CPC, mPEG2k–DSPE or cholesterol for each kind of liposome) and incubated for a further 48 h. Next, 20 μL of MTT solution (5 mg mL−1) was added into each well and incubated with cells for 4 h. Finally, the medium was replaced with 150 μL of dimethyl sulfoxide and incubated for 10 min. The relative cell viability for each well was calculated by using the absorbance at 490 nm.2.7 Cellular uptake studies
The cellular uptake amount of liposomes was analyzed by flow cytometry. First, Raw 264.7 cells were cultured in 24-well plates at a density of 2 × 10⁵ cells per well until approximately 70% confluence. Taking DMSO solution of Cou-6 as the control, Cou-6 labeled liposomes were diluted with serum-free medium to achieve a Cou-6 concentration of 0.03 μg mL−1. Then the serum-free medium containing Cou-6 labeled liposomes or free Cou-6 liposomes were used to replace the original medium and incubated for 1, 4, 12 and 24 h, respectively. After that, the cells were washed three times with phosphate-buffered saline (PBS) solution, digested with trypsin, collected and resuspended in 1.0 mL of medium. Finally, the fluorescence intensity of the cells was measured using a BD FASCVerse™ flow cytometer.2.8 Pharmacokinetic (PK) studies
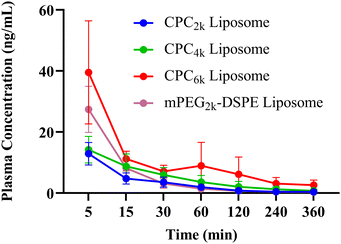
Twenty healthy male SD rats, 270–300 g, were randomly divided into 4 groups and fasted for 12 hours with drinking water before the experiment. Liposomes with Cou-6 as fluorescent probes were injected through the tail vein at a Cou-6 dosage of 3.7 μg per 100 g. Blood samples of 0.5 mL were collected into anticoagulant tubes from tail veins at 5, 15, 30, 60, 120, 240 and 360 min and centrifuged at 3000 rpm for 10 min to obtain plasma. The concentration of Cou-6 in the plasma was determined by HPLC (2.4) and the pharmacokinetic parameters were calculated using DAS 2.0 software. All experiments were performed in compliance with the relevant laws and guidelines of Shandong First Medical University and approved by the institutional committee.2.9 Statistical analysis
Statistical analysis was conducted using GraphPad Prism (9.0.0). The data were presented as the mean ± standard deviation (SD) from at least three independent measurements. Statistical significances were assessed using the Student t-test. A probability value (p) of less than 0.05 was considered statistically significant.3. Results and discussion
3.1 Structure confirmation of CPC
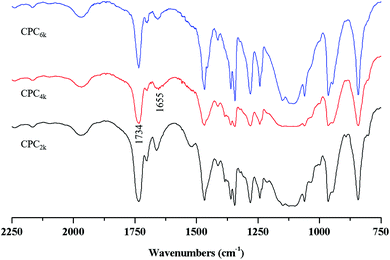
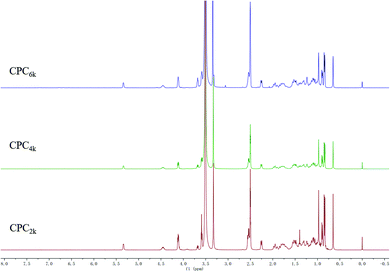
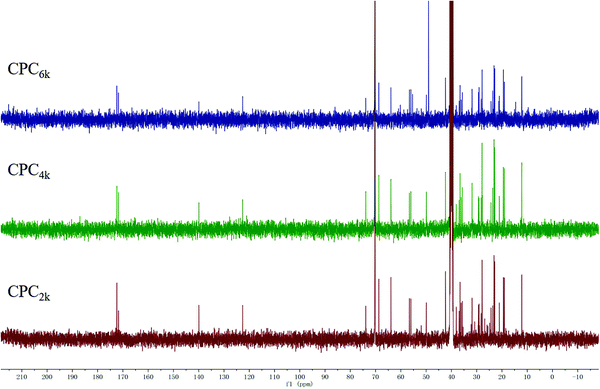
With the assistance of bridging agent SA, cholesterol moieties were grafted onto both ends of the PEG chain to produce CPC. PEG diacid and equimolar amounts of cholesterol will produce mono-cholesteryl PEG (Chol-PEG), which can be easily distinguished from CPC with silica TLC. Actually, excess SA and cholesterol were used here to make sure that CPC rather than Chol-PEG is produced. The structures of CPCs with different MWs have been confirmed further using FT-IR, 1H and 13C NMR spectra. The symmetric deformation vibration of carbonyl in SA moieties at 1734 cm−1 and the C![[double bond, length as m-dash]](https://www.rsc.org/images/entities/char_e001.gif) C stretching vibrations of the cholesterol moiety at 1655 cm−1 appeared in the FT-IR spectra of CPC2k, CPC4k and CPC6k (Fig. 3). In the 1H-NMR spectra (Fig. 4) of CPCs, the characteristic peaks of the cholesterol moiety appeared at 5.34 ppm (C
C stretching vibrations of the cholesterol moiety at 1655 cm−1 appeared in the FT-IR spectra of CPC2k, CPC4k and CPC6k (Fig. 3). In the 1H-NMR spectra (Fig. 4) of CPCs, the characteristic peaks of the cholesterol moiety appeared at 5.34 ppm (C![[double bond, length as m-dash]](https://www.rsc.org/images/entities/char_e001.gif) C) and 0.5–2.1 ppm (CH3– and –CH2–), while the methylene groups of the SA moiety were found at 2.54 ppm. In the 13C-NMR spectra (Fig. 5), signals of the two carbonyl groups of succinic acid moieties were observed at 172.49 and 171.67 ppm while signals of the unsaturated carbons of cholesterol moieties were observed at 139.95 and 122.35 ppm.
C) and 0.5–2.1 ppm (CH3– and –CH2–), while the methylene groups of the SA moiety were found at 2.54 ppm. In the 13C-NMR spectra (Fig. 5), signals of the two carbonyl groups of succinic acid moieties were observed at 172.49 and 171.67 ppm while signals of the unsaturated carbons of cholesterol moieties were observed at 139.95 and 122.35 ppm.
3.2 Characterization of liposomes
The average diameters of most of the CPC liposomes were within the range of 110–140 nm (Table 1). Compared with the naked liposome (F1) and mPEG2k–DSPE liposome (F2), there was a significant increase in size for most of the CPC liposomes. Theoretically, PEG chains could construct a hydration layer on the liposome surface, and the thickness of the hydration layer depends on the MW of PEG chains. In other words, a higher MW of PEG would bring about a thicker hydration layer, hence a larger size of liposomes. However, the size decreased with the increase of MW of PEG moieties when a given weight of CPC was used (F7–F9). It is reasonable to assume that the liposomal size was dominated by the HLB value of CPC rather than the thickness of the hydration layer. However, with a given molar amount of CPC used, the liposome size increased with the increase of MW of PEG moieties (F3–F5), that is to say, the size increased with the weight of CPC used. In short, the addition of CPC might increase or decrease the size of liposomes depending on the relative amount of CPC, MW of PEG moieties, hydration volume and homogenization conditions.| Number | Formulation | Hydrodynamic size (nm) | PDI | Zeta potential (mV) | Drug loading (%, w/w) |
|---|---|---|---|---|---|
| 20 mg of lecithin and 100 μg of Cou-6 were used within a total volume of 10 mL for F1–F4; 100 mg of lecithin and 100 μg of Cou-6 were used within a total volume of 10 mL for F5–F8. | |||||
| F1 | Cholesterol, 2.5 mg | 97.17 ± 1.39 | 0.180 ± 0.011 | −18.17 ± 1.92 | 85.93 |
| F2 | mPEG2k–DSPE, 4.00 mg (1.426 μmol) | 92.44 ± 2.35 | 0.244 ± 0.008 | −13.06 ± 1.41 | 86.78 |
| F3 | CPC2k, 4.24 mg of (1.426 μmol) | 120.23 ± 5.07 | 0.178 ± 0.024 | −14.50 ± 0.81 | 89.76 |
| F4 | CPC4k, 7.09 mg (1.426 μmol) | 121.36 ± 3.57 | 0.140 ± 0.008 | −13.80 ± 0.98 | 88.31 |
| F5 | CPC6k, 9.94 mg (1.426 μmol) | 135.30 ± 4.69 | 0.222 ± 0.008 | −16.23 ± 1.75 | 86.68 |
| F6 | mPEG2k–DSPE, 10 mg | 75.10± 1.25 | 0.262 ± 0.007 | −13.63 ± 0.45 | 87.76 |
| F7 | CPC2k, 10 mg | 130.80 ± 4.32 | 0.525 ± 0.118 | −13.80 ± 0.98 | 84.07 |
| F8 | CPC4k, 10 mg | 116.00 ± 4.06 | 0.457 ± 0.036 | −15.23 ± 0.37 | 87.41 |
| F9 | CPC6k, 10 mg | 91.75 ± 3.283 | 0.238 ± 0.013 | −15.70 ± 3.50 | 90.60 |
Naked liposomes, which were prepared without CPC, possessed a zeta potential of −18.17 mV while CPC liposomes, as well as mPEG2k–DSPE, displayed only a slightly lower value. This kind of minor variation in charge density may result from the addition of non-ionic polymers of CPC. However, the variation of PEG moieties in weight or MW did not induce the change in the zeta potential of liposomes.
From a thermodynamics perspective, both cholesterol moieties in a CPC molecule tend to anchor into the lipid bilayer so that the Gibbs energy of the whole system is minimized. If so, PEG chains would present a ring-shaped, specifically speaking, twisted-ring-shaped rather than linear conformation (Fig. 1). A double shell structure, which might be attributed to the lipid membrane and PEG layer, respectively, can be seen in CPC6k liposomes but not in other kinds of liposomes (Fig. 6). Under a given resolution of TEM, it is possible that the PEG layer could not be observed unless it is thick enough. Unfortunately, neither the TEM image nor any other widely used spectrum method is adequate to directly differentiate the ring-like conformation from that of linear type.
3.3 Cellular uptake studies
All kinds of liposomes showed high Cou-6 loading capacity ranging from 84–90% (Table 1). As a lipophilic fluorescent probe, Cou-6 tends to be distributed into the liposomal membrane rather than the water phase. In order to rule out the false positive of cell uptake caused by the leakage of Cou-6, the leakage rate was tested before cellular uptake. CPC4k, mPEG2k–DSPE and naked liposomes showed low enough leakage rates (0.17%, 0.18% and 0.16%, respectively), so the leakage of Cou-6 would not obviously affect cellular uptake.With Cou-6 as the fluorescent probe, different kinds of liposomes (F1–F5 in Table 1) were investigated for cellar uptake and the results are presented in the form of fluorescence intensity of cells in Fig. 7. Compared with the naked liposome (F1), the mPEG2k–DSPE liposome did not show significant difference in cellular uptake until 12 h passed, while CPC liposomes demonstrated a lower cellular uptake than naked liposomes at 1 h (p < 0.05) and extremely significant differences at 4 h and 12 h (p < 0.01). The degree to which CPC liposomes evade cellular uptake relied on the MW of the PEG moiety. Under the given molar amount of CPC, the cellular uptake efficiency of CPC liposomes was negatively correlated with the MW of PEG moiety at 12 h, which is consistent with previous reports on mPEG derivatives.1,5,16 An increase in size usually enhances the cellular uptake. However, the CPC6k liposome, even with a larger size than that of mPEG2k–DSPE, performed better in evading cellular uptake, which implied its superior surface properties for long circulation.
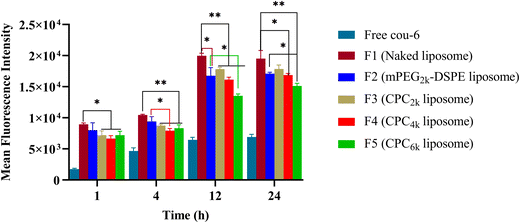 | ||
| Fig. 7 Mean fluorescence intensity of different kinds of liposomes in RAW264.7 cells. Comparison was made with the mPEG2k–DSPE group (*p < 0.05; **p < 0.01; ***p < 0.001). | ||
3.4 In vitro cytotoxicity
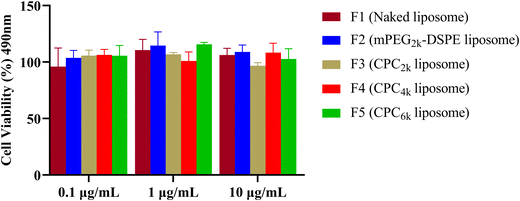
Both PEG and cholesterol are nontoxic, so the only possible reason for the toxicity of CPC, if there was, might be its destruction effect on the biomembrane as a surfactant. Cytotoxicity assay was conducted using liposomes prepared with the same formulation as F1 and F6–F9 but without the addition of Cou-6. All kinds of liposomes exhibited a relatively high cell viability of above 90% and no significant difference was observed among any group of liposomes (Fig. 8). So CPCs did not bring significant toxicity at concentrations ranging from 0.1 μg mL−1 to 10 μg mL−1.3.5 In vivo PK studies
The PK studies were performed in SD rats using Cou-6 labeled liposomes (F6–F9, Table 1) and the results are revealed in Fig. 9 and Table 2. In general, the mean residence time (MRT) of all CPC liposomes was significantly higher than that of mPEG2k–DSPE liposomes (p < 0.01). The clearance rate (CL) and apparent volume of distribution (V) of CPC liposomes decreased with the increase of MW of PEG chains. So CPC6k showed the lowest value of CL and V. Despite a larger size than its mPEG2k–DSPE counterpart, the CPC6k liposome exhibited a better long-circulating property than any other liposome, which can be seen from the in vivo half-life (T1/2) and AUC.| mPEG2k–DSPE liposome (F6) | CPC2k liposome (F7) | CPC4k liposome (F8) | CPC6k liposome (F9) | |
|---|---|---|---|---|
| *Represents the comparison with mPEG2k–DSPE liposomes. *p < 0.05; **p < 0.01; ***p < 0.001. | ||||
| T 1/2 (h) | 2.112 ± 0.8173 | 1.770 ± 0.6300 | 1.728 ± 0.4969 | 2.799 ± 0.3772 |
| AUC (ng L−1 h−1) | 11244 ± 1860 | 8657 ± 2792 | 15622 ± 7871 | 36563 ± 22284* |
| MRT (0-t) | 0.8992 ± 0.1006 | 1.317 ± 0.2098** | 1.577 ± 0.2700*** | 1.789 ± 0.3630** |
| CL | 3.125 ± 0.6687 | 4.267 ± 1.478 | 2.562 ± 1.126 | 0.9878 ± 0.4452*** |
| V | 9.006 ± 1.009 | 11.31 ± 6.402 | 6.232 ± 3.541 | 4.050 ± 1.874** |
It is the repetitive units of oxyethylene that endowed PEG chains with hydrophilicity and the resulting stealth capability, which would undoubtedly remain even when the PEG chains were folded into rings. Considering the end group of the PEG chain being the recognition site of MPS uptake, the possible mechanism by which CPC takes effect lies not only in the twisted ring-like conformation but also in the both hidden ends of the PEG chain. CPC could provide a new alternative for stealth liposomes to be drug carriers or imaging agents.
4. Conclusions
Derivatives of PEG are gold standards for ‘stealth polymers’ in liposomes. Different from PEG derivatives in which one end can move freely outside the nanoparticle surface, CPC could anchor both ends into the liposomal membrane to present a twisted-ring-shaped PEG chain, theoretically. In vitro and in vivo experiments in this work presented low toxicity and successful application of CPC liposomes in evading the immune clearance and prolonging the circulation time. Yet, in order to evaluate the potential of CPC as a candidate for stealth polymers, further studies are required to clarify the features of CPC in drug loading and the mechanism of long circulation, especially the interaction between CPC and the immune system.Conflicts of interest
There are no conflicts of interest to declare.Acknowledgements
This work was supported by the Shandong Provincial Natural Science Foundation, China (No. ZR2018LH023) and the Academic Promotion Program of Shandong First Medical University (Grant No. 2019QL011).References
- S. Y. Fam, C. F. Chee, C. Y. Yong, K. L. Ho, A. R. Mariatulqabtiah and W. S. Tan, Nanomaterials, 2020, 10, 787 Search PubMed.
- S. Deodhar and A. K. Dash, Ther. Delivery, 2018, 9, 857–872 CrossRef CAS PubMed.
- T. Lorson and E. Wegener, et al. , Biomaterials, 2018, 178, 204–280 CrossRef CAS PubMed.
- D. Liu, Q. Zhang, J. Wang, S. Guan, D. Cai and J. Liu, Carbohydr. Polym., 2021, 257, 117572 CrossRef CAS PubMed.
- D. Yadav and H. K. Dewangan, J. Biomater. Sci., Polym. Ed., 2021, 32, 266–280 CrossRef CAS PubMed.
- M. Gao, J. Deng, F. Liu, A. Fan, Y. Wang, H. Wu, D. Ding, D. Kong, Z. Wang, D. Peer and Y. Zhao, Biomaterials, 2019, 223, 119486 CrossRef CAS PubMed.
- Y. Yao, P. E. Saw, Y. Nie, P. P. Wong, L. Jiang, X. Ye, J. Chen, T. Ding, L. Xu, H. Yao, H. Hu and X. Xu, J. Mater. Chem. B, 2019, 7, 576–585 RSC.
- J. Hu, Y. Sheng, J. Shi, B. Yu, Z. Yu and G. Liao, Curr. Drug Metab., 2018, 19, 723–738 CrossRef CAS PubMed.
- J. Jiao, X. Luo, C. Wang, X. Jiao, M. Liu, X. Liu, L. Wei, Y. Deng and Y. Song, AAPS PharmSciTech, 2020, 21, 106 CrossRef CAS PubMed.
- S. M. D'Addio, S. Baldassano, L. Shi, L. Cheung, D. H. Adamson, M. Bruzek, J. E. Anthony, D. L. Laskin, P. J. Sinko and R. K. Prud'homme, J. Controlled Release, 2013, 168, 41–49 CrossRef PubMed.
- H. Ren, Y. He, J. Liang, Z. Cheng, M. Zhang, Y. Zhu, C. Hong, J. Qin, X. Xu and J. Wang, ACS Appl. Mater. Interfaces, 2019, 11, 20304–20315 CrossRef CAS PubMed.
- S. Y. Xu, H. Su, X. Y. Zhu, X. Y. Li, J. Li, X. Chen, Q. Wang, R. Y. Hao and X. Y. Yan, J. Liposome Res., 2021, 1–12, DOI:10.1080/08982104.2021.1884093.
- X. Ke, W. Lin, X. Li, H. Wang, X. Xiao and Z. Guo, Drug Delivery, 2017, 24, 1680–1689 CrossRef CAS PubMed.
- Q. Wang, L. He, D. Fan, W. Liang and J. Fang, J. Mater. Chem. B, 2020, 8, 1841–1851 RSC.
- F. Mastrotto, C. Brazzale, F. Bellato, S. De Martin, G. Grange, M. Mahmoudzadeh, A. Magarkar, A. Bunker, S. Salmaso and P. Caliceti, Mol. Pharmaceutics, 2020, 17, 472–487 CAS.
- M. Liu, Y. Chu, H. Liu, Y. Su, Q. Zhang, J. Jiao, M. Liu, J. Ding, M. Liu, Y. Hu, Y. Dai, R. Zhang, X. Liu, Y. Deng and Y. Song, Mol. Pharmaceutics, 2020, 17, 1059–1070 CrossRef CAS PubMed.
| This journal is © The Royal Society of Chemistry 2022 |

