
 Open Access Article
 This Open Access Article is licensed under a Creative Commons Attribution-Non Commercial 3.0 Unported Licence
Anharmonicity induced faster decay of hot phonons in rutile TiO2 nanorods: a Raman spectromicroscopy study†
Chanchal
Rani
a,
Devesh K.
Pathak‡
a,
Manushree
Tanwar
a,
Suchita
Kandpal
a,
Tanushree
Ghosh
a,
Maxim Yu.
Maximov
b and
Rajesh
Kumar
 *acd
*acd
aMaterials and Device Laboratory, Department of Physics, Indian Institute of Technology Indore, Simrol-453552, India. E-mail: rajeshkumar@iiti.ac.in
bPeter the Great Saint-Petersburg Polytechnic University, Saint Petersburg, 195221, Russia
cCentre for Advanced Electronics, Indian Institute of Technology Indore, Simrol-453552, India
dCentre for Indian Scientific Knowledge Systems, Indian Institute of Technology Indore, Simrol-453552, India
First published on 14th December 2021
Abstract
Temperature-dependent Raman spectromicroscopy of rutile TiO2 nanorods has been studied here to understand the effect of thermal perturbations on different Raman-active phonon modes. The TiO2 nanorods, characterized using electron microscopy, X-ray diffraction and Raman spectroscopy, were prepared using a hydrothermal method. Raman spectra, recorded at temperatures higher than room temperature, have been analyzed within the theoretical framework developed by considering the anharmonicity of hot phonons. Different temperature-dependent responses were observed for Eg and A1g modes with the latter being immune with respect to the Raman peak position. The experimental results indicated a dominant role of phonon–phonon kinematics on peak shifts and broadenings in the Eg Raman mode, confirming the prevalence of the anharmonic effect. The temperature-dependent redshift in the peak position and broadening of the Raman Eg mode have been explained using three or four phonon decay processes. A consolidated insight, by showing a good agreement between experimental and theoretical frameworks, about the behavior of phonons under the influence of elevated temperatures has been presented.
Introduction
Transition metal oxides and their nanoparticles have received immense attention from scientists and industry due to their extraordinary applications in the modern technological world.1–3 Among these, titanium oxide (TiO2) has been considered as a “functional building block”, which can be appreciated from the quanta in which this material is manufactured (millions of tons) for various applications as pigment, paint additive, and sunscreen, to name a few simplest uses leaving the sophisticated applications in optoelectronics, catalysis, biomedical, energy and environmental applications.4–9 Nanostructures of TiO210–14 have attracted exclusive interest due to their chemical stability and low toxicity.15,16 Under ambient conditions, TiO2 is known to exist in eight crystalline polymorphs,17 of which only three, namely rutile (tetragonal),18 anatase (tetragonal)19 and brookite (orthorhombic) phases occur naturally.20,21 Though each of these polymorphs exhibit distinct properties, the rutile phase is the thermodynamically preferred22 form at all temperatures. Similar to its bulk form, nanostructured rutile TiO2 is also important because it exhibits advantageous properties23–25 compared to anatase including higher absorption in the visible light, and better chemical stability,26–28 making it suitable for numerous applications.29–31 Looking at its technological importance, basic properties of this phase has also been explored.32 However, the understanding of anharmonic effects that prevails at temperatures higher than room temperature is quite special about the behavior of these hot phonons, and thus needs further investigation.Raman spectroscopy33–37 is one of the best non-destructive techniques to understand microscopic properties and the best one to investigate the behavior of phonons. Advanced techniques, such as Raman microscopy and thermal mapping, have added new capabilities to the Raman spectroscopy as a tool for investigating and understanding various aspects of (nano-) materials.38–44 Raman spectroscopy can identify different Raman active vibration modes, namely B1g, Eg, A1g and B2g, and any change in their vibrational energies and the corresponding phonon spectrum at elevated temperatures.38,45–47 Temperature-dependent (TD) Raman spectroscopy,48,49 due to its fundamental importance in calculating various parameters such as coefficient of thermal expansion, and phonon-lifetime, can be used to investigate the presence of any anharmonicity as well. Since the phonon frequency and lifetime experimentally manifest themselves in terms of Raman peak position and Raman width, any changes in these Raman parameters can be used to understand and quantify the perturbation that affects the underlying physical property. The TD peak shift of a Raman phonon mode provides valuable information on the effect of thermal perturbation on phonon scattering processes and causes Raman peak broadening due to reduced lifetime with thermal expansion of the crystal lattice. Raman study on anatase TiO2 nanorods (TNRs) has been carried out to a great extent,50–52 whereas that od rutile phase has been carried out only by a few research groups,40,53,54 and carrying out more studies is required to present a holistic picture about the different aspects related to anharmonicity in low dimensional TiO2.
The aim of the present study is to investigate anharmonic effects on phonons present in rutile TNRs when temperature is raised above room temperature. Rutile TNRs have been prepared via a hydrothermal method on a fluorine-doped tin oxide (FTO) substrate and TD Raman spectra were recorded in the temperature range of 300–725 K have been analyzed. The experimentally obtained TD Raman data have been discussed within the theoretical framework developed by Balkanski et al.49 to understand how the anharmonic effects manifest in terms of phonon mode energy and their lifetimes. A good correlation between the experimental observations and theoretical model was obtained when a three-phonon decay was considered for the Eg mode, whereas the A1g mode was found to be immune to the thermal perturbations. The present approach is free of complex calculations and independent of numerous variables unlike some other methods, such as molecular dynamic simulation, which is quite complex and requires a lot of mathematics. Moreover, the present study has been done for higher temperatures (higher than room temperature) by taking the reference at room temperature.
Experimental details
Rutile TiO2 nanorod arrays were prepared on fluorene-doped tin oxide (FTO) substrates (TiO2@FTO) via a hydrothermal method. In a chemical solution, 15 mL of HCl was dissolved in 15 mL of deionized (DI) water, followed by stirring for 10 min. After stirring, 2 mL of titanium butoxide was added dropwise in the solution using a capillary tube and stirred the solution for 1 h to make a homogenous solution of the precursors present in an aqueous medium. Then, the as-prepared solution and the FTO substrate were placed in a Teflon liner stainless steel autoclave, where the conductive side of the FTO substrate was facing down. The hydrothermal process was conducted by putting the autoclave in an oven at 180 °C for 5 h for the nucleation of the precursor on the substrate geometry. Further, the autoclave was cooled down to room temperature, and then, a white thin film-deposited FTO substrate was obtained and rinsed with DI water, and dried at 180 °C for 2 h. Afterwards, the as-prepared sample was taken for further characterization to check the phase and purity of the deposited material. Surface morphology of the as-prepared sample has been studied using a scanning electron microscope (Supra Zeiss 55, FESEM). The crystal structure of the samples was examined by X-Ray diffraction (XRD) using an X-Ray diffractometer (D8 Advance, Bruker) with Cu K∝ radiation (λ = 0.154 nm). The TD Raman data from the sample have been recorded in the automatic mode using the software control attached with a Raman spectrometer (Horiba Jobin-Yvon) with a 633 nm laser. The temperature has been controlled through a Linkam Stage attached with appropriate interfacing to the Raman spectrometer software (LabSpec).Results and discussion
Surface morphology and microstructure of the TiO2@FTO sample prepared via a hydrothermal method were studied via SEM, and the obtained images were analyzed using the ImageJTM software. The SEM images (Fig. 1) show that a uniform deposition has taken place. The top view SEM micrograph indicates that the sample contained well-aligned rod-like structures. This has been examined using the surface profile obtained by the ImageJ software (inset, Fig. 1a), which shows rod-like structures. A few hundred nanometers thick rods were visible when seen at the higher magnification SEM image (Fig. 1b). The average thickness of the rods was found to be ∼220 nm as obtained from the line profiling (inset, Fig. 1b) performed on the SEM image. Further, phase and structural studies on the as-prepared thin film have been carried out via XRD and Raman spectroscopy.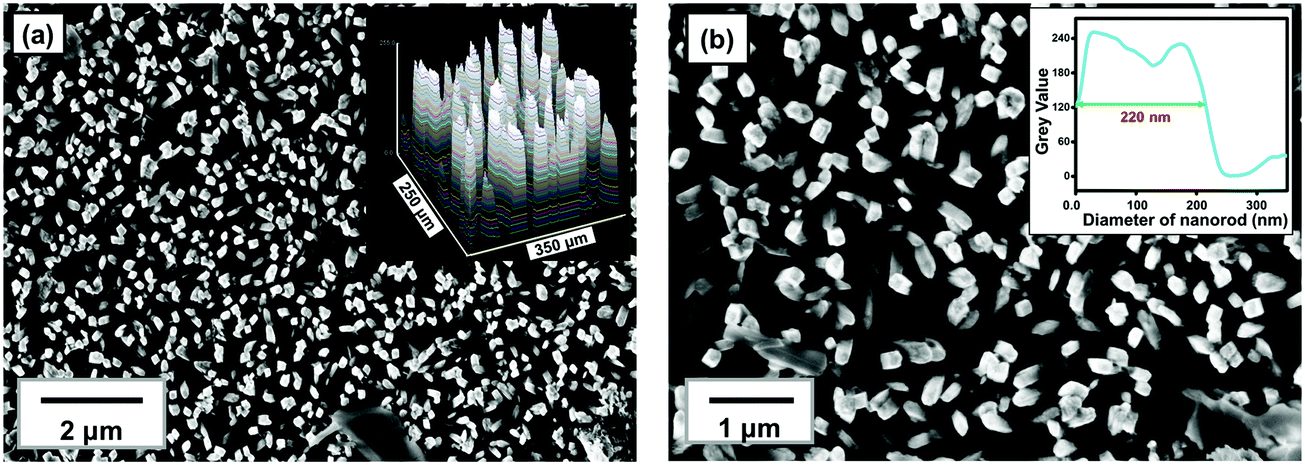 | ||
| Fig. 1 (a and b) Top view of the SEM image of TNRs of the rutile phase deposited on the FTO substrate at different magnifications. Corresponding surface profile and line scan plots are shown in the corresponding insets, respectively. | ||
The XRD pattern (Fig. 2a) showed several diffraction peaks at 2θ values of 27°, 36°, 39°, 41°, 44°, 54°, 57°, 64° and 69°. The peaks in the diffraction pattern with the corresponding (hkl) planes (Fig. 2a) can be identified as originating from the rutile phase of TiO255,56 (marked with *) and the FTO substrate57 (marked as #). Since, TiO2 is known to have defects because of the oxygen vacancy where an O2− ion moves from a normally occupied lattice site to a vacant interstitial site which is supposed to be prevalent defect in many metal oxides. Under thermal conditions, hydrogen atom interacts with the lattice oxygen of TiO2 on the surface, which results in the formation of oxygen vacancies, and changes the surface properties of TiO2.58,59 No such defects can be identified from the XRD pattern in the present sample.
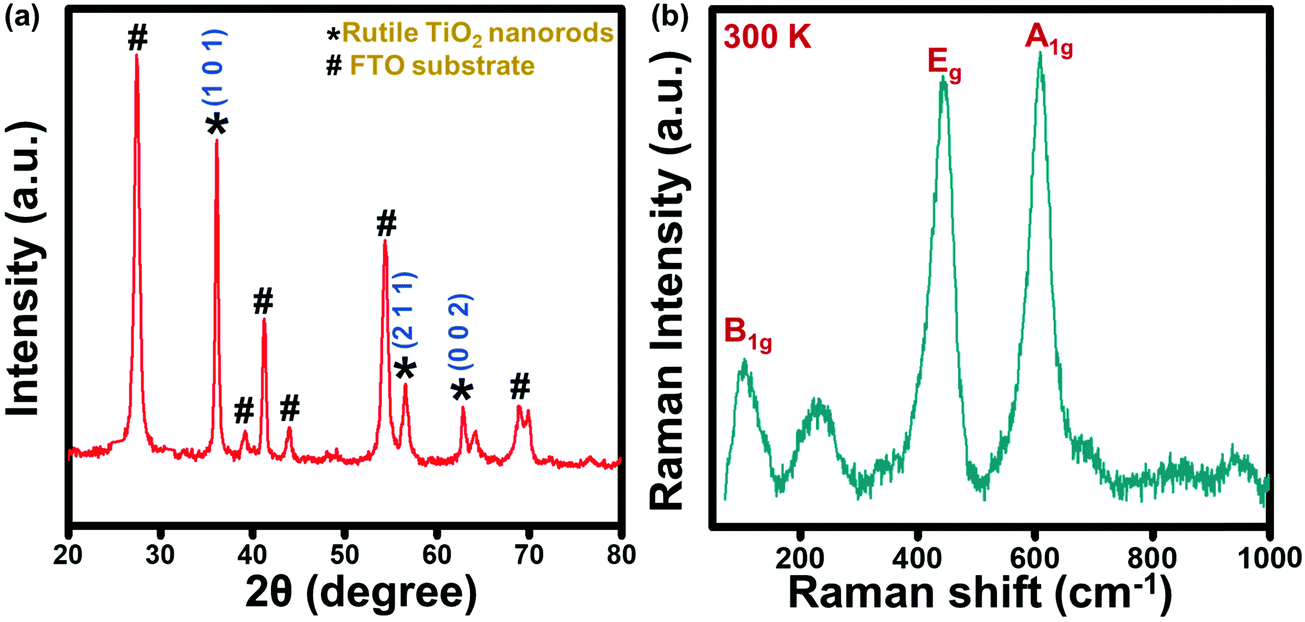 | ||
| Fig. 2 (a) X-Ray diffraction pattern of rutile TiO2 nanorods deposited on the FTO substrate with the corresponding (hkl) plane (b) The experimental Raman spectrum of rutile TiO2 nanorods at room temperature (300 K). | ||
Furthermore, no additional peak or hump is seen in the XRD, which revealed that pure single phased TNRs have been fabricated. To confirm the phase of the TNRs, Raman spectroscopy has been carried out (Fig. 2b), which shows four Raman active modes at 143 cm−1, 235 cm−1, 447 cm−1 and 610 cm−1 at room temperature, corresponding to the B1g (143 cm−1), Eg (447 cm−1) and A1g (610 cm−1) modes of the rutile TNRs.60–62 The peak appears at 235 cm−1, which arose due to the multi-photon process in the rutile TNRs.63 These three different vibration bands of Ti+4 and O−2 atoms at their respective position also confirms the tetragonal crystal structure of rutile TiO2, making it consistent with the XRD results. It is known that these Raman active modes in TiO2 are comprised of motions of O2− ions with respect to the central stationary Ti4+ ions, either perpendicular to the c-axis, which is attributed to the A1g and B1g modes, or along to c-axis, which is attributed to the Eg mode. It is clear that the Eg and A1g Raman modes are as usual most intense modes, and B1g is the weakest one. The structural and spectroscopic analysis mentioned above (Fig. 1 and 2) reveal that the deposited film contains ∼220 nm thick TNRs in the rutile phase, and has been studied further via TD Raman-spectroscopy and thermal mapping.
As mentioned above, possible anharmonic effects in Raman modes have been studied using TD Raman spectromicroscopy. The TD Raman spectra of rutile TNRs have been recorded in the temperature range of 300–725 K and analyzed accordingly. Fig. 3a shows the Raman spectra from rutile TNRs at various temperatures, plotted with an axis-offset for better visibility. A TD phonon softening could be seen very clearly in the Eg mode, whereas the A1g mode remained immune to the thermal effects in terms of its peak position. For better appreciation of the TD Raman modes, it has also been displayed in the form of a Raman thermal image (Fig. 3b). For better clarity, the thermal map of the Eg mode has been zoomed in (Fig. S1, ESI†), showing the phonon softening and varying width of the Raman mode.
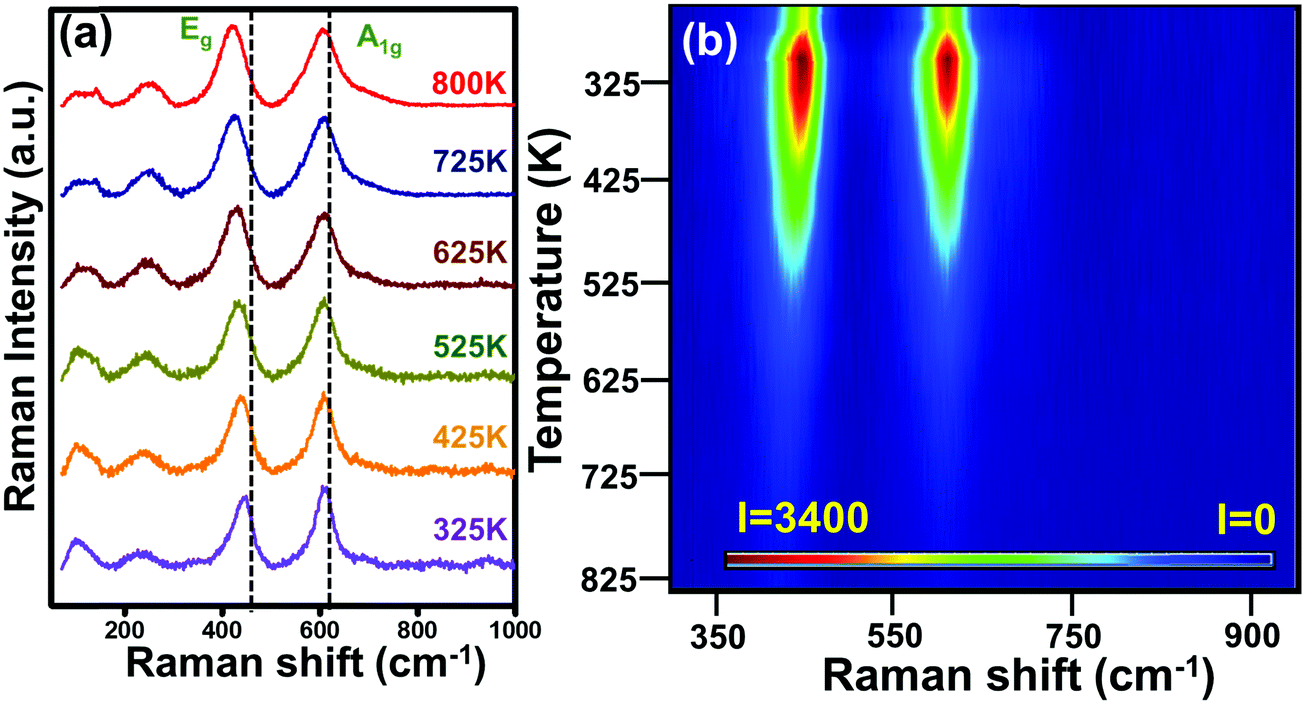 | ||
| Fig. 3 (a) Temperature-dependent experimentally observed Raman spectra from rutile TNRs and (b) the corresponding thermal Raman image for Eg and A1g Raman modes. | ||
The thermal immunity of the B1g and A1g modes was caused by the fact that the shifts due to thermal expansion and higher order anharmonicities were complementary to each other to compensate each other, which is well known for TNRs, as reported by Samara and Peercy.64 On the other hand, as mentioned above, the most intense Eg mode underwent a phonon softening of ∼22 cm−1 (Δω) for a temperature gradient (ΔT) of 475 K. The likely reason for the phonon softening is the temperature-induced thermal expansion, which decreases the vibrational frequency.49,65,66 By a careful observation, one can notice an increasing spectral width (measured in terms of full width at half maxima or FWHM) with the increasing temperature (Fig. 3). Since the FWHM is a measure of phonon lifetime, an increasing FWHM with the increasing temperature indicated that the phonon lifetime reduced at elevated temperatures. This hinted towards a faster phonon decay at higher temperatures and can be understood using a theoretical framework as follows.
Looking at the indicative TD phonon softening and phonon life time variation of the Eg Raman mode of TNRs, anharmonicity has been analyzed within the theoretical framework of the Balkanski's anharmonic model.49 As per the model, at high temperatures, an optical phonon decays into two or three phonons, thus decreasing the phonon life time, which is manifested as a larger Raman spectral width (FWHM). The presence of anharmonicity forces the phonons to oscillate with a lower frequency, and gets identified through the Raman peak (red) shift. This decay of optical phonons into two or three phonons is represented mathematically as cubic or quartic anharmonicities. Hence, in this simplified model, the TD Raman peak position (eqn (1) and (2)) and spectral linewidth (FWHM) are given as eqn (3) and (4):
| ω(T) = ω0 + ΔΩ(T) | (1) |
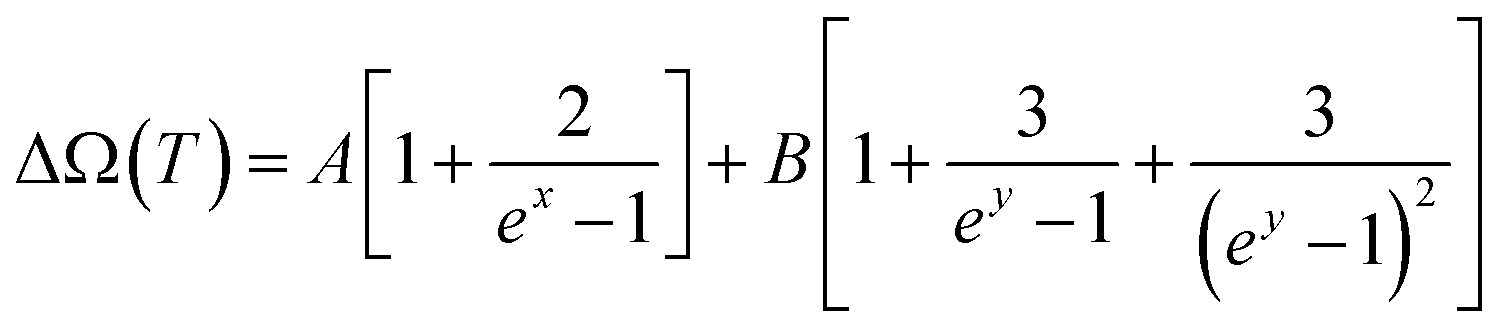 | (2) |
| Γ(T) = Γ0 + ΔΓ(T) | (3) |
 | (4) |
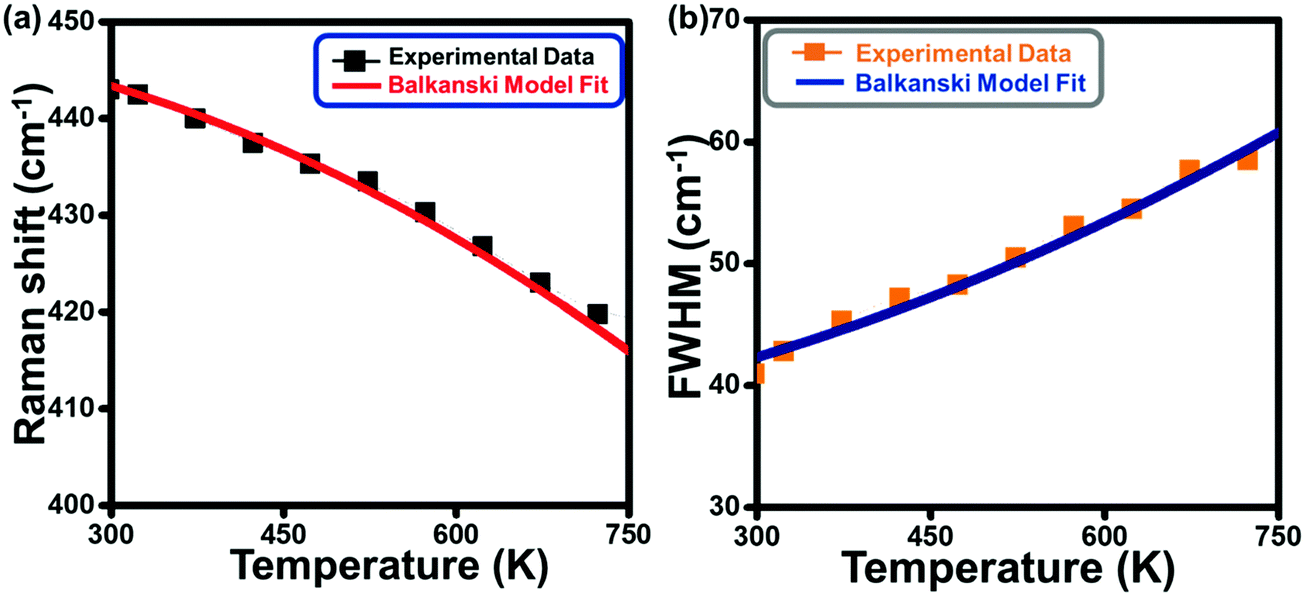 | ||
| Fig. 4 Variation in the Raman peak position (a) and FWHM (b) as a function of temperature where solid lines represent the curve predicted by the Balkanski model and discrete points correspond to the experimental data. | ||
The calculated Raman shift (Fig. 4a) and linewidth (Fig. 4b) by considering the anharmonic effects (eqn (1)–(4)) are represented by solid lines, whereas the discrete points show the values obtained from the experimental Raman data for the Eg mode. The solid line in Fig. 4a has been obtained using A and B as the fitting parameters, which shows the best fit with the experimental data (solid black points) when the values of A = −0.50 cm−1 and B = −0.85 cm−1 are used. These values for silicon, used by Balkanski et al., came out to be −4.24 cm−1 and −0.174 cm−1. A good fit between the experimental and theoretical (using both the decay terms, eqn (2)) values in Fig. 4a indicates that the Eg Raman mode redshift from 447 cm−1 to 422 cm−1 with an increase in the temperature from 300 K to 725 K, strongly suggesting that anharmonicity is caused by both cubic and quartic anharmonicities. It is worth mentioning that the role of the confinement effect has not been considered here because its effect on the mode vibrational energy and thus Raman peak position for the rutile phase is not significant enough, as reported by T. Mazza et al.62 Alternatively, the total Raman peak shift in the Eg mode is solely because of the anharmonic effect. A similar theoretical analysis has also been done for the Raman spectral width (Fig. 4b) using eqn (3) and (4). The best fit between the experimental data (discrete points, Fig. 4b) and theoretical values (solid line, Fig. 4b) are obtained for the values of C = 2.3 cm−1 and D = 0.42 cm−1 (anharmonic parameters). These values for silicon, used by Balkanski et al., came out to be 1.295 cm−1 and 0.105 cm−1, respectively. The FWHM of the Eg mode increased from 41 cm−1 to 60 cm−1 (Fig. 4b) due to the anharmonic effect, which was caused by phonon softening at high temperatures (300–725 K).
Unlike the Eg Raman mode, the A1g mode did not undergo anharmonic effects, making it immune towards the thermal effects, which indicate that the thermal expansion was small enough to keep the corresponding mode to vibrate in the harmonic regime. This is reflected as the temperature-independent Raman peak position of this mode. On the other hand, the FWHM of the A1g mode varied only between 40.5 cm−1 and 67 cm−1 in the temperature range of 300–725 K, which meant that, though the vibrations remained harmonic, it still suffers a phonon decay, thus decreasing the phonon lifetime with the increasing temperature. Observed temperature-dependent width and estimated phonon life time of the A1g mode have been provided in Fig. S2 and S3 (ESI†). Alternatively, Eg and A1g vibrational modes of rutile TNRs behaved differently under the influence of thermal perturbations. At the nanoscale, the Eg Raman mode of rutile TNRs exhibited a redshift and broadening up to a few cm−1, but while applying an anharmonic effect to the system, these changes in Raman parameters are huge and are of great interest. Due to the phonon anharmonicity, one optical phonon decays into two or three phonons, which affects each Raman mode differently and can be explained successfully using the existing Balkanski model as evident from the consistency between the experimental Raman data and theoretically obtained values.
Conclusion
Temperature-dependent Raman spectroscopy and Raman thermal mapping of rutile TiO2 nanorods revealed that the Eg mode responded anharmonically to the thermal perturbations at higher temperatures (more than room temperature), whereas the A1g mode was immune to such a temperature rise. A direct proportionality between the phonon mode frequency and temperature was observed due to anharmonic vibrations of this mode. In addition, the phonon lifetime decreases with the increase in temperature, indicating that hot phonons decay faster. This has been concluded because the experimental observations were consistent with the established phonon decay model. The model, when two- (three-) phonon decay of optical phonon were considered, showed a good agreement with the experimental observation for the Eg mode. On the other hand, however, the A1g mode frequency is immune to thermal perturbations, a little change in the lifetime is observed. The mode-dependent anharmonicity is associated with the vibration-dependent polarizability for a given mode. Overall, temperature-dependent Raman spectromicroscopy helps in getting a consolidate insight about anharmonic response of different Raman active modes from rutile TiO2 nanorods.Conflicts of interest
There are no conflicts to declare.Acknowledgements
Authors thank funding received from the science and Engineering Research Board (SERB) and the Govt. of India (Grant CRG/2019/000371). Facilities received from SIC (IIT Indore) and the Department of Science and Technology (DST) and Govt. of India, under FIST scheme (Grant SR/FST/PSI-225/2016) are highly acknowledged. Authors thank Dr S. Sen & Kailash Kumar (IIT Indore) for XRD measurements and Er. Nitin Upadhyay for technical support in Raman measurement. Authors C. R. and M. T. acknowledge DST (File DST/INSPIRE/03/2019/002160/IF190314 and DST/INSPIRE/03/2018/000910/IF180398) for providing fellowship. Author S. K. acknowledges UGC (Ref. 1304-JUNE-2018-513215), Govt. of India, for providing fellowship.References
- Q. X. Jia, T. M. McCleskey, A. K. Burrell, Y. Lin, G. E. Collis, H. Wang, A. D. Q. Li and S. R. Foltyn, Polymer-assisted deposition of metal–oxide films, Nat. Mater., 2004, 3, 529–532 CrossRef CAS PubMed.
- X. Lang, A. Hirata, T. Fujita and M. Chen, Nanoporous metal/oxide hybrid electrodes for electrochemical supercapacitors, Nat. Nanotechnol., 2011, 6, 232–236 CrossRef CAS PubMed.
- B. O’Regan and M. Grätzel, A low-cost, high-efficiency solar cell based on dye-sensitized colloidal TiO2 films, Nature, 1991, 353, 737–740 CrossRef.
- C. Luo, X. Ren, Z. Dai, Y. Zhang, X. Qi and C. Pan, Present Perspectives of Advanced Characterization Techniques in TiO2-Based Photocatalysts, ACS Appl. Mater. Interfaces, 2017, 9, 23265–23286 CrossRef CAS PubMed.
- J. Schneider, M. Matsuoka, M. Takeuchi, J. Zhang, Y. Horiuchi, M. Anpo and D. W. Bahnemann, Understanding TiO2 Photocatalysis: mechanisms and Materials, Chem. Rev., 2014, 114, 9919–9986 CrossRef CAS PubMed.
- L. Sang, Y. Zhao and C. Burda, TiO2 Nanoparticles as Functional Building Blocks, Chem. Rev., 2014, 114, 9283–9318 CrossRef CAS PubMed.
- C. L. Pang, R. Lindsay and G. Thornton, Structure of Clean and Adsorbate-Covered Single-Crystal Rutile TiO2 Surfaces, Chem. Rev., 2013, 113, 3887–3948 CrossRef CAS PubMed.
- R. Sanz, L. Romano, M. Zimbone, M. A. Buccheri, V. Scuderi, G. Impellizzeri, M. Scuderi, G. Nicotra, J. Jensen and V. Privitera, UV-black rutile TiO2: an antireflective photocatalytic nanostructure, J. Appl. Phys., 2015, 117, 074903 CrossRef.
- A. Primo, A. Corma and H. García, Titania supported gold nanoparticles as photocatalyst, Phys. Chem. Chem. Phys., 2010, 13, 886–910 RSC.
- K. Nakata and A. Fujishima, TiO2 photocatalysis: design and applications, J. Photochem. Photobiol., C, 2012, 13, 169–189 CrossRef CAS.
- N. Roy, Y. Sohn and D. Pradhan, Synergy of Low-Energy {101} and High-Energy {001} TiO2 Crystal Facets for Enhanced Photocatalysis, ACS Nano, 2013, 7, 2532–2540 CrossRef CAS PubMed.
- C. Luo, X. Ren, Z. Dai, Y. Zhang, X. Qi and C. Pan, Present Perspectives of Advanced Characterization Techniques in TiO2-Based Photocatalysts, ACS Appl. Mater. Interfaces, 2017, 9, 23265–23286 CrossRef CAS PubMed.
- D. K. Pathak, A. Chaudhary, S. Mishra, P. Yogi, P. R. Sagdeo and R. Kumar, Improved field emission from appropriately packed TiO2 nanorods: designing the miniaturization, Superlattices Microstruct., 2019, 126, 1–7 CrossRef CAS.
- Z. S. Hosseini, M. Shasti, S. Ramezani Sani and A. Mortezaali, Photo-detector diode based on thermally oxidized TiO2 nanostructures/p-Si heterojunction, J. Appl. Phys., 2016, 119, 014503 CrossRef.
- S. Hamad, C. R. A. Catlow, S. M. Woodley, S. Lago and J. A. Mejías, Structure and Stability of Small TiO2 Nanoparticles, J. Phys. Chem. B, 2005, 109, 15741–15748 CrossRef CAS PubMed.
- A. N. Enyashin and G. Seifert, Structure, stability and electronic properties of TiO2 nanostructures, Phys. Status Solidi B, 2005, 242, 1361–1370 CrossRef CAS.
- A. Niltharach, S. Kityakarn, A. Worayingyong, J. T.-Thienprasert, W. Klysubun, P. Songsiriritthigul and S. Limpijumnong, Structural characterizations of sol–gel synthesized TiO2 and Ce/TiO2 nanostructures, Phys. B, 2012, 407, 2915–2918 CrossRef CAS.
- W. Kang and M. S. Hybertsen, Quasiparticle and optical properties of rutile and anatase ${\text{TiO}}_{2}$, Phys. Rev. B: Condens. Matter Mater. Phys., 2010, 82, 085203 CrossRef.
- X.-Q. Gong, A. Selloni, M. Batzill and U. Diebold, Steps on anatase TiO2(101), Nat. Mater., 2006, 5, 665–670 CrossRef CAS PubMed.
- D. Dambournet, I. Belharouak and K. Amine, Tailored Preparation Methods of TiO2 Anatase, Rutile, Brookite: mechanism of Formation and Electrochemical Properties, Chem. Mater., 2010, 22, 1173–1179 CrossRef CAS.
- L. Wu, C. Fu and W. Huang, Surface chemistry of TiO2 connecting thermal catalysis and photocatalysis, Phys. Chem. Chem. Phys., 2020, 22, 9875–9909 RSC.
- S. J. Smith, R. Stevens, S. Liu, G. Li, A. Navrotsky, J. Boerio-Goates and B. F. Woodfield, Heat capacities and thermodynamic functions of TiO2 anatase and rutile: analysis of phase stability, Am. Mineral., 2009, 94, 236–243 CrossRef CAS.
- A. L. Linsebigler, G. Lu and J. T. Yates, Photocatalysis on TiO2 Surfaces: principles, Mechanisms, and Selected Results, Chem. Rev., 1995, 95, 735–758 CrossRef CAS.
- S. Varnagiris, A. Medvids, M. Lelis, D. Milcius and A. Antuzevics, Black carbon-doped TiO2 films: synthesis, characterization and photocatalysis, J. Photochem. Photobiol., A, 2019, 382, 111941 CrossRef CAS.
- B. Li, X. Wang, M. Yan and L. Li, Preparation and characterization of nano-TiO2 powder, Mater. Chem. Phys., 2003, 78, 184–188 CrossRef.
- S. Mishra, P. Yogi, P. R. Sagdeo and R. Kumar, TiO2–Co3O4 Core–Shell Nanorods: bifunctional Role in Better Energy Storage and Electrochromism, ACS Appl. Energy Mater., 2018, 1, 790–798 CrossRef CAS.
- F. Wang, Z. Ma, P. Ban and X. Xu, C, N and S codoped rutile TiO2 nanorods for enhanced visible-light photocatalytic activity, Mater. Lett., 2017, 195, 143–146 CrossRef CAS.
- Z. Deng, J. Ji, M. Xing and J. Zhang, The role of oxygen defects in metal oxides for CO2 reduction, Nanoscale Adv., 2020, 2, 4986–4995 RSC.
- S. V. Kalinin and N. A. Spaldin, Functional Ion Defects in Transition Metal Oxides, Science, 2013, 341, 858–859 CrossRef CAS PubMed.
- S. Mochizuki, F. Fujishiro, A. Iino, K. Shibata and H. Yamamoto, Photo-induced defects of metal oxides: MgO and rutile TiO2, Phys. B, 2007, 401–402, 426–429 CrossRef CAS.
- T. Bak, J. Nowotny and M. K. Nowotny, Defect Disorder of Titanium Dioxide, J. Phys. Chem. B, 2006, 110, 21560–21567 CrossRef CAS PubMed.
- A. Tiwari, I. Mondal, S. Ghosh, N. Chattopadhyay and U. Pal, Fabrication of mixed phase TiO2 heterojunction nanorods and their enhanced photoactivities, Phys. Chem. Chem. Phys., 2016, 18, 15260–15268 RSC.
- S. P. Mulvaney and C. D. Keating, Raman Spectroscopy, Anal. Chem., 2000, 72, 145–158 CrossRef CAS PubMed.
- M. P. Chamberlain, C. Trallero-Giner and M. Cardona, Theory of one-phonon Raman scattering in semiconductor microcrystallites, Phys. Rev. B: Condens. Matter Mater. Phys., 1995, 51, 1680–1693 CrossRef CAS PubMed.
- C. V. Raman, A new radiation, Proc. - Indian Acad. Sci., Sect. A, 1953, 37, 333–341 CrossRef.
- C. V. Raman and K. S. Krishnan, A New Type of Secondary Radiation, Nature, 1928, 121, 501–502 CrossRef CAS.
- P. Yogi, S. K. Saxena, S. Mishra, H. M. Rai, R. Late, V. Kumar, B. Joshi, P. R. Sagdeo and R. Kumar, Interplay between phonon confinement and Fano effect on Raman line shape for semiconductor nanostructures: analytical study, Solid State Commun., 2016, 230, 25–29 CrossRef CAS.
- P. S. Narayanan, Raman spectrum of rutile (TiO2), Proc. - Indian Acad. Sci., Sect. A, 1950, 32, 279 CrossRef.
- S. S. Chan, I. E. Wachs, L. L. Murrell, L. Wang and W. K. Hall, In situ laser Raman spectroscopy of supported metal oxides, J. Phys. Chem., 1984, 88(24), 5831–5835 CrossRef CAS.
- S. P. S. Porto, P. A. Fleury and T. C. Damen, Raman Spectra of Ti${\mathrm{O}}_{2}$, Mg${\mathrm{F}}_{2}$, Zn${\mathrm{F}}_{2}$, Fe${\mathrm{F}}_{2}$, and Mn${\mathrm{F}}_{2}$, Phys. Rev., 1967, 154, 522–526 CrossRef CAS.
- V. Swamy, B. C. Muddle and Q. Dai, Size-dependent modifications of the Raman spectrum of rutile TiO2, Appl. Phys. Lett., 2006, 89, 163118 CrossRef.
- A. K. Shukla, R. Kumar and V. Kumar, Electronic Raman scattering in the laser-etched silicon nanostructures, J. Appl. Phys., 2010, 107, 014306 CrossRef.
- P. Yogi, M. Tanwar, S. K. Saxena, S. Mishra, D. K. Pathak, A. Chaudhary, P. R. Sagdeo and R. Kumar, Quantifying the Short-Range Order in Amorphous Silicon by Raman Scattering, Anal. Chem., 2018, 90, 8123–8129 CrossRef CAS PubMed.
- V. Kumar, S. K. Saxena, V. Kaushik, K. Saxena, A. K. Shukla and R. Kumar, Silicon nanowires prepared by metal induced etching (MIE): good field emitters, RSC Adv., 2014, 4, 57799–57803 RSC.
- J. Pascual, J. Camassel, P. Merle, B. Gil and H. Mathieu, Uniaxial-stress dependence of the first-order Raman spectrum of rutile-type crystals. III. Mg${\mathrm{F}}_{2}$, Phys. Rev. B: Condens. Matter Mater. Phys., 1981, 24, 2101–2108 CrossRef CAS.
- U. Balachandran and N. G. Eror, Raman spectra of titanium dioxide, J. Solid State Chem., 1982, 42, 276–282 CrossRef CAS.
- A. Nila and M. Baibarac, Stimulated Raman scattering and defect-based photoconductivity in mixtures of CdS/TiO2, J. Appl. Phys., 2020, 128, 225704 CrossRef CAS.
- T. R. Hart, R. L. Aggarwal and B. Lax, Temperature Dependence of Raman Scattering in Silicon, Phys. Rev. B: Solid State, 1970, 1, 638–642 CrossRef.
- M. Balkanski, R. F. Wallis and E. Haro, Anharmonic effects in light scattering due to optical phonons in silicon, Phys. Rev. B: Condens. Matter Mater. Phys., 1983, 28, 1928–1934 CrossRef CAS.
- W. F. Zhang, Y. L. He, M. S. Zhang, Z. Yin and Q. Chen, Raman scattering study on anatase TiO2nanocrystals, J. Phys. D: Appl. Phys., 2000, 33, 912–916 CrossRef CAS.
- T. Sekiya, S. Ohta, S. Kamei, M. Hanakawa and S. Kurita, Raman spectroscopy and phase transition of anatase TiO2 under high pressure, J. Phys. Chem. Solids, 2001, 62, 717–721 CrossRef CAS.
- K.-R. Zhu, M.-S. Zhang, Q. Chen and Z. Yin, Size and phonon-confinement effects on low-frequency Raman mode of anatase TiO2 nanocrystal, Phys. Lett. A, 2005, 340, 220–227 CrossRef CAS.
- T. Lan, X. Tang and B. Fultz, Phonon anharmonicity of rutile TiO2 studied by Raman spectrometry and molecular dynamics simulations, Phys. Rev. B: Condens. Matter Mater. Phys., 2012, 85, 094305 CrossRef.
- S. Sahoo, G. Ghorai, K. Ghosh, B. Das, M. K. Sikdar and P. K. Sahoo, Anharmonicity of optical phonon modes in copper doped rutile TiO2 nanorod composed microflowers, AIP Adv., 2021, 11, 105013 CrossRef.
- Z. Wang, S. K. Saxena, V. Pischedda, H. P. Liermann and C. S. Zha, X-ray diffraction study on pressure-induced phase transformations in nanocrystalline anatase/rutile (TiO2), J. Phys.: Condens. Matter, 2001, 13, 8317–8323 CrossRef CAS.
- C. M. Foster, R. P. Chiarello, H. L. M. Chang, H. You, T. J. Zhang, H. Frase, J. C. Parker and D. J. Lam, Raman scattering and X-ray diffractometry studies of epitaxial TiO2 and VO2 thin films and multilayers on α-Al2O3(1120), J. Appl. Phys., 1993, 73, 2841–2847 CrossRef CAS.
- T. Kawashima, H. Matsui and N. Tanabe, New transparent conductive films: FTO coated ITO, Thin Solid Films, 2003, 445, 241–244 CrossRef CAS.
- A. Sarkar and G. G. Khan, The formation and detection techniques of oxygen vacancies in titanium oxide-based nanostructures, Nanoscale, 2019, 11, 3414–3444 RSC.
- J. Yan, G. Wu, N. Guan, L. Li, Z. Li and X. Cao, Understanding the effect of surface/bulk defects on the photocatalytic activity of TiO2: anatase versus rutile, Phys. Chem. Chem. Phys., 2013, 15, 10978–10988 RSC.
- Y. Zhang, C. X. Harris, P. Wallenmeyer, J. Murowchick and X. Chen, Asymmetric Lattice Vibrational Characteristics of Rutile TiO2 as Revealed by Laser Power Dependent Raman Spectroscopy, J. Phys. Chem. C, 2013, 117, 24015–24022 CrossRef CAS.
- K. Ishioka and H. Petek, Raman generation of coherent phonons of anatase and rutile TiO${}_{2}$ photoexcited at fundamental absorption edges, Phys. Rev. B: Condens. Matter Mater. Phys., 2012, 86, 205201 CrossRef.
- T. Mazza, E. Barborini, P. Piseri, P. Milani, D. Cattaneo, A. Li Bassi, C. E. Bottani and C. Ducati, Raman spectroscopy characterization of $\mathrm{Ti}{\mathrm{O}}_{2}$ rutile nanocrystals, Phys. Rev. B: Condens. Matter Mater. Phys., 2007, 75, 045416 CrossRef.
- S. Challagulla, K. Tarafder, R. Ganesan and S. Roy, Structure sensitive photocatalytic reduction of nitroarenes over TiO2, Sci. Rep., 2017, 7, 8783 CrossRef PubMed.
- G. A. Samara and P. S. Peercy, Pressure and Temperature Dependence of the Static Dielectric Constants and Raman Spectra of Ti${\mathrm{O}}_{2}$ (Rutile), Phys. Rev. B: Solid State, 1973, 7, 1131–1148 CrossRef CAS.
- M. Sharma, S. Rani, D. K. Pathak, R. Bhatia, R. Kumar and I. Sameera, Manifestation of anharmonicities in terms of phonon modes’ energy and lifetime in multiwall carbon nanotubes, Carbon, 2021, 171, 568–574 CrossRef CAS.
- M. Sharma, S. Rani, D. K. Pathak, R. Bhatia, R. Kumar and I. Sameera, Temperature dependent Raman modes of reduced graphene oxide: effect of anharmonicity, crystallite size and defects, Carbon, 2021, 184, 437–444 CrossRef CAS.
Footnotes |
| † Electronic supplementary information (ESI) available. See DOI: 10.1039/d1ma00940k |
| ‡ Current address: Department of Chemical Engineering, University of Seoul, Seoul 02504, Republic of Korea. |
| This journal is © The Royal Society of Chemistry 2022 |