 Open Access Article
Optimization of the synthesis conditions of gold nanoparticle–polydimethylsiloxane composites for ultrasound generation†
Qing
Wang
 ,
Jia
Zhou
 *,
Xiaohan
Wu
 and
Antoine
Riaud
 *
*
State Key Laboratory of ASIC and System, School of Microelectronics, Fudan University, Shanghai 200433, China. E-mail: antoine_riaud@fudan.edu.cn; jia.zhou@fudan.edu.cn
First published on 9th February 2022
Abstract
Gold nanoparticle (AuNP)–polydimethylsiloxane (PDMS) composites are promising materials for photoacoustic (PA) generation owing to their high thermal dilatation coefficient, small thermal capacity and acoustic impedance close to that of water. Solvent choice during AuNP synthesis can dramatically enhance the optical absorption of the composite, but there is no unified picture on this parameter. Here we test the optical absorbance and photoacoustic amplitude of AuNP–PDMS composites synthesized in five common solvents (acetone, methanol, ethanol, isopropanol, and water). We find that photoacoustic signals from water and acetone yield small and sharp acoustic displacement peaks whereas those from alcohols yield larger step-like downward displacements (away from the conversion layer), which indicates a different Grüneisen parameter between the two groups. Furthermore, our experiments show that composites synthesized in isopropanol instead of ethanol showed a homogeneous surface and a nearly total optical absorption on a narrow bandwidth, and boosted the photoacoustic amplitude by up to 20%.
1 Introduction
Polydimethylsiloxane (PDMS)1–3 is a promising material for photoacoustic (PA) generation owing to its high thermal dilatation coefficient, small thermal capacity and acoustic impedance close to that of water. However, PDMS is a transparent material, which limits its performance as a photoacoustic conversion layer. The optical absorption of PDMS is often increased using either opaque materials (carbon nanotubes,4,5 graphene,6 carbon soot,7,8 carbon black,9,10 and carbon fiber11) or bandwidth specific materials (such as gold12,13 and silver nanoparticles14). These narrowband absorbers enable emission and reception of ultrasonic signals in an all-optical fashion,1 but are limited by a lower conversion coefficient than that of black materials, which in turn requires thicker absorbing layers that restrict the ultrasonic bandwidth.In 2007, Zhang et al.15 pioneered a top-down synthesis approach where a slab of cured PDMS is immersed in an aqueous solution of tetrachloroauric acid (TCA). The PDMS contains left-over silicon hydride Si–H groups that reduce TCA into nanoparticles. This yields a thin layer (∼2 μm) of nanoparticles embedded in a PDMS matrix. Switching the solvent from water to ethanol further improves the absorbance from 27%15 to 91%1 with a 30 MHz bandwidth, yielding a multimodal generation layer competitive with black materials.
The dramatic improvement obtained after switching solvents suggests that, beyond TCA16 and PDMS curing agent concentrations,15 the solvent plays a key role in composite absorbance. This is due to several factors:
First, the solvent alters the physical structure of PDMS by irreversible swelling.16–20 Second, from mass transfer considerations, (i) the solvent brings the AuCl4− anions inside the PDMS15 where they react with the Si–H groups, (ii) it extracts the curing agent from the PDMS17 and (iii) some solvents can swell PDMS which can increase the depth of the diffusion layer of AuNPs in the PDMS.21 Finally, from a reaction perspective, the right solvent choice can displace the formation reaction equilibrium by eliminating the reaction byproducts Cl− and H+:
In summary, the choice of solvent has a multidimensional effect on the synthesis of AuNP–PDMS composites, and it is unclear whether further adjusting the solvent would result in a better photoacoustic generation performance. In this study, we test seven common solvents (acetone, methanol, ethanol, isopropanol, water, dimethylformamide, and dimethyl sulfoxide) with a range of TCA concentrations (from 0.003 mol L−1 up to 0.018 mol L−1, that is 0.1% (m/v) up to 0.7% (m/v)). The composites are evaluated in terms of uniformity, absorbance and photoacoustic generation amplitude with a 520 nm pulsed laser diode. We then combine our data in a linear model to predict the absorbance depending on the TCA concentration, solvent polarity, solvent pKa, Hildebrand solubility parameter between the solvent and PDMS, and swelling coefficient:
 | (1) |
2 Materials and methods
2.1 Materials
A Sylgard® 184 elastomer kit including the base polymer and curing agent for PDMS fabrication was purchased from Dow Corning Inc., USA. TCA trihydrate (HAuCl4·3H2O, 99.9%) was purchased from Sigma-Aldrich, Shanghai, China. Methanol, ethanol, isopropanol acetone, dimethylformamide and dimethysulfoxide were provided by Sinopharm Chemical Reagent Co., Ltd. All other chemicals were obtained commercially and used without purification.2.2 Fabrication of PDMS and PDMS modification by AuNPs
AuNPs were prepared based on the method reported by SadAbadi et al.,22 where ethanol was replaced by other solvents. Briefly, PDMS substrates were firstly prepared by mixing the base and the curing agent at a weight ratio of 10![[thin space (1/6-em)]](https://www.rsc.org/images/entities/char_2009.gif) :
:![[thin space (1/6-em)]](https://www.rsc.org/images/entities/char_2009.gif) 1 with mechanical stirring. The mixture was homogenized in an ice-cooled ultrasonic bath for 30 min. To test various compositions and solvents, the mixture was split into several 800 μL samples that were poured into glass test tubes with 15 mm diameter and 5 mm height. The mixture was degassed in a vacuum chamber for 30 min. Finally, the samples were cured at 70 °C in an oven overnight. For future reference, the composites prepared in methanol will be referred as “methanol samples”, those in acetone as “acetone samples” and so on.
1 with mechanical stirring. The mixture was homogenized in an ice-cooled ultrasonic bath for 30 min. To test various compositions and solvents, the mixture was split into several 800 μL samples that were poured into glass test tubes with 15 mm diameter and 5 mm height. The mixture was degassed in a vacuum chamber for 30 min. Finally, the samples were cured at 70 °C in an oven overnight. For future reference, the composites prepared in methanol will be referred as “methanol samples”, those in acetone as “acetone samples” and so on.
Methanol, ethanol, acetone, and water samples were prepared using the same synthesis method. For each of the five solvents, we prepared a 0.018 mol L−1 stock solution of TCA. The solutions were then filtered with a 0.22 μm filter and diluted to 0.003, 0.008, 0.013, and 0.015 mol L−1, that is 0.1% (m/v) up to 0.7% (m/v). To prepare the diluted solutions, 300 μL of TCA solutions were poured into test tubes containing cured PDMS. To prevent evaporation, the bottles were then sealed by wrapping them with parafilm and capped using an oak stopper. After incubating for 48 h, the synthesized nanocomposites were taken out and rinsed with water and dried under nitrogen.
2.3 Characterization
The optical absorption of the samples was measured with a UV-vis spectrometer (TU-1810). The morphology and geometric structure of the nanocomposites were observed using an optical microscope (OM, BX53M, Olympus). A digital camera was used to take unmagnified images, compared with images obtained using OM with a 100× magnification. The optical absorption of the samples inserted into a solid sample holder was measured with a UV-vis spectrometer (TU-1810) as shown in the ESI,† Fig. S1. Au-free PDMS was used as a reference sample to calibrate the baseline.The photoacoustic vibrations of the solvent samples with 0.015 mol L−1 TCA concentration irradiated with a 129 ns pulse with 1.5 W peak power (attenuated to 0.3 W after the 10× objective) are measured with a home-made heterodyne Mach–Zehnder laser vibrometer23,24 as shown in Fig. S2 in the ESI.† At the low laser power used here, the PA generation is due to sudden thermal dilatation of the PA generation layer when irradiated by a pulsed laser beam, which generates a sudden pressure increase (thermoelastic regime) that propagates as an acoustic wave.
3 Results
3.1 Optical microscopy imaging of the PDMS composite surface
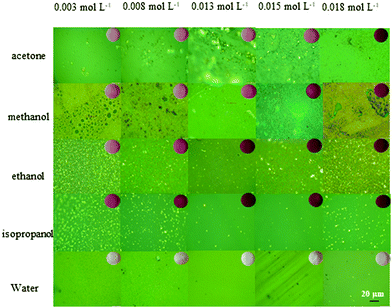
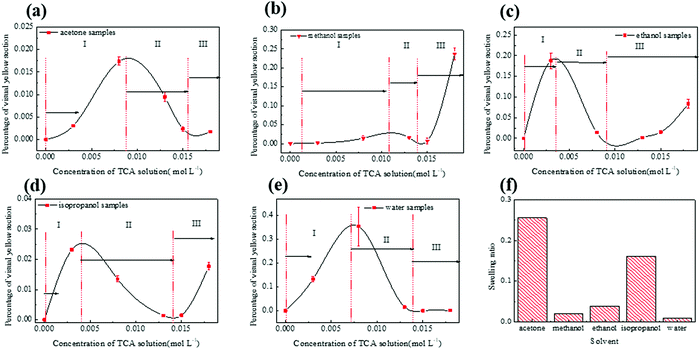
OM photographs of the solvent samples with various TCA concentrations are shown in Fig. 1, with unmagnified images being presented in the inset. For a given solvent, the purple-red color of the samples becomes darker with increasing TCA concentration. For a given TCA concentration, the color depth of the samples gradually increases in the order of water, acetone, methanol, ethanol, and isopropanol samples. Previous studies12 suggest that darker samples indicate that more TCA successfully form AuNPs.OM images show large yellow agglomerates in most samples, except the water sample. SEM energy dispersion spectra shown in Fig. S3 in the ESI,† and previous studies25,26 indicate that they are micrometric gold clusters. These large yellow particles are unlikely to yield an absorption peak at 532 nm and PA signals with a 520 nm laser and are therefore regarded as a side-product. To quantify the size and amount of Au microparticles on the surface of PDMS, we use Photoshop® to count the percentage of yellow in each sample photograph. The results are shown in Fig. 2. Interestingly, the amount of yellow particles depending on the TCA concentration follows a non-monotonic N-shaped curve (divided into 3 segments denoted I, II, and III) regardless of the solvent. Scarano et al., who reported a similar trend for water samples,16 offered a kinetic interpretation for this phenomenon. When TCA is scarce (segment I), gold particles are formed slowly which favors large microscopic aggregates whereas at higher TCA concentration (segment II) the gold reduction would proceed faster and yield nanoparticles, thus a dip in the percentage of yellow particles. Scarano et al. did not investigate larger concentrations, but indicated that using ethanol to deplete PDMS from silicon hydride groups and then adding more TCA yield large particles again. Therefore, when TCA concentration is further increased (in segment III), the increase in the percentage of yellow particles may be due to the exhaustion of the Si–H groups in PDMS (consumed to make AuNPs or dispersed in the solvent).
We then evaluated the size distribution of the microparticles on the sample surface. The particle size distributions of the existing composites (ethanol: 0.013 mol L−1![[thin space (1/6-em)]](https://www.rsc.org/images/entities/char_2009.gif) 1 and water: 0.013 mol L−1
1 and water: 0.013 mol L−1![[thin space (1/6-em)]](https://www.rsc.org/images/entities/char_2009.gif) 15) are compared with that of the best sample of this study (isopropanol: 0.015 mol L−1) in Fig. 3 (the other samples are available in Fig. S6 in the ESI†). While the ethanol samples have dozens of microparticles, the isopropanol and water samples have only submicrometric particles. Therefore, the isopropanol sample combines the high absorbance of ethanol samples with the excellent homogeneity of water samples, which is essential for micro-photoacoustic applications such as fiber-optic photoacoustic transducers or integration in microfluidic chips.
15) are compared with that of the best sample of this study (isopropanol: 0.015 mol L−1) in Fig. 3 (the other samples are available in Fig. S6 in the ESI†). While the ethanol samples have dozens of microparticles, the isopropanol and water samples have only submicrometric particles. Therefore, the isopropanol sample combines the high absorbance of ethanol samples with the excellent homogeneity of water samples, which is essential for micro-photoacoustic applications such as fiber-optic photoacoustic transducers or integration in microfluidic chips.
3.2 Optical absorbance
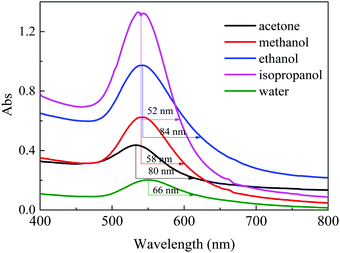
The relative absorption spectra of 0.015 mol L−1 TCA concentration samples are shown in Fig. 4. Maximum absorption peaks are at 540 ± 10 nm. Red-shifts are observed in the methanol and water samples at 2 nm and 10 nm, respectively. The absorbance increases from 20% (water) up to 95% (isopropanol). Half width at half maximum (HWHM) is measured and the isopropanol sample exhibits the narrowest absorbance peak. The absorbance of the samples using dimethyl formamide (DMF), dimethyl sulfoxide (DMSO) and a mixture of isopropanol and water (ESI,† Fig. S4) indicates that these solvent types may not be beneficial for optimizing synthesis.3.3 PA signal generation
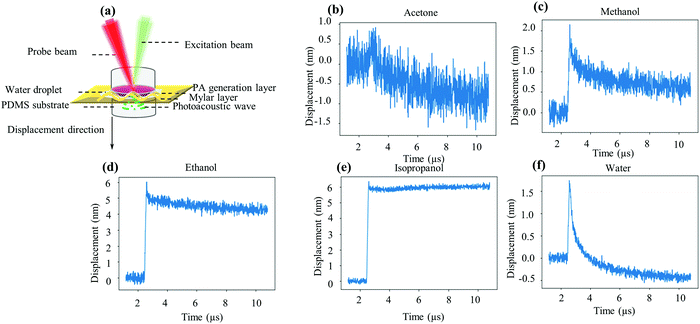
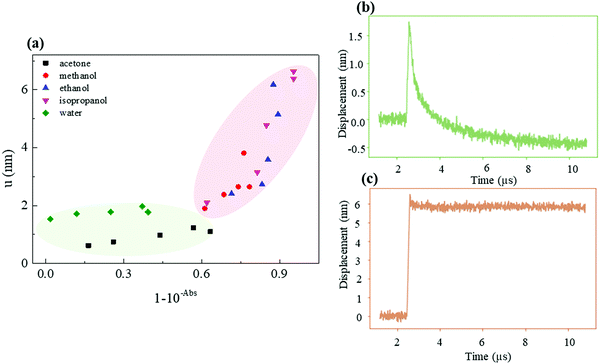
The PA signal of various solvent samples was measured using a confocal setup to guide the pulsed laser beam along the optical path of the LDV system. A 520 nm nanosecond pulse laser was used as the PA excitation source to maximize the optical absorption of the composite (540 nm) and the PA wave amplitude. The vibrometer works by measuring the Doppler shift of a red laser (633 nm) as it is reflected by the vibrating surface. The LDV red laser can travel with little attenuation through the composite (Fig. 4) and measures the vibrations of a reflective mylar foil placed afterwards. The photoacoustic generation from the mylar is negligible because it is placed behind the generation layer and therefore receives the laser pulse after it has been strongly attenuated by the generation layer. Furthermore, its reflection coefficient exceeds 90%,27 so that most of the energy is sent back towards the laser without contributing to heating and the thermoelastic effect. Finally, the manufacturer's data indicate that the thermal dilatation coefficient of mylar (a polyethylene terephthalate film) is 1.7 × 10⁻⁵ °C−1, 20 times lower than that of PDMS (3.0 × 10⁻⁴ °C−1). A detailed schematic diagram is shown in Fig. S2 in the ESI.†Fig. 5(a) shows the sandwich structure consisting of the AuNP–PDMS composite at the top, a thin reflective mylar foil in the middle and a transparent Au-free PDMS at the bottom.Although an acoustic wave is generated in the composite, it is measured on the mylar foil. The propagation between the composite and the foil is ensured by adding a drop of water as the coupling fluid to ensure a tight contact between them. The Au-free PDMS slab at the bottom is placed to avoid acoustic reflections. Fig. 5(b–e) display the surface displacement measured by our interferometer, which is positive when the mylar is moved away from the vibrometer by the thermal dilatation of the generation layer. We found that acetone and methanol samples were noisier than isopropanol, water and ethanol samples. The 6.4 nm jump height (PA amplitude) of the isopropanol sample is 3 times higher than that of the water sample (2.0 nm) and 20% higher than that of the ethanol sample (5.1 nm). The peak to peak PA amplitude increases in the order of acetone, water, methanol, ethanol, and isopropanol. Water and acetone, on the one hand, and alcohols (methanol, ethanol, isopropanol) on the other exhibit markedly different waveforms. While the former jump promptly back in place, the displacement of the alcohol samples remains large even long after the pulse. Careful examination of the methanol samples reveals the coexistence of two characteristic relaxation times, a short one (similar to water) and a long one, as for ethanol and isopropanol. At the time of writing this paper, we were still investigating the reasons for this difference. We also note that we saw no evidence of damage on any of the generation layers.
4 Discussion
Our experiments show that using isopropanol as the solvent yields homogeneous samples with enhanced light absorption and 20% superior photoacoustic amplitude at an equal laser power. In the following discussion, we first clarify whether the enhanced performance comes from the modification of the PDMS bulk (such as swelling) or from superior light absorption. We then interpret this optimal solvent choice using a linear model and propose a simple reaction mechanism to explain the enhancement.4.1 Cause of the enhancement
Theoretically, the PA displacement amplitude u is given by:1| u = Γμaφi, | (2) |
 by using the power conservation φi = φt + φabs + φr where the reflected power φr is negligible for the AuNP–PDMS composites.28 These yield μa ≈ 1 − 10−Abs and the theoretical relation:
| u ≈ Γφi(1 − 10−Abs), | (3) |
4.2 Effect of solvent characteristics on light absorption
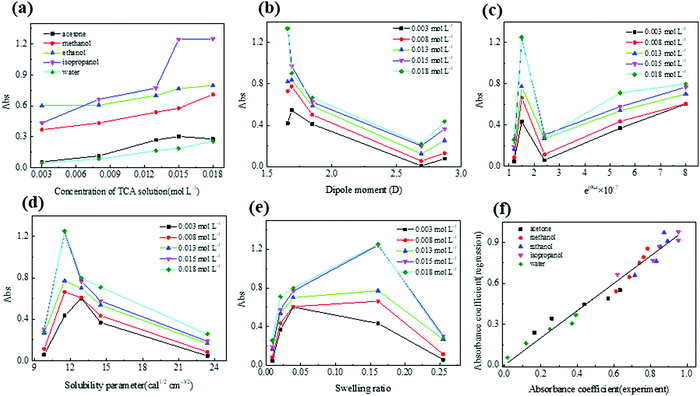
Since absorbance and PA amplitude are closely related, we now study the effect of solvent parameters on the absorbance, bearing in mind that a similar law can be obtained for the PA amplitude. The absorption responses to the various solvent parameters at a maximum wavelength of 540 nm are shown in Fig. 7(a–e). The studied parameters include TCA concentration, solvent dipole moment, pKa of each solvent, Hildebrand solubility parameter (reflects the molecular coherence of the solvent), and swelling value S, collated in Table 1. Fig. 7(a) shows the increase of optical absorption with increasing TCA concentration, indicating that more TCA molecules are reduced to form AuNPs. At higher concentrations, a slight drop of the optical absorption appears except in methanol and water samples. This result may be due to larger Au particles visible in the OM photographs which are not beneficial in improving absorbance at 540 nm. Fig. 7(b–e) show that no single factor in the solvent can explain the variations in absorber performance.| Solvents | S | dipole moment (D) | Solubility parameter (cal1/2 cm−3/2) | pKa |
|---|---|---|---|---|
| Acetone | 0.26 | 2.69 | 9.90 | 19.30 |
| Methanol | 0.02 | 2.87 | 14.50 | 15.50 |
| Ethanol | 0.04 | 1.69 | 12.90 | 15.90 |
| Isopropanol | 0.16 | 1.66 | 11.50 | 16.50 |
| Water | 0.01 | 1.85 | 23.4 | 14.00 |
However, a multilinear fit of these five factors shows a good fit with experimental results, as shown in Fig. 7(f). For this regression, the parameters are made dimensionless in comparison with water. The linear regression between PA amplitude and solvent properties is shown in Fig. S5 in the ESI,†with a good linear relationship.
The obtained linear regression coefficients are shown in Table 2 and Fig. 8(b), which suggest that more acidic solvents that have solubility similar to PDMS favor the formation of AuNPs, while swelling and solvent dipole moment are not related to the final absorption. The linear regression coefficients between PA amplitude and solvent properties are shown in Table S1 in the ESI.†
| Parameter | Normalized parameter | Regressed coefficient | |
|---|---|---|---|
a
C
Zhang = 0.013 mol L−1 is set as the standard concentration based on previous studies.
|
|||
| Swelling (S) |

|
θ S = −0.001 | |
| Dipole moment (q) |

|
θ q = −0.08 | |
| Hildebrand solubility parameter (h) |

|
θ h = −2.13 | |
| Acidity constant (pKa) |

|
θ pKa = −2.64 | |
| TCA concentration (C)a |

|
θ C = 0.26 | |
| Intercept (b) | b = −0.4 | ||
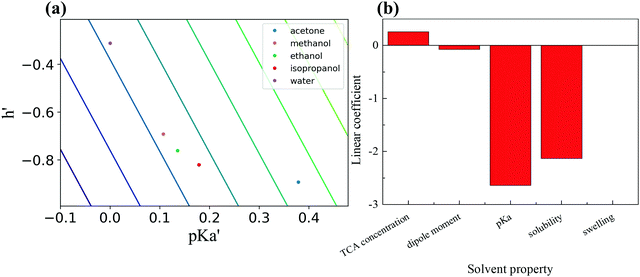 | ||
| Fig. 8 (a) Ranking of compounds based on two major coefficients. (b) Comparison of linear coefficients of five solvent properties. | ||
Furthermore, we can reproduce the absorption ranking using only two dominant factors, as shown in Fig. 8(a). The best material is in the lower-left corner. Each line represents theoretically equivalent materials. We get the ranking water < acetone < methanol < ethanol < isopropanol.
4.3 Postulated mechanism
The use of high Hilderbrand solubility was previously discussed (in terms of permeation rates in PDMS) by SadAbadi et al., who argued that higher solvent permeation rates in PDMS accelerate the synthesis of thin AuNP films. Since the film is formed essentially at the surface of PDMS, it is likely that more volatile solvents allow a faster extraction of the silicon hydride groups.17,22 Notwithstanding these solubility effects, we find that the pKa is the most important factor when comparing multiple solvents. While good bases would be able to accept H+ from the reaction, they do not eliminate Cl−. However, alcohols are well known to undergo nucleophilic substitution in acidic media:If such a reaction occurs, it would eliminate both products from the reaction, thereby displacing the reaction equilibrium and favoring the formation of AuNPs. This could explain why alcohols synthesize darker samples than water and acetone. However, the difference in the Grüneisen parameter is difficult to infer using chemistry and may require additional physical characterization studies.
5 Conclusions
The synthesis of AuNP–PDMS composites for ultrasound generation is a complex multiphase reaction where the solvent has been shown to play a prominent role. The solvent effect on AuNP–PDMS synthesis was experimentally studied by measuring the morphology, optical absorption and photoacoustic generation. In the case of water, ethanol and isopropanol, AuNPs were better dispersed on the surface of PDMS than in the case of methanol and acetone. Comparing the PA amplitude and optical absorption, we found that the enhanced performance of AuNP–PDMS composites prepared in isopropanol was at least in part due to a different Grüneisen parameter between alcohol samples versus the water and ketone ones. A simple linear model of optical absorption depending on the solvent dipole moment, swelling of PDMS, Hilderbrand solubility and pKa then revealed that solubility and pKa are the dominant factors that determine the final optical absorption. Furthermore, these two parameters alone reproduce the ranking water < acetone < methanol < ethanol < isopropanol. Finally, we postulate that alcoholic solvents promote the formation of AuNPs by consuming the H+ and Cl− side products through a nucleophilic substitution reaction. Our research demonstrates that the solvent choice is a key factor in the synthesis of nanoparticles on PDMS, and unveils that using isopropanol as a solvent instead of ethanol offers a 20% boost in photoacoustic amplitude.Abbreviations
| Au | gold |
| AuNPs | gold nanoparticles |
| PDMS | polydimethylsiloxane |
| TCA | tetrachloroauric acid |
| PA | photoacoustic |
| S | swelling |
| LDV | heterodyne Mach–Zehnder Laser Doppler Vibrometer. |
Author contributions
Antoine Riaud and Jia Zhou proposed the study. Qing Wang carried out experiments and characterization studies, and prepared the figures for the manuscript. Antoine Riaud and Qing Wang analyzed the data together. Xiaohan Wu provided instruments and guidance for the spectroscopy and absorbance measurements. All the authors wrote the manuscript together.Conflicts of interest
The authors declare no competing financial interest.Acknowledgements
This work was supported by the National Natural Science Foundation of China (Grant No. 12004078 and 61874033) and the State Key Lab of ASIC and System, Fudan University with Grant No. 2021MS001 and 2021MS002. The LDV DATA analysis interface was provided by Miss Ting Xu from Fudan University.References
- S. Noimark, R. J. Colchester, R. K. Poduval, E. Maneas, E. J. Alles, T. R. Zhao, E. Z. Zhang, M. Ashworth, E. Tsolaki, A. H. Chester, N. Latif, S. Bertazzo, A. L. David, S. Ourselin, P. C. Beard, I. P. Parkin, I. Papakonstantinou and A. E. Desjardins, Polydimethylsiloxane Composites for Optical Ultrasound Generation and Multimodality Imaging, Adv. Funct. Mater., 2018, 28, 9 Search PubMed.
- T. Lee, H. W. Baac, Q. Li and L. J. Guo, Efficient Photoacoustic Conversion in Optical Nanomaterials and Composites, Adv. Opt. Mater., 2018, 6(24), 1800491.1 Search PubMed.
- H. W. Baac, J. G. Ok, J. P. Hui, T. Ling, S. L. Chen, A. J. Hart and L. J. Guo, Carbon nanotube composite optoacoustic transmitters for strong and high frequency ultrasound generation, Appl. Phys. Lett., 2010, 97(23), 234104 CrossRef PubMed.
- H. W. Baac, J. Ok and T. Lee, Nano-structural characteristics of carbon nanotube-polymer composite films for high-amplitude optoacoustic generation, Nanoscale, 2015, 7(34), 14460–14468 RSC.
- H. W. Baac, J. G. Ok, A. Maxwell, K. T. Lee, Y. C. Chen, A. J. Hart, Z. Xu, E. Yoon and L. J. Guo, Carbon-Nanotube Optoacoustic Lens for Focused Ultrasound Generation and High-Precision Targeted Therapy, Sci. Rep., 2012, 2, 989 CrossRef PubMed.
- S. Hwan Lee, M. A. Park, J. J. Yoh, H. Song, E. Y. Jang, Y. Hyup Kim, S. Kang and Y. J. Seop Yoon, Reduced graphene oxide coated thin aluminum film as an optoacoustic transmitter for high pressure and high frequency ultrasound generation, Appl. Phys. Lett., 2012, 101(24), 1–4 CrossRef.
- X. Deng, L. Mammen, H. J. Butt and D. J. Vollmer, Candle Soot as a Template for a Transparent Robust Superamphiphobic Coating, Science, 2012, 335(6064), 67–70 CrossRef CAS PubMed.
- W. Y. Chang, W. Huang, J. Kim, S. Li and X. J. Jiang, Candle soot nanoparticles-polydimethylsiloxane composites for laser ultrasound transducers, Appl. Phys. Lett., 2015, 107(16), 1713 CrossRef.
- T. Buma, M. Spisar and M. J. O’Donnell, High-frequency ultrasound array element using thermoelastic expansion in an elastomeric film, Appl. Phys. Lett., 2001, 79(4), 548–550 CrossRef CAS.
- H. Nomada, K. Morita, H. Higuchi, H. Yoshioka and Y. J. Oki, Carbon–polydimethylsiloxane-based integratable optical technology for spectroscopic analysis, Talanta, 2017, 428–432 CrossRef CAS PubMed.
- B. Y. Hsieh, J. Kim, J. Zhu, S. Li, X. Zhang and X. J. Jiang, A laser ultrasound transducer using carbon nanofibers–polydimethylsiloxane composite thin film, Appl. Phys. Lett., 2015, 106(2), 8 CrossRef.
- N. Wu, Y. Tian, X. Zou, V. Silva, A. Chery and X. J. Wang, High-efficiency optical ultrasound generation using one-pot synthesized polydimethylsiloxane-gold nanoparticle nanocomposite, J. Opt. Soc. Am. B, 2012, 29(8), 2016–2020 CrossRef CAS.
- X. Zou, N. Wu, Y. Tian and X. J. Wang, Broadband miniature fiber optic ultrasound generator, Opt. Express, 2014, 22(15), 18119–18127 CrossRef PubMed.
- H. Zhao, W. Hasi, L. Bao, Y. Liu, S. Han and D. J. Lin, A silver self-assembled monolayer-decorated polydimethylsiloxane flexible substrate for in situ SERS detection of low-abundance molecules, J. Raman Spectrosc., 2018, 49(9), 1469–1477 CrossRef CAS.
- Q. Zhang, J. J. Xu, Y. Liu and H. Y. Chen, In-situ synthesis of poly(dimethylsiloxane)–gold nanoparticles composite films and its application in microfluidic systems, Lab Chip, 2008, 8(2), 352–357 RSC.
- S. Scarano, C. Berlangieri, E. Carretti, L. Dei and M. Minunni, Tunable growth of gold nanostructures ata PDMS surface to obtain plasmon rulers with enhanced optical features, Microchim. Acta, 2017, 184(19), 3093–3102 CrossRef CAS.
- J. N. Lee, C. Park and G. M. Whitesides, Solvent Compatibility of Poly(Dimethylsiloxane)-Based Microfluidic Devices, Anal. Chem., 2004, 75(23), 6544–6554 CrossRef PubMed.
- C. V. Rumens, M. A. Ziai, K. E. Belsey, J. C. Batchelor and S. J. Holder, Swelling of PDMS networks in solvent vapours; applications for passive RFID wireless sensors, J. Mater. Chem. C, 2015, 3(39), 10091–10098 RSC.
- M. M. Kim, Y. Huang, K. Choi and C. H. Hidrovo, The improved resistance of PDMS to pressure-induced deformation and chemical solvent swelling for microfluidic devices, Microelectron. Eng., 2014, 124, 66–75 CrossRef CAS.
- B. Y. Kim, L. Y. Hong, Y. M. Chung, D. P. Kim and C. S. Lee, Solvent-Resistant PDMS Microfluidic Devices with Hybrid Inorganic/Organic Polymer Coatings, Adv. Funct. Mater., 2010, 19(23), 3796–3803 CrossRef.
- J. R. Dunklin, G. T. Forcherio and K. R. Berry, Asymmetric Reduction of Gold Nanoparticles into Thermoplasmonic Polydimethylsiloxane Thin Films, ACS Appl. Mater. Interfaces, 2013, 5(17), 8457–8466 CrossRef CAS PubMed.
- H. SadAbadi, S. Badilescu, M. Packirisamy and R. Wüthrich, PDMS-Gold Nanocomposite Platforms with Enhanced Sensing Properties, J. Biomed. Nanotechnol., 2012, 8(4), 539–549 CrossRef CAS PubMed.
- D. Royer, E. Dieulesaint and Y. Martin, In Improved Version of a Polarized Beam Heterodyne Interferometer, IEEE 1985 Ultrasonics Symposium, 1985.
- D. Royer and E. Dieulesaint, In Optical Detection of Sub-Angstrom Transient Mechanical Displacements, IEEE 1986 Ultrasonics Symposium, 1986.
- J. Song, D. Kim and D. Lee, Colloids, Size control in the synthesis of 1-6 nm gold nanoparticles via solvent-controlled nucleation, Langmuir, 2011, 27(22), 13854–13860 CrossRef CAS PubMed.
- M. H. Hussain, N. Bakar, A. N. Mustapa, K. F. Low and F. Adam, Synthesis of Various Size Gold Nanoparticles by Chemical Reduction Method with Different Solvent Polarity, Nanoscale Res. Lett., 2020, 15, 1 CrossRef CAS PubMed.
- R. Levinson, S. Chen, J. Slack, H. Goudey, T. Harima and P. Berdahl, Design, characterization, and fabrication of solar-retroreflective cool-wall materials, Sol. Energy Mater. Sol. Cells, 2020, 206, 110117 CrossRef CAS.
- J. R. Dunklin, G. T. Forcherio, K. R. Berry and D. K. J. A. M. Roper, Interfaces, Asymmetric Reduction of Gold Nanoparticles into Thermoplasmonic Polydimethylsiloxane Thin Films, ACS Appl. Mater. Interfaces, 2013, 5(17), 8457–8466 CrossRef CAS PubMed.
Footnote |
| † Electronic supplementary information (ESI) available: Schematic diagram of the PA generation experimental set-up, linear regression results of amplitude and solvent properties, and size distribution diagrams for 25 solvent samples. See DOI: 10.1039/d1ma00674f |
| This journal is © The Royal Society of Chemistry 2022 |


