DOI:
10.1039/D1MA00583A
(Paper)
Mater. Adv., 2022,
3, 399-408
Acenaphthene-triphenylamine (acceptor–donor) based luminophores for organic light emitting diodes: combined experimental and theoretical study†
Received
6th July 2021
, Accepted 20th October 2021
First published on 20th October 2021
Abstract
In this work, a series of acenaphthene derivatives (AC-derivatives) were designed and synthesized by incorporating imidazole as an electron deficient moiety and triphenylamine (TPA) as an electron rich moiety with different functional groups at the N1 position of imidazole. All the dyes were structurally characterized by spectroscopic methods (1H NMR, 13C NMR, IR, and Mass) and some of the dyes were characterized by single crystal X-ray diffraction. The detailed thermal, photophysical and electrochemical properties were systematically investigated. All the dyes showed good thermal stability with high thermal decomposition (Td) temperatures ranging from 400 to 430 °C. All the dyes had similar absorption behaviour, with peak wavelengths at 240 nm and 350 nm assigned to the π → π* transitions of the aromatic segments. All the dyes exhibited a broad bluish-white to yellowish-orange emission with the emission maximum in the range of 520–600 nm. Electrochemical analysis was performed to discover the HOMO and LUMO energy levels of the dyes, which were verified using DFT calculations. Theoretical investigations, such as optimization, singlet–triplet and HOMO and LUMO energy levels calculations, were calculated using DFT and TD-DFT analysis. The excited singlet–triplet energy gaps of the dyes were estimated and correlated to the structural and energetic characteristics of the known host materials. In addition, examinations were carried out to find the optical, electronic, charge transport and stability properties of dyes for use as emissive and charge transport materials in organic light emitting devices (OLEDs). All the dyes are good emissive materials with their hole transporting nature more favourable than the electron transporting nature. The theoretical investigations clearly indicate that AC-mCF3 has more potential as an emitter for OLED applications.
Introduction
Organic light emitting diodes (OLEDs) are a strong competitor for the next generation of solid-state lightening and display technology.1–5 OLEDs have the advantages of low power consumption, fast response, high flexibility and full color (brighter and high resolution). In the development of OLED technology, the emitter of the emissive layer (EML) plays a very important role in OLED devices.6–13 Generally, to produce white OLEDs (WOLEDs), one must simultaneously involve the three primary colors, red, green and blue (RGB), or two complementary colors, such as blue with yellow or orange (B,Y/O), in the emissive layer.14–20 Specifically, to qualify as WOLEDs, a color rendering index (CRI) of over 80 is required for suitably bright sources. To boost CRI, several research groups have developed WOLEDs by applying a blue or yellow fluorophore along with green, red, yellow and orange emitters/phosphors.21–24 Wu et al. fabricated a multi-layer device with blue emissive fluorophores (2-methyl-9,10-di(2-naphthyl) anthracene (MADN)), a p-bis(p-N,N-di-phenyl-aminostyryl)benzene (DSA-Ph)) layer and a complementary yellow emissive fluorophore (2,8-di(t-butyl)-5,11-di[4-(t-butyl)phenyl]-6,12-diphenylnaphthacene (TBRb)) layer to get WOLED.21 The device achieved efficiencies of 9.75 cd A−1 (luminance yield), 3.90 lm W−1 (power efficiency) and 4.36% (EQE), with Commission Internationale del’Eclairage (CIE) color coordinates of (0.31, 0.40). Schwartz et al. fabricated a WOLED using N,N′-di-1-naphthalenyl-N,N′-diphenyl-[1,1′:4′,1′′:4′′,1′′′-quaterphenyl]-4,4′′′-diamine (4P-NPD) as a blue fluorophore and fac-tris(2-phenylpyridine) iridium (Ir(ppy)3) as a green phosphor, iridium(III) bis(2-methyldibenzo-[f,h]quinoxaline)(acetylacetonate) (Ir(MDQ)2(acac)) as an orange phosphor.23 The fabricated WOLED showed a power efficiency of 37.5 lm W−1 at 1000 cd m−2, an external quantum efficiency (EQE1000) of 16.1% and a CRI of 86. Kondakova et al. reported WOLEDs with a maximum power efficiency (ηp,1000) of 30 lm W−1 and a 13.6% EQE by employing fac-bis(2-phenylpyridine)(2-pyridylcoumarin)iridium(III) [Ir(ppy)2pc] as a yellow phosphor and difluoro[6-mesityl-N-(2-(1H)-quinolinylidene-κN)-(6-mesityl-2-quinolinaminato-κN1)]boron (MQAB) as a blue fluorophore.25 WOLEDs using blue fluorescent and orange-red thermally-activated delayed fluorescent dendritic luminogens achieved a maximum EQE of 8.32% and CIE coordinates of (0.32, 0.30).26 Recently, our group reported solution-processed white OLED devices fabricated by optimizing the orange-red emitter Ir(2-phq)3 with a deep blue emitter that achieved an EQE of 7% and CIE coordinates of (0.33, 0.32).27 In 2018, the high performance deep blue emitter TPE-TAPBI with high maximum current, power, and external quantum efficiencies of 7.21 cd A−1, 6.78 lm W−1, and 5.73%, respectively, was developed. Moreover, efficient two-color hybrid warm white OLEDs (CIEx,y = 0.457, 0.470) were achieved using TPE-TAPBI neat film as the blue-emitting component and provide total current, power, and external quantum efficiencies of up to 70.5 lm W−1, 76.0 cd A−1, and 28% at 1000 cd m−2, respectively.28 C–C Huang et al. developed the deep-blue emitter BCz–BFPz and a device based on the emitter exhibited deep-blue emission with a maximum EQE of 4.34% and CIE coordinates of (0.15, 0.05). Cool-white OLEDs were also fabricated and the device shows an EQE of 9% and CIE coordinates of (0.34, 0.33).29 Wand et al. fabricated a multi-layer white OLED device with an orange TADF emitter 2,3,5,6-tetrakis(3,6-diphenylcarbazol-9-yl)-1,4-dicyanobenzene (4CzTPN-Ph) layer, bis[2-(4,6-difluorophenyl)pyridinato-C2,N](picolinato)iridium(III) (FIrpic) as a blue phosphorescence emitter and bipolar bis-4-(N-carbazolyl)phenyl)phenylphosphine oxide (BCPO) as host and exciton blocker materials. White device shows a brightness of 36460 cd m−2 and a maximum EQE (external quantum efficiency) of 18.52%, CE (current efficiency) of 43.67 cd A−1, and PE (power efficiency) of 45.73 lm W−1, respectively.30 Recently, The non-doped OLED based on the benzimidazole derivative DPAC-TAn-BI with stable deep-blue light (CIEx,y = 0.15, 0.15) and excellent EL efficiencies (6.48 cd A−1, 6.78 lm W−1, and 5.81%). A device DPAC-TAn-BI based high performance two-color hybrid WOLEDs are fabricated based on and Ir(tptpy)2acac. The devices radiate physiologically friendly warm white light (CIEx,y = 0.46, 0.48) with outstanding EL efficiencies (87.8 lm W−1 and 27.6%) and a small efficiency roll-off (2.9% at 1000 cd m−2).31 However, the multi-layer devices have some disadvantages, such as high driving voltage, self-absorption, light scattering across layer junction, etc.32 In most of the WOLED, researchers have used transition metal complexes (Ir(ppy)3, Ir(MDQ)2(acac), and Ir(ppy)2pc, etc.), these materials are costly, hence the manufacturing cost of the WOLED is also more.33 Small molecule WOLED devices with stable chromaticity and high efficiency are still in demand. A large number of efficient red,34–41 green42–48 and blue49–55 materials have been reported in recent years, however, orange56–58 and yellow59,60 emitters are less explored even though these materials have a role to produce WOLEDs. In the present work, we have designed and synthesized a series of AC-derivatives by incorporating acenaphthene-imidazole as electron-transporting moiety and TPA as hole-transporting moiety with different luminophores at N1 position of imidazole (AC-Ph, AC-PT, AC-Fl, AC-mCF3 and AC-pCF3). All the dyes were structurally characterized by spectroscopic methods (1H, 13C NMR, IR, and Mass) and some of the dyes are characterized by single crystal X-ray diffraction. A detailed thermal, photophysical, electrochemical and electroluminescence properties were systematically investigated. All the dyes were showed a broad bluish-white to yellowish-orange emission with the emission maximum in the range of 520–600 nm. Theoretical calculations (DFT and TD-DFT) were also performed to get a better understanding of the electronic structures and the exact positions of the excited singlet and triplet energy levels of the dyes. The energy gap (Eg) between the HOMO and LUMO levels were also calculated from both theoretical data and experimental values. These acenaphthene derivatives shown good thermal stability as well as a balanced charge transporting properties.
Experimental section
General information for synthesis
All the reactions were performed under nitrogen atmosphere. Solvents were carefully dried and distilled from appropriate drying agents prior to use. Commercially available reagents (Sigma Aldrich and alfa Aesar) were used without further purification unless otherwise stated. All the reactions were monitored by thin-layer chromatography (TLC) with silica gel 60 F254 Aluminium plates (Merck). Column chromatography was carried out using silica gel (Sigma-Aldrich).
Measurements
1H, 13C and 19F NMR spectra were recorded using an AV 400 Avance-III 400 MHz FT-NMR Spectrometer (Bruker Biospin International, Switzerland) with tetramethylsilane (TMS) as a standard reference. The mass spectra were recorded by LC-MS (PerkinElmer, USA/Flexer SQ 300 M). The FTIR spectra were recorded on a PerkinElmer RX-I FTIR spectrophotometer. The thermal properties of the dyes were collected on a thermogravimetric analyser (TGA) under a nitrogen atmosphere at a heating rate of 10 °C min−1. The absorption spectrum of the target dyes in solution phase and solid (DRS) were measured by using UV-visible spectrometer (Shimadzu Corporation, Japan/UV-2450 PerkinElmer, USA/Lamda 25). The photoluminescence excitation and emission spectra were recorded by Horiba Jobin Yvon, USA/Fluoromax 4P spectrophotometer. The absolute quantum yields were determined by using Edinburgh Instruments, spectrofluorometer, FS5, Integrating Sphere SC-30. The CIE color coordinates were calculated by using PL emission data (MATLAB software). The electrochemical properties of the dyes were measured by using cyclic voltammetry (CV), AUTOLAB 302N Modular potentiostat, at RT in dimethylformamide (DMF). The working (glass-carbon rod), auxiliary (counter, Pt wire), and reference (Ag/AgCl wire) electrodes were used for CV analysis. The DMF which contains 0.1 M Bu4NClO4 was used as the supporting electrolyte, and the scan rate was maintained as 100 mV s−1. The optimize structures and HOMO–LUMO energy levels of the dyes were calculated by using DFT calculation with B3LYP/6-31G(d,p) basis set (Gaussian Software).61 After conforming the ground state (S0) geometry of the dyes, we were vertically excited the dyes to get the first excited state (S1) using time-dependent density functional theory (TD-DFT).62,63
Synthesis and characterization
The TPA-CHO and Flu-NH2 intermediates were synthesized according to the literature.64,65 The targeted dyes were synthesized by condensation between acenaphthenequinone, amine derivatives and TPA-CHO intermediate in the presence of ammonium acetate and acetic acid.66–68 The synthetic strategy to obtain the targeted dyes is illustrated in Scheme 1. The synthesized dyes are characterized by nuclear magnetic resonance spectroscopy (1H, 13C and 19F NMR), Mass spectrometry and Fourier transform infrared spectroscopy (FTIR).
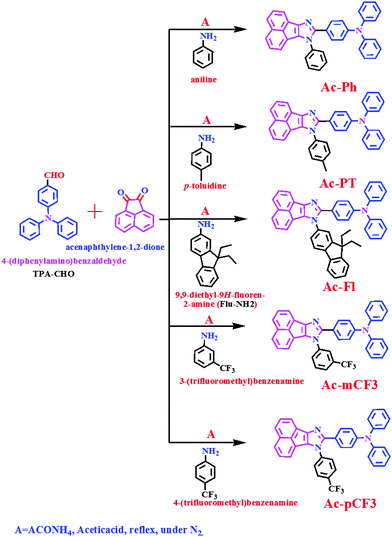 |
| | Scheme 1 Synthetic routes for the AC-derivatives. | |
General procedure for the synthesis of the AC-derivatives
Amine (0.40 g, 1.2 eq) was added to a stirred solution of TPA-CHO (1g, 1 eq) in glacial acetic acid (30 mL) at room temperature (RT). To this reaction mixture, subsequently ammonium acetate (2.82 g, 10 eq) and acenaphthenequinone (0.80 g, 1.2 eq) were added. The resulting mixture was stirred for 12 h at 110 °C. The reaction was monitored by thin layer chromatography for the completion of the reaction. After cooling, the reaction mixture was poured into minimum amount of cold distilled water and then ammonium hydroxide solution was added. The formed solid was filtered and dissolved in dichloromethane (DCM). This was followed by drying with anhydrous sodium sulphate and the solvent was evaporated to get crude compound. The resultant crude compound was purified with column chromatography by using silica gel (100–200 mesh) and eluent a mixture of ethyl acetate: petroleum ether (3![[thin space (1/6-em)]](https://www.rsc.org/images/entities/char_2009.gif) :
:![[thin space (1/6-em)]](https://www.rsc.org/images/entities/char_2009.gif) 7; v/v) to give a yellow or yellowish-orange solid.
7; v/v) to give a yellow or yellowish-orange solid.
N-Phenyl-N-(4-(7-phenyl-7H-acenaphtho[1,2-d]imidazol-8-yl)phenyl)benzenamine (AC-Ph).
Yield: (41%) a bright yellowish-orange solid. 1H-NMR (400 MHz, CDCl3, TMS, δ ppm) 7.95 (d, J = 7.2 Hz, 1H), 7.72–7.67 (m, 2H), 7.58–7.51 (m, 6H). 7.38–7.34 (m, 3H), 7.29–7.25 (m, 4H), 7.20–7.17 (m, 1H), 7.11 (d, J = 7.6 Hz, 4H), 7.06 (t, J = 7.6 Hz, 2H). 6.96 (d, J = 8.8 Hz, 2H). 13C-NMR (100 MHz, CDCl3, TMS, δ ppm) 147.82, 147.66, 147.13, 138.03, 131.49, 131.21, 130.52, 129.74, 129.62, 129.44, 129.30, 129.21, 129.12, 128.57, 127.73, 126.98, 126.81, 126.73, 126.37, 126.21, 126.06, 125.01, 125.84, 123.71, 123.29, 121.96, 120.58, 119.22, 118.46. IR (KBr, ν/cm−1): 1595, 1496, 1416, 1336, 1266, 816, 766, 696. EI-MS: m/z = 512.32 [M + H]+.
N-Phenyl-N-(4-(7-p-tolyl-7H-acenaphtho[1,2-d]imidazol-8-yl)phenyl)benzenamine (AC-PT).
Yield: (53%) a bright yellowish-orange solid. 1H-NMR (400 MHz, CDCl3, TMS, δ ppm) 7.94 (d, J = 7.2 Hz, 1H), 7.65 (t, J = 8.4 Hz, 2H), 7.57 (t, J = 6.8 Hz, 1H). 7.43–7.33 (m, 6H), 7.29–7.25 (m, 5H), 7.18 (d, J = 6.8 Hz, 1H), 7.11 (d, J = 7.6 Hz, 4H), 7.06 (t, J = 7.2 Hz, 2H). 6.97 (d, J = 7.2 Hz, 2H), 2.49 (s, 3H). 13C-NMR (100 MHz, CDCl3, TMS, δ ppm) 150.32, 147.73, 147.49, 147.17, 138.60, 135.41, 131.51, 130.58, 130.34, 129.36, 129.28, 129.20, 129.05, 127.71, 127.05, 126.79, 126.65, 126.30, 125.79, 125.25, 124.82, 123.86, 123.23, 122.01, 120.52, 118.45, 21.20. IR (KBr, ν/cm−1): 1595, 1488, 1420, 1324, 1274, 1180, 825, 755, 695. EI-MS: m/z = 526.33 [M + H]+.
N-(4-(7-(9,9-Diethyl-9H-fluoren-2-yl)-7H-acenaphtho[1,2-d]imidazol-8-yl)phenyl)-N-phenylbenzenamine (AC-Fl).
Yield: (60%) a bright yellow solid. 1H-NMR (400 MHz, CDCl3, TMS, δ ppm) 7.97 (d, J = 6.8 Hz, 1H), 7.90 (d, J = 8.0 Hz, 1H), 7.80 (d, J = 2.8 Hz, 1H), 7.72 (t, J = 8.4 Hz, 2H), 7.65 (d, J = 7.6 Hz, 1H), 7.59 (t, J = 6.8 Hz, 1H), 7.46–7.34 (m, 7H), 7.28–7.22 (m, 6H). 7.08 (d, J = 7.6 Hz 3H), 7.03 (t, J = 7.6 Hz 2H), 6.95 (d, J = 8.8 Hz 2H), 2.09–1.95 (m, 4H), 0.34 (t, 6H). 13C-NMR (100 MHz, CDCl3, TMS, δ ppm) 151.67, 150.44, 149.95, 147.78, 147.19, 141.91, 140.16, 138.15, 136.66, 131.57, 130.65, 129.35, 129.24, 129.17, 127.74, 127.21, 127.10, 126.82, 126.67, 126.33, 124.63, 124.10, 123.17, 122.90, 122.39, 121.00, 120.55, 119.96, 118.36, 56.43, 32.54, 8.39. IR (KBr, ν/cm−1): 2894, 1595, 1488, 1418, 1318, 1278, 838, 749, 699. EI-MS: m/z = 656.55 [M + H]+.
N-(4-(7-(3-(Trifluoromethyl)phenyl)-7H-acenaphtho[1,2-d]imidazol-8-yl)phenyl)-N-phenylbenzenamine (AC-mCF3).
Yield: (59%) a bright yellowish-orange solid. 1H-NMR (400 MHz, CDCl3, TMS, δ ppm) 7.96 (d, J = 7.2 Hz, 1H), 7.8–7.71 (m, 6H), 7.6–7.5 (m, 1H). 7.41 (t, 1H), 7.32–7.26 (m, 6H), 7.22 (d, 2H), 7.11 (d, J = 7.6 Hz, 4H), 7.06 (t, J = 7.6 Hz, 2H). 6.96 (d, J = 8.8 Hz, 2H). 13C-NMR (100 MHz, CDCl3, TMS, δ ppm) 148.29, 148.15, 147.06, 138.57, 137.29, 134.52, 131.72, 131.32, 130.38, 130.20, 129.44, 129.37, 129.25, 129.08, 127.81, 127.06, 126.86, 126.67, 126.63, 125.04, 124.82, 123.40, 123.04, 122.97, 122.18, 120.87, 118.42, 30.38. 19F-NMR (400 MHz, CDCl3, TMS, δ ppm) −62.51 (s, 3F). IR (KBr, ν/cm−1): 1592, 1492, 1333, 1273, 1163, 1130, 1073, 813, 773, 703. EI-MS: m/z = 580.39 [M + H]+.
N-(4-(7-(4-(Trifluoromethyl)phenyl)-7H-acenaphtho[1,2-d]imidazol-8-yl)phenyl)-N-phenylbenzenamine (AC-pCF3).
Yield: (46%) a bright yellowish-orange solid. 1H-NMR (400 MHz, CDCl3, TMS, δ ppm) 7.95 (d, J = 7.2 Hz, 1H), 7.72–7.68 (m, 2H), 7.59–7.55 (m, 5H). 7.39–7.34 (m, 3H), 7.29–7.25 (m, 4H), 7.19–7.17 (m, 1H), 7.11 (d, J = 7.6 Hz, 4H), 7.06 (t, J = 7.6 Hz, 2H). 6.96 (d, J = 8.8 Hz, 2H). 13C-NMR (100 MHz, CDCl3, TMS, δ ppm) 147.83, 147.16, 138.10, 129.71, 129.19, 129.13, 128.54, 127.71, 127.03, 126.78, 126.69, 126.34, 126.09, 124.81, 123.83, 123.26, 122.01, 120.54, 118.41, 29.19. 19F-NMR (400 MHz, CDCl3, TMS, δ ppm) −62.39 (s, 3F). IR (KBr, ν/cm−1): 1595, 1486, 1416, 1326, 1276, 1166, 1132, 1066, 836, 766, 696. EI-MS: m/z = 580.39 [M + H]+.
Results and discussion
Fourier transform infrared (FTIR) spectroscopy
The FTIR spectrum of all the dyes were measured from 500–4000 cm−1 and the Fourier transform infrared spectra of all the dyes shown Fig. S18 (ESI†). The peak approximately 1595 cm−1 in all the dyes corresponds to the C![[double bond, length as m-dash]](https://www.rsc.org/images/entities/char_e001.gif) N functional group of imidazole and frequency ∼1130 cm−1 corresponds to the C–CF3 group in AC-mCF3 and AC-pCF3 dyes69 The peak at ∼700 cm−1 is likely due to the aromatic C–H bending frequency. The vibrational frequencies of all the dyes are provided in Table S1 in ESI.†
N functional group of imidazole and frequency ∼1130 cm−1 corresponds to the C–CF3 group in AC-mCF3 and AC-pCF3 dyes69 The peak at ∼700 cm−1 is likely due to the aromatic C–H bending frequency. The vibrational frequencies of all the dyes are provided in Table S1 in ESI.†
Structural characterization
The ORTEP diagram of the AC-Ph, AC-PT and AC-mCF3 is shown in Fig. 1. The planes of the imidazole ring and the benzene rings were twisted significantly relative to each other with a dihedral by introducing CH3 (113.07°) and CF3 (130.86°) groups on the phenyl ring (60.44°). The central Acenaphthene-imidazole ring was notably twisted relative to AC-Ph, which can be attributed to spatial torsion disrupting the p-conjugation between the triphenylamine and substituted phenyl groups. The bond angles between the Acenaphthene-imidazole ring and phenyl rings for AC-Ph (129.39°), AC-PT (130.31°), AC-pCF3 (128.75°). The bond distance between the N1 atom and Phenyl carbons are almost same in the range of 1.40 Å. The bond angles between two phenyl rings of triphenylamine are changed (AC-Ph (107.88°), AC-PT (125.35°) and AC-pCF3(120.59°)) by introducing substituents on the phenyl groups. The crystal data and corresponding bond lengths and bond angles from the single-crystal XRD data are listed in supplementary information (Tables S2–S8, ESI†). Rest of the dyes crystal studies could not be carried out. Since, the obtained crystals are very poor and not suitable for X-ray diffraction.
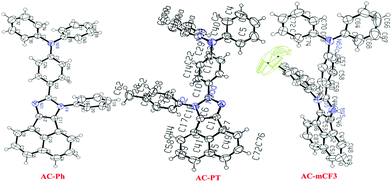 |
| | Fig. 1 ORTEP Diagrams of AC-Ph, AC-PT and AC-mCF3 dyes (50% probability ellipsoids; H atoms and co-crystallized solvent molecules are omitted). N atoms blue in color. (CCDC 1568852 (AC-Ph), CCDC 1587456 (AC-PT) and CCDC 1568853 (AC-mCF3)).† | |
Photophysical properties
The absorption spectra of the AC-derivatives were recorded in chloroform (CHCl3) solution are shown in Fig. 2A and corresponding spectral data were tabulated in Table 1, all the dyes excibited two major absorption peaks. The high energy peaks abserved below 275 nm are attributed to the π–π* transition of benzene ring.70 This peak position is red-shifted (20 nm) in the AC-Fl dye, it is due to increasing conjugation by fluorene moiety. The longer wavelength absorption band occurred at a wavelength of approximately 350 nm might have originated from the π–π* transition of TPA and imidazole moieties. The optical bandgap of the AC-derivatives was calculated from the diffuse reflectance spectra (DRS) with the help of Kubelka–Munk function (Fig. 2C).71 The obtained band gap are listed in Table 5.
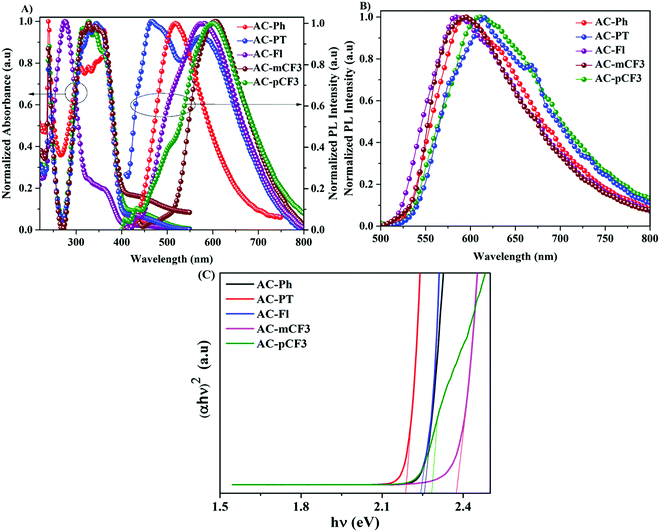 |
| | Fig. 2 (A) UV absorption and PL spectra of dyes in CHCl3 solution, (B) PL spectra of dyes in solid and (C) optical bandgap of the dyes calculated from the solid-state diffuse reflectance spectra. | |
Table 1 Key photophysical properties of AC-derivatives
| Compounds |
T
d
°C |
Solution |
Solid |
Absolute quantum yield |
| Abs (nm) |
PL (nm) |
PL (nm) |
Solution (%) |
Solid (%) |
|
Thermal decomposition temperature.
|
| AC-Ph |
425 |
240, 360 |
520 |
595 |
17.57 |
14.98 |
| AC-PT |
410 |
240, 340 |
465, 579 |
612 |
13.34 |
13.11 |
| AC-Fl |
430 |
270, 365 |
577 |
585 |
14.69 |
12.99 |
| AC-mCF3 |
390 |
240, 340 |
590 |
599 |
13.46 |
13.33 |
| AC-pCF3 |
400 |
240, 335 |
588 |
610 |
11.26 |
10.8 |
The emission spectra of the dyes recorded in CHCl3 solution are displayed in Fig. 3A. and the related data tabulated in Table 1. The dyes showed broad emission specta with bluish-white to yellowies-orange emission ranging from 520 nm to 600 nm in solution. In perticular, the AC-PT dye shown white emission with the commission International de l'Eclairge (CIE) colar coordinates of (0.305, 0.324) in CHCl3 soution. The N1 functionalization with the defferent functional group (p-CH3(AC-PT), Fl (AC-Fl), m-CF3 (AC-mCF3) and p-CF3 (AC-pCF3)) with the reference compound AC-Ph, the red shift PL emission was absorbed. In the case of AC-PT and AC-Fl, because of electron-donating nature of CH3 and Fl groups red shift was observed. Intrdoction of EDG leads to higher HOMO levels and lower HOMO–LUMO energy gap, thus resultig red shift in the emission spectrum (Table 3). It is predected that, electron withdrawing CF3 groups leads to blue shift in the emission. However, the prediction is not suitable for AC-mCF3 and AC-pCF3. By introducing CF3 group on the core molecules, the LUMO energy levels are more stabilized (Table 3), resulting in narrower band gaps than core dye (AC-Ph), which leads to red shift in emission. The emission spectra of the solid of the dyes are shown in Fig. 2B, all the dyes shown broad emission spectra and red shifted emission with compared to the solution. Particularly, the PL spectra of AC-Ph dye in solid state is significantly red-shifted (65 nm) to the obsorved in solution. This indicates that AC-Ph dye is involved in strong intromolecuare π–π* interaction in solid state.72,73 From the Table 1, it is conclude that, each luminophore exhibited a difference between their emission maxima in solid and solution, because the planarity of the AC-Ph unit caused aggregate in the solid state through strong intermolecular interactions. The CIE colar coordinates daigram of the dyes, solution as well as in solid phase is shown in Fig. 3 and corresponding x and y coordinates values are tabulated in Table 2.
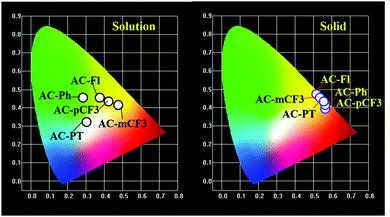 |
| | Fig. 3 The CIE chromaticity coordinates for all the dyes in solutions and solid phase. | |
Table 2 The CIE chromaticity coordinates data of AC-derivatives
| Compounds |
CIE color coordinates |
| Solution |
Solid |
|
x
|
y
|
x
|
y
|
| AC-Ph |
0.297 |
0.457 |
0.551 |
0.435 |
| AC-PT |
0.305 |
0.324 |
0.573 |
0.423 |
| AC-Fl |
0.392 |
0.445 |
0.531 |
0.465 |
| AC-mCF3 |
0.466 |
0.415 |
0.547 |
0.449 |
| AC-pCF3 |
0.426 |
0.427 |
0.567 |
0.409 |
The absolute quantum yield (Φ) of the dyes was calculated using an integrating sphere for both solution and solid samples. The absolute quantum yields (ΦY) of the dyes calculated by using Integrated Sphere.74 The measured absolute quantum yields of the dyes are listed in Table 1. Compared to the AC-Ph, all the substituted dyes showed slight decrease in the quantum yield. The substitute effect is attributed to the presence of intramolecular photoinduced electron transfer (PET). In which, PET may occur, within the molecule that consist of covalently linked Donor–Acceptor dyes (if the free energy change (ΔG) of the dye is a negative value). Similar results were observed in xanthene dyes.75
DFT analysis
Frontier molecular orbitals.
The optimized geometry of AC-derivatives were shown in Fig. 3 (AC-Ph to AC-PT). The HOMO–LUMO energies and their electron contour plots of substituted acenaphthene based dyes were displayed in Fig. 4. The Fig. 4 indicates that the introduction of subunits (phenyl, flurene, CH3, mCF3, pCF3) into the N1 position of the dyes, changes the energies of the FMO. When the subunits were incorporated at N1 position of the dyes, small variation in the energies from the unsubstituted (AC-Ph) to substituted luminophores (AC-PT to AC-pCF3) were observed. However, the HOMO and LUMO energy levels of the synthesiszed dyes were mentioned in Table 3 and Fig. 5 and 6. Based on the results, it is clearly indicating that the introduction of CF3 group on imidazole moiety will destabilizes HOMO energy levels and stabilizes LUMO levels. From the Fig. 6. It can be noted that the HOMO is located on the electron donor triphenylamine moiety and LUMO is located on the electron accepting acenaphthene-imidazole moiety. This feature indicates spatial separation between the HOMO and LUMO and the concomitant hole and electron transport properties. In addition, atom coordinates of AC-derivatives were given in SI10 section in ESI.†
 |
| | Fig. 4 Optimized geometry of AC-derivatives. | |
Table 3 Calculated absorption (gas phase), HOMO, LUMO, singlet and triplet energy levels of AC-derivatives in gas phase at TD-DFT/B3LYP level
| AC-derivatives |
AC-Ph |
AC-PT |
AC-Fl |
AC-mCF3 |
AC-pCF3 |
| HOMO (eV) |
−4.720 |
−4.700 |
−4.702 |
−4.846 |
−4.846 |
| LUMO (eV) |
−1.664 |
−1.644 |
−1.665 |
−1.790 |
−1.831 |
| Energy gap (ΔE, eV) |
3.056 |
3.056 |
3.037 |
3.056 |
3.015 |
|
λ
abs(nm) (DCM phase) |
419.6 |
491.5 |
494.1 |
491.5 |
493.5 |
|
λ
abs(nm) (Gas phase) |
424.0 |
491.4 |
493.7 |
488.2 |
494.1 |
| Singlet energy (S1) (eV) |
2.924 |
2.523 |
2.511 |
2.539 |
2.509 |
| Triplet energy (T1) (eV) |
2.239 |
1.983 |
1.974 |
1.982 |
1.969 |
| ΔEST (eV) |
0.685 |
0.540 |
0.537 |
0.55 |
0.540 |
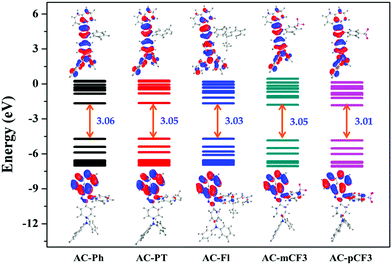 |
| | Fig. 5 Energy level diagram of AC-derivatives. | |
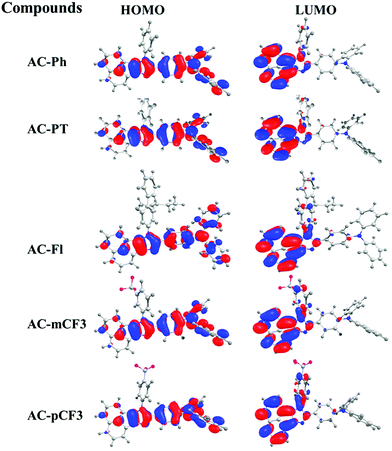 |
| | Fig. 6 HOMO–LUMO energy levels of the AC-derivatives. | |
Singlet and triplet energy levels
To have a deep vision into the absorption and emission properties of the AC-derivatives, we have executed the spectral analysis of dyes in gas phase as well as in solution phase (DCM) using different exchange correlation functional. To carry out the absorption spectra, we have performed TD-DFT calculations by using ground state optimised geometries of dyes. The simulated gas-phase as well as DCM phase absorption spectra of the dyes were shown in Fig. 7 and the corresponding wavelength (λmax) were tabulated in the Table 4. And the corresponding excitation energy and orbital characteristics of each excitation are summarized in ST9. The Table ST9 (ESI†) indicates that, for all the dyes the S1 transitions are significant one except AC-Ph dye. In the case of AC-Ph the significant state is S2. In all cases the absorption has major contribution from HOMO to LUMO.
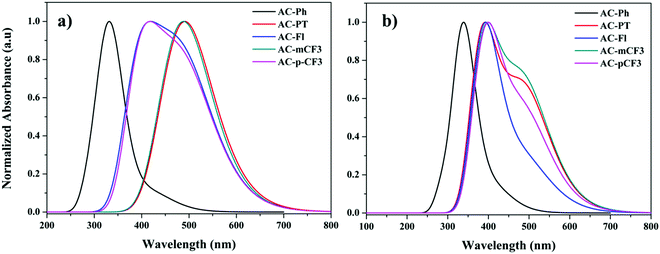 |
| | Fig. 7 UV-Visible spectra of AC-derivatives in gas (a) and DCM (b) phase. | |
Table 4 Calculated ionization potentials (IP in eV), electronic affinities (EAs in eV), extraction potentials (eV), and reorganization energies (eV) of AC-derivatives at B3LYP/6-31G(d, p) level
| Compounds |
AC-Ph |
AC-PT |
AC-Fl |
AC-mCF3 |
AC-pCF3 |
mcp |
FIrpic |
| IPa |
5.63 |
5.60 |
5.57 |
5.75 |
5.75 |
6.80 |
6.56 |
| IPv |
5.82 |
5.79 |
5.76 |
5.94 |
5.94 |
|
|
| HEP |
5.44 |
5.42 |
5.20 |
5.55 |
5.57 |
|
|
| SPE(h) |
0.185 |
0.18 |
0.56 |
0.19 |
0.17 |
|
|
| −EAa |
0.56 |
0.55 |
0.69 |
0.73 |
0.80 |
0.15 |
1.06 |
| −EAv |
0.35 |
0.33 |
0.50 |
0.52 |
0.57 |
|
|
| SPE(e) |
0.63 |
0.63 |
1.18 |
0.61 |
0.65 |
|
|
| EEP |
−0.06 |
−0.08 |
−0.67 |
0.12 |
0.14 |
|
|
|
λ
hole
|
0.37 |
0.37 |
0.37 |
0.38 |
0.36 |
0.06 |
0.27 |
|
λ
electron
|
0.42 |
0.41 |
1.36 |
0.40 |
0.43 |
0.12 |
0.26 |
|
Δ
SPE
|
0.44 |
0.44 |
0.61 |
0.41 |
0.47 |
|
|
| Δλ |
0.04 |
0.04 |
0.99 |
0.019 |
0.06 |
0.06 |
|
Charge-injection barriers
For a good bipolar material, it should have balanced charge transport and a low injection barrier from the neighbouring layers (ETL, and HTL). So, it is necessary to find out the reorganization energies and transport rates of bipolar material. Reorganization energies and transport rates were calculated by using their corresponding ionization potentials (IPs), electron affinities (EAs).76–80 All the IP and EA values of the synthesized AC-derivatives were tabulated in Table 4. The calculated IP values of AC-derivatives (AC-Ph to AC-pCF3) (5.63–5.94 eV) are in-between the HTL (TAPC, IP = 5.80 eV) and FIrpic emitter (IP = 6.96 eV). Hence, these synthesized AC-derivatives can mediate holes from HTL to the emissive layer. As far as electron infusion, the LUMO of the host materials ought to be in arrangement with that of the ETL. Based on the DFT analysis, the LUMO levels of the synthesized AC-derivatives were vary from −1.644 to −1.831 eV. These LUMO levels of the AC-derivatives were fluctuated with reference ETL (−1.52 eV). The calculated EA values of the AC-derivatives were found in the range of 0.56–0.80 eV (Table 4), which are almost near to the reference ETL (TmPyPB, EA = 0.68 eV). According to these results, compare with the reference HTL, these AC-derivatives are low barrier for electron injection from ETL to emissive layer.
Reorganization energies
The reorganization energies of the dyes can be calculated by using charge-transport rate. According to Koopmans’ theorem, the lower the λ value, the higher the charge-transport rate.81 The hole and electron reorganization energies were tabulated in Table 4. The Table 4 shows that, all the dyes were showing lower λh (0.36–0.38) compare to λe (0.40–1.26). It is concludes that, hole transporting nature of these dyes was more favourable than electron transporting nature. In addition, the Δλ value of AC-mCF3 is the lowest among all the other AC-derivatives, revealing that AC-mCF3 has more potential as an emitter for OLED applications.
Electrochemical properties
The electrochemical properties of the dyes were studied in dimethylformamide (DMF) solution through cyclic voltammetry (CV) measurement by using Ag/AgCl as the reference electrode and 0.1 M Tetrabutylammonium perchlorate (Bu4NClO4) as a supporting electrolyte at a scan rate of 100 mV s−1. The cyclic voltammograms are shown in Fig. 8 and relevant electrochemical data is tabulated in Table 5. All the dyes exhibited oxidation and reduction behaviours. According to the onset (oxidation and reduction) potentials, we have calculated the highest occupied molecular orbital (HOMO) and the lowest unoccupied molecular orbital (LUMO) energy levels by using the eqn (1) and (2).82| | | EHOMO = −(Eonsetox + 4.4) eV | (1) |
| | | ELUMO = −(Eonsetred + 4.4) eV | (2) |
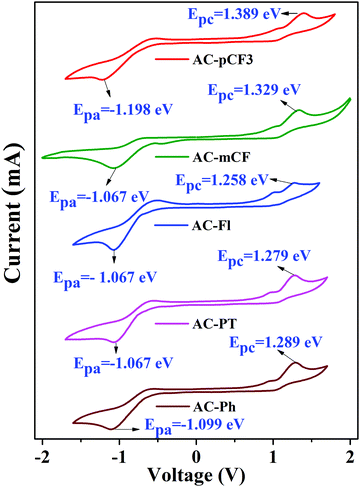 |
| | Fig. 8 Cyclic voltammograms of the AC-derivatives. | |
Table 5 Electrochemical properties of the AC-derivatives
| Molecules |
E
ox
(V) |
E
red
(V) |
HOMO (eV) |
LUMO (eV) |
E
g
(eV) |
E
g
(eV) |
|
The onset potential.
Electrochemical bandgap determined from cyclic voltammetry.
Optical energy bandgap estimated from DRS spectra.
|
| AC-Ph |
1.289 |
−1.009 |
−5.689 |
−3.301 |
2.388 |
2.25 |
| AC-PT |
1.279 |
−1.067 |
−5.629 |
−3.333 |
2.296 |
2.19 |
| AC-Fl |
1.258 |
−1.067 |
−5.658 |
−3.333 |
2.325 |
2.24 |
| AC-mCF3 |
1.329 |
−1.067 |
−5.729 |
−3.333 |
2.396 |
2.37 |
| AC-pCF3 |
1.389 |
−1.198 |
−5.789 |
−3.302 |
2.487 |
2.28 |
The HOMO level of the dyes vary in the range of −5.629 to 5.789 eV and the LUMO level range from −3.301 to −3.333 eV (Table 5) depending on the deferent functional group at N1 position of imidazole group. By using HOMO/LUMO value of the dyes we have calculated band gap of the dyes, which are close to the value estimated from defused reflectance spectra (DRS). When we are N1 functionalizing with electron realising group (p-CH3 and fluorene) the HOMO level of the dyes is increasing, whereas with electron withdrawing group (m-CF3 and p-CF3) the HOMO level of the dyes are decreasing with the respect of reference AC-Ph dye, but does not impose a noticeable effect on the band gap (Eg) of the dyes (Table 5). The comparison of HOMO/LUMO energy level and band gap of the dyes is shown Fig. 9 it is clearly indicating that band gap calculated using both electrochemical analysis and optical analysis almost match.
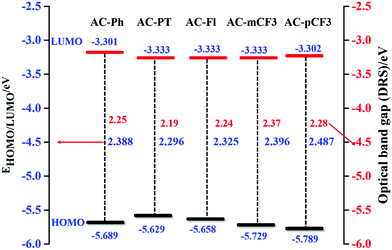 |
| | Fig. 9 HOMO–LUMO energy gap diagram of the AC-derivatives. | |
Conclusion
In summery we have successfully design and synthesised AC-derivatives by incorporating Acenaphthene-imidazole as electron-transporting moiety and TPA as hole-transporting moiety with different functional groups at N1 position of imidazole. All the dyes shown good thermal stability with high thermal decomposition (Td) temperature ranging from 400 to 430 °C. All the dyes showed a broad PL emission (bluish-white to yellowish-orange emission) with the emission maximum in the range of 520–600 nm. Theoretical investigation like optimization, singlet–triplet and HOMO and LUMO energy levels calculations of dyes were calculated by using DFT and TD-DFT analysis. The excited singlet–triplet energy gap of dyes were estimated and correlated to structural and energetic characteristics of the known host materials. In addition, examinations carried out to know the optical, electronic, charge transport and stability properties of dyes as emissive and charge transport materials for organic light emitting devices (OLEDs). Moreover, all the dyes are good emissive materials and its hole transporting nature of these dyes was more favourable than electron transporting nature. According to theoretical investigation, it is clearly indicating that AC-mCF3 has more potential as an emitter for OLED applications.
Conflicts of interest
There are no conflicts of interest.
Acknowledgements
VS acknowledges SERB, Department of Science and Technology (DST), India (EMR/2016/002462) for financial support.
References
- C. W. Tang and S. A. VanSlyke, Appl. Phys. Lett., 1987, 51, 913 CrossRef CAS.
- Y. G. Ma, H. Zhang, J. C. Shen and C. Che, Synth. Met., 1998, 94, 245 CrossRef CAS.
- M. Zhang, S. F. Xue, W. Y. Dong, Q. Wang, T. Fei, C. Gu and Y. G. Ma, Chem. Commun., 2010, 46, 3923 RSC.
- K. T. Kamtekar, A. P. Monkman and M. R. Bryce, Adv. Mater., 2010, 22, 572–582 CrossRef CAS PubMed.
- G. M. Farinola and R. Ragni, Chem. Soc. Rev., 2011, 40, 3467–3482 RSC.
- J. Ding, J. Gao, Y. Cheng, Z. Xie, L. Wang, D. Ma, X. Jing and F. Wang, Adv. Funct. Mater., 2006, 16, 575 CrossRef CAS.
- J. H. Lee, S. H. Cheng, S. J. Yoo, H. Shin, J. H. Chang, C. I. Wu, K. T. Wong and J. J. Kim, Adv. Funct. Mater., 2015, 25, 361 CrossRef CAS.
- H. Sasabe, J. Takamatsu, T. Motoyama, S. Watanabe, G. Wagenblast, N. Langer, O. Molt, E. Fuchs, C. Lennartz and J. Kido, Adv. Mater., 2010, 22, 5003 CrossRef CAS.
- Q. Wang, I. W. H. Oswald, X. Yang, G. Zhou, H. Jia, Q. Qiao, Y. Chen, H. J. Hoshikawa and B. E. Gnade, Adv. Mater., 2014, 26, 8107 CrossRef CAS PubMed.
- M. Zhu and C. Yang, Chem. Soc. Rev., 2013, 42, 4963 RSC.
- T. Fleetham, G. J. Li, L. L. Wen and J. Li, Adv. Mater., 2014, 26, 7116 CrossRef CAS PubMed.
- C. Tang, R. Bi, Y. Tao, F. Wang, X. Cao, S. Wang, T. Jiang, C. Zhong, H. Zhang and W. Huang, Chem. Commun., 2015, 51, 1650 RSC.
- L. Meng, H. Wang, X. Wei, J. Liu, Y. Chen, X. Kong, X. Lv, P. Wang and Y. Wang, ACS Appl. Mater. Interfaces, 2016, 8, 20955.4 Search PubMed.
- S. K. Lee, D. H. Hwang, B. J. Jung, N. S. Cho, J. Lee, J. D. Lee and H. K. Shim, Adv. Funct. Mater., 2005, 15, 1647 CrossRef CAS.
- L. Ying, C. L. Ho, H. Wu, Y. Cao and W. Y. Wong, Adv. Mater., 2014, 26, 2459 CrossRef CAS PubMed.
- X. Ouyang, X. L. Li, L. Ai, D. Mi, Z. Ge and S. J. Su, ACS Appl. Mater. Interfaces, 2015, 7, 7869–7877 CrossRef CAS PubMed.
- Y. Zhang, Y. Miao, X. Song, Y. Gao, Z. Zhang, K. Ye and Y. Wang, J. Phys. Chem. Lett., 2017, 8, 4808–4813 CrossRef CAS PubMed.
- B. Xu, H. Wu, J. Chen, Z. Yang, Z. Yang, Y. C. Wu, Y. Zhang, C. Jin, P. Y. Lu, Z. Chi, S. Liu, J. Xu and M. Aldred, Chem. Sci., 2017, 8, 1909 RSC.
- A. B. Kajjam, S. Giri and V. Sivakumar, Mater. Chem. Front., 2017, 1, 512–520 RSC.
- J. Luo, X. Li, Q. Hou, J. Peng, W. Yang and Y. Cao, Adv. Mater., 2007, 19, 1113–1117 CrossRef CAS.
- Y. S. Wu, S. W. Hwang, H. H. Chen, M. T. Lee, W. J. Shen and C. H. Chen, Thin Solid Films, 2005, 488, 265 CrossRef CAS.
- Y. R. Sun, N. C. Giebink, H. Kanno, B. W. Ma, M. E. Thompson and S. R. Forrest, Nature, 2006, 440, 908 CrossRef CAS.
- G. Schwartz, M. Pfeiffer, S. Reineke, K. Walzer and K. Leo, Adv. Mater., 2007, 19, 3672 CrossRef CAS.
- S. M. Chen, G. P. Tan, W. Y. Wong and H. S. Kwok, Adv. Funct. Mater., 2011, 21, 3785 CrossRef CAS.
- M. E. Kondakova, J. C. Deaton, T. D. Pawlik, D. J. Giesen, D. Y. Kondakov, R. H. Young, T. L. Royster, D. L. Comfort and J. D. Shore, J. Appl. Phys., 2010, 107, 014515 CrossRef.
- J. Yoon, S. Choi, C. H. Jeong, S. K. Kim, H. Lee, Y. Kim, J. H. Kwon, S. Park, M. J. Cho and D. H. Cho, Dyes Pigm., 2019, 170, 107650 CrossRef CAS.
- J. Tagare, R. A. Kumar Yadav, S. S. Swayamprabha, D. K. Dubey, J.-H. Jou and S. Vaidyanathan, J. Mater. Chem. C, 2021, 9, 4935 RSC.
- B. Chen, B. Liu, J. Zeng, H. Nie, Y. Xiong, J. Zou, H. Ning, Z. Wang, Z. Zhao and B. Z. Tang, Adv. Funct. Mater., 2018, 28, 1803369 CrossRef.
- C.-C. Huang, M.-M. Xue, F.-P. Wu, Y. Yuan, L.-S. Liao and M.-K. Fung, Molecules, 2019, 24, 353 CrossRef.
- J. Wang, Y. Li, L. Chen, Y. Deng, Y. Peng, F. Lu and W. Zhu, Opt. Mater., 2020, 100, 109673 CrossRef CAS.
- Z. Wu, X. Zhu, Y. Li, H. Chen, Z. Zhuang, P. Shen, J. Zeng, J. Chi, D. Ma, Z. Zhao and B. Z. Tang, Adv. Opt. Mater., 2021, 9, 2100298 CrossRef CAS.
- J. H. Jou, Y. S. Chiu, C. P. Wang, R. Y. Wang and H. C. Hu, Appl. Phys. Lett., 2006, 88, 193501 CrossRef.
- A. B. Kajjam and S. Vaidyanathan, Chem. Rec., 2018, 18, 293–349 CrossRef CAS.
- C. Adachi, M. A. Baldo and S. R. Forrest, Appl. Phys. Lett., 2001, 78, 11 CrossRef.
- J. Lia, Y. Duan and Q. Li, Dyes Pigm., 2013, 96, 391–396 CrossRef.
- D. H. Kim, N. S. Cho, H.-Y. Oh, J. H. Yang, W. S. Jeon, J. S. Park, M. C. Suh and J. H. Kwon, Adv. Mater., 2011, 23, 2721 CrossRef CAS.
- W. C. Wu, H. C. Yeh, L. H. Chan and C. T. Chen, Adv. Mater., 2002, 14, 1072–1075 CrossRef CAS.
- B. Liang, L. Wang, Y. H. Xu, H. H. Shi and Y. Cao, Adv. Funct. Mater., 2007, 17, 3580–3589 CrossRef CAS.
- H. H. Chou and C. H. Cheng, Adv. Mater., 2010, 22, 2468–2471 CrossRef CAS PubMed.
- C. H. Chen, L. C. Hsu, P. Rajamalli, Y. W. Chang, F. L. Wu, C. Y. Liao, M. J. Chiu, P. Y. Chou, M. J. Huang, L. K. Chu and C. H. Cheng, J. Mater. Chem. C, 2014, 2, 6183 RSC.
- B. Wang, X. Lv, J. Tan, Q. Zhang, Z. Huang, W. Yi and L. Wang, J. Mater. Chem. C, 2016, 4, 8473 RSC.
- C. Li, J. Wei, X. Song, K. Ye, H. Zhang, J. Zhang and Y. Wang, J. Mater. Chem. C, 2016, 4, 7013–7019 RSC.
- H. Sasabe, T. Chiba, S. J. Su, Y. J. Pu, K. I. Nakayama and J. Kido, Chem. Commun., 2008, 5821 RSC.
- L. C. Chi, W. Y. Hung, H. C. Chiu and K. T. Wong, Chem. Commun., 2009, 3892 RSC.
- H. Huang, Y. Wang, B. Wang, S. Zhuang, B. Pan, X. Yang, L. Wang and C. Yang, J. Mater. Chem. C, 2013, 1, 5899 RSC.
- D. Liu, M. Du, D. Chen, K. Ye, Z. Zhang, Y. Liu and Y. Wang, J. Mater. Chem. C, 2015, 3, 4394 RSC.
- K. Wang, S. Wang, J. Wei, S. Chen, D. Liu, Y. Liu and Y. Wang, J. Mater. Chem. C, 2014, 2, 6817 RSC.
- H. Shi, D. Xin, X. Dong, J. Dai, X. Wu, Y. Miao, L. Fang, H. Wang and M. Choi, J. Mater. Chem. C, 2014, 2, 2160 RSC.
- Y. Zhang, S. L. Lai, Q. X. Tong, M. F. Lo, T. W. Ng, M. Y. Chan, Z. C. Wen, J. He, K. S. Jeff, X. L. Tang, W. M. Liu, C. C. Ko, P. F. Wang and C. S. Lee, Chem. Mater., 2012, 24, 61–70 CrossRef.
- X. Tang, Q. Bai, Q. Peng, Y. Gao, J. Li, Y. Liu, L. Yao, P. Lu, B. Yang and Y. Ma, Chem. Mater., 2015, 27, 7050 CrossRef CAS.
- M. Chen, Y. Yuan, J. Zheng, W. C. Chen, L. J. Shi, Z. L. Zhu, F. Lu, Q. X. Tong, Q. D. Yang, J. Ye, M. Y. Chan and C. S. Lee, Adv. Opt. Mater., 2015, 3, 1215–1219 CrossRef CAS.
- T. Shan, Y. Liu, X. Tang, Q. Bai, Y. Gao, Z. Gao, J. Li, J. Deng, B. Yang, P. Lu and Y. Ma, ACS Appl. Mater. Interfaces, 2016, 8, 28771–28779 CrossRef CAS PubMed.
- J. K. Bin, N. S. Cho and J. I. Hong, Adv. Mater., 2012, 24, 2911–2915 CrossRef CAS PubMed.
- M. F. Wu, S. J. Yeh, C. T. Chen, H. Murayama, T. Tsuboi, W. S. Li and J. K. Wang, Adv. Funct. Mater., 2007, 17, 1887–1895 CrossRef CAS.
- K. S. Yook and J. Y. Lee, Adv. Mater., 2012, 24, 3169–3190 CrossRef CAS.
- Y. M. Jeon, I. H. Lee, H. S. Lee and M. S. Gong, Dyes Pigm., 2011, 89, 29–36 CrossRef CAS.
- Y. Zhang, Z. Chen, J. Song, J. He, X. Wang, J. Wu, S. Chen, J. Qu and W.-Y. Wong, J. Mater. Chem. C, 2019, 7, 1880–1887 RSC.
- D. Zhang, T. Yang, H. Xu, Y. Miao, R. Chen, R. Shinar, J. Shinar, H. Wang, B. Xua and J. Sheng, J. Mater. Chem. C, 2021, 9, 4921–4926 RSC.
- C. Zhou, X. Zhang, G. Pan, X. Tian, S. Xiao, H. Liu, S. Zhang and B. Yang, Org. Electron., 2019, 75, 105414 CrossRef CAS.
- J. H. Jou, S. C. Fu, C. C. An, J. J. Shyue, C. L. Chin and Z. K. He, J. Mater. Chem. C, 2017, 5, 5478 RSC.
-
M. J. Frisch, et al., Gaussian, Gaussian, Inc., Wallingford CT, 2009 Search PubMed.
- R. Bauernschmitt and R. Ahlrichs, Chem. Phys. Lett., 1996, 256, 454–464 CrossRef CAS.
- G. Scalmani, M. J. Frisch, B. Mennucci, J. Tomasi, R. Cammi and V. Barone, J. Chem. Phys., 2006, 124, 094107 CrossRef PubMed.
- C. H. Yang, H. L. Chen, Y. Y. Chuang, C. G. Wu, C. P. Chen, S. H. Liao and T. L. Wang, J. Power Sources, 2009, 188, 627–634 CrossRef CAS.
- A. K. Shil, D. Sharma, N. R. Guha and P. Das, Tetrahedron Lett., 2012, 53, 4858 CrossRef CAS.
- K. A. Babu, D. K. Dubey, R. A. K. Yadav, J.-H. Jou and V. Sivakumar, Mater. Today Chem., 2019, 14, 100201 CrossRef.
- A. B. Kajjam and V. Sivakumar, Inorg. Chim. Acta, 2021, 519, 120268 CrossRef.
- A. B. Kajjam, K. Singh, R. V. Varun Tej and V. Sivakumar, Mater. Adv., 2021, 2, 5236 RSC.
- J. Tagare, H. Ulla, M. N. Satyanarayan and S. Vaidyanathana, J. Photochem. Photobiol., A, 2018, 353, 53–64 CrossRef CAS.
- W. C. Chen, Y. Yuan, G. F. Wu, H. X. Wei, J. Ye, M. Chen, F. Lu, Q. X. Tong, F. L. Wong and C. S. Lee, Org. Electron., 2015, 17, 159–166 CrossRef CAS.
- S. Ebraheem and A. E. Saied, Mater. Sci. Appl., 2013, 4, 324–329 Search PubMed.
- Y. S. Park, S. Lee, K. H. Kim, S. Y. Kim, J. H. Lee and J. J. Kim, Adv. Funct. Mater., 2013, 23, 4914–4920 CrossRef CAS.
- J. Kalinowski, Mater. Sci., 2009, 27, 735–756 CAS.
- J. C. Mello, H. F. Wittmann and R. H. Friend, Adv. Mater., 1997, 9, 230–232 CrossRef.
- X.-F. Zhang, Photochem. Photobiol. Sci., 2010, 9, 1261–1268 CrossRef CAS PubMed.
- X. N. Li, Z. J. Wu, Z. J. Si, H. J. Zhang, L. Zhou and X. J. Liu, Inorg. Chem., 2009, 48, 7740–7749 CrossRef CAS PubMed.
- Y. Q. Liu, G. Gahungu, X. B. Sun, X. C. Qu and Z. J. Wu, J. Phys. Chem. C, 2012, 116, 26496–26506 CrossRef CAS.
- S. Hwang, J. H. Lee, C. Park, H. Lee, C. Kim, C. Park, M.-H. Lee, W. Lee, J. Park and K. Kim, Chem. Commun., 2007, 4887–4889 RSC.
- A. Fitri, A. T. Benjelloun, M. Benzakour, M. Mcharfi, M. Hamidi and M. Bouachrine, Spectrochim. Acta, Part A, 2014, 132, 232–238 CrossRef CAS.
- A. B. Kajjam, P. S. V. Kumar, V. Subramanian and S. Vaidyanathan, Phys. Chem. Chem. Phys., 2018, 20, 4490–4501 RSC.
-
Z. Shuai, L. Wang and C. Song, Theory of Charge Transport in Carbon Electronic Materials, Springer, 2012, T. Koopmans, Physica 1, 1934, 104.
- J. L. Bredas, R. Silbey, D. S. Boudreux and R. R. Chance, J. Am. Chem. Soc., 1983, 105, 6555 CrossRef CAS.
Footnote |
| † Electronic supplementary information (ESI) available: Supporting Information consist of substrate synthesis (TPA-CHO), NMR spectra (1H, 13C) and mass spectra of all the dyes. FT-IR spectra and atom coordinates of the dyes (DFT). CCDC 1587456, 1568852 and 1568853. For ESI and crystallographic data in CIF or other electronic format see DOI: 10.1039/d1ma00583a |
|
| This journal is © The Royal Society of Chemistry 2022 |
Click here to see how this site uses Cookies. View our privacy policy here.  Open Access Article
 ,
Kasturi
Singh
 ,
Sabita
Patel
 and
Sivakumar
Vaidyanathan
 *
*
![[thin space (1/6-em)]](https://www.rsc.org/images/entities/char_2009.gif) :
:![[thin space (1/6-em)]](https://www.rsc.org/images/entities/char_2009.gif) 7; v/v) to give a yellow or yellowish-orange solid.
7; v/v) to give a yellow or yellowish-orange solid.
![[double bond, length as m-dash]](https://www.rsc.org/images/entities/char_e001.gif) N functional group of imidazole and frequency ∼1130 cm−1 corresponds to the C–CF3 group in AC-mCF3 and AC-pCF3 dyes69 The peak at ∼700 cm−1 is likely due to the aromatic C–H bending frequency. The vibrational frequencies of all the dyes are provided in Table S1 in ESI.†
N functional group of imidazole and frequency ∼1130 cm−1 corresponds to the C–CF3 group in AC-mCF3 and AC-pCF3 dyes69 The peak at ∼700 cm−1 is likely due to the aromatic C–H bending frequency. The vibrational frequencies of all the dyes are provided in Table S1 in ESI.†


