 Open Access Article
A synergistic approach to achieving high conduction and stability of CsH2PO4/NaH2PO4/ZrO2 composites for fuel cells
Dharm
Veer
a,
Pawan
Kumar
 *a,
Deshraj
Singh
b,
Devendra
Kumar
a and
Ram S
Katiyar
c
aDepartment of Physics, Gurukula Kangri (Deemed to be University), Haridwar-249404, India. E-mail: pksoniyal13@gmail.com
bDepartment of Physics K.G.K. College, Moradabad, M.J.P Rohilkhand University, Bareilly-243006, India
cDepartment of Physics, University of Puerto Rico, PR-00931, USA
First published on 20th October 2021
Abstract
Solid acid composites of CsH2PO4/NaH2PO4/ZrO2 with different weight ratios of CsH2PO4 (CDP), NaH2PO4 (SDP), and ZrO2 were synthesized and characterized. The structure and morphology of the composites were investigated by XRD, FESEM, EDX, and FTIR techniques. The thermal stability and conduction were described for the solid acid composites using TGA, DTA, and conductivity measurements. NaH2PO4 increased the low-temperature conductivity of CDP by up to 1.5 orders of magnitude and ZrO2 enhanced the conductivity above the transition temperatures. Additionally, the composites showed excellent stability. The superprotonic transition behavior was identified at temperatures from 220 to 270 °C. The conductivity of the composites was examined in air and under confined conditions and also their decomposition was investigated. Our findings suggest that NaH2PO4/ZrO2 is an appropriate composite for achieving the high conductivity and stability of CDP.
1. Introduction
In modern society, there is a huge demand for emerging ecology as a renewable energy source. Fuel cells are becoming an attractive renewable energy generation source.1 New studies are based on the high ionic conductivity and good mechanical properties of solid acid electrolytes for fuel cells. Solid acid fuel cells operate at intermediate temperatures2–6 which generates ingenuity for other fuel cell technologies. The formula MaHb(XO4)c represents the solid acid electrolytes, where M = Cs, Na, Rb, Li, and NH4; X = P, As, S, and Se; a, b, and c are integers.7 At least one phase transition in this family corresponds to an increase in proton conductivity.8 CsHPO4, RbH2PO4, and CsH2PO4 are solid acid electrolytes, in which CsH2PO4 (CDP) is a widely studied solid acid with superprotonic conductivity at 230 °C. This material was used as an electrolyte for fuel cells and its applicability was evaluated in various electrochemical cell applications.9–13 The proton conductivity of CDP increases up to three orders of magnitude upon heating.14 At high temperatures, the cubic form of CDP has been observed as a superprotonic phase. The highest conductivity of CDP and its potential use as a solid electrolyte has gained renewed interest.15–18 The dehydration of CDP can be suppressed sufficiently due to the increase in thermal stability above the phase transition temperature.19 A solid acid is mixed with other solid acids or oxides20 to produce composites with higher conductivity values and improved thermal stability. NaH2PO4 (SDP) is an impressive material due to the high stability of sodium ions and potential technological applications.21 It is useful in food, water treatment, medicine, cement, and other fields.22 The conductivity of CDP increases up to 1 to 3 orders of magnitude by SDP at low temperatures.23 For an SA-doped material, a higher proton conductivity of 5.28 × 10 2 s cm was observed at 90 °C and 98% relative humidity. The conductivity of CDP/ZrO2 was observed to be 1.8 × 10⁻² S cm−1 for 2000 min in confined nature.24 The conductivity value of CDP/NaH2PO4/SiO2 was found to be 0.9 × 10⁻² s cm−1 at 150 °C.25 The proton conductivity of MPOPS-1 was found to be 1.49 × 10⁻⁵ and 3.07 × 10⁻² s cm at a temperature of 350 K under anhydrous and humid conditions, respectively.26 The conductivity of solid acids is increased by doping highly dispersed inert oxides like ZrO2, TiO2, SiO2, and Al2O3, which is significantly higher than that of the pure CDP.27 ZrO2 is a particular oxide due to its ability to absorb and retain water at elevated temperatures due to the effect of mechanical stabilization.28,29 This work is devoted to studying the structural, conductivity, and thermal properties of composite electrolytes CDP/SDP/ZrO2. For this, XRD, FESEM, EDX, TGA, DTA, FTIR, and conductivity measurement studies have been performed.2. Materials and methods
CDP was prepared according to the following reaction by mixing the combined reagents Cs2CO3 and H3PO4 in a molar ratio of 1![[thin space (1/6-em)]](https://www.rsc.org/images/entities/char_2009.gif) :
:![[thin space (1/6-em)]](https://www.rsc.org/images/entities/char_2009.gif) 2
2| Cs2CO3 + 2H3PO4 → 2CsH2PO4 + CO2 + H2O |
CDP was mixed mechanically with zirconium dioxide for CsH2PO4/ZrO2 composites. Now the solid acid CsH2PO4/ZrO2 was mixed with NaH2PO4 in a weight ratio by mechanical grinding. The mixture CDP/SDP/ZrO2 was dried at 150 °C for 14 h. Then, the resultant precipitate was ground to form a fine solid acid composite powder. The mixed powder was pressed for 15 minutes at 5–7 tons and room temperature to form pellets of 4 mm thickness and 12 mm diameter. The electrodes on the pellets were made of a high vacuum coating unit (Hind High Vacuum-12A 4D) and then sintered at 90 °C for 2 h. To confirm the identity of the samples, powder X-ray diffraction (XRD) patterns were collected in the 2θ range of 20–60 °C using a Bruker D8 Advance diffractometer. The data of EDX and FESEM were recorded using a FESEM-Quanta 200 FEG. The composite decomposition was identified by measuring the mass loss by thermogravimetric analysis (TGA), and differential thermal analysis (DTA) using the SII 6300 XStar with respect to the temperature. TGA/DTA was performed using the powder samples under an airflow of 200 mL min−1 at a rate of 10 °C min−1 from 35 to 500 °C. The impedance data were plotted on the real and imaginary axes to determine the proton conductivity value. The pellets were used to measure the ionic conductivity from room temperature to 300 °C. An LCR meter (Hikoki 3532-50) was used to measure the conductivity in the frequency range of 50 Hz to 4 MHz. The ionic conductivity value was calculated from the resistance value R plotted in the Arrhenius form using the following formula:
| σ (S cm−1) = L (cm)/A (cm2) R (Ω) |
3. Results and discussion
3.1. X-Ray diffraction (XRD)
The phase transitions in the range of 2θ = 20° to 60° of CDP, SDP, ZrO2, and their composites were analyzed by XRD as given in Fig. 1.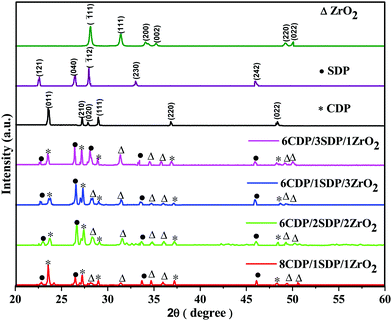 | ||
| Fig. 1 X-ray diffraction patterns of CDP, SDP and ZrO2 and their composites as prepared at room temperature. | ||
The sharp peaks appear at 23.54°, 27.13°, 27.90°, 28.96°, 36.73°, and 48.36° in the XRD spectra of CDP which were obtained similarly to JCPDS-761836. The peak at 23.54° corresponds to the Miller indices of the (011) plane which shows the monoclinic phase space group P21/m for CDP. The monoclinic phase structure of CDP was found to exist from room temperature to 235 °C and the cubic phase from 240 to 280 °C. The partial dehydration of CDP occurred between the temperatures of 250 °C and 310 °C that produces Cs2H2P2O7 and CsPO3, respectively.30 ZrO2 and SDP were added to the solid acid composite to slow down the dehydration reaction. The peaks in the XRD of SDP were at 22.47°, 26.45°, 27.90°, 33.04°, and 45.93°, as detected using JCPDS-840112 with space group P21/c. ZrO2 has peaks at 28.10°, 31.30°, 34.10°, 35.18°, 49.24°, and 50.01° with space group P21/m using JCPDS-371484. All the peak values of the composites were observed to be similar to those of CDP, SDP, and ZRO2, which agree well with the JCPDS data. From the XRD results, it was found that CDP, SDP, and ZrO2 have a monoclinic phase at room temperature. Tables 1 and 2(a–c) show the lattice parameters of the XRD and calculated values of the sharp peaks. The observed and calculated values confirm the XRD data and provide a reasonable true structure for all materials.
| Material | JCPDS lattice parameters (Å) | CDP | SDP | ZrO2 | 8CDP/1SDP/1ZrO2 | 6CDP/2SDP/2ZrO2 | 6CDP/1SDP/3ZrO2 | 6CDP/3SDP/1ZrO2 |
|---|---|---|---|---|---|---|---|---|
| CDP | a = 7.9 | 7.533 | — | — | 7.530 | 7.561 | 7.518 | 7.555 |
| b = 6.368 | 6.397 | — | — | 6.304 | 6.297 | 6.247 | 6.346 | |
| c = 4.872 | 4.698 | — | — | 4.992 | 4.622 | 4.615 | 4.676 | |
| SDP | a = 6.808 | — | 6.788 | — | 6.924 | 6.683 | 6.620 | 6.613 |
| b = 13.49 | — | 13.468 | — | 13.449 | 13.495 | 13.413 | 13.47 | |
| c = 7.331 | — | 7.335 | — | 7.353 | 7.312 | 7.342 | 7.370 | |
| ZrO2 | a = 5.312 | — | — | 5.243 | 5.218 | 5.243 | 5.267 | 5.295 |
| b = 5.212 | — | — | 5.196 | 5.156 | 5.277 | 5.190 | 5.217 | |
| c = 5.147 | — | — | 5.091 | 5.061 | 5.055 | 5.077 | 5.096 |
| Material | hkl | Peak position (2θ) | FWHM | Crystallite size (nm) | Microstrain ε × 10−4 | Lattice spacing (Å) |
|---|---|---|---|---|---|---|
| (a) | ||||||
| CDP | 400 | 48.328 | 0.279 | 31.132 | 11.134 | 1.881 |
| 8CDP/1SDP/1ZrO2 | 400 | 48.307 | 0.272 | 32.005 | 10.83 | 1.882 |
| 6CDP/2SDP/2ZrO2 | 400 | 48.091 | 0.186 | 46.729 | 7.417 | 1.890 |
| 6CDP/1SDP/3ZrO2 | 400 | 48.387 | 0.122 | 70.896 | 4.889 | 1.879 |
| 6CDP/3SDP/1ZrO2 | 400 | 48.295 | 0.306 | 28.420 | 12.196 | 1.882 |
| (b) | ||||||
| SDP | 121 | 22.57896302 | 0.191 | 42.252 | 8.20382 | 3.934 |
| 002 | 24.2483439 | 0.261 | 31.034 | 11.16936 | 3.667 | |
| 210 | 27.06727031 | 0.161 | 50.585 | 6.85241 | 3.291 | |
| 8CDP/1SDP/1ZrO2 | 121 | 22.81902 | 0.155 | 51.974 | 6.66928 | 3.893 |
| 002 | 24.18712 | 0.105 | 76.835 | 4.51138 | 3.676 | |
| 210 | 27.23875 | 0.134 | 60.697 | 5.71086 | 3.271 | |
| 6CDP/2SDP/2ZrO2 | 121 | 22.99207 | 0.377 | 21.465 | 16.14837 | 3.865 |
| 002 | 24.3261 | 0.461 | 17.611 | 19.68215 | 3.656 | |
| 210 | 27.13686 | 0.191 | 42.753 | 8.10771 | 3.283 | |
| 6CDP/1SDP/3ZrO2 | 121 | 22.92008064 | 0.410 | 19.727 | 17.5708 | 3.877 |
| 002 | 24.22322418 | 0.201 | 40.389 | 8.58236 | 3.671 | |
| 210 | 26.91152218 | 1.06 | 7.703 | 44.99846 | 3.31 | |
| 6CDP/3SDP/1ZrO2 | 121 | 22.59881374 | 0.241 | 33.513 | 10.34301 | 3.931 |
| 002 | 24.12016947 | 0.416 | 19.481 | 17.79291 | 3.686 | |
| 210 | 27.19122348 | 0.132 | 61.627 | 5.62465 | 3.276 | |
| (c) | ||||||
| ZrO2 | 120 | 38.542 | 0.238 | 35.240 | 9.836 | 2.333 |
| 8CDP/1SDP/1ZrO2 | 120 | 38.586 | 0.547 | 15.381 | 22.535 | 2.331 |
| 6CDP/2SDP/2ZrO2 | 120 | 38.701 | 0.310 | 27.140 | 12.772 | 2.324 |
| 6CDP/1SDP/3ZrO2 | 120 | 38.581 | 0.371 | 22.656 | 15.299 | 2.331 |
| 6CDP/3SDP/1ZrO2 | 120 | 38.469 | 0.444 | 18.945 | 18.296 | 2.338 |
The intensity of the peaks decreases by changing the concentration of the additives of SDP and ZrO2, which suggests an increase in the degree of amorphousity in the composites. This phenomenon leads to ion diffusivity with ionic conductivity and stability. The XRD patterns confirm the crystalline structure of CDP, SDP, and ZrO2 and their composites.
3.2. Fourier transform infrared spectroscopy (FTIR)
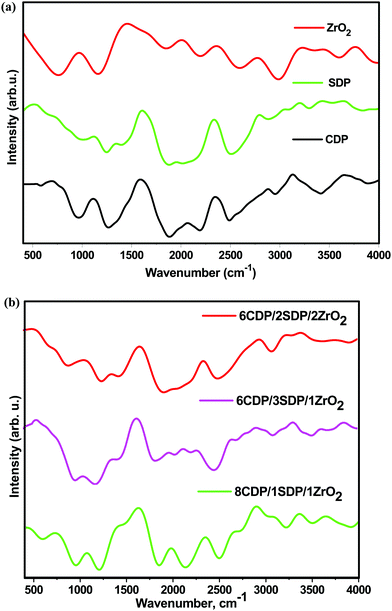
The IR spectra were recorded in the range of 400 cm−1 to 4000 cm−1 which are shown in Fig. 2(a and b).The IR spectra of CDP and SDP showed the ABC bonds of OH at 2366 and 2333 cm−1, respectively. The PO4 components were assigned to the IR spectra at 900 to 1300 cm−1 as the strong absorption bands. The P–O2 asymmetric stretching modes in H2PO4− anions were observed at 1117 cm−1 and 1105 cm−1. The well-separated peaks of CDP, SDP, and composites as observed in the IR spectra are given in Table 3.
| Material | O–H stretching Medium sharp 3584–3700 | O–H stretching intermolecular bonded | ABC bonds of OH | P–O2 stretching (asymmetric) | |
|---|---|---|---|---|---|
| Strong bond 3550–3200 | Weak bond 3200–2700 | ||||
| CDP | 3672 | 3386 | 3148 | 2366 | 1117 |
| SDP | 3610 | 3419 | 3191 | 2333 | 1105 |
| 8CDP/1SDP/1ZrO2 | 3632 | 3369 | 2941 | 2341 | 1053 |
| 6CDP/1SDP/3ZrO2 | 3624 | 3357 | 2912 | 2349 | 1072 |
| 6CDP/2SDP/2ZrO2 | 3610 | 3387 | 2910 | 2343 | 1039 |
No obvious change was observed in the IR spectra pattern of the composites when SDP was added, although this indicates a slight increase in the band frequency, lengthening of P–O–H, and shortening of P–O bonds which show an increase in conductivity.31 A decrease in the intensity of the composites was observed with the ZrO2 increase that led to an increase in the amorphous region in the mixed electrolytes which was in favor of the XRD results. The IR spectra of the composites provided significant changes in chemical composition, functionalization, and other changes.
3.3. Thermal analysis – TGA/DTA
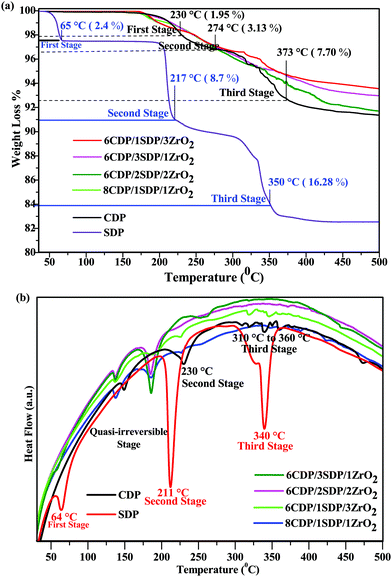
The residual water content in the powder was studied by TGA/DTA analyses as shown in Fig. 3(a) and (b). The main weight losses of the powder were investigated at 10 °C min−1 under an air atmosphere up to 500 °C. The total weight loss for CDP dehydration was found to be 8.73% at 500 °C, which is comparable to the theoretical value of CDP.32 CDP showed two endothermic transitions at 150 and 230 °C.33 The weight loss of CDP was 1.95%, 3.13%, and 7.70% at 230 °C, 274 °C, and 373 °C, respectively. CDP was thermally stable up to 230 °C and indicates the endothermic effect associated with the superprotonic phase transition, which supports the conductivity measurement.SDP showed a weight loss of 2.4%, 8.7%, and 16.28% at 65 °C, 217 °C, and 350 °C temperatures, respectively. SDP exhibited dehydration at several temperatures between 60 °C and 360 °C. The 60 °C condition in the SDP defines the presence of water molecules in it. SDP underwent dehydration in the other two stages: the first was with a 9% weight loss at 220 °C and the second at 350 °C with a 17% weight loss as shown in TGA. Therefore, adding SDP to the composites at low temperatures resulted in dehydration compared to pure CDP.34
The endothermic events of pure CDP in the DTA curve were found at the temperatures of 150 °C, 230 °C, 310 °C, 320 °C, 340 °C, 350 °C, 360 °C, and 375 °C, respectively, which are shown in Fig. 3(b). The first stage in CDP was semi-irreversible at 150 °C due to the presence of CsH5(PO4)2 and ferroelectric transition takes place.35 All composites show similar endothermic events for CDP in DTA.
The endothermic effect in 6CDP/2SDP/2ZrO2 was found to be invisible at 229 °C due to the transition of CDP. Three endothermic events of SDP in DTA were observed at 64 °C, 211 °C, and 340 °C temperatures. The TGA/DTA results for the composites indicate an improvement in the thermal stability of the CDP.
3.4. Conductivity
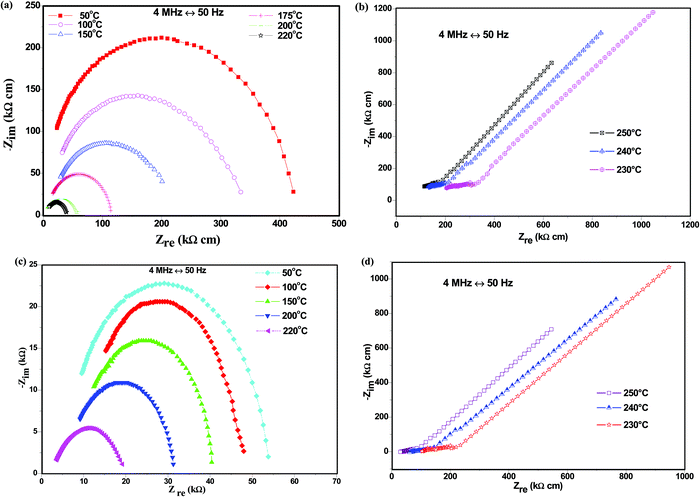
The electrical behavior of CDP and its composites was studied using the impedance spectroscopy technique as Nyquist plots, as shown in Fig. 4(a–d).The appearance of semi-circular arcs was observed below the transition temperature due to the weakening of the grain boundaries, representing the processes at the electrolyte/electrode interface of the system.36 The straight line represents an increase in ionic conductivity when heated above the transition temperature due to the monoclinic to the cubic phase transition, as observed in the undoped compound CsH2PO4. The arc radius decreases with the increasing temperature due to electrode resistance, which shows an active thermal conductivity mechanism as shown in Fig. 4(b). The ionic conductivity of CDP was found to be maximum due to the high phosphorus content at the transition temperature which is determined by O–H concentration and free hydrogen bonding.37 This result indicates an increase in the conductivity of CDP. Fig. 4(c and d) shows the impedance spectra below and above the transition temperatures for 8CDP/1SDP/1ZrO2. The spectrum of 8CDP/1SDP/1ZrO2 consists of a high-frequency region due to ionic conduction and a low-frequency region bounded by a straight line due to the electrode effect. The impedance spectra represent a high radius arc below the transition temperatures due to the strong hydrogen bond.38 A decrease in the arc was observed due to the decrease in the resistive behavior of the material with the increase in the temperature as shown in Fig. 4(d). We have conducted analyses on the other composites and found the same behaviors. The impedance spectra of CDP and its composites exhibited almost the same characteristic that was also observed in the conductivity graph.
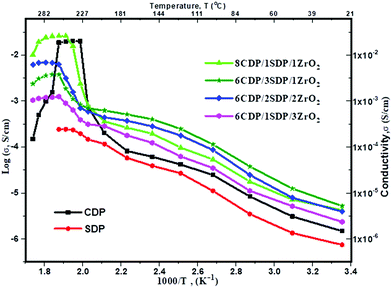
The conductivities of CDP, SDP, and their composites at different temperatures are presented in Fig. 5 and the values are given in Table 4.
| Material | Highest conductivity value, σ (S cm−1) | Temperature during conductivity measurement (°C) |
|---|---|---|
| CDP33 | 2.2 × 10⁻² S cm−1 | 240 |
| CDP (pure) | 2.008 × 10⁻² S cm−1 | 240 |
| SDP (pure) | 2.43 × 10⁻⁴ S cm−1 | 250 |
| 8CDP/1SDP/1ZrO2 | 2.23 × 10⁻² S cm−1 | 250 |
| 8CDP/1SDP/1ZrO2 | 2.23 × 10⁻² S cm−1 | 260 |
| CDP (pure) | 1.87 × 10⁻² S cm−1 | 260 |
| 6CDP/3SDP/1ZrO2 | 3.76 × 10⁻³ S cm−1 | 260 |
| SDP (pure) | 2.42 × 10⁻⁴ S cm−1 | 260 |
| CDP (pure) | 1.94 × 10⁻² S cm−1 | 250 |
| 6CDP/3SDP/1ZrO2 | 1.86 × 10⁻³ S cm−1 | 250 |
| 8CDP/1SDP/1ZrO2 | 1.57 × 10⁻² S cm−1 | 240 |
| 6CDP/3SDP/1ZrO2 | 1.11 × 10⁻³ S cm−1 | 240 |
| SDP (pure) | 2.35 × 10⁻⁴ S cm−1 | 240 |
| CDP (pure) | 2.001 × 10⁻² S cm−1 | 230 |
| 8CDP/1SDP/1ZrO2 | 2.38 × 10⁻³ S cm−1 | 230 |
| 6CDP/3SDP/1ZrO2 | 8.42 × 10⁻⁴ S cm−1 | 230 |
| SDP (pure) | 1.96 × 10⁻⁴ S cm−1 | 230 |
| 8CDP/1SDP/1ZrO2 | 7.84 × 10⁻⁴ S cm−1 | 220 |
| CDP (pure) | 7.44 × 10⁻⁴ S cm−1 | 220 |
| 6CDP/3SDP/1ZrO2 | 6.93 × 10⁻⁴ S cm−1 | 220 |
| SDP (pure) | 1.46 × 10⁻⁴ S cm−1 | 220 |
| 6CDP/3SDP/1ZrO2 | 6.20 × 10⁻⁴ S cm−1 | 200 |
| 8CDP/1SDP/1ZrO2 | 3.61 × 10⁻⁴ S cm−1 | 200 |
| CDP (pure) | 2.03 × 10⁻⁴ S cm−1 | 200 |
| SDP (pure) | 1.16 × 10⁻⁴ S cm−1 | 200 |
| 6CDP/3SDP/1ZrO2 | 4.02 × 10⁻⁴ S cm−1 | 150 |
| 8CDP/1SDP/1ZrO2 | 1.96 × 10⁻⁴ S cm−1 | 150 |
| CDP (pure) | 6.17 × 10⁻⁵ S cm−1 | 150 |
| SDP (pure) | 3.91 × 10⁻⁵ S cm−1 | 150 |
The conductivities of CDP, SDP, and their composites were obtained between 25 °C and 300 °C temperatures. The conductivity value of CDP was found to be 2.008 × 10⁻² s cm−1 at 240 °C, which is compared with the other results.39 SDP is known for its low conductivity which was measured to be 2.43 × 10⁻⁴ s cm−1 at 250 °C. The range of conductivity values for all composites was observed from 7.88 × 10⁻⁶ s cm−1 to 2.23 × 10⁻² s cm−1. 8CDP/1SDP/1ZrO2 shows the highest conductivity from other composites which was found to be 2.23 × 10⁻² S cm−1 at 260 °C. We also found that the conductivity of solid acid composites at a high temperature slightly increases due to the hydrophobicity and surface area of ZrO2.40 The conductivity of CDP/SDP/ZrO2 increased to 1.5 orders of magnitude in the LT region and high temperature which was due to the structural disorder and deformation of the cation shape of ZrO2.31
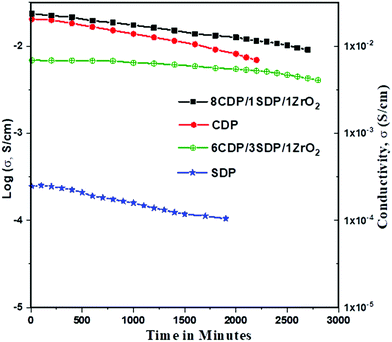
Furthermore, we investigated the time dependence of the ionic conductivity of CDP, SDP, and 8CDP/1SDP/1ZrO2 under high hermetically confined conditions. The ionic conductivity of CDP is stable above 230 °C for long periods and composite 8CDP/1SDP/1ZrO2 showed a high stable conductivity of 2.23 × 10⁻² s cm−1 for 42 hours as shown in Fig. 6, which is comparable to the other results.3,10,29,41,42
To our knowledge, this is the first time that CDP, SDP, and ZrO2 composites were observed for the stability and confined protonic conductivity of solid acid fuel cell electrolytes. We observed that adding SDP increases the conductivity and stability at lower temperatures of the composites. The conductivity results are comparable with the XRD and TGA/DTA data.
3.5. EESEM and EDX
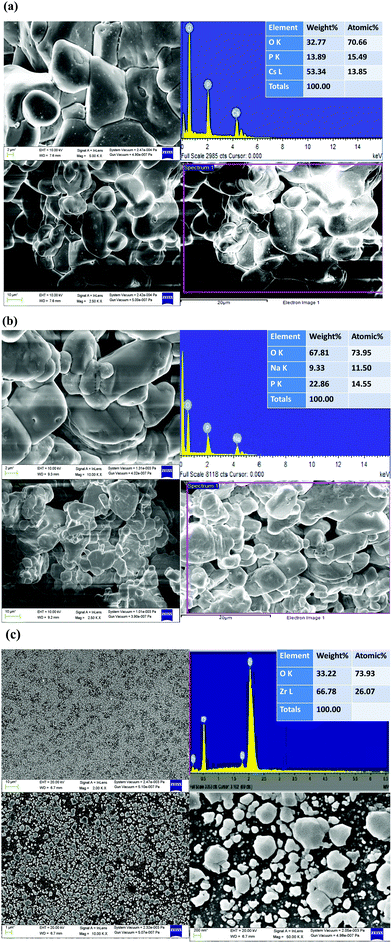
The FESEM image shows the surface morphological investigations, and EDX spectroscopy was used to identify the chemical compositions of the material as shown in Fig. 7(a–c).The pure CDP and SDP phases appeared as porous powder-like crystalline networks whereas the crystalline groups of phosphates appeared to cling to ZrO2 inclusions as binders. A dense layer of the phosphate electrolyte was obtained from the doped oxide, which is used in the fuel cell.19 The obtained CDP material was composed of particles that are heterogeneous and spherical in shape.43 The chemical composition atomic % of Cs with P and O, Na with P and O, and Zr with O was calculated by EDX with their respective concentrations without any impurities. We found that the ion exchange reaction between CDP, SDP, and ZrO2 produces high proton conductivity by mechanical milling. The composition corresponded to that of CDP, SDP, and ZrO2 according to the complex analysis of TGA, DTA, and EDX which is by the changes in the XRD patterns.
4. Conclusions
The composite electrolytes of CDP in weight ratio were analyzed within the intermediate temperature range. The solid solutions of CDP and its composites were confirmed by XRD at room temperature. The CDP and SDP dehydration peaks were observed up to 280 and 340 °C, respectively, as discussed in TGA and DTA, indicating that SDP is thermally unstable at higher temperatures. Our findings show that the superprotonic phase of CDP was stable using SDP at high temperatures. The superprotonic conduction nature was confirmed for CDP and its composites from Nyquist plots. A significant improvement in the thermal stability of the composites was shown by TGA/DTA. The range of conductivity values for composites was from 7.88 × 10⁻⁶ s cm−1 to 2.60 × 10⁻² s cm−1, which increased to 1.5 orders of magnitude in lower and higher temperatures. 8CDP/1SDP/1ZrO2 was found to be a promising material that showed the highest value of conductivity and stability in all composites which is comparable to those obtained by N. Mohammad et al.,25 D. Singh et al.,24 J. H. Leal et al.,10 and A. H. Jensen et al., respectively.19 The time-dependent conductivity of 8CDP/1SDP/1ZrO2 was achieved in 42 hours. The mechanism of proton transport within the composites was confirmed by FTIR analysis. Our results open up new possibilities for CDP and other solid acids that are attractive for use in phosphoric acid fuel cells.Conflicts of interest
There are no conflicts to declare.Acknowledgements
The authors thank the Materials Science Research Lab, Department of Physics, Gurukul Kangri (Deemed to be University), Haridwar (India), for providing facilities for the research work.References
- P. Bretzler, K. Köhler, A. V. Nikiforov, E. Christensen, R. W. Berg and N. J. Bjerrum, Efficient water splitting electrolysis on a platinum-free tungsten carbide electrocatalyst in molten CsH2PO4 at 350–390 °C, Int. J. Hydrogen Energy, 2020, 45, 21262–21272, DOI:10.1016/j.ijhydene.2020.05.145.
- M. Z. Iqbal, Rafiuddin, Preparation, characterization, electrical conductivity and dielectric studies of Na2SO4 and V2O5 composite solid electrolytes, Meas.: J. Int. Meas. Confed., 2016, 81, 102–112, DOI:10.1016/j.measurement.2015.12.008.
- C. E. Botez, I. Martinez, A. Price, H. Martinez and J. H. Leal, Superprotonic CsH2PO4 in dry air, J. Phys. Chem. Solids, 2019, 129, 324–328, DOI:10.1016/j.jpcs.2019.02.001.
- D. Aili, Y. Gao, J. Han and Q. Li, Acid-base chemistry and proton conductivity of CsHSO4, CsH2PO4 and their mixtures with N-heterocycles, Solid State Ionics, 2017, 306, 13–19, DOI:10.1016/j.ssi.2017.03.012.
- R. Kikuchi, A. Ogawa, T. Matsuoka, A. Takagaki, T. Sugawara and S. T. Oyama, Interfacial conduction mechanism of cesium hydrogen phosphate and silicon pyrophosphate composite electrolytes for intermediate-temperature fuel cells, Solid State Ionics, 2016, 285, 160–164, DOI:10.1016/j.ssi.2015.10.008.
- A. D. Price, A. C. Aguilar, C. E. Botez and C. Li, Optical second harmonic generation imaging and X-ray diffraction of Cs1−xRbxH2PO4 proton conductor series, J. Appl. Phys., 2020, 127, 193105, DOI:10.1063/5.0006922.
- H. Nakaya, M. Iwasaki, T. H. de Beauvoir and C. A. Randall, Applying cold sintering process to a proton electrolyte material: CsH2PO4, J. Eur. Ceram. Soc., 2019, 39, 396–401, DOI:10.1016/j.jeurceramsoc.2018.09.001.
- G. Kim, J. M. Griffin, F. Blanc, S. M. Haile and C. P. Grey, Characterization of the dynamics in the protonic conductor CsH2PO4 by 17O solid-state NMR spectroscopy and first-principles calculations: Correlating phosphate and protonic motion, J. Am. Chem. Soc., 2015, 137, 3867–3876, DOI:10.1021/jacs.5b00280.
- L. Navarrete, A. Andrio, S. Escolástico, S. Moya, V. Compañ and J. M. Serra, Protonic conduction of partially-substituted CsH2PO4 and the applicability in electrochemical devices, Membranes, 2019, 9, 1–11, DOI:10.3390/membranes9040049.
- J. H. Leal, H. Martinez, I. Martinez, A. D. Price, A. G. Goos and C. E. Botez, Stability of the superprotonic conduction of (1-x)CsH2PO4/xSiO2 (0 ≤ x ≤ 0.3) composites under dry and humid environments, Mater. Today Commun., 2018, 15, 11–17, DOI:10.1016/j.mtcomm.2018.02.021.
- A. A. Gaydamaka, V. G. Ponomareva and I. N. Bagryantseva, Phase composition, thermal and transport properties of the system based on the mono and dihydrogen phosphates of rubidium, Solid State Ionics, 2019, 329, 124–130, DOI:10.1016/j.ssi.2018.12.005.
- B. Merinov, Proton transport mechanism, and pathways in the superprotonic phase of CsHSO4 from experiment and theory, Solid State Ionics, 2012, 213, 72–75, DOI:10.1016/j.ssi.2011.07.012.
- V. G. Ponomareva and I. N. Bagryantseva, The influence of Cs2HPO4·H2O impurity on the proton conductivity and thermal properties of CsH2PO4, Solid State Ionics, 2019, 329, 90–94, DOI:10.1016/j.ssi.2018.11.021.
- Y. Taninouchi, N. Hatada, T. Uda and Y. Awakura, Phase Relationship of CsH2PO4–CsPO3 System and Electrical Properties of CsPO3, J. Electrochem. Soc., 2009, 156, B572, DOI:10.1149/1.3086755.
- S. Yoshimi, T. Matsui, R. Kikuchi and K. Eguchi, Temperature and humidity dependence of the electrode polarization in intermediate-temperature fuel cells employing CsH2PO4/SiP2O7-based composite electrolytes, J. Power Sources, 2008, 179, 497–503, DOI:10.1016/j.jpowsour.2008.01.003.
- C. E. Botez, J. D. Hermosillo, J. Zhang, J. Qian, Y. Zhao, J. Majzlan, R. R. Chianelli and C. Pantea, High-temperature phase transitions in CsH2PO4 under ambient and high-pressure conditions: A synchrotron X-ray diffraction study, J. Chem. Phys., 2007, 127, 194701, DOI:10.1063/1.2804774.
- G. Qing, R. Kikuchi, A. Takagaki, T. Sugawara and S. T. Oyama, CsH2PO4/Polyvinylidene Fluoride Composite Electrolytes for Intermediate Temperature Fuel Cells, J. Electrochem. Soc., 2014, 161, 451–457, DOI:10.1149/2.052404jes.
- G. Qing, R. Kikuchi, A. Takagaki, T. Sugawara and S. T. Oyama, CsH2PO4/Epoxy Composite Electrolytes for Intermediate Temperature Fuel Cells, Electrochim. Acta, 2015, 169, 219–226, DOI:10.1016/j.electacta.2015.04.089.
- A. H. Jensen, Q. Li, E. Christensen and N. J. Bjerrum, Intermediate Temperature Fuel Cell Using CsH2PO4/ZrO2 -Based Composite Electrolytes, J. Electrochem. Soc., 2014, 161, F72–F76, DOI:10.1149/2.063401jes.
- T. Rhimi, G. Leroy, B. Duponchel, K. Khirouni, S. Guermazi and M. Toumi, Electrical conductivity and dielectric analysis of NaH2PO4 compound, Ionics, 2018, 24, 3507–3514, DOI:10.1007/s11581-018-2494-6.
- X. Zhang, C. Liu, W. Shen, Y. Ren, D. Li and H. Yang, Solubility and physic-chemical properties of NaH2PO4 in phosphoric acid, sodium chloride and their mixture solutions at T = (298.15 and 313.15) K, J. Chem. Thermodyn., 2015, 90, 185–192, DOI:10.1016/j.jct.2015.06.038.
- O. Rybalkina, K. Tsygurina, E. Melnikova, S. Mareev, I. Moroz, V. Nikonenko and N. Pismenskaya, Partial fluxes of phosphoric acid anions through anion-exchange membranes in the course of NaH2PO4 solution electrodialysis, Int. J. Mol. Sci., 2019, 20, 3593, DOI:10.3390/ijms20143593.
- N. Mohammad, A. B. Mohamad, A. A. H. Kadhum and K. S. Loh, Optimization of the composition and process parameter of CsH2PO4/NaH2PO4/SiO2 solid acid composite via the Taguchi method, Malaysian J. Anal. Sci., 2019, 23, 109–115, DOI:10.17576/mjas-2019-2301-13.
- D. Singh, P. Kumar, J. Singh, D. Veer, A. Kumar and R. S. Katiyar, Structural, thermal and electrical properties of composites electrolytes (1−x)CsH2PO4/xZrO2 (0 ≤ x ≤ 0.4) for fuel cell with advanced electrode, SN Appl Sci., 2021, 3, 1–7, DOI:10.1007/s42452-020-04097-9.
- N. Mohammad, A. B. Mohamad, A. A. H. Kadhum and K. S. Loh, Effect of silica on the thermal behaviour and ionic conductivity of mixed salt solid acid composites, J. Alloys Compd., 2017, 690, 896–902, DOI:10.1016/j.jallcom.2016.08.188.
- P. Bhanja, A. Palui, S. Chatterjee, Y. V. Kaneti, J. Na, Y. Sugahara, A. Bhaumik and Y. Yamauchi, Crystalline Porous Organic Polymer Bearing -SO3H Functionality for High Proton Conductivity, ACS Sustainable Chem. Eng., 2020, 8, 2423–2432, DOI:10.1021/acssuschemeng.9b06234.
- A. I. Baranov, V. V. Grebenev, A. N. Khodan, V. V. Dolbinina and E. P. Efremova, Optimization of superprotonic acid salts for fuel cell applications, Solid State Ionics, 2005, 176, 2871–2874, DOI:10.1016/j.ssi.2005.09.018.
- C. Gautam, J. Joyner, A. Gautam, J. Rao and R. Vajtai, Zirconia based dental ceramics: structure, mechanical properties, biocompatibility and applications, Dalton Trans., 2016, 45, 19194–19215, 10.1039/c6dt03484e.
- M. F. R. P. Alves, S. Ribeiroa, P. A. Suzuki, K. Strecker and C. dos Santosc, Effect of Fe2O3 addition and sintering temperature on mechanical properties and translucence of zirconia dental ceramics with different Y2O3 content, Mater Res., 2021, 24(2) DOI:10.1590/1980-5373-MR-2020-0402.
- J. Otomo, N. Minagawa, C. J. Wen, K. Eguchi and H. Takahashi, Protonic conduction of CsH2PO4 and its composite with silica in dry and humid atmospheres, Solid State Ionics, 2003, 156, 357–369, DOI:10.1016/S0167-2738(02)00746-4.
- V. V. Martsinkevich and V. G. Ponomareva, Double salts Cs1–XMxH2PO4 (M = Na, K, Rb) as proton conductors, Solid State Ionics, 2012, 225, 236–240, DOI:10.1016/j.ssi.2012.04.016.
- T. Anfimova, A. H. Jensen, E. Christensen, J. O. Jensen, N. J. Bjerrum and Q. Li, CsH2PO4/NdPO4 Composites as Proton Conducting Electrolytes for Intermediate Temperature Fuel Cells, J. Electrochem. Soc., 2015, 162, 436–441, DOI:10.1149/2.0671504jes.
- S. Hosseini, A. B. Mohamad, A. H. KaHum and W. R. Wan Daud, Thermal analysis of CsH2PO4 nanoparticles using surfactants CTAB and F-68, J. Therm. Anal. Calorim., 2010, 99, 197–202, DOI:10.1007/s10973-009-0132-2.
- Z. Li and T. Tang, High-temperature thermal behaviors of XH2PO4 (X = Cs, Rb, K, Na) and LiH2PO3, Thermochim. Acta, 2010, 501, 59–64, DOI:10.1016/j.tca.2010.01.010.
- G. V. Lavrova and V. G. Ponomareva, Intermediate-temperature composite proton electrolyte CsH5(PO4)2/SiO2: Transport properties versus oxide characteristic, Solid State Ionics, 2008, 179, 1170–1173, DOI:10.1016/j.ssi.2008.01.003.
- V. G. Ponomareva and E. S. Shutova, Electrical conductivity and structural properties of proton electrolytes based on CsH2PO4 and silicophosphate matrices with low phosphorus content, Inorg. Mater., 2014, 50, 1056–1062, DOI:10.1134/S0020168514100136.
- A. Matsuda, T. Kanzaki, Y. Kotani, M. Tatsumisago and T. Minami, Proton conductivity and structure of phosphosilicate gels derived from tetraethoxysilane and phosphoric acid or triethylphosphate, Solid State Ionics, 2001, 139, 113–119, DOI:10.1016/S0167-2738(00)00819-5.
- A. A. Gaydamaka, I. N. Bagryantseva and V. G. Ponomareva, Thermal properties, proton conductivity and vibration study of Rb2HPO4·2H2O, J. Therm. Anal. Calorim., 2018, 133, 1121–1127, DOI:10.1007/s10973-018-7402-9.
- S. M. Haile, C. R. I. Chisholm, K. Sasaki, D. A. Boysen and T. Uda, Solid acid proton conductors: from laboratory curiosities to fuel cell electrolytes, Faraday Discuss., 2006, 134, 17–39, 10.1039/B604311A.
- N. Mohammad, A. B. Mohamad, A. A. H. Kadhum and L. K. Shyuan, Conductivity and thermal stability of solid acid composites CsH2PO4/NaH2PO4/SiO2, Malaysian J. Anal. Sci., 2016, 20, 633–641, DOI:10.17576/mjas-2016-2003-24.
- S. Wang, J. Otomo, M. Ogura, C. J. Wen, H. Nagamoto and H. Takahashi, Preparation and characterization of proton-conducting CsHSO4-SiO2 nanocomposite electrolyte membranes, Solid State Ionics, 2005, 176, 755–760, DOI:10.1016/j.ssi.2004.10.013.
- D. Singh, J. Singh, P. Kumar, D. Veer, D. Kumar, R. S. Katiyar, A. Kumar and A. Kumar, The Influence of TiO2 on the Proton Conduction and Thermal Stability of CsH2PO4 Composite Electrolytes, S. Afr. J. Chem. Eng., 2021, 37, 227–236, DOI:10.1016/j.sajce.2021.06.006.
- I. N. Bagryantseva, A. A. Gaydamaka and V. G. Ponomareva, Intermediate temperature proton electrolytes based on cesium dihydrogen phosphate and Butvar polymer, Ionics, 2020, 26, 1813–1818, DOI:10.1007/s11581-020-03505-9.
| This journal is © The Royal Society of Chemistry 2022 |

