 Open Access Article
Use of open-source software platform to develop dashboards for control and automation of flow chemistry equipment†
C. Johan
van der Westhuizen
a,
Jurie
du Toit
b,
Nicole
Neyt
a,
Darren
Riley
 c and
Jenny-Lee
Panayides
 *a
*a
aCouncil for Scientific and Industrial Research (CSIR), Future Production: Chemicals Cluster, Meiring Naude Road, Brummeria, Pretoria, South Africa. E-mail: jpanayides@csir.co.za
bCouncil for Scientific and Industrial Research (CSIR), Future Production: Manufacturing Cluster, Meiring Naude Road, Brummeria, Pretoria, South Africa
cDepartment of Chemistry, Faculty of Natural and Agricultural Sciences, University of Pretoria, Lynnwood Road, Pretoria, South Africa
First published on 21st July 2022
Abstract
We report the development of an open-source software approach to monitor and control flow chemistry reactors from any smart device utilising Node-RED which lowers the expertise required to expand the system further and automate other equipment. The software was demonstrated through the control and automation of flow equipment from Uniqsis with the dashboard server run on a low-cost Raspberry Pi. Parameters of the equipment can be saved to a database for review in real-time or at a later stage. The dashboard control platform was demonstrated by performing the allylation of isovanillin in a semi-autonomous closed-loop optimisation fashion using Summit for the optimisation algorithm. The space time yield (STY) was optimised for this reaction using a single-objective Bayesian optimisation (SOBO) approach. The best STY result of 791 g dm−3 h−1 was achieved with the experimental conditions of 77.3 °C for the reactor column, a residence time of 4 min, with 1.005 equivalence of allyl bromide. All the software utilised in this paper was open-source, a tutorial-based approach to developing the program is included in the paper demonstrating the software capabilities.
Introduction
The Fourth Industrial Revolution (4IR) is leading to the rapid adaption and advancement of traditional manufacturing approaches by utilising increased automation, improved communication and digitalisation of equipment for greater control.1 Automation in synthetic laboratories is arguably still in its infancy and has not been adopted by the wider research community yet. This is largely due to the associated high cost of equipment, proprietary software and expertise required.Flow chemistry has developed rapidly over the last few decades allowing researchers to have greater control over reaction conditions and this improved control has allowed the development of precise protocols for the control of sensitive reactions.2 Typically, vendors only provide software for control and automation of equipment which is being supplied. This software usually only allows limited integration with equipment from other manufactures. Currently, there is a growing need for both universal and remote-control systems which through automation can help by improving workflow, increasing safety, facilitating faster development times and enhancing productivity.
Thus, there is great potential in developing an open-source platform for integrated control of equipment from different manufactures. Several research groups have reported the development of in-house software for the control of flow chemistry equipment including LeyLab,3 OpenFlowChem,4 Rxn Rover,5 the radial synthesiser6 and chemputer.7 In addition, the utilisation of bespoke software has also been reported for reaction optimisation and analytics automation under flow conditions.8–10 Critically, these systems tend to suffer from one or more of the following issues:
(i) Use of proprietary software packages such as MATLAB and LabView, which have license fees to use the software.
(ii) The software code has not been published in an open-source manner which prevents wide adoption of the technology.
(iii) Programming expertise in the given language is required to make custom changes or improvements. This is frequently a significant barrier of entry for researchers without any programming knowledge.
(iv) There is limited potential for remote-control and monitoring of the equipment.
Numerous publications are noted in the literature that employ the use of closed-loop processes11 to optimise chemical reactions using various analytical methods such as gas chromatography (GC),12 mass spectroscopy (MS),3,13 NMR,14 IR,15 Raman,16 and high-performance liquid chromatography (HPLC).17–20 These are good examples of how machine-assisted synthesis is able to allow skilled chemists to focus on more productive pursuits and lower the need to perform routine tasks,21 with examples having been reported which illustrate the optimisation of multiple objectives such as yield, STY, cost and E-factor by generating Pareto fronts – which find the ideal reaction conditions when two or more conflicting objectives are being considered.8,17,20
Open-source technologies allow for rapid adaptation by a wide community and reduces costs. Examples of this can be found in the development of photometers,22 autosamplers,23 fluidic valves24 and 3D printed components.25,26 This manuscript aims to add to this by reporting on the development of a control dashboard using open-source software, with the goal of encouraging others to do so as well, using the framework provided. The utility of the open-source dashboard is demonstrated through a semi-autonomous closed-loop optimisation of a standard organic reaction.
Results and discussion
Dashboard development and operation
To overcome the limitations of using proprietary software packages, the Node-RED27 platform was used for the development of the dashboard. Node-RED is a flow-based programming platform (similar to LabView) with development being done through a web browser such as chrome or firefox. Using Node-RED allowed for the rapid development of customised dashboards for the monitoring of flow chemistry equipment, the implementation of control algorithms and logging recorded data to a database for later analysis and presentation. While Node-RED has become popular amongst home-automation hobbyists, its use in academia has been limited,28,29 which is surprising as Node-RED lowers the barrier of entry for users with a limited budget and/or limited software development knowledge. The open-source nature of this platform and the underlying software implementation provides a means for rapid deployment and collaboration between different research groups in industry and academia. Links to Node-RED tutorial videos are provided in the ESI.†When creating a dashboard, different dials, gauges and graphs can be used to represent the data from the different sensors on the flow chemistry equipment. Users can control the different parameters of the equipment using different user-interface (UI) components such as buttons, check- and tick-boxes, text inputs, etc.
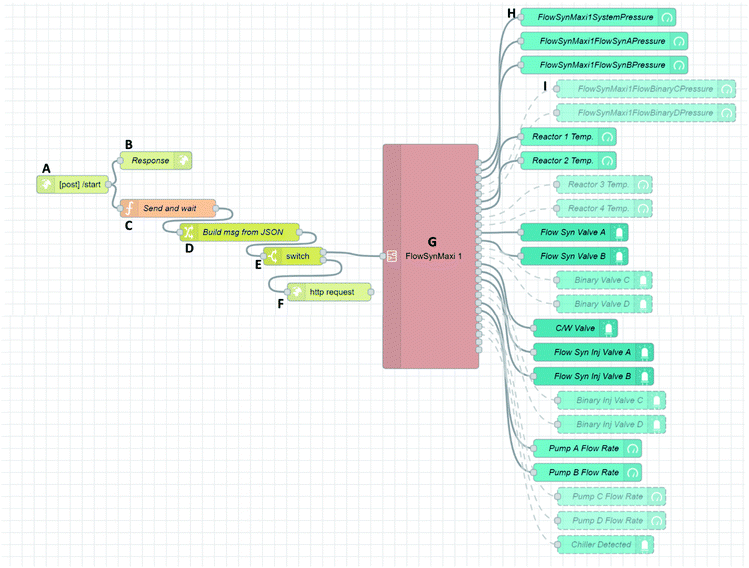
In our case, the Node-RED platform was used for the development of the dashboard and was installed on a low-cost Raspberry Pi which was connected to the network of the laboratory. Using the Node-RED platform one can create complex processes by stringing multiple nodes together, with each node performing a specific task. An example of a flow that was developed to control a Uniqsis FlowSyn reactor is shown in Fig. 1. The first node of the flow, node A, receives HTTP requests from any other device on the same network such as a laptop or mobile device. Node A receives a JSON message which gets passed on to nodes B and C. Node B is responsible for sending a response back to confirm that the message was received. Node C receives the JSON message and sends each segment of the JSON message through after a specified delay or specific criteria has been met. Node D would subsequently construct the message in an object message which would then be interpreted by node G later in the flow. Node E directs all messages to node G unless a message is responsible for sending an HTTP request, in that case, it is directed to node F. Node G represents a ‘subflow’ which contains multiple nodes grouped together and has been developed for separate pieces of flow chemistry equipment allowing the customisation of the dashboard. In this case, node G controls a Uniqsis FlowSyn reactor with the outputs of the current parameters being directed to nodes H and I, which displays the parameters on the dashboard. In the example given, solid nodes such as H represent equipment that is connected to the Raspberry Pi and dashed boxes such as I have been disabled because additional equipment such as a Uniqsis binary pump requires connectivity for the additional functionality.
 | ||
| Fig. 1 A screenshot is taken from a web browser of an example flow diagram for the control of the flow reactor. | ||
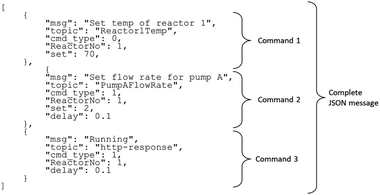
For the automation of the dashboard to execute a series of commands, a user can send a JSON message to the Node-RED server via an HTTP request. The server can then process the JSON message in sequential order. An example of a typically JSON message to set the temperature of the reactor and flow rate of one pump is shown in Fig. 2. The complete JSON message is broken into three separate commands by node C, Fig. 1. The ‘msg’ key provides information to a human reader to understand what a particular command is meant to perform, while the ‘topic’ and ‘set’ keys are used by node G to identify what parameter needs to be set and what value it should be set to.
The first command instructs the subflow node G to ‘set’ the temperature of the first reactor to 70 °C. The ‘cmd_type’ being 0 instructs node C to wait until the required temperature has been reached before processing the subsequent command. Once the specified temperature of 70 °C has been reached, the second command sets pump A to have a flow rate of 2 mL min−1. The ‘cmd_type’ being 1 signifies to node C that the ‘delay’ key should be processed instead of waiting for a parameter of the reactor to first change. Therefore, node C waits for 0.1 s before moving to the last command. The third command instructs a message that should be sent to node F to send an HTTP request that all the commands have been processed.
Finally, while the key ‘ReactorNo’ does not perform an explicit function in this scenario, it could be used to control multiple flow reactors by simply adding additional subflows like G each of which would control a separate reactor.
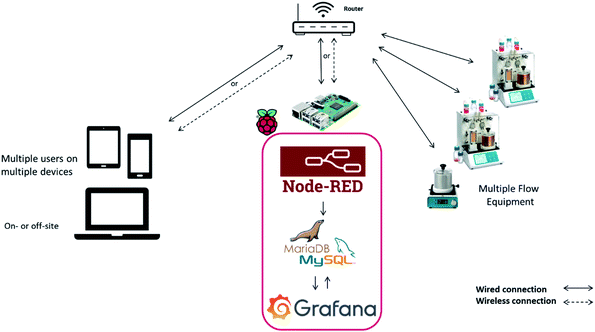
A context diagram is provided in Fig. 3 which gives an overview of how the system is set up. To provide additional functionality of the setup which has been developed, the user can specify that all the parameters such as flow rate, temperature and pressure are recorded into a database. While several database types could have been used, an SQL database like MySQL was selected. This database, which stores all the data collected, was implemented on the Raspberry Pi, however, a separate dedicated computer on the network could have been used for the data storage.
Data collected by Node-RED can be visualised on a timeline graphically, however, in the case in hand, generation of such graphs led to the dashboard becoming unresponsive as the number of data points increased. As a result of this, Grafana, another open-source software platform, was used to visualise the data as it was developed primarily for being able to present larger volumes of data efficiently. Grafana can connect to different databases and data sources, allowing for customizable dashboards to be set up (Fig. S5†). A guide on how to set up the platform is provided in the ESI,† and an image showing the dashboard interface is provided in Fig. 4.
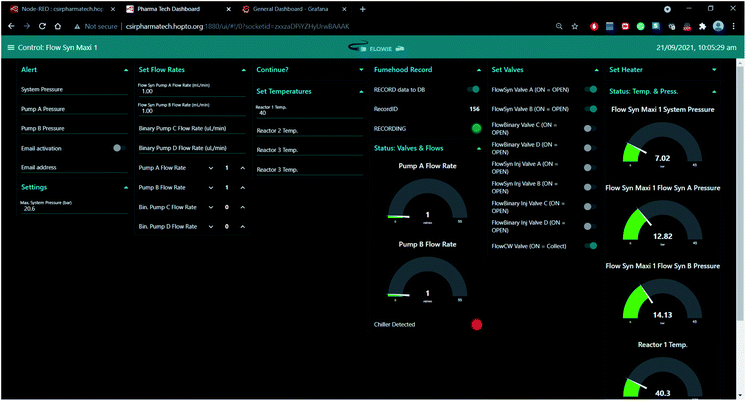 | ||
| Fig. 4 Dashboard from Node-RED which allows for the control and parameter visualisation of flow chemistry equipment from any smart device. | ||
Flow chemistry equipment from different manufacturers uses different interfaces for reading data and sending control signals. Interfaces can be, but are not limited to, serial, HTTP REST API, etc. In this implementation, the LAN interface (using the HTTP REST API) was selected to communicate with the different pieces of equipment. It made the setup more flexible than in the case where the serial interface of the equipment is used. When one uses the serial interface, the serial hub needs to be in close proximity to the processing unit (Raspberry Pi, computer, etc.), since it normally has a USB interface. The USB interface cable has a limited operational length, which limits how far the processing unit can be placed from the equipment. By using the LAN interface, one can connect all the equipment in a fume hood, for example, to a switch (also in the fume hood) and only one LAN cable is required to connect the equipment to the company's LAN network. The processing unit can then be connected to the switch in the fume hood, or it can be in a central control room where all the experiments are controlled from. Crucially, to be successful, interfacing documentation had to be obtained from the flow-equipment manufacturer (Uniqsis) to allow us to communicate with the equipment.
Finally, remote real-time control of chemical reactors and analytical equipment although useful has associated security risks such as breach of data or sabotage of experiments/equipment which need to be addressed and has been the subject of previous commentaries.30 In the case in hand to mitigate the security risk, each user is supplied with credentials that need to be entered before access to any server is permitted. The servers are also placed behind a firewall, with off-site access only possible through a secure VPN connection, this approach is similar to that utilised with previously developed platforms.3
Semi-autonomous self-optimisation
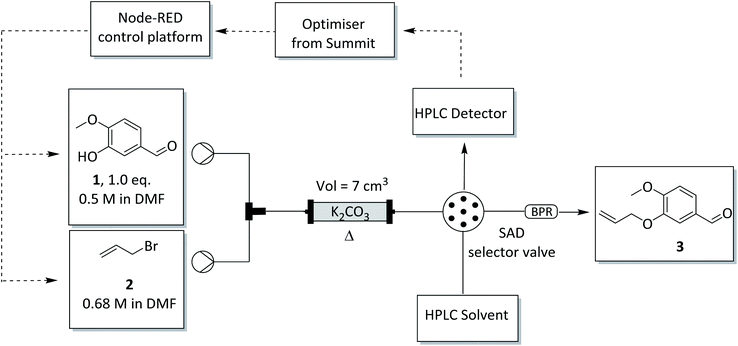
To demonstrate the use of the control software developed, we elected to demonstrate the allylation of isovanillin 1 using allyl bromide 2 using a semi-autonomous closed-loop approach. The choice of reaction was selected from an unrelated in-house project wherein product 3 is a precursor for the synthesis of benzo-fused heterocycles using ring-closing metathesis. The reaction was selected as traditional one variable at a time (OVAT) optimisations performed in-house showed a wide range of yields could be observed depending on several variables including temperature, reaction time and stoichiometric ratios.A Uniqsis FlowSyn Maxi reactor was utilised for this reaction. The reactor set-up involved the use of two HPLC pumps, a 15 mL glass Omnifit® column mounted in a heating block connected in series to a Syrris ‘Sampler and Dilutor’ (SAD) and finally a back pressure regulator (7 bar) fitted at the output flow stream. The SAD was utilised to perform at-line dilutions and to inject 5 μL samples of the reaction mixture into an Agilent 1100 series HPLC instrument – see Fig. 5. The two HPLC pumps were connected to reservoirs containing iso-vanillin 1 (0.5 M in DMF) and allyl bromide 2 (0.68 M in DMF) respectively and the Omnifit® column was packed with finely ground potassium carbonate (liquid volume ∼7 mL).
Previously, a variety of optimisation algorithms have been used/reported for reaction optimisations.11,31 Depending on the algorithm, either a local or global optimal solution can be found. To identify a global optimal solution, the open-source Python package Summit32 was utilised for the Single-Objective Bayesian Optimiser (SOBO) algorithm. Summit acts as a wrapper around GPyOpt,33 another python library. While GPyOpt could have been used for SOBO, Summit provides access to various other optimisation algorithms with a simple intuitive syntax and structure as well as additional functionalities.
SOBO is a Bayesian optimiser that uses a sequential design strategy for black-box functions which are expensive-to-evaluate (in this case, a significant volume of reagents and time are needed to evaluate the outcome for each set of experimental conditions). This optimiser works by building a probabilistic model of the objective function (in this case being the STY), called the surrogate function, using Gaussian processes. This surrogate function is then searched efficiently with an acquisition function before a candidate sample is chosen for evaluation on the real objective function by controlling the flow reactor autonomously. Thus, by incorporating information learned in previous experiments executed, an optimal set of conditions can be found with a small number of evaluations.
The python script which utilised the Summit library32 would send a JSON file to the Raspberry Pi which is running the Node-RED software. The Node-RED dashboard would interpret the JSON file and follow the sequence of commands needed to be executed such as set the column temperature, open valves and set pump flow rates. Once sufficient volumes of the reagents have been pumped (approximately 19 mL, 2.7 residence times), a relay is triggered which signals the SAD to start dilution and injection into the HPLC flow stream for analysis (a brief discussion on the relay set up is provided in the ESI†). The python script would subsequently send another JSON file to change valves to solvent only and clean the reactor for the next cycle. During this time, the script would connect to the computer which controls the HPLC and grab the .csv file using file transfer protocol (FTP). Knowing the area for each peak, the script would determine the concentration of the reagents and product which would subsequently be used to determine the STY. An optimisation algorithm then used the results to determine which set of experimental conditions should be evaluated next. Prior to commencement of the next run the system was flushed with clean solvent, thereafter the pumps were shut off until the column was allowed to equilibrate to the new temperature.
The STY was used as the objective function to optimise the reaction due to the relative low cost of the reagents and simple workup requirements to remove unreacted starting material. Future optimisations may consider developing a pareto front to take other objective functions such as E-factor into account. The STY is calculated as:
| STY (g dm−3 h−1) = m_product/(V_reactor × t_res) | (1) |
The boundaries for the optimisation were as follows:
 | (2) |
These reaction condition boundaries were selected based on chemical intuition and previous reactions which had been performed on this system by other group members.
During initial attempts of performing the allylation in flow, a major challenge noted was the inconsistent yields that were obtained when using a column packed with unground potassium carbonate. Channelling of the reagents within the glass column were noted and as the base is used stoichiometrically decreasing yields were noted when the column was used repeatedly. To overcome this issue, the solid potassium carbonate base was ground using a mill into a fine powder. This powder allowed for improved mass transfer and reduced the channelling which would occur as the reagents were pumped through the column. However, the yield would gradually decrease after the fourth run if the same column was used repeatedly while keeping the experimental conditions constant (reactor temp = 80 °C; residence time = 4 min; equivalence of 2 = 1) – see ESI.† Therefore, the column was replaced every three runs using the same amount of potassium carbonate for each run. It is conceivable that replacement of the column after every third run could be automated by employing an appropriate selector valve connected to a bank of pre-loaded columns to achieve a fully autonomous process. That being noted, as this optimization process was simply performed to demonstrate the used of the Node Red dashboard, we elected to rather employ a semi-automated approach wherein the column was manually swopped after every third run.
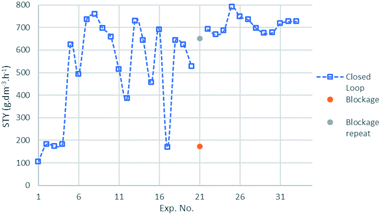
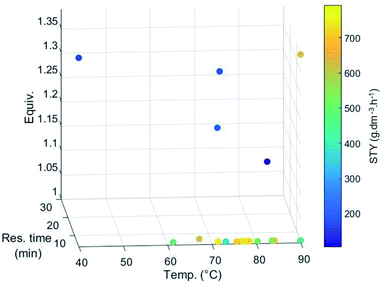
The optimisation cycles were run for a total of 33 experiments. Originally, Summit was programmed to execute 50 experiments however it was clear that a plateau had been reached between runs 22 and 33 (Fig. 6) as the SOBO algorithm continued to only explore within a small region of the experimental conditions. The results, shown in 3D in Fig. 7, indicate that an optimum STY of 791 g dm−3 h−1 was achieved with a reactor temperature of 77.3 °C, a residence time of 4 min, with 1.005 equivalence of the allyl bromide 2.
The optimisation algorithm quickly tended towards the shortest retention time possible, and the equivalence of 2 tended towards 1 rapidly. It should be noted that, although the optimisation algorithm attempted to explore for an equivalence of 1, minimum incremental flow rates of 0.01 mL min−1 meant an exact equivalence ratio could not be reached, leading to an equivalence of 1.005 instead.
During the 21st run, a blockage occurred within the sample loop of the SAD which led to a false STY result – the increased pressure was detected by the Node-RED software which sent a command to stop the pumps, however, there was no communication protocol included to tell the python script that an error had occurred and as a result the sample analysis step was still triggered. While this result would have affected the subsequent experimental conditions chosen by the SOBO algorithm, it would not have been significant as the product 3 would have been diluted due to the testing of a higher equivalence of 2. This would have led to a lower STY even if the yield was correct as shown when compared with subsequent runs (experiments 22–33).
Critically speaking, although the STY visually plateaued between experiments 22 and 33 closer analysis revealed unexpected deviations in the STY value with only minor changes in the control parameters when different columns were used despite careful milling of the potassium carbonate and packing of the columns. This occurrence exemplifies the issue when using experimental closed-loop systems, where optimisation algorithms need to be able to consider incorrect data points. This makes the optimisation more complicated if the system does not behave well, which translates to a ‘noisy’ objective function.
We had originally expected the SOBO algorithm to tend towards a high temperature for the reactor column, a low residence time and a high equivalence of 2. While the anticipated temperature and residence time trends generally occurred, the equivalence tending towards the lower boundary was not expected. This trend is explained by the fact that using a higher equivalence of 2 did not improve the yield significantly and was offset by the dilution of the limiting reagent 1 when a higher equivalence of 2 was used.
Ideally to further optimise the process for STY, one would explore a lower residence time boundary but we were limited by the maximum pressure which the glass column could withstand. Furthermore, it could be more beneficial to increase the concentration of the stock solutions to explore higher molar flow rates.
The closed-loop process took 12 hours to complete if one excludes the time lost for the column to be replaced after every third run. This short time to execute the experiments and identify optimal conditions exemplifies the strength and the potential of automated closed-loop systems.
Conclusions
We have reported the development of a control system using Node-RED which has been coupled with Summit, the utility of which was exemplified through the performance of a closed-loop optimisation of an allylation reaction. This work demonstrated the use of open-source technologies to control equipment (flow and analytical) which previously required the use of separate proprietary software packages. The versatility and ease of use of Node-RED means a lower barrier of entry for users with little-to-no experience in programming. Therefore, we envision that this platform, if used in an open-source manner, would allow research groups to readily share control protocols for various pieces of equipment and allow seamless integration of different equipment.The use of the control dashboard was demonstrated through a semi-autonomous closed-loop optimisation of an allylation reaction. The approach highlighted that within a small number of runs, a SOBO algorithm was able to optimise for STY. The conditions were optimised for 1 equivalent of allyl bromide 2 with low residence time (4 min) and relatively high reactor temperature.
Future work for this project will look into developing nodes for controlling flow chemistry equipment from other manufacturers. It should be noted that this technology is not limited to flow chemistry applications, and we envision this technology to be used in other areas of a laboratory. Furthermore, we are currently investigating how to incorporate the data collected and stored into an Electronic Laboratory Notebook (ELN) system.
Experimental
Reaction setup
A Uniqsis FlowSyn Maxi reactor was set up as depicted in Fig. 5. Reservoir solutions were prepared by dissolving the desired reagents in HPLC grade DMF and stirring at ambient conditions. Reagent 1 pump: isovanillin 1 (38.04 g, 0.25 mol, 0.5 mol dm−3) was dissolved in DMF (0.5 L). Reagent 2 pump: allyl bromide 2 (42.35 g, 0.35 mol, 0.7 mol dm−3) was dissolved in DMF (0.5 L). Average quantities of reagent used per experiment: isovanillin 1 (634 mg, 4.17 mmol), allyl bromide 2 (669 mg, 4.40 mmol). Approximately 21 g and 22 g of isovanillin 1 and allyl bromide 2, respectively were consumed for the 33 experiments. HPLC analysis of the stock solutions were analysed to confirm the concentrations. The stock solution concentration of isovanillin 1 and allyl bromide 2 was corrected to 0.495 M and 0.679 M, respectively. Anhydrous potassium carbonate was ground using an IKA M20 universal mill after which time 16 g was loaded into a 10 cm Omnifit™ glass column (20 mm outer diameter) and primed with DMF. Small amounts of cotton wool were added to both ends of the glass column to prevent the leaching of the solid base. A 1 L reservoir solution of HPLC grade DMF was used for the priming of new K2CO3 columns and the wash cycles.HPLC method
Calibration and optimisation analyses were performed using an Agilent 1100 Series HPLC system equipped with a G1311A quaternary pump and G1315A diode-array detector (DAD). Compounds were separated via an Agilent Eclipse Plus C18 column (3.5 μM particle size, 4.6 mm diameter × 100 mm length). The mobile phase was a mixture of two bottles in a ratio of 50![[thin space (1/6-em)]](https://www.rsc.org/images/entities/char_2009.gif) :
:![[thin space (1/6-em)]](https://www.rsc.org/images/entities/char_2009.gif) 50. Bottle A contained a mixture of acetonitrile and methanol (50
50. Bottle A contained a mixture of acetonitrile and methanol (50![[thin space (1/6-em)]](https://www.rsc.org/images/entities/char_2009.gif) :
:![[thin space (1/6-em)]](https://www.rsc.org/images/entities/char_2009.gif) 50). Bottle B contained a mixture of water, acetonitrile and methanol (90
50). Bottle B contained a mixture of water, acetonitrile and methanol (90![[thin space (1/6-em)]](https://www.rsc.org/images/entities/char_2009.gif) :
:![[thin space (1/6-em)]](https://www.rsc.org/images/entities/char_2009.gif) 5
5![[thin space (1/6-em)]](https://www.rsc.org/images/entities/char_2009.gif) :
:![[thin space (1/6-em)]](https://www.rsc.org/images/entities/char_2009.gif) 5). The flow rate was kept at 0.1 mL min−1 when the analysis was not being performed between each experimental run to reduce solvent wastage. When the HPLC run is triggered, the flow rate is ramped up to 1 mL min−1 in 1 min in a linear gradient, followed by a steady-state flow rate of 1 mL min−1 for 4 min. Afterwards, the flow rate is set back to 0.1 mL min−1 in 0.1 min. The total run time was 5.10 min with a column temperature of 30 °C throughout. The absorption wavelength of the DAD operated at 230 nm.
5). The flow rate was kept at 0.1 mL min−1 when the analysis was not being performed between each experimental run to reduce solvent wastage. When the HPLC run is triggered, the flow rate is ramped up to 1 mL min−1 in 1 min in a linear gradient, followed by a steady-state flow rate of 1 mL min−1 for 4 min. Afterwards, the flow rate is set back to 0.1 mL min−1 in 0.1 min. The total run time was 5.10 min with a column temperature of 30 °C throughout. The absorption wavelength of the DAD operated at 230 nm.
HPLC calibration
A 9-point calibration curve was generated for isovanillin 1, allyl bromide 2 and product 3 by injecting prepared solutions into the SAD which are diluted and subsequently injected into the HPLC flow stream. Calibration plots are provided in the ESI.†Data availability
Experimental results are summarised in the ESI.† The Node-RED flows and python code used in this study are available in the ESI† as separate objects. The code can also be found in a public GitHub repository at https://github.com/JohanvdWesthuizen/FlowChem-ClosedLoopOpt. The proprietary commands to control the Uniqsis equipment have been removed from the Node-RED flows, if required please contact Uniqsis Ltd.Author contributions
The author contributions are provided in CRediT format. C. Johan van der Westhuizen – conceptualization, data curation, formal analysis, investigation, methodology, software, validation, visualization writing – original draft, Jurie du Toit – conceptualization, methodology, supervision, writing – review and editing, Nicole C. Neyt – conceptualization, methodology, writing – review and editing, Darren. L. Riley – conceptualization, supervision, writing – review and editing, Jenny-Lee Panayides – conceptualization, funding acquisition, project administration, resources, supervision, writing – review and editing.Conflicts of interest
There are no conflicts to declare.Acknowledgements
This work was supported by the National Research Foundation (NRF, South Africa – UID 116303 and UID 106959), the University of Pretoria and the Council for Scientific and Industrial Research (CSIR, South Africa) parliamentary grant allocation. Opinions expressed in this publication and the conclusions arrived at are those of the authors and are not necessarily attributed to the NRF. The authors would like to thank Chris van der Westhuyzen and Jacques van der Westhuizen for valuable discussions and support.References
- K. Schwab, The fourth industrial revolution, Portfolio Penguin, 2017 Search PubMed.
- N. C. Neyt and D. L. Riley, Application of reactor engineering concepts in continuous flow chemistry: a review, React. Chem. Eng., 2021, 6, 1295–1326 RSC.
- D. E. Fitzpatrick, C. Battilocchio and S. V. Ley, A Novel Internet-Based Reaction Monitoring, Control and Autonomous Self-Optimization Platform for Chemical Synthesis, Org. Process Res. Dev., 2016, 20, 386–394 CrossRef CAS.
- N. Cherkasov, Y. Bai, A. J. Expósito and E. V. Rebrov, OpenFlowChem – a platform for quick, robust and flexible automation and self-optimisation of flow chemistry, React. Chem. Eng., 2018, 3, 769–780 RSC.
- Z. Crandall, K. Basemann, L. Qi and T. L. Windus, Rxn Rover: automation of chemical reactions with user-friendly, modular software, React. Chem. Eng., 2022, 7, 416–428 RSC.
- S. Chatterjee, M. Guidi, P. H. Seeberger and K. Gilmore, Automated radial synthesis of organic molecules, Nature, 2020, 579, 379–384 CrossRef CAS PubMed.
- S. H. M. Mehr, M. Craven, A. I. Leonov, G. Keenan and L. Cronin, A universal system for digitization and automatic execution of the chemical synthesis literature, Science, 2020, 370, 101–108 CrossRef CAS PubMed.
- M. I. Jeraal, S. Sung and A. A. Lapkin, A Machine Learning-Enabled Autonomous Flow Chemistry Platform for Process Optimization of Multiple Reaction Metrics, Chem. Methods, 2021, 1, 71–77 CrossRef.
- P. Sagmeister, et al., Advanced Real-Time Process Analytics for Multistep Synthesis in Continuous Flow, Angew. Chem., Int. Ed., 2021, 60, 8139–8148 CrossRef CAS PubMed.
- K. Y. Nandiwale, et al., Continuous stirred-tank reactor cascade platform for self-optimization of reactions involving solids, React. Chem. Eng., 2022, 7, 1315–1327 RSC.
- C. Mateos, M. J. Nieves-Remacha and J. A. Rincón, Automated platforms for reaction self-optimization in flow, React. Chem. Eng., 2019, 4, 1536–1544 RSC.
- A. Echtermeyer, Y. Amar, J. Zakrzewski and A. Lapkin, Self-optimisation and model-based design of experiments for developing a C–H activation flow process, Beilstein J. Org. Chem., 2017, 13, 150–163 CrossRef CAS PubMed.
- N. Holmes, et al., Online quantitative mass spectrometry for the rapid adaptive optimisation of automated flow reactors, React. Chem. Eng., 2016, 1, 96–100 RSC.
- V. Sans, L. Porwol, V. Dragone and L. Cronin, A self optimizing synthetic organic reactor system using real-time in-line NMR spectroscopy, Chem. Sci., 2015, 6, 1258–1264 RSC.
- D. E. Fitzpatrick, T. Maujean, A. C. Evans and S. V. Ley, Across-the-World Automated Optimization and Continuous-Flow Synthesis of Pharmaceutical Agents Operating Through a Cloud-Based Server, Angew. Chem., Int. Ed., 2018, 57, 15128–15132 CrossRef CAS PubMed.
- S.-A. Leung, R. F. Winkle, R. C. R. Wootton and A. J. DeMello, A method for rapid reaction optimisation in continuous-flow microfluidic reactors using online Raman spectroscopic detection, Analyst, 2005, 130, 46 RSC.
- A. M. Schweidtmann, et al., Machine learning meets continuous flow chemistry: Automated optimization towards the Pareto front of multiple objectives, Chem. Eng. J., 2018, 352, 277–282 CrossRef CAS.
- A. Bédard, et al., Reconfigurable system for automated optimization of diverse chemical reactions, Science, 2018, 361, 1220–1225 CrossRef PubMed.
- N. Holmes, et al., Self-optimisation of the final stage in the synthesis of EGFR kinase inhibitor AZD9291 using an automated flow reactor, React. Chem. Eng., 2016, 1, 366–371 RSC.
- A. D. Clayton, et al., Automated self-optimisation of multi-step reaction and separation processes using machine learning, Chem. Eng. J., 2020, 384, 123340 CrossRef CAS.
- S. V. Ley, D. E. Fitzpatrick, R. M. Myers, C. Battilocchio and R. J. Ingham, Machine-Assisted Organic Synthesis, Angew. Chem., Int. Ed., 2015, 54, 10122–10136 CrossRef CAS PubMed.
- G. Glotz and C. O. Kappe, Design and construction of an open source-based photometer and its applications in flow chemistry, React. Chem. Eng., 2018, 3, 478–486 RSC.
- M. O'Brien, A. Hall, J. Schrauwen and J. van der Made, An open-source approach to automation in organic synthesis: The flow chemical formation of benzamides using an inline liquid-liquid extraction system and a homemade 3-axis autosampling/product-collection device, Tetrahedron, 2018, 74, 3152–3157 CrossRef.
- M. O'Brien, L. Konings, M. Martin and J. Heap, Harnessing open-source technology for low-cost automation in synthesis: Flow chemical deprotection of silyl ethers using a homemade autosampling system, Tetrahedron Lett., 2017, 58, 2409–2413 CrossRef.
- V. Sans, V. Dragone and L. Cronin, Applications of 3D Printing in Synthetic Process and Analytical Chemistry, in Handbook of Green Chemistry, Wiley-VCH Verlag GmbH & Co. KGaA, 2019, vol. 12, pp. 215–256 Search PubMed.
- A. J. N. Price, A. J. Capel, R. J. Lee, P. Pradel and S. D. R. Christie, An open source toolkit for 3D printed fluidics, J. Flow Chem., 2021, 11, 37–51 CrossRef CAS.
- OpenJS Foundation & Contributors, Node-RED, 2021.
- J. Austerjost, et al., Introducing a Virtual Assistant to the Lab: A Voice User Interface for the Intuitive Control of Laboratory Instruments, SLAS Technol. Transl. Life Sci. Innov., 2018, 23, 476–482 Search PubMed.
- C. A. Osaretin, M. Zamanlou, M. T. Iqbal and S. Butt, Open Source IoT-Based SCADA System for Remote Oil Facilities Using Node-RED and Arduino Microcontrollers, in 2020 11th IEEE Annual Information Technology, Electronics and Mobile Communication Conference (IEMCON) 0571–0575, IEEE, 2020, DOI:10.1109/IEMCON51383.2020.9284826.
- R. A. Skilton, et al., Remote-controlled experiments with cloud chemistry, Nat. Chem., 2015, 7, 1–5 CrossRef CAS PubMed.
- P. Müller, et al., Automated multi-objective reaction optimisation: which algorithm should I use?, React. Chem. Eng., 2022, 7, 987–993 RSC.
- K. C. Felton, J. G. Rittig and A. A. Lapkin, Summit: Benchmarking Machine Learning Methods for Reaction Optimisation, Chem. Methods, 2021, 1, 116–122 CrossRef.
- The GPyOpt Authors, GPyOpt: A Bayesian Optimization framework in python, 2016 Search PubMed.
Footnote |
| † Electronic supplementary information (ESI) available. See https://doi.org/10.1039/d2dd00036a |
| This journal is © The Royal Society of Chemistry 2022 |

