Insight into the effect of tetrapropylammonium hydroxide on HZSM-5 zeolite and its application in the reaction between 2,5-dimethylfuran and ethanol to p-xylene†
Rongrong
Zhao
 *,
Juan
Sui
,
Lianchao
Wu
,
Xunzhen
Sun
,
Lekai
Fu
,
Hongzi
Tan
and
Hongyou
Cui
*
School of Chemical Engineering, Shandong University of Technology, 255091 Zibo, China. E-mail: rrzhao1990@sdut.edu.cn; cuihy@sdut.edu.cn
First published on 21st November 2022
Abstract
The microporous HZSM-5 zeolite was modified by tetrapropylammonium hydroxide (TPAOH) with various concentrations, which was further compared with NaOH modification. The influence of alkali treatment on the porosity, acidity and catalytic performance of HZSM-5 zeolite was systematically investigated. N2-physisorption measurements demonstrated that the hierarchical zeolite was successfully synthesized by alkali treatment. 29Si MAS NMR proved that the demetallization process was highly more controllable for TPAOH than for NaOH. The different demetallization mechanism caused the variation of acidity as evidenced by NH3-TPD and Py-IR characterization. What's more, the renewable production of p-xylene from 2,5-DMF and ethanol was realized under alkali treatment of ZSM-5 zeolites. Among them, HZSM-5 treated with 0.3 M TPAOH displayed improved catalytic performance with a 2,5-DMF conversion of 95.0% and a PX selectivity of 67.8%, better than the parent and NaOH modified HZSM-5 zeolite, due to its specific porosity and acidity. To explore the impact of hydrophobicity on catalytic activity, the TPZ-0.3 catalyst was subsequently silylated with several silylating agents with different hydrophobic properties. For the surface modified zeolite, the main reaction activity decreased significantly and even exhibited excellent anti-coking, indicating that the water produced during the reaction was favorable for the main reaction. The discoveries obtained from this research pave a way for the construction of catalysts with higher performance in biomass conversion.
Introduction
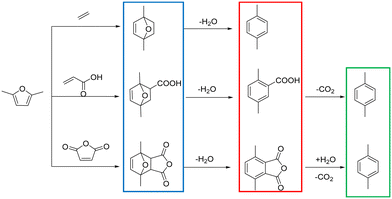
The conversion of lignocellulosic biomass into aromatics with zeolites having acidic sites is a very important catalytic route for biomass upgrading.1–4 Among the aromatics, the sustainable synthesis of p-xylene (PX) has attracted much attention due to its wide application in the production of polymers such as polyethylene terephthalate (PET).5,6 Conventionally, PX was produced from petroleum feedstocks in refineries, which required further purification. Besides, this process also contributed to environment degradation.7 Fortunately, it has been recently reported that sustainable PX can be produced from biomass derived 2,5-dimethylfuran (2,5-DMF) in a clean route shown in Scheme 1,8–14 which includes the Diels–Alder cycloaddition of 2,5-DMF and dienophiles to form an intermediate cycloadduct, followed by a dehydration step to PX. Actually, extensive work has been reported on the synthesis of PX by cycloaddition of ethylene with 2,5-DMF,15–19 and diverse solid acid catalysts exhibited excellent performance with 2,5-DMF conversion and a PX yield higher than 90%. But for this reaction system, high ethylene pressures and long reaction times were usually required; thus, in terms of green chemistry, the process was less competitive. Alternatively, maleic anhydride or acrylic acid was also employed as a dienophile, which can be performed at lower reaction temperatures.10,20,21 However, the process for producing PX comprises an additional decarboxylation step, and a low PX yield (∼45%) is obtained through an ionic liquid catalyst.22 Even though a higher PX yield (92%) over Bi-BTC was reported,23 the low turnover frequency (TOF) made this project less appealing. A successful alternative route was explored by replacing ethylene with ethanol.24–26 During this reaction, non-external gas pressure was brought in because ethylene can be generated in situ by ethanol dehydration and the reaction activation energy decreased significantly compared with ethylene, showing broad prospects for commercialization. However, this method had a relatively low PX selectivity and yield (∼56%). Therefore, to develop an effective heterogeneous catalytic system that can achieve high 2,5-DMF conversion and PX yield simultaneously is crucial to the economics of this bio-based process.27,28Due to its structurally distinct three-dimensional framework, with two interesting 10-membered ring channels (sinusoidal channels of 0.54 nm × 0.51 nm and straight channels of 0.56 nm × 0.54 nm),29,30 the HZSM-5 catalyst is a predominant catalyst for shape-selective catalysis of aromatics and has been widely utilized in chemistry industries.4,31 Particularly for the reaction between 2,5-DMF and ethanol, it has also been verified by previous research that due to its shape-selective properties and appropriate acidity, HZSM-5 zeolite exhibited better p-xylene selectivity than the 12-membered ring HBeta zeolite and mesoporous WOX/ZrO2.32 However, the existence of the single micropore system leads to severe diffusion limitations, which not only decrease the catalyst's stability but also change the product distribution.33,34 To alleviate this drawback, intense trials were made for the synthesis of hierarchical zeolites,35,36 which contain the catalytic features of micropores as well as having the advantage of enhanced accessibility and transportation by introduction of a secondary mesopore system.
Presently, two specific routes exist for hierarchical zeolite preparation, referred to as “bottom-up” and “top-down” approaches, respectively.37–39 For the “bottom-up” approach, the use of expensive structure-directing agents considerably increases the industrial cost of the synthesized catalyst. Even though the cost can be reduced through the template-free synthesis method reported by several groups,40 the growth of mesopores or macropores cannot be effectively controlled. Besides, only a special kind of zeolite would be synthesized by this method.41 The “top-down” method, usually desilication by alkali treatment, provides a universal and simple method to prepare a catalyst with a hierarchical structure. During the alkali treatment process, mesopores would be generated due to the extraction of Si atoms from the lattice by OH−.42 Many reagents including inorganic and organic bases were employed to achieve this purpose,43 during which the porosity can be delicately tuned by treatment of different alkaline solutions. What's more, the acidity can also be regulated during alkali modification. Due to these unique features, hierarchical HZSM-5 zeolites have ignited efforts towards biomass feedstock transformation.44–46 However, the influence mechanism of alkali treatment on the zeolite acidity was not investigated thoroughly. Besides, the application of alkali treated ZSM-5 zeolites in the reaction between 2,5-DMF and ethanol has not been reported. Additionally, for PX production via ethanol and 2,5-DMF, Teixeira25 theoretically stated that water played a very important role in lowering the reaction activation barriers. Besides, Qian47 also reported that water would change the distribution of aromatics during the ethylene conversion process by influencing the reactant adsorption properties. However, a previous study revealed that a nonpolar solvent is more beneficial for the reaction of ethylene and 2,5-DMF to PX.48,49 Thus, the effect of water on the reaction between ethylene (derived from ethanol in situ) and 2,5-DMF is not fully understood to date, which needs to be further investigated experimentally.
Herein, alkali-treated (NaOH and TPAOH) HZSM-5 zeolites were prepared to improve the reaction performance. And hierarchical ZSM-5 zeolite was further silylated to discover the effect of surface properties on the product distribution. By this study, an optimized option for the directional transformation of 2,5-DMF and ethanol to PX would be built.
Experimental section
Catalyst preparation
The parent NaZSM-5 zeolite with a Si/Al ratio of 18 was purchased from Nankai Chemical Plant (Tianjin, China). To remove the organic template, the NaZSM-5 zeolite was calcined at 550 °C for 5 h in an air atmosphere. For the HZSM-5 zeolite, the above sample was ion exchanged two-fold with 0.5 M aqueous solution of (NH4)2SO4 (50 ml gzeolite−1) at 80 °C for 3 h, followed by filtration and washing with distilled water. Afterwards, HZSM-5 was prepared by drying at 110 °C overnight and calcining at 550 °C for 5 h.For the alkali-modified zeolites, treatment of 1 g NaZSM-5 zeolite was carried out at 80 °C for 4 h using 20 mL alkali solution with a certain concentration. Then the suspension was immediately placed in an ice–water mixture and centrifuged. Afterwards, the samples were washed with deionized water until neutral pH and dried overnight at 110 °C. In order to obtain the protonated zeolite, the ion exchange and calcination procedures were employed as described above. The TPAOH and NaOH modified samples were designated as TPZ-x and AZ-y (x, y represents the alkaline solution concentration), respectively.
For silylation treatment, the catalyst was firstly dried at 110 °C overnight to remove physically adsorbed water. Then 1.0 g zeolite was dispersed in 25 mL toluene, and certain amounts of tetraethoxysilane (TEOS), hexamethyldisilazane (HMDS) and octadecyl trichlorosilane (OTS) were added into the mixture. The suspension was heated to 120 °C with stirring for 4 h under reflux conditions. Subsequently, toluene was removed by filtration and the sample was collected. After that, the zeolite was dried in an oven at 110 °C before utilization. For the TEOS modified catalyst, the zeolite was further calcined at 500 °C for 5 h. The silylated products were named as TEOS, HMDS and OTS.
Catalyst characterization
The crystallinity of the catalyst was determined by powder X-ray diffraction (XRD) using a Bruker D8 Advance diffractometer with Cu-Kα radiation (λ = 1.5418 Å, 45 kV, 40 mA). And the scanning step was 0.0194° s−1 in the 2θ range of 5–50°.N2 adsorption/desorption isotherms at 77 K were measured on a Micromeritics 3Flex surface characterization analyzer. The samples were outgassed at 300 °C under vacuum overnight prior to analysis. The total surface areas (BET) were calculated within a linear range, which met two consistency criteria. The pore size distributions were obtained by using the BJH method and the total pore volume was estimated at P/P0 = 0.99.
29Si MAS NMR measurements were performed on an Agilent DD2–500 MHz spectrometer. Before characterization, the samples were packed into 6 mm ZrO2 rotors and measured at 99.3 MHz with a speed of 4 kHz and a recycling delay of 4 s. The chemical shifts of the 29Si MAS NMR spectra were referenced to kaolin and Dmfit software was employed for spectral deconvolution.50
For ammonia adsorption and temperature programmed desorption (NH3-TPD) experiments, the catalysts were cleaned in 80 ml min−1 He at 500 °C for 1 h and then cooled to 100 °C in helium. The adsorption of ammonia was performed at this temperature for 0.5 h. Finally, the TPD profile, using a gas chromatograph equipped with a thermoconductivity detector, was obtained by heating the ammonia treated zeolite at 10 °C min−1 to 600 °C.
The Fourier transform infrared spectra (FT-IR) were recorded on a Bruker Vertex 7.0 spectrometer using the KBr pellet technique. Besides, the acidic properties of the solid samples were further determined by IR spectroscopy using pyridine as a probe molecule. Prior to pyridine adsorption, the samples were firstly degassed under vacuum (10−3 Pa) at 400 °C for 1 h, and then pyridine adsorption was carried out at 40 °C for 30 min, followed by desorption at 300 °C for 20 min. The concentrations of Brønsted and Lewis acid sites were quantified from the intensity of the IR bands around 1550 and 1450 cm−1 with extinction coefficients of 1.67 cm μmol−1 and 2.22 cm μmol−1, respectively.
DRIFTS experiments were performed on a Thermo Fisher Nicolet iS10 spectrometer. Before characterization, all the samples were dehydrated under a N2 flow at 200 °C for 30 min and then cooled to room temperature. After the background was collected, the spectra were collected by accumulating 64 scans with a spectral resolution of 8 cm−1. Nicolet OMNIC software was used to convert the absorbance data into the Kubelka–Munk format.
The contact angle of the catalysts was measured using a JC2000C instrument (Shanghai Zhongchen, Ltd., China) through the sessile drop method with water as a liquid.
The amount of coke deposited on the spent sample was determined with thermogravimetric TGA/DTG-60H equipment. The catalyst was heated from 100 °C to 800 °C at a heating rate of 10 °C min−1 under a N2 atmosphere.
Catalytic testing
The catalyst performance measurement (reaction between 2,5-DMF and ethanol) was carried out in a 100 mL autoclave with mechanical stirring. Firstly, a certain amount of 2,5-DMF, ethanol, solvent and 1 mL tridecane (as the internal standard) were mixed with 0.4 g catalyst, which was previously pretreated at 373 K in an oven for 12 h to remove moisture. Then the mixture was refluxed at 300 °C and 800 rpm for 10 h. After the reaction, the liquid mixture was extracted from the reactor and the solid catalyst was separated by centrifugation, which were analyzed with a GC (Agilent 7890B) equipped with a DB-1701 column (60 m × 0.25 mm) and a flame ionization detector. The products were identified based on the retention times and response factors of the standard chemicals. The products were further identified by GC/MS (Agilent, 5977/8890) equipped with a 60 m DB-1701 column. And the conversion of 2,5-DMF and the selectivity to the product were calculated using the following equation:where Con.DMF and Selec.i represent the conversion of DMF and the selectivity to i, respectively, while MDMF,t0 denotes the initial mole of 2,5-DMF, MDMF is the final mole of 2,5-DMF and Ci is the concentration of product i.
To research the influence of residual coke on the inner wall of the stainless steel on the reaction, an experiment for the used reactor without a catalyst was also conducted under the same conditions.
Results and discussion
Effects of alkali treatment on the properties of ZSM-5 zeolite
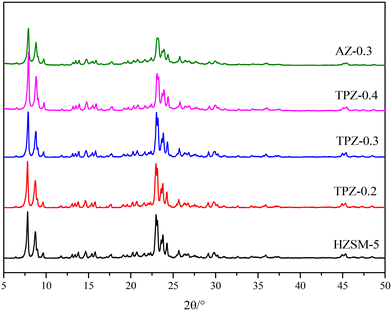
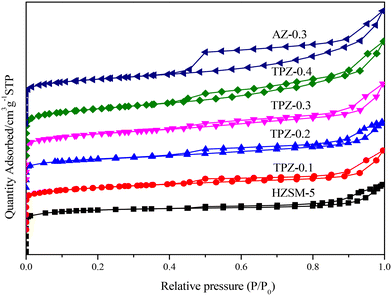
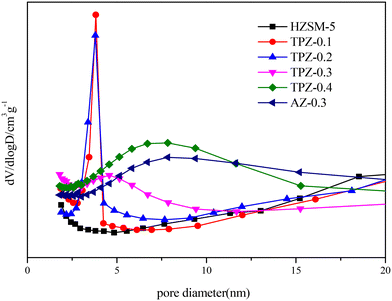
Fig. 1 shows the powder XRD patterns of HZSM-5 zeolites modified with different concentrations of TPAOH. All the samples exhibited typical reflection peaks of the MFI topology without other phases detected. And the catalyst preserves high crystallinity until the concentration of TPAOH solution is 0.4 M, as concluded from the weakened peak intensity for TPZ-0.4. For 0.3 M NaOH modified HZSM-5 zeolite, AZ-0.3, the peak intensity decreases obviously compared with that of TPZ-0.3, indicating that NaOH etching is more serious than TPAOH, resulting in the decrease of relative crystallinity for AZ-0.3.The nitrogen physisorption isotherms in Fig. 2 show that the parent HZSM-5 zeolite displayed a type I isotherm characteristic, while for the TPAOH modified zeolite, a type I isotherm at low P/P0 combined with a type IV isotherm at high P/P0 was displayed. The second uptake and hysteresis loop at high relative pressure for these samples revealed the presence of mesopores. Particularly for the AZ-0.3 catalyst, this feature is more pronounced, demonstrating that the modification degree caused by TPAOH is much more moderate than NaOH leaching. The physicochemical properties of all the samples are summarized in Table 1. From Table 1 it can be seen that the total surface area increased slightly from 309 m2 g−1 to 345 m2 g−1, larger than that of the parent HZSM-5, as the TPAOH concentration changed from 0.1 M to 0.4 M. Meanwhile, the area for TPZ-0.3 is very similar to that for AZ-0.3. The pore size distribution for all the samples is presented in Fig. 3. No mesopores were observed in the parent HZSM-5 zeolite, while TPZ-0.1 and TPZ-0.2 exhibited a large pore size distribution at ca. 4 nm. For TPZ-0.3, a wider pore size distribution ranging from 2 to 10 nm emerged. And the pore size distribution of TPZ-0.4 and AZ-0.3, with the peak at around 7 nm, is much broader. These data verified that the hierarchical zeolite was prepared successfully. Besides, the micropore volume, as determined using the t-plot method, is almost unaffected by the treatment, while the mesopore volume varies from 0.15 to 0.24 cm3 g −1 as the concentration of TPAOH increases from 0.1 M to 0.4 M. And the growth was considerable for the most severely treated sample of AZ-0.3, in which the mesopore volume increased to 0.27 cm3 g −1. The increase of surface area and mesopore volume for the TPAOH and NaOH modified HZSM-5 zeolites may be attributed to the dissolution of the framework and the formation of mesopores during the alkali leaching process.
| Catalyst | Si/Ala | S BET | S micro | S meso | V pore | V micro | V meso | Acid sitesg [μmol g−1] | Total acid siteg | B/Lh | ||
|---|---|---|---|---|---|---|---|---|---|---|---|---|
| [m2 g−1] | [m2 g−1] | [m2 g−1] | [cm3 g−1] | [cm3 g−1] | [cm3 g−1] | Weak | Medium | Strong | [μmol g−1] | |||
| a ICP-OES. b BET surface area. c t-Plot. d Single point adsorption total pore volume (P/P0 = 0.99). e Micropore volume obtained by t-plot analysis. f V pore–Vmicro. g NH3-TPD. h Py-IR. | ||||||||||||
| H-ZSM-5 | 18 | 291 | 223 | 68 | 0.23 | 0.14 | 0.09 | 152 | 40 | 119 | 311 | 2.8 |
| TPZ-0.1 | 17 | 309 | 201 | 108 | 0.26 | 0.1 | 0.15 | 177 | 54 | 55 | 286 | 4.5 |
| TPZ-0.2 | 17 | 312 | 181 | 131 | 0.29 | 0.09 | 0.2 | 183 | 60 | 57 | 300 | 4.0 |
| TPZ-0.3 | 15 | 333 | 200 | 133 | 0.31 | 0.1 | 0.21 | 185 | 87 | 62 | 334 | 3.2 |
| TPZ-0.4 | 14 | 345 | 197 | 148 | 0.34 | 0.1 | 0.24 | 166 | 130 | 61 | 357 | 2.1 |
| AZ-0.3 | 13 | 326 | 200 | 126 | 0.36 | 0.09 | 0.27 | 236 | 81 | 83 | 400 | 2.4 |
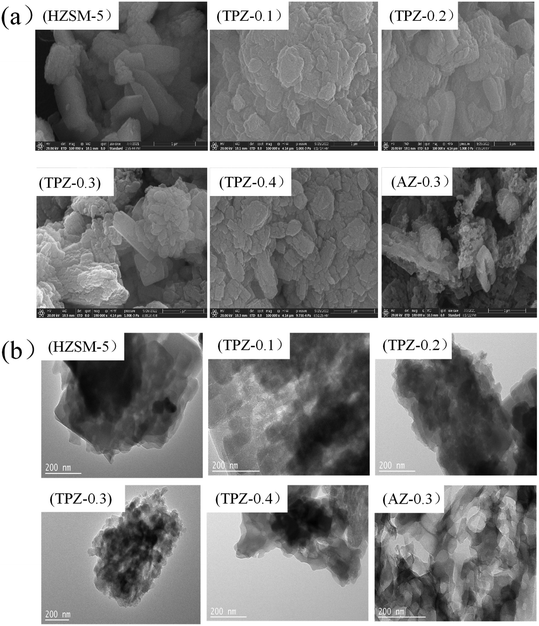
Fig. 4(a) shows the SEM images of ZSM-5 and the alkali modified zeolites. It is found that for the parent ZSM-5 zeolite, the surface is smooth. After modification, the surface of TPZ-x becomes relatively rough. And the higher the concentration, the rougher the surface. Particularly for the AZ-0.3 zeolite, the crystalline body is transformed into a mosaic of cavities. This is most probably due to the fact that partial dealumination and desilication occurred, resulting in generation of cavities in the ZSM-5 crystal. The TEM micrographs of the parent HZSM-5 zeolite and alkali modified samples are shown in Fig. 4(b). For the TPAOH modified samples, in addition to the crystalline channels, non-homogeneous voids appeared. And the voids became more apparent as the TPAOH concentration increased. For the AN-0.3 catalyst, the connectivity between the various pores is prominent. Both SEM and TEM showed that the demetallization is much severer for NaOH than for TPAOH, which is in line with the results derived from N2 physisorption.
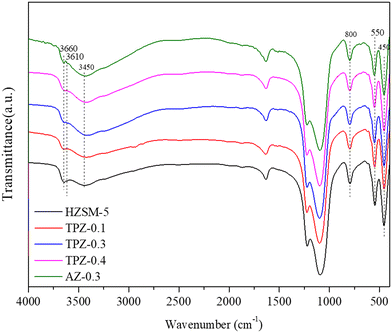
The FT-IR spectra of the samples before and after alkali treatment are shown in Fig. 5. For the OH group region (3400–3800 cm−1),51 three well separated bands were discovered. The band at around 3660 cm−1 is assigned to OH groups associated with extra framework Al species indicating the presence of Lewis acid sites.51,52 The band at 3610 cm−1 represents the bridging strongly acidic Al(OH)Si sites,53,54 which increase distinctly for AZ-0.3, while no obvious differences exist for the TPAOH modified zeolite compared with the parent sample. Besides, all the samples showed a very broad peak centered at 3450 cm−1 assigned to internally located Si–OH sites with strong hydrogen bonds.55 Additionally, the framework vibration range of 400–1600 cm−1 confirms the MFI topology structure of the samples. The absorption bands at 800, 550 and 450 cm−1 can be ascribed to T–O–T symmetric stretching vibration, T–O symmetric stretching vibration and T–O variable angle vibration, respectively.56 Previously, it has been reported that the ratio of the intensities at 550 cm−1 and 450 cm−1 (I550/I450) can be used to evaluate the crystallinity of ZSM-5 zeolite.57,58 As seen from Fig. 4, for the TPAOH modified ZSM-5 zeolite, the intensities at 450 cm−1 and 550 cm−1 remain almost unchanged and the I550/I450 ratio is similar to that of the parent ZSM-5, but for the AZ-0.3 zeolite, the bands at 450 cm−1 and 550 cm−1 both weaken and a lower I550/I450 ratio is obtained compared to the parent ZSM-5, indicating that the TPAOH solution did not disturb the long-range crystallinity of the HZSM-5 materials and 0.3 M NaOH solution showed excessive dissolution of the zeolite crystal leading to the decrease of crystallinity. The obtained results matched well with the XRD patterns.
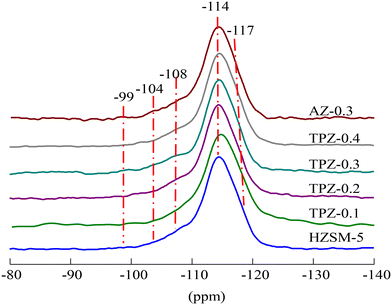
The 29Si MAS NMR spectra of the HZSM-5 zeolites before and after alkalization exhibit an intense signal at −114 ppm which partly overlaps with a resonance at −117 ppm (Fig. 6 and S1†), assigned to Si(0Al) sites in the framework of the ZSM-5 structure. Two broad resonances centered at 108 and −104 ppm are related to framework Si(1Al) and silanol group defect sites Si(1OH), respectively. Besides, a weak peak with a resonance at approximately −99 ppm was observed in all the samples, which was ascribed to Si(2Al) species.59,60 The quantitative results derived from the deconvolution of the 29Si MAS NMR spectra (Table S1†) showed that the signal intensity of the sample at −108 ppm increased from 16.9% to 23.1% as the concentration of TPAOH varied from 0 to 0.4 M, causing the framework Si/Al ratio decreased from 21 to 17. What’s more, the framework Si/Al ratio decreased significantly to 15 for the HZSM-5 zeolite modified with 0.3 M NaOH, meaning that the removal of Si is more preferential and the inorganic base is predominant compared to the organic base. The result was consistent with the Si/Al ratio obtained from ICP analysis listed in Table 1. The different demetallization procedure may be related to the steric hindrance induced by the relatively bulky organic cation.
The modification method would also have a big influence on the catalyst acidity. As shown in Fig. 7, three peaks can be observed in the NH3-TPD profile for each catalyst. Among them, the high temperature peak centered at 410 °C is caused by strong acid sites and the peak at 310 °C is related to acid sites with medium strength, while the low one at around 220 °C arises from the interaction of ammonia with weak acid sites, respectively. After alkali treatment, the NH3 desorption peaks arise from medium and low temperature shifts towards lower temperature, showing that the acid strength weakened. By quantitative analysis, only subtle growth of the acid amount (listed in Table 1) happened as the concentration of TPAOH varied from 0.1 M to 0.4 M. While for AZ-0.3, the acid amount increased evidently to 400 μmol g−1, higher than that for TPZ-0.3 with 334 μmol g−1. Besides, the deconvoluted NH3-TPD spectra of H-ZSM-5 zeolites before and after TPAOH and NaOH modification with different concentrations are shown in Fig. S2,† and the result listed in Table 1 revealed that the distribution of acid sites changed greatly. After alkali modification, the number of acid sites for weak and medium acid strength increases, whereas that of strong acid sites is reduced; especially for AZ-0.3, the amount of weak acid sites increases significantly from 152 μmol g−1 to 236 μmol g−1.
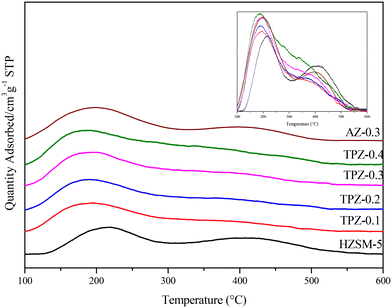 | ||
| Fig. 7 NH3-TPD profiles of HZSM-5 zeolites before and after alkali modification, and the normalized spectra was shown in the inset for comparison. | ||
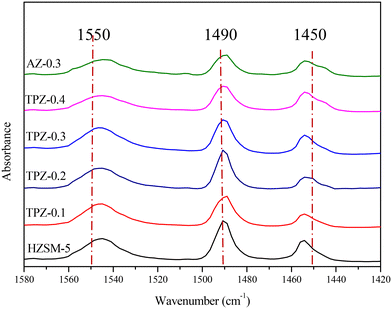
To distinguish the Lewis and Brønsted acid sites, all the samples were characterized by Py-IR. The results are shown in Fig. 8 and Table 1. It can be seen that as the TPAOH concentration increased from 0.1 M to 0.3 M, the B/L ratio dropped from 4.5 to 3.2, higher than the parent ZSM-5 zeolite with a B/L ratio of 2.8. By further increasing the TPAOH concentration to 0.4 M, the Lewis acid sites increase continuously leading to a decrease of the B/L ratio to 2.1. As we all know, for aluminosilicate zeolites, the Brønsted acid site is associated with framework Al while the Lewis acid site is generally caused by extra-framework or tri-coordinated framework aluminum species.61,62 From 29Si MAS NMR and ICP analysis, it can be concluded that the framework Al species were partially converted into extraframework ones by TPAOH modification. Besides, much more extraframework aluminum species would also be exposed during the excessive desiliconization caused by TPAOH modification.63 Both factors lead to a lower B/L ratio of TPZ-x zeolite. And as the concentration of TPAOH increased, the effect became more obvious. For 0.3 M NaOH treatment, the B/L ratio was 2.4, lower than that of the TPZ-0.3 catalyst due to the different demetallization mechanism.
Effects of silylation modification on the properties of ZSM-5 zeolite
The surface properties of the TPZ-0.3 zeolite was modified with different silylating agents including TEOS, HMDS and OTS. The XRD patterns of the silylated sample in Fig. S3† showed that the crystallinity of the catalyst decreased obviously. Besides, Fig. 9a shows the behavior of the silylated sample and TPZ-0.3 zeolite immersed in a mixture of deionized water and decalin. For the TPZ-0.3 zeolite, it rapidly settled to the water bottom, while obvious differences were observed for the samples modified with different silylating agents. Specifically, the TEOS functionalized sample stabilized the water–decalin interface partially. For the HMDS treated sample, a stable emulsion was produced in the water phase, while for the OTS functionalized zeolite, abundant droplets formed in water. Besides, the contact angle shown in Fig. 9(b) further evidenced the strong hydrophobicity of the sample after HMDS and OTS treatment, whose contact angle is 110° and 120°, respectively. Strangely, no contact angle existed for the TEOS modified zeolite and parent samples due to their weak hydrophobicity and porosity. Thus, the hydrophobicity enhanced as follows: TPZ-0.3 < TEOS < HMDS < OTS.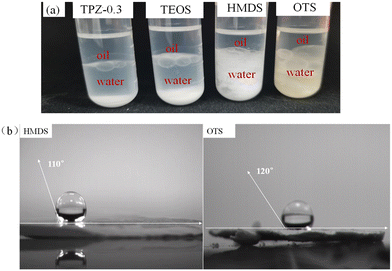 | ||
| Fig. 9 (a) Distribution of TPZ-0.3 zeolite and silylated zeolites in the biphasic water/decalin system. (b) Contact angles of the HMDS and OTS- functionalized ZSM-5 zeolite. | ||
DRIFTS study on the reaction between 2,5-DMF and ethanol
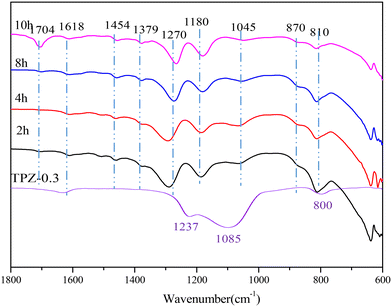
To investigate the change of species on the catalyst surface during the reaction, DRIFT characterization (shown in Fig. 10) of the catalyst after reaction for different times was performed. From the spectrum of TPZ-0.3, it can be concluded that the peaks at 1618, 1237, 1085 and 800 cm−1 were caused by the T–O–T vibrations of the zeolite.56 After reaction at 300 °C for 2 h, new peaks appeared. Specifically, the bands at 1454 and 1045 cm−1 were related to the O–H in-plane deformation and the C–O stretching vibration in ethanol, indicating that ethanol was adsorbed on the catalyst. What's more, the peak intensity decreased as the reaction time increased from 2 h to 10 h, verifying that ethanol was reduced as the reaction progressed. The peak at 1380 cm−1 corresponded to the bending vibration of the CH bond in –CH3.64 The band at 1180 cm−1 was related to the C–O stretching of ethoxy species formed due to the adsorption of ethanol on the Brønsted acid sites, which was accompanied by the formation of a water molecule.65–67 A peak at 1704 cm−1, arising from C![[double bond, length as m-dash]](https://www.rsc.org/images/entities/char_e001.gif) O vibration of the hydrolysis product,68 was also discovered, which enhanced obviously for 10 h, indicating that more 2,5-HDO and MCO were produced. The absorption peaks at 1290 cm−1 and 870 cm−1 were attributed the C–O bond in the cycloadduct. After 8 h, the bands observed at 1270 cm−1 can be assigned to C–C or ring stretching vibration of aromatic hydrocarbons, in combination with the peaks at 810 and 870 cm−1, proving the formation of p-xylene.69–71 Besides, the signal at 1290 cm−1 weakened sharply, showing that the cycloadduct was dehydrated to p-xylene under acid sites. No signal about 2,5-DMF exists, indicating that ethanol was preferentially adsorbed on the catalyst and dehydrated to ethylene, which is the first step of the reaction. Afterwards, the cycloadduct was produced by the Diels–Alder reaction between ethylene and 2,5-DMF, followed by dehydration to p-xylene. The mechanism derived from DRIFT was in accordance with the mechanism reported by Teixeira.25
O vibration of the hydrolysis product,68 was also discovered, which enhanced obviously for 10 h, indicating that more 2,5-HDO and MCO were produced. The absorption peaks at 1290 cm−1 and 870 cm−1 were attributed the C–O bond in the cycloadduct. After 8 h, the bands observed at 1270 cm−1 can be assigned to C–C or ring stretching vibration of aromatic hydrocarbons, in combination with the peaks at 810 and 870 cm−1, proving the formation of p-xylene.69–71 Besides, the signal at 1290 cm−1 weakened sharply, showing that the cycloadduct was dehydrated to p-xylene under acid sites. No signal about 2,5-DMF exists, indicating that ethanol was preferentially adsorbed on the catalyst and dehydrated to ethylene, which is the first step of the reaction. Afterwards, the cycloadduct was produced by the Diels–Alder reaction between ethylene and 2,5-DMF, followed by dehydration to p-xylene. The mechanism derived from DRIFT was in accordance with the mechanism reported by Teixeira.25
The reaction scheme of 2,5-DMF and ethanol catalyzed by acid sites is presented below (Scheme 2). Except for the main reaction (Scheme 2-1), the side reactions shown in Schemes 2-2–2-6 caused the worse reaction performance.
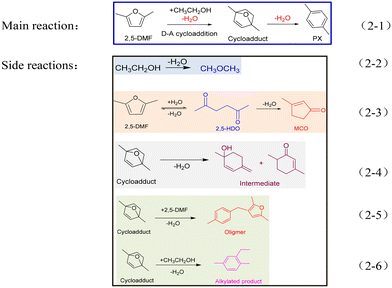 | ||
| Scheme 2 The main reaction (2-1) and side reactions (2-2–2-6) involved in the reaction system between 2,5-DMF and ethanol. | ||
Effects of alkali treatment on the reaction performance
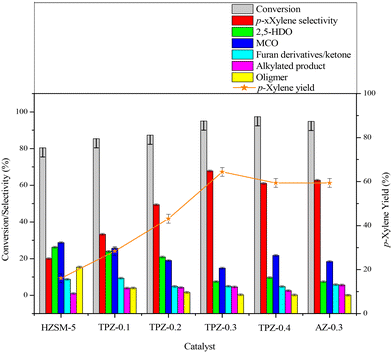
The influence of alkali treatment on the catalyst's activity and product selectivity is shown in Fig. 11 and Table 2. It's noteworthy that ∼5% 2,5-DMF conversion was achieved for the reaction with no catalyst due to the residue coke on the inner wall of the reactor, and the product consists of hydrolysis and cycloadduct products, and no p-xylene was detected. Taking this into account, the reaction performance including the 2,5-DMF conversion, product selectivity and p-xylene yield was corrected for all the results. As shown in Table 2, both the parent and alkali modified HZSM-5 zeolites can convert 2,5-DMF effectively with a conversion higher than 80%. However, the product distributions were substantially different. For the parent HZSM-5, the PX selectivity was only 20.0%, and the main product was 2,5-HDO and MCO caused by the hydrolysis of 2,5-DMF and dehydration of 2,5-HDO (shown in Scheme 2-3), respectively. The 2,5-DMF conversion and PX selectivity improved markedly for the alkali treated zeolite. These effects were more pronounced for the sample treated with 0.3 M TPAOH, in which the selectivity increased to 67.8% and the conversion reached up to 95.0%. By further increasing the concentration of TPAOH to 0.4 M, the PX selectivity decreased to 61.0% in spite of a slight improvement of the 2,5-DMF conversion, leading to a PX yield reduction from 64.4% for TPZ-0.3 to 59.4% for TPZ-0.4. For the catalyst desilicated with 0.3 M NaOH, the PX selectivity decreased from 67.8% to 62.7% without a difference in the 2,5-DMF conversion in comparison with TPZ-0.3, causing the PX yield to be reduced by 5.0%.| Catalyst | X DMF | S PX | S HDO | S MCO | S Intermediate | S AP | S Oligomer | Y PX |
|---|---|---|---|---|---|---|---|---|
Reaction conditions: 3.75 M reactant (DMF + ethanol) in heptane, molar ratios DMF/ethanol 1![[thin space (1/6-em)]](https://www.rsc.org/images/entities/char_2009.gif) : :![[thin space (1/6-em)]](https://www.rsc.org/images/entities/char_2009.gif) 2, temperature 300 °C, reaction time 10 h, 0.4 g catalyst.; X, conversion (%); S, selectivity (%); HDO, 2,5-hexanedione; MCO, 3-methyl-2-cyclopentenone; intermediate, furan derivative/ketone; AP, alkylated products; and Y, Yield (%). 2, temperature 300 °C, reaction time 10 h, 0.4 g catalyst.; X, conversion (%); S, selectivity (%); HDO, 2,5-hexanedione; MCO, 3-methyl-2-cyclopentenone; intermediate, furan derivative/ketone; AP, alkylated products; and Y, Yield (%). |
||||||||
| HZSM-5 | 80.4 | 20.0 | 26.2 | 28.7 | 8.7 | 1.0 | 15.4 | 16.1 |
| TPZ-0.1 | 85.4 | 33.3 | 23.9 | 25.6 | 9.3 | 3.9 | 4.0 | 28.4 |
| TPZ-0.2 | 87.3 | 49.4 | 20.9 | 19.0 | 4.9 | 4.2 | 1.6 | 43.1 |
| TPZ-0.3 | 95.0 | 67.8 | 7.5 | 14.8 | 5.0 | 4.6 | 0.3 | 64.4 |
| TPZ-0.4 | 97.4 | 61.0 | 9.7 | 21.7 | 4.8 | 2.6 | 0.2 | 59.4 |
| AZ-0.3 | 94.8 | 62.7 | 7.4 | 18.4 | 5.8 | 5.6 | 0.1 | 59.4 |
| TEOS | 75.9 | 60.4 | 14.5 | 10.2 | 5.8 | 7.8 | 1.5 | 45.8 |
| TMCS | 65.4 | 51.5 | 29.5 | 8.1 | 4.3 | 3.1 | 3.6 | 33.7 |
| OTS | 39.2 | 40.3 | 35.5 | 5.0 | 9.9 | 4.9 | 4.3 | 15.8 |
Combining the reaction performance and catalyst characterization, the increase of the 2,5-DMF conversion for the alkali treated zeolites would be related to the amount of mesopores created by desilication, which not only increased the number of accessible acid sites on the surface but also decreased the diffusion path length of molecules in the channel of ZSM-5 zeolites. Besides, the improvement of the reaction activity was beneficial for inhibiting secondary reactions derived from 2,5-DMF, reducing the selectivity to oligomer (Scheme 2-5) for the TPZ series and AZ-0.3 catalyst. While for the considerable changes in the product distribution, the acidity played a vital effect. For all the alkali treated catalysts, HDO and MCO (Scheme 2-3) were the main by-products. And as seen from the catalyst results in Table 2, the selectivity to HDO and MCO decreased gradually from 26.2% and 28.7% for the parent HZSM-5 to7.5% and 14.8% for TPZ-0.3, respectively. In combination with the NH3-TPD profiles, it is evidenced that the weaker acid sites were disadvantageous to the dehydration of 2,5-HDO to MCO, thus increasing the PX selectivity. This observation was in accordance with previous research.26,72 However, compared with TPZ-0.3, a large amount of MCO is generated for the TPZ-0.4 sample, even though there is not any appreciable difference in the amount and strength of acid sites. The result may be caused by the lower B/L ratio existed in TPZ-0.4. If the Brønsted acid sites were not sufficient, the zeolite can't catalyze the main reaction, especially the dehydration of the cycloadduct, effectively, thus destroying the equilibrium state of the D–A reversible reaction between 2,5-DMF and ethylene to the cycloadduct. Under these conditions, the reaction rate for 2,5-DMF hydrolysis and 2,5-HDO dehydration would be accelerated, leading to more MCO produced. That is to say, a catalyst with a lower B/L ratio would strengthen the capability for catalyzing HDO condensation reactions. This hypothesis was confirmed by the reaction catalyzed by AZ-0.3, in which more MCO was produced due to a lower B/L ratio of 2.4 it possessed when compared with the TPZ-0.3 zeolite.
Effects of silylation on the reaction performance
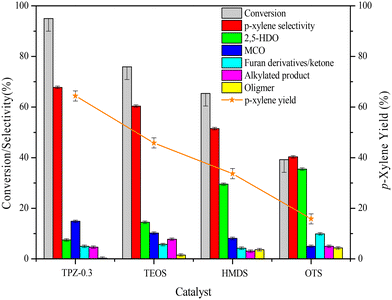
The influence of surface properties on the reaction performance is shown in Fig. 12. As described above, 2,5-HDO and MCO are the main by-products in the reaction system. To improve the catalyst performance, inhibiting or slowing down the 2,5-DMF hydrolysis reaction would be beneficial. Unexpectedly, after silanization the reaction performance became poorer than TPZ-0.3. Besides, as the hydrophobicity became stronger, the 2,5-DMF conversion and p-xylene selectivity both decreased. For the OTS modified TPZ-0.3 zeolite, the 2,5-DMF conversion and p-xylene yield decreased sharply to 39.2% and 15.8%, respectively. For product analysis of the silylated catalyst, the main by-product became 2,5-HDO, whose selectivity gradually increased as the hydrophobicity enhanced. This finding is in line with Teixeira's reports25,73 that the water generated in the reaction was able to increase the reaction rate and influence the product selectivity. It's worth noting that stronger hydrophilicity would also decrease the p-xylene yield, which can be concluded from the reaction performance of the HZSM-5 zeolite with different solvents as shown in Fig. S4.† As the solvent polarity enhanced, the p-xylene selectivity decreased due to more MCO generated. Thus, for the reaction between 2,5-DMF and ethanol to p-xylene, a system with suitable hydrophilic and hydrophobic properties is necessary.TG analysis of spent catalysts
To investigate the influence of alkali treatment and surface modification on the coking behavior of the HZSM-5 zeolite in the reaction of 2,5-DMF and ethanol, the weight change of the spent catalysts was evaluated by TG analysis. Fig. 13 reveals the TG plots of the spent HZSM-5, 0.3 M TPAOH modified zeolite (TPZ-0.3) and TEOS modified TPZ-0.3 catalyst (TEOS). Two obvious peaks were observed in the three samples. The weight loss in the temperature range of 30–250 °C was attributed to the desorption of water, reactants and products adsorbed in the catalyst pores. Another peak centered at 450 °C was caused by the burning of carbonaceous deposits.16 By quantification, the coke deposit in the HZSM-5 zeolite is approximately 14 wt%. While for the TPZ-0.3 catalyst, the amount of coke decreased to 9 wt%. After silylation, the coke amount further decreased as follows: TPZ-0.3 < TEOS < HMDS < OTS, derived from the lighter colour of these spent catalysts. Among them, the coke deposit for the TEOS modified catalyst is 5 wt% (shown in Fig. 11), indicating that the atom utilization was greatly improved. The nature of coke deposits of the samples after the reactions was measured by 13C CP/MAS NMR. Just as Fig. S5† shows, two main resonance peaks arising from different carbonaceous species are present for all the samples. In detail, the peaks at 0–50 ppm are attributed to aliphatic hydrocarbon groups indicating the presence of a significant amount of linear saturated hydrocarbons, while the signals at 130 ppm are related to the C![[double bond, length as m-dash]](https://www.rsc.org/images/entities/char_e001.gif) C groups of olefins and/or aromatics caused by the side reaction ethylene oligomerization on the acid sites of the catalysts.74,75 Besides, for different samples, the coke distribution differs. For the 0.3 M TPAOH modified HZSM-5 zeolite, the peak intensity was reduced for all signals. After TEOS silylation, the intensity decreased further. The results were consistent with the TG profiles.
C groups of olefins and/or aromatics caused by the side reaction ethylene oligomerization on the acid sites of the catalysts.74,75 Besides, for different samples, the coke distribution differs. For the 0.3 M TPAOH modified HZSM-5 zeolite, the peak intensity was reduced for all signals. After TEOS silylation, the intensity decreased further. The results were consistent with the TG profiles.
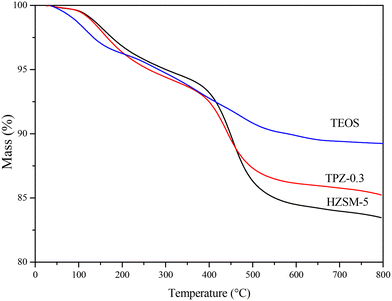 | ||
| Fig. 13 TG plots of the spent HZSM-5 zeolite, TPZ-0.3 zeolite and TEOS modified hierarchical HZSM-5 zeolite. | ||
Conclusions
The one-pot conversion of 2,5-DMF and ethanol to renewable p-xylene was realized by employing alkali (TPAOH or NaOH) modified HZSM-5 zeolites. During the treatment, the hierarchical zeolite was successfully prepared. N2 physisorption showed that the surface area and mesopore volume increased linearly as the TPAOH concentration varied from 0.1 M to 0.4 M, which are larger than those of the parent HZSM-5 zeolite. While for 0.3 M NaOH modification, the increase was more significant. By combination with 29Si MAS NMR spectra, it has been demonstrated that the inorganic base caused severer demetallization than the organic base. Besides, the acidity (including the amount, strength and B/L ratio) was also tuned concluded from NH3-TPD and Py-IR characterization. For the reaction activity, the HZSM-5 zeolite modified with 0.3 M TPAOH exhibited improved 2,5-DMF conversion and p-xylene selectivity, reaching 95.0% and 67.8%, respectively, higher than those of the parent HZSM-5 zeolite and AZ-0.3 catalyst. The better performances were closely related to its hierarchical porosity, improving the diffusion efficiency and increasing the reaction activity. What's more, the suitable acidity is beneficial for PX production by decreasing the selectivity to 2,5-HDO and MCO. To evaluate the influence of surface properties on the reaction performance, a series of silylating agents including TEOS, HMDS and OTS were adopted to prepare surface modified hierarchical zeolites with different hydrophobicity. The reaction results indicate that the stronger the hydrophobicity, the worse the reaction performance, even though there is less carbon deposit. Thus, for the reaction between 2,5-DMF and ethanol, the water produced during the reaction can promote the generation of p-xylene. The construction of surface modified hierarchical HZSM-5 zeolites extends the range of zeolite's potential applications. And the discoveries reported here are helpful in the design of a more efficient catalytic system for biomass conversion.Conflicts of interest
There are no conflicts to declare.Acknowledgements
We gratefully acknowledge the financial support from the Natural Science Foundation of Shandong Province China (Grant No. ZR2020QB052, ZR2020QB051) and the China Postdoctoral Science Foundation (Grant No. 2022M711228).References
- R. A. Sheldon, Green Chem., 2014, 16, 950–963 RSC.
- V. J. Margarit, E. M. Gallego, C. Paris, M. Boronat, M. Moliner and A. Corma, Green Chem., 2020, 22, 5123–5131 RSC.
- S.-F. Wang, M.-H. Fan, Y.-T. He and Q.-X. Li, Chin. J. Chem. Phys., 2019, 32, 513–520 CrossRef.
- B. Luna-Murillo, M. Pala, A. L. Paioni, M. Baldus, F. Ronsse, W. Prins, P. C. A. Bruijnincx and B. M. Weckhuysen, ACS Sustainable Chem. Eng., 2020, 9, 291–304 CrossRef.
- J. Pang, M. Zheng, R. Sun, A. Wang, X. Wang and Tao Zhang, Green Chem., 2016, 18, 317–576 RSC.
- B. Xiao, M. Zheng, J. Pang, Y. Jiang, H. Wang, R. Sun, A. Wang, X. Wang and T. Zhang, Ind. Eng. Chem. Res., 2015, 54, 5862–5869 CrossRef CAS.
- Y. Liao, S.-F. Koelewijn, G. V. D. Bossche, J. V. Aelst, S. V. D. Bosch, T. Renders, K. Navare, T. Nicolaï, K. V. Aelst, M. Maesen, H. Matsushima, J. Thevelein, K. V. Acker, B. Lagrain, D. Verboekend and B. F. Sels, Science, 2020, 367, 1385–1390 CrossRef CAS PubMed.
- R. Zhao, Z. Zhao, S. Li, A. N. Parvulescu, U. Muller and W. Zhang, ChemSusChem, 2018, 11, 3803–3811 CrossRef CAS PubMed.
- A. E. Settle, L. Berstis, N. A. Rorrer, Y. Roman-Leshkóv, G. T. Beckham, R. M. Richards and D. R. Vardon, Green Chem., 2017, 19, 3468–3492 RSC.
- J. A. Mendoza Mesa, F. Brandi, I. Shekova, M. Antonietti and M. Al-Naji, Green Chem., 2020, 22, 7398–7405 RSC.
- Y. P. Wijaya, H. P. Winoto, Y.-K. Park, D. J. Suh, H. Lee, J.-M. Ha and J. Jae, Catal. Today, 2017, 293–294, 167–175 CrossRef CAS.
- A. E. Settle, L. Berstis, N. A. Rorrer, Y. Roman-Leshkóv, G. T. Beckham, R. M. Richards and D. R. Vardon, Green Chem., 2017, 19, 3468–3492 RSC.
- C. C. Chang, H. Je Cho, J. Yu, R. J. Gorte, J. Gulbinski, P. Dauenhauer and W. Fan, Green Chem., 2016, 18, 1368–1376 RSC.
- J. M. J. M. Ravasco and R. F. A. Gomes, ChemSusChem, 2021, 14, 3047–3053 CrossRef CAS.
- H. J. Cho, L. Ren, V. Vattipalli, Y. H. Yeh, N. Gould, B. Xu and W. Fan, ChemCatChem, 2017, 9, 398–402 CrossRef CAS.
- R. Zhao, L. Xu, S. Huang and W. Zhang, Catal. Sci. Technol., 2019, 9, 5676–5685 RSC.
- C. L. Williams, C.-C. Chang, P. Do, N. Nikbin, S. Caratzoulas, D. G. Vlachos, R. F. Lobo, W. Fan and P. J. Dauenhauer, ACS Catal., 2012, 2, 935–939 CrossRef.
- P. T. Do, J. R. McAtee, D. A. Watson and R. F. Lobo, ACS Catal., 2013, 3, 41–46 CrossRef PubMed.
- T. W. Kim, S. Y. Kim, J. C. Kim, Y. Kim, R. Ryoo and C. U. Kim, Appl. Catal., A, 2016, 185, 100–109 CrossRef.
- S. Thiyagarajan, H. C. Genuino, J. C. van der Waal, E. de Jong, B. M. Weckhuysen, J. van Haveren and D. S. van Es, Angew. Chem., Int. Ed., 2016, 55, 1368–1371 CrossRef PubMed.
- L. Ni, J. Xin, H. Dong, X. Lu, X. Liu and S. Zhang, ChemSusChem, 2017, 10, 2394–2401 CrossRef PubMed.
- L. Ni, J. Xin, K. Jiang, L. Chen, D. Yan, X. Lu and S. Zhang, ACS Sustainable Chem. Eng., 2018, 6, 2541–2551 CrossRef CAS.
- J. Y. Yeh, S. S. Chen, S. C. Li, C. H. Chen, T. Shishido, D. C. W. Tsang, Y. Yamauchi, Y. P. Li and K. C. W. Wu, Angew. Chem., Int. Ed., 2020, 60, 624–629 CrossRef PubMed.
- L. Ye, I. Teixeira, B. T. W. Lo, P. Zhao and S. C. E. Tsang, Chem. Commun., 2017, 53, 9725–9728 RSC.
- I. F. Teixeira, B. T. Lo, P. Kostetskyy, M. Stamatakis, L. Ye, C. C. Tang, G. Mpourmpakis and S. C. Tsang, Angew. Chem., Int. Ed., 2016, 55, 13061–13066 CrossRef CAS PubMed.
- R. Zhao, L. Wu, X. Sun, H. Tan, Q. Fu, M. Wang and H. Cui, Microporous Mesoporous Mater., 2022, 334, 111787 CrossRef CAS.
- Z. Lin, M. Ierapetritou and V. Nikolakis, AIChE J., 2013, 59, 2079–2087 CrossRef CAS.
- Z. Lin, V. Nikolakis and M. Ierapetritou, Ind. Eng. Chem. Res., 2015, 54, 2366–2378 CrossRef CAS.
- Y. Liu, X. Zhou, X. Pang, Y. Jin, X. Meng, X. Zheng, X. Gao and F.-S. Xiao, ChemCatChem, 2013, 5, 1517–1523 CrossRef.
- N. Wang, W. Sun, Y. Hou, B. Ge, L. Hu, J. Nie, W. Qian and F. Wei, J. Catal., 2018, 360, 89–96 CrossRef.
- L. Y. Jia, M. Raad, S. Hamieh, J. Toufaily, T. Hamieh, M. M. Bettahar, G. Mauviel, M. Tarrighi, L. Pinard and A. Dufour, Green Chem., 2017, 19, 5442–5459 RSC.
- R. Zhao, S. Li, L. Bi, Q. Fu, H. Tan, M. Wang and H. Cui, Catal. Sci. Technol., 2022, 12, 2248–2256 RSC.
- K. Na, M. Choi and R. Ryoo, Microporous Mesoporous Mater., 2013, 166, 3–19 CrossRef.
- Z. Wang, P. Dornath, C.-C. Chang, H. Chen and W. Fan, Microporous Mesoporous Mater., 2013, 181, 8–16 CrossRef CAS.
- C. Cheng, G. Li, D. Ji, Y. Zhao and J. Shen, Microporous Mesoporous Mater., 2021, 312, 110784 CrossRef CAS.
- J. Shi, Y. Wang, W. Yang, Y. Tang and Z. Xie, Chem. Soc. Rev., 2015, 44, 8877–8903 RSC.
- H. Qu, Y. Ma, B. Li and L. Wang, Emergent Mater., 2020, 3, 225–245 CrossRef CAS.
- X. Jia, W. Khan, Z. Wu, J. Choi and A. C. K. Yip, Adv. Powder Technol., 2019, 30, 467–484 CrossRef.
- H. Sun, P. Peng, Y. Wang, C. Li, F. Subhan, P. Bai, W. Xing, Z. Zhang, Z. Liu and Z. Yan, J. Porous Mater., 2017, 24, 1513–1525 CrossRef.
- T. Weissenberger, A. G. F. Machoke, J. Bauer, R. Dotzel, J. L. Casci, M. Hartmann and W. Schwieger, ChemCatChem, 2020, 12, 2461–2468 CrossRef.
- T.-L. Cui, J.-Y. He, M. Hu, C.-S. Liu and M. Du, Microporous Mesoporous Mater., 2020, 309, 110448 CrossRef.
- Y. Jiao, L. Forster, S. Xu, H. Chen, J. Han, X. Liu, Y. Zhou, J. Liu, J. Zhang, J. Yu, C. D'Agostino and X. Fan, Angew. Chem., Int. Ed., 2020, 59, 19478–19486 CrossRef PubMed.
- S. Abelló, A. Bonilla and J. Pérez-Ramírez, Appl. Catal., A, 2009, 364, 191–198 CrossRef.
- A. Palizdar and S. M. Sadrameli, Renewable Energy, 2020, 148, 674–688 CrossRef CAS.
- J. McGlone, P. Priecel, L. Da Vià, L. Majdal and J. Lopez-Sanchez, Catalysts, 2018, 8, 253 CrossRef.
- J. C. Kim, T. W. Kim, Y. Kim, R. Ryoo, S. Y. Jeong and C. U. Kim, Appl. Catal., B, 2017, 206, 490–500 CrossRef CAS.
- H. Wang, Y. Hou, W. Sun, Q. Hu, H. Xiong, T. Wang, B. Yan and W. Qian, ACS Catal., 2020, 10, 5288–5298 CrossRef CAS.
- R. Xiong, S. I. Sandler, D. G. Vlachos and P. J. Dauenhauer, Green Chem., 2014, 16, 4086–4091 RSC.
- S. Dutta and N. S. Bhat, Biomass Convers. Biorefin., 2020 DOI:10.1007/s13399-020-01042-z.
- D. Massiot, F. Fayon, M. Capron, I. King, S. Le Calve, B. Alonso and G. Hoatson, Magn. Reson. Chem., 2002, 40, 70–76 CrossRef CAS.
- S. Bordiga, P. Ugliengo, A. Damin, C. Lamberti, G. Spoto, A. Zecchina, G. Spanò, R. Buzzoni, L. Dalloro and F. Rivetti, Top. Catal., 2001, 15, 43–52 CrossRef CAS.
- M. Bjørgen, F. Joensen, M. Spangsberg Holm, U. Olsbye, K.-P. Lillerud and S. Svelle, Appl. Catal., A, 2008, 345, 43–50 CrossRef.
- U. Fleischer, W. Kutzelnigg, A. Bleiber and J. Sauer, J. Am. Chem. Soc., 1993, 115, 7833–7838 CrossRef CAS.
- H. V. Brand, A. Redondo and P. J. Hay, J. Mol. Catal. A: Chem., 1997, 121, 45–62 CrossRef.
- M. S. Holm, S. Svelle, F. Joensen, P. Beato, C. H. Christensen, S. Bordiga and M. Bjørgen, Appl. Catal., A, 2009, 356, 23–30 CrossRef.
- Y.-W. Zhao, B.-X. Shen and H. Sun, Ind. Eng. Chem. Res., 2016, 55, 6475–6480 CrossRef.
- T. Xue, Y. M. Wang and M.-Y. He, Microporous Mesoporous Mater., 2012, 156, 29–35 CrossRef.
- P. A. Jacobs, H. K. Beyer and J. Valyon, Zeolites, 1981, 1, 161–168 CrossRef.
- L. Mafra, J. A. Vidal-Moya and T. Blasco, Annu. Rep. NMR Spectrosc., 2012, 77, 259–351 CrossRef.
- T. Polenova, R. Gupta and A. Goldbourt, Anal. Chem., 2015, 87, 5458–5469 CrossRef CAS PubMed.
- S. Xin, Q. Wang, J. Xu, Y. Chu, P. Wang, N. Feng, G. Qi, J. Trébosc, O. Lafon, W. Fan and F. Deng, Chem. Sci., 2019, 10, 10159–10169 RSC.
- Y. Jiang, J. Huang, W. Dai and M. Hunger, Solid State Nucl. Magn. Reson., 2011, 39, 116–141 CrossRef CAS PubMed.
- X. Wang, X. Zhang and Q. Wang, Ind. Eng. Chem. Res., 2019, 58(19), 8495–8505 CrossRef CAS.
- Z. S. B. Sousa, D. V. Cesar, C. A. Henriques and V. Teixeira da Silva, Catal. Today, 2014, 234, 182–191 CrossRef CAS.
- J. Wan, F. Chang, Y. Wei, Q. Xia and Z. Liu, Catal. Lett., 2008, 127, 348–353 CrossRef.
- J. N. Kondo, K. Ito, E. Yoda, F. Wakabayashi and K. Domen, J. Phys. Chem. B, 2005, 109, 10969–10972 CrossRef CAS.
- M. A. Natal-Santiago and J. A. Dumesic, J. Catal., 1998, 175, 252–268 CrossRef CAS.
- J. Coronado, S. Kataoka, I. Tejedor-Tejedor and M. Anderson, J. Catal., 2003, 219, 219–230 CrossRef CAS.
- H. S. Cerqueira, P. Ayrault, J. Datka and M. Guisnet, Microporous Mesoporous Mater., 2000, 38, 197–205 CrossRef.
- L. Cheng and X. P. Ye, Catal. Lett., 2009, 130, 100–107 CrossRef.
- H. Karge, Stud. Surf. Sci. Catal., 2001, 137, 707–746 CrossRef.
- X. Feng, Z. Cui, Y. Bao, H. Chu, X. Wu, C. Shen and T. Tan, J. Catal., 2021, 401, 214–223 CrossRef.
- I. F. Teixeira, B. T. W. Lo, P. Kostetskyy, L. Ye, C. C. Tang, G. Mpourmpakis and S. C. E. Tsang, ACS Catal., 2018, 8, 1843–1850 CrossRef.
- K. P. Datema, A. K. Nowak, J. van Braam Houckgeest and A. F. H. Wielers, Catal. Lett., 1991, 11, 267–276 CrossRef CAS.
- X. Li, W. Zhang, X. Li, S. Liu, H. Huang, X. Han and X. Bao, J. Phys. Chem. C, 2009, 113, 8228–8233 CrossRef CAS.
Footnote |
| † Electronic supplementary information (ESI) available. See DOI: https://doi.org/10.1039/d2cy01262f |
| This journal is © The Royal Society of Chemistry 2023 |

