Oxygen vacancies enhance the photocatalytic deep oxidation of NO over an N-doped KNbO3 catalyst†
Received
22nd September 2022
, Accepted 12th November 2022
First published on 14th November 2022
Abstract
N-Doped KNbO3 (N-KNbO3) was prepared through mechanical mixing, grinding and calcination of urea and KNbO3. The photocatalytic NO oxidation performance was evaluated at room temperature and under visible light irradiation. Compared with the pristine KNbO3, N-KNbO3 not only has a better NO oxidation performance but also can effectively inhibit the formation of NO2 (electron paramagnetic resonance). EPR tests showed that the doping of non-metallic element N created oxygen vacancies (OVs) on the surface of KNbO3, which was beneficial to the formation of impurity energy levels to reduce the band gap. The in situ diffuse reflectance infrared Fourier transform spectroscopy (DRIFTS) results indicated that NO acquired electrons around OVs to form N2O2− intermediates, which were then oxidized by reactive oxygen species (˙OH, ˙O2− and 1O2). Moreover, visible light can promote the activation of NO and O2 and also the formation of OVs. This work provided a new idea for the design and preparation of N-doped photocatalysts for NO photocatalytic oxidation.
1. Introduction
With the progress and development of human civilization, people have basically reached a consensus that environmental pollution (greenhouse effect, emission of toxic gases) needs to be rectified.1–5 In addition to limiting the combustion of coal and oil from the source, the purification of pollutants at the back end is the key point. NOx, as a common gas pollutant, is easily generated in automobile exhaust and chemical plants.6–8 The massive discharge has caused great harm to the entire ecological environment and humans. To effectively remove NOx, many technologies and methods have been explored and developed.9,10 Among them, the photocatalytic oxidation of NO technology is considered to be the simplest, most effective and most environmentally friendly technology.11,12
In recent years, perovskite oxides with unique physicochemical properties have attracted increasing attention from researchers.13,14 KNbO3 is a perovskite material with excellent chemical stability and has great potential in NO photocatalytic oxidation. However, KNbO3 has a wide band gap (about 3.3 eV), which greatly limited the utilization of visible light and the efficiency of photocatalytic oxidation of NO.15,16 It had been reported that the introduction of defects such as oxygen vacancies (OVs) can well solve the problem of low utilization of visible light by forming impurity energy levels.17,18 Moreover, the existence of OVs was beneficial to the adsorption and activation of NO and O2, thereby improving the photocatalytic oxidation performance of NO.19,20
Ion doping has been used for more than 30 years as a common means of introducing OVs.21,22 Both metal and non-metal doping usually accompanied the formation of OVs. It has been reported that X-g-C3N4 (X = Mg, Ca, Sr and Ba),23 Fe–TiO2,24 and Ce–SnO225 can successfully form OVs by introducing metal ions, thereby enhancing the oxidation performance of NO. Moreover, non-metal doping such as X-TiO2 (X = C, N, B)26–28 can also successfully introduce OVs into pristine samples. Among them, non-metallic N doping stands out due to its cheap experimental raw materials and simple experimental operations.
In this work, the non-metallic element N was successfully introduced into KNbO3 through mechanical mixing, grinding and calcination of urea and KNbO3. The catalytic NO oxidation performance was tested under simulated natural environment conditions. The results showed that the non-metallic element N doping can create new OVs on the surface of KNbO3, which can promote the adsorption and activation of NO and O2. Compared with pristine KNbO3, N-KNbO3 can generate more hydroxyl radicals, superoxide radicals and singlet oxygen under the excitation of visible light, and exhibited excellent photocatalytic activity and stability for NO oxidation. The possible mechanism of the photocatalytic oxidation of NO was revealed.
2. Experimental methods
2.1. Preparation methods
2.1.1. Synthesis of KNbO3 catalysts.
In a typical process, 33.60 g mol KOH was dissolved in 60 mL of deionized water to obtain a KOH solution (10 mol L−1). After it cooled to room temperature, 1.06 g of commercial Nb2O5 was added to the KOH solution and stirred magnetically for 2 h. It was then transferred to a 100 mL Teflon-lined stainless-steel autoclave, heated in an oven at 180 °C for 12 h, then centrifuged and dried to obtain white KNbO3 powder.
2.1.2. Synthesis of N-KNbO3 catalysts.
N-KNbO3 was prepared by calcination after mechanical grinding. Specifically, 1 g KNbO3 and a certain amount of urea were placed in a mortar and mechanically ground for 1 h, and then transferred to a crucible. The crucible was then transferred to a muffle furnace and heated to 425 °C at a heating rate of 2 °C min−1, and finally calcined in air for 4 h to obtain N-KNbO3. According to the amount of urea introduced, it is labelled X-N-KNbO3 (X = 1.0, 1.5, 2.0), where X represents the mass ratio of urea and KNbO3. Since 1.5-N-KNbO3 had the best catalytic activity, N-KNbO3 was referred to 1.5-N-KNbO3 unless otherwise specified.
2.2. Analytical methods
X-ray diffraction (XRD) patterns of the samples were investigated on a powder X-ray diffractometer with Cu Kα1 radiation (Bruker D8 Advance) operated at 40 kV and 40 mA. The surface morphologies of the samples were examined by scanning electron microscopy (SEM) (Hitachi S4800). SEM images were obtained on a Hitachi microscope with model SU8010. Transmission electron microscopy (TEM) and EDX mapping were carried out on a JEOL JEM-2010EX with a field emission gun at 200 kV. The Brunauer–Emmett–Teller (BET) specific surface area, pore volume and pore size were determined on a Micromeritics ASAP 2020 with nitrogen adsorption at 77 K. The optical properties of the samples were characterized using a Varian Cary 500 UV-vis diffuse reflectance spectrometer (DRS). The electron paramagnetic resonance (EPR) spectra were recorded with a Bruker A300 operating at the X-band microwave frequency (9.84 GHz). The capture agent DMPO was used to capture ˙OH and ˙O2− while TEMP was used to capture singlet oxygen (1O2). X-ray photoelectron spectroscopy (XPS) was performed using a Thermo ESCALAB 250XI with an Al-Kα X-ray source (1486.6 eV) with the C1s (284.8 eV) as a reference. The electrochemical characterization was carried out on an Autolab PGSTAT 204 with three electrode cells. The resulting FTO electrodes including the catalysts served as the working electrode. The platinum plate is used as the counter electrode and Ag/AgCl (saturated KCl solution) is used as the reference electrode. The photoluminescence (PL) emission spectra were obtained with an F-7000 FL spectrophotometer (Hitachi) with an excitation wavelength of 400 nm. NO2− and NO3− were detected by ion chromatography (Thermo Fisher-Dionex Aquion).
2.3. Catalytic activity evaluation
The reaction performance test of the catalytic oxidation of NO was carried out in an atmospheric continuous flow reactor, the same as our previous research.24,25 400 mg of catalyst was charged into a self-made quartz reactor and the reaction temperature was maintained at 25 °C using a circulating water bath (Fig. S1†). High-purity air was used to provide O2 for the reaction, NO with a concentration of 50 ppm was the reaction gas, and high-purity N2 was the balance gas. The gas flow rate of the reaction gas NO was 20 mL min−1, and the total gas flow rate of high-purity air was 80 mL min−1 (the relative humidity of the reaction was controlled by adjusting the flow rate of wet air and dry air) (Fig. S2†). The light source was provided with a 300 W PLS-SXE300D xenon lamp (Beijing Perfectlight) with a visible light-reflectance filter. The light (420 nm < λ < 760 nm) can irradiate through the quartz glass reactor to the catalyst surface. The changes in NO concentration and the resulting changes in NO2 were recorded by an NOx analyzer (Thermo Scientific Model 42i). The calculation formulas for NO conversion and NO2 selectivity were as follows:| | | NO conversion (%) = ([NO]in − [NO]out)/[NO]in × 100% | (1) |
| | | NO2 selectivity (%) = [NO2]yield/([NO]in − [NO]out) × 100% | (2) |
2.4.
In situ DRIFTS characterization for NO and O2 adsorption
In situ DRIFTS characterization was performed on an infrared instrument (Bruker VERTEX 80). The spectra were recorded at a frequency of 64 scans in the wavenumber range (1000–4000 cm−1) with a spectral resolution of 8 cm−1. The sample background was collected after the samples were pretreated in Ar at 300 °C for 1 h and then cooled to room temperature. The sample was then exposed to the reaction gas to simulate actual reaction conditions and the data were collected. Visible light was introduced onto the sample surface through the ZnSe window after the adsorption was saturated.
3. Results and discussion
3.1. Catalyst characterization
3.1.1. XRD.
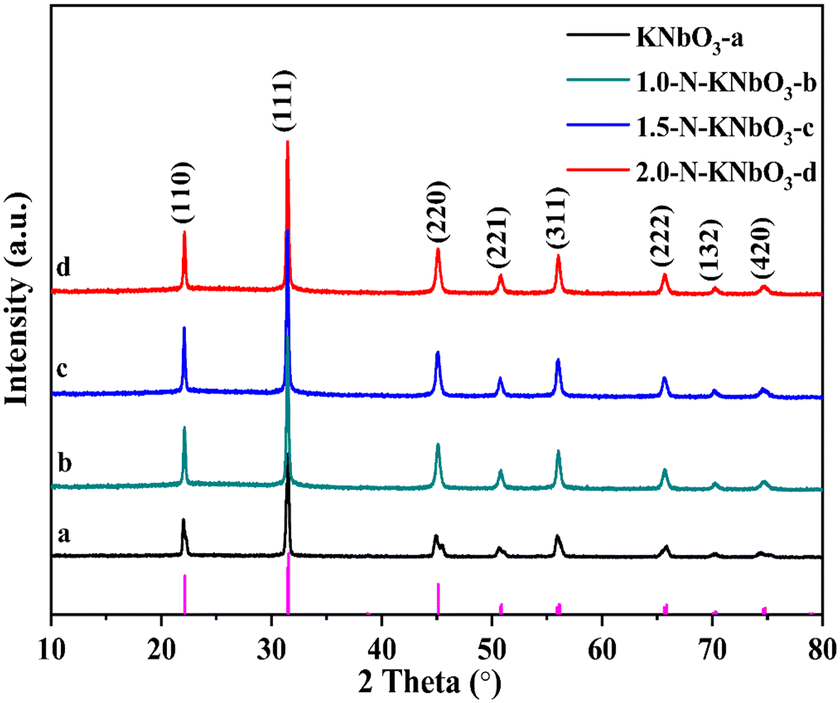
X-ray powder diffraction can be used to analyze the crystal structure of the catalyst. Fig. 1 shows the XRD patterns of the pristine KNbO3 and X-N-KNbO3. The diffraction peaks 2θ = 22.05°, 31.05°, 45.07°, 50.81°, 56.03°, 65.47°, 70.41° and 74.93° are attributed to the (110), (111), (220), (221), (311), (222), (132) and (420) planes of orthogonal KNbO3 (JCPDS no.: 71-0946).29 Compared with KNbO3, the XRD pattern of N-KNbO3 had no obvious change, indicating that non-metallic N was uniformly distributed in the KNbO3. Table S1† exhibits that KNbO3 and X-N-KNbO3 had similar lattice constants, indicating that the doping of N did not significantly destroy the crystal structure of KNbO3. The digital photos of the samples are shown in Fig. S3.† Moreover, the specific surface area, pore volume and pore size did not change significantly after N doping (Fig. S4 and Table S2 in ESI† 6).
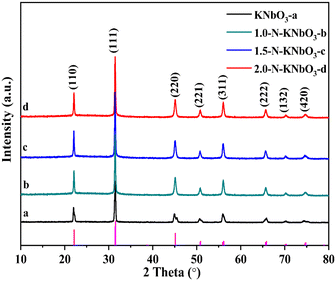 |
| | Fig. 1 XRD patterns of KNbO3 and X-N-KNbO3 (X = 1.0, 1.5, 2.0). | |
3.1.2. Morphology and microstructure.
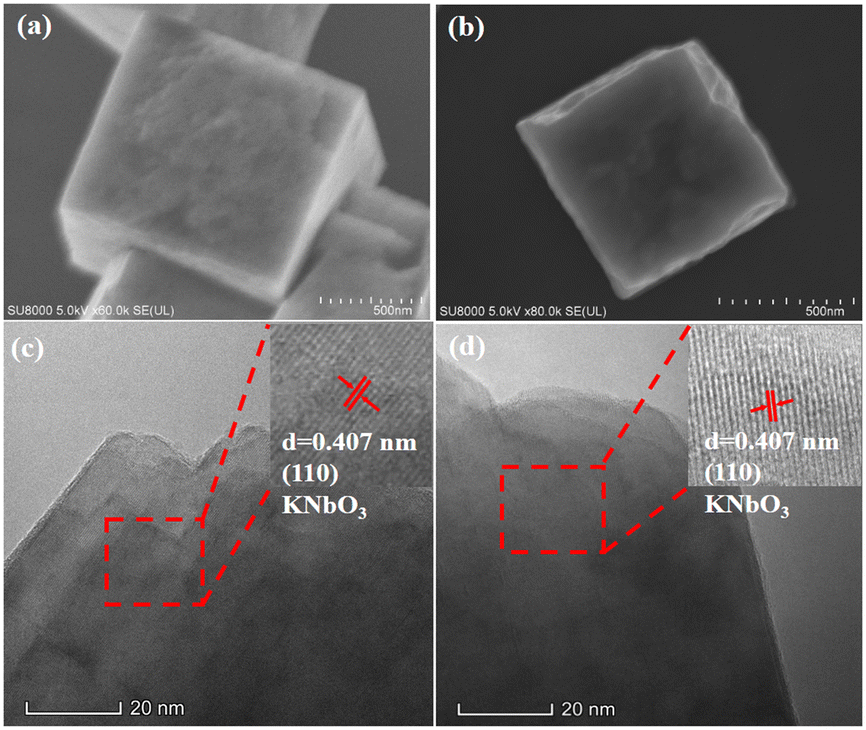
Fig. 2a and b are the SEM images of the KNbO3 and N-KNbO3. Both samples had a regular cubic structure with an edge length of about 720 nm, indicating that the doping of N did not change the KNbO3 morphology. Fig. 2c and d exhibits the HRTEM images of KNbO3 and N-KNbO3. The lattice fringes with lattice spacing d = 0.407 nm were attributed to the (110) plane of KNbO3.30 Meanwhile, EDX mapping confirmed the existence of N, K, Nb, and O elements and demonstrated that the non-metallic element N was uniformly distributed on the KNbO3 (Fig. S5†).
 |
| | Fig. 2 SEM images and HRTEM images of KNbO3 (a and c) and N-KNbO3 (b and d). The insets in figure (c) and (d) are enlarged view of the red frame. | |
3.1.3. Optical absorption properties.
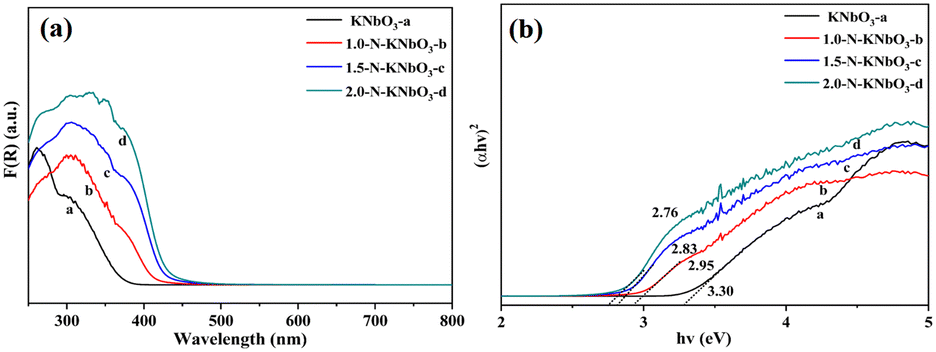
The light absorption properties of the catalysts were tested by UV-vis diffuse reflectance absorption spectroscopy. As shown in Fig. 3, the absorption band edge of the KNbO3 catalyst was about 390 nm, and the absorption band edge of N-KNbO3 had a significant redshift so that the sample had obvious light absorption in the range of 400–500 nm. This was due to the fact that N doping introduced energy state N 2p above the valence band O 2p of KNbO3, broadening the intrinsic absorption band.31 According to the Tauc plot empirical formula calculation (ESI† 5), the band gaps of the as-prepared KNbO3, 1.0-N-KNbO3, 1.5-N-KNbO3 and 2.0-N-KNbO3 were 3.3 eV, 2.95 eV, 2.83 eV and 2.76 eV (Fig. 3b), indicating that doping N could effectively reduce the band gap of KNbO3.
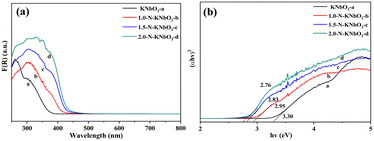 |
| | Fig. 3 UV-vis DRS (a) and Tauc plots (b) of KNbO3 and X-N-KNbO3 (X = 1.0, 1.5, 2.0). | |
3.1.4. Photoelectrochemical performance test.
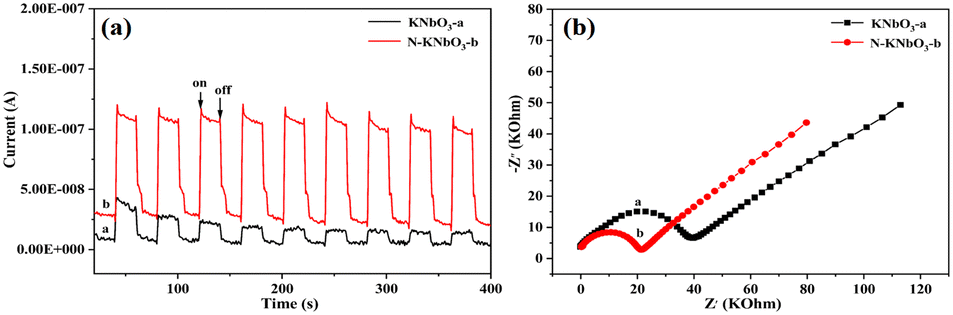
The generation, separation, and transfer of photogenerated carriers was an important process in the photocatalytic reaction process, so photoelectrochemical tests were performed to study the photogenerated carrier transfer and separation capabilities of catalysts under visible light. Fig. 4a exhibits the transient photocurrent curves of KNbO3 and N-KNbO3 under multiple light-on–off cycles. The photocurrent of the N-KNbO3 catalyst was significantly stronger than that of the KNbO3 under the same conditions. The photocurrent of the KNbO3 catalyst showed that the introduction of non-metallic element N can improve the separation efficiency of photogenerated electrons and holes.32 Moreover, Fig. 4b shows the electrochemical impedance spectra (EIS). N-KNbO3 had a smaller radius of curvature, indicating that N-KNbO3 had a smaller transport resistance, which was beneficial to improving the photogenerated charge carrier separation.33
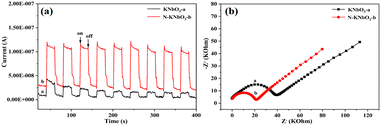 |
| | Fig. 4 Transient photocurrent (a) and electrochemical impedance spectra (b) of KNbO3 and N-KNbO3. | |
3.1.5. Fluorescence spectra.
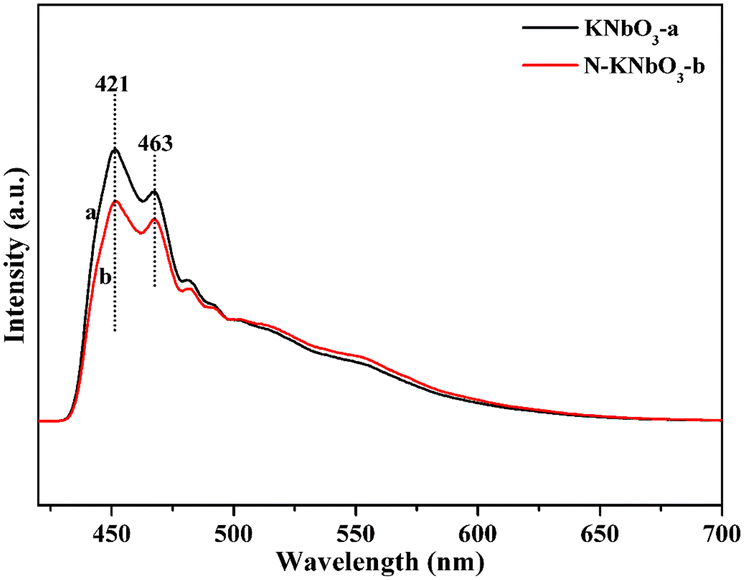
To further verify the separation ability of photogenerated carriers, fluorescence experiments were carried out. Fig. 5 shows the fluorescence spectra of KNbO3 and N-KNbO3. The peaks at 421 nm and 463 nm were ascribed to the strong blue emission of KNbO3, which was due to the intrinsic radiative emission associated with the charge transfer of the oxygen atom to the central niobium atom of the NbO6 octahedron.34 Compared with the KNbO3 catalyst, the peak intensity of N-KNbO3 decreased to a certain extent, indicating that the doping of N was beneficial to inhibit the recombination of photogenerated carriers, which was consistent with the photocurrent and EIS experimental results.
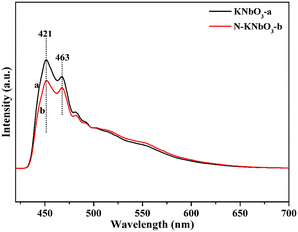 |
| | Fig. 5 Fluorescence spectra of KNbO3 and N-KNbO3. | |
3.1.6. EPR.
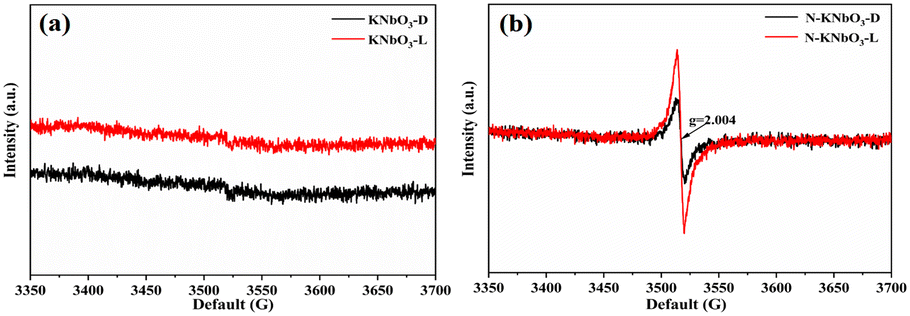
The OVs and reactive oxygen species (ROS) of KNbO3 and N-KNbO3 were further investigated by EPR characterization. As shown in Fig. 6a, the KNbO3 had no EPR signal peak under dark conditions or under visible light while the signal peak of g = 2.004 for N-KNbO3 can be attributed to the OVs under dark conditions (Fig. 6b). The signal peaks indicated that the introduction of non-metallic element N was beneficial to KNbO3 to generate a large number of OVs. Meanwhile, the EPR signal peak of g = 2.004 was significantly enhanced under the irradiation of visible light, which confirmed that the irradiation of visible light was favorable for the further generation of OVs.35
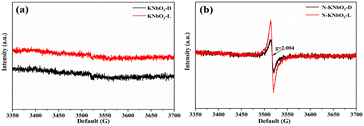 |
| | Fig. 6 Solid-phase EPR spectra of KNbO3 (a) and N-KNbO3 (b) in the dark and under visible light conditions. | |
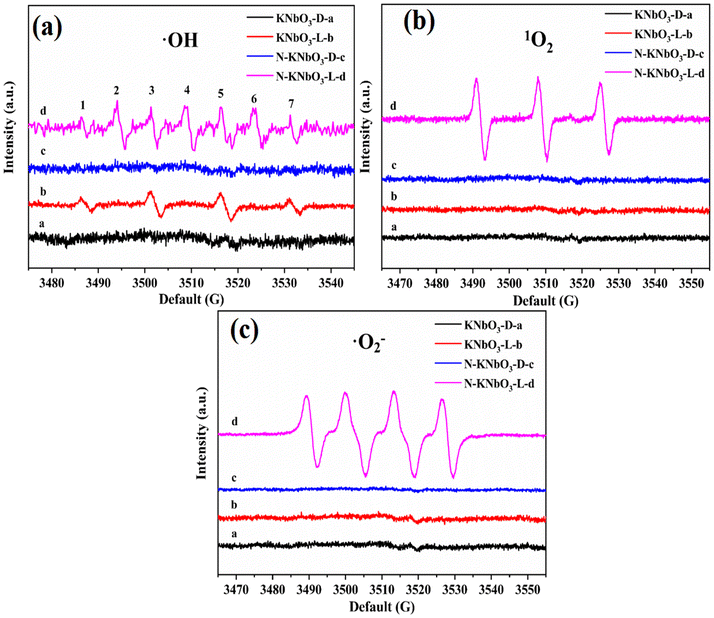
Liquid-phase EPR tests were performed to characterize the ROS of the reaction. KNbO3 and N-KNbO3 had no EPR signal peaks of ˙OH (Fig. 7a). KNbO3 and N-KNbO3 showed signal peaks of ˙OH with a signal intensity ratio of 1![[thin space (1/6-em)]](https://www.rsc.org/images/entities/char_2009.gif) :2:2:1 (numbered 1, 3, 5, and 7) under visible light, and the signal of the latter was significantly stronger than that of the former because the presence of OVs were more conducive to the production of ˙OH. 1O2 peaks also appeared for N-KNbO3 with a signal intensity ratio of 1:1:1 (numbered 2, 4, and 6) under visible light, which was due to the cleavage and oxidation of the C–N bond by the reaction of DMPO and 1O2.36 To further verify the existence of 1O2, TEMP was used to capture 1O2. As expected, 1O2 was successfully detected in N-KNbO3 under visible light conditions.
:2:2:1 (numbered 1, 3, 5, and 7) under visible light, and the signal of the latter was significantly stronger than that of the former because the presence of OVs were more conducive to the production of ˙OH. 1O2 peaks also appeared for N-KNbO3 with a signal intensity ratio of 1:1:1 (numbered 2, 4, and 6) under visible light, which was due to the cleavage and oxidation of the C–N bond by the reaction of DMPO and 1O2.36 To further verify the existence of 1O2, TEMP was used to capture 1O2. As expected, 1O2 was successfully detected in N-KNbO3 under visible light conditions.
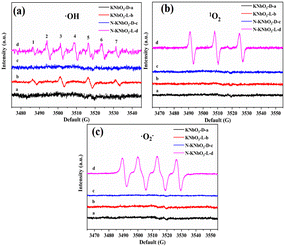 |
| | Fig. 7 EPR spectra of ˙OH (a), 1O2 (b) and ˙O2− (c). | |
Fig. 7c shows the EPR spectra of ˙O2−. Both KNbO3 and N-KNbO3 had no signal peaks under dark conditions. However, N-KNbO3 had a significant ˙O2− signal peak under visible light, which was due to the easy acquisition of electrons by O2 molecules around OVs.37
3.2. NO oxidation removal activity test
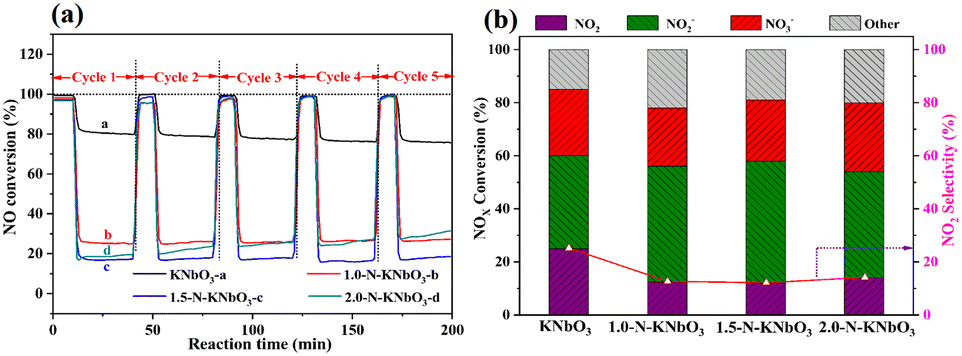
Fig. 8a shows the five consecutive cycle activity tests of the photocatalytic NO oxidation of KNbO3 and X-N-KNbO3. Photocatalytic oxidation of NO over KNbO3 had a conversion of about 20% and can maintain excellent durability. The performance of X-N-KNbO3 for the photocatalytic oxidation of NO was significantly improved, and especially 1.5-N-KNbO3 exhibited the best performance under visible light. Specifically, the photocatalytic oxidation conversion of NO remained around 83% during the five consecutive light–dark cycles. It is worth noting that the N doping amount of 1.5-N-KNbO3 was about 7 at% (Table S3 in ESI† 7). However, the performance decreased with the increase of the doping amount of non-metallic element N (2.0-N-KNbO3). It may be that the introduction of too much non-metallic element N led to the formation of more defect energy levels in the sample, which acted as the recombination center of photogenerated carriers to prevent the transfer of electron–hole pairs to the reaction molecules, thereby inhibiting the photocatalytic NO oxidation performance.38
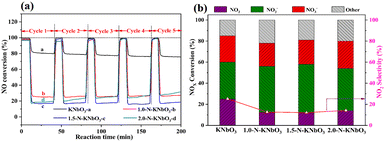 |
| | Fig. 8 NO removal curves under visible light irradiation at relative humidity (RH = 50%) (a); NOx species distribution (b) over KNbO3 and X-N-KNbO3 (X = 1.0, 1.5, 2.0). | |
In order to further explore the selectivity of the samples, the target products (NO2− and NO3−) were detected by ion chromatography (Table S4 in ESI† 8). As shown in Fig. 8b, the introduction of N effectively suppressed the generation of the toxic by-product NO2, showing higher NO photocatalytic oxidation selectivity. In addition, the photocatalytic oxidation products of KNbO3 and X-N-KNbO3 were mainly nitrite. Based on the above experimental results, it can be determined that the introduction of N created more active sites in the catalyst to promote the further conversion of NO2.
3.3. The analysis of XPS
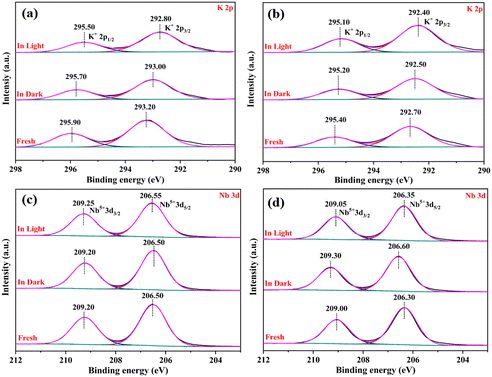
To further explore the chemical state of the catalysts and the electron density of the surface, XPS tests were performed on the as-prepared catalysts under different treatments: the fresh sample, reacted in the dark, and reacted under visible light irradiation. As shown in Fig. 9a, two characteristic peaks at 292.80 eV and 295.50 eV were assigned to K 2p3/2 and K 2p1/2 of KNbO3, respectively.39 Compared with K 2p of KNbO3, the characteristic peak of K 2p of N-KNbO3 was shifted by 0.5 eV to the lower binding energy, indicating that the introduction of non-metallic element N was beneficial to improving the electron density of K 2p. Besides, the electron binding energy of K 2p decreased after the dark reaction and the electron binding energy was further reduced after visible light illumination, which was due to the adsorption of the target products (NO2− and NO3−) on K+.40
 |
| | Fig. 9 High-resolution XPS spectra of K 2p (a and b) and Nb 3d (c and d,) under different treatments over KNbO3 and N-KNbO3 samples. | |
Fig. 9c and d show the high-resolution spectra of Nb 3d of KNbO3 and N-KNbO3, respectively. The two characteristic peaks at 206.50 eV and 209.20 eV correspond to Nb 3d5/2 and Nb 3d3/2 of KNbO3, respectively. Compared with Nb 3d of KNbO3, the characteristic peak of Nb 3d of N-KNbO3 was shifted by 0.2 eV to the lower binding energy, indicating that electrons migrate from N atoms to Nb atoms. Moreover, the binding energy of Nb 3d in N-KNbO3 increased by 0.3 eV after the dark reaction, which indicated that the Nb atom acted as an electron donor in the dark reaction, transferring electrons to reactive molecules, which were beneficial to the adsorption and activation of NO and O2.41 However, the binding energy decreased by 0.25 eV under visible light irradiation, which indicated that the photogenerated electrons generated by the irradiation can migrate to the Nb atoms to compensate for the electrons on the Nb atoms. Simultaneously, the characteristic peaks corresponding to Nb 3d of KNbO3 did not change significantly before and after the reaction, which also indicated that KNbO3 had a poor performance for the photocatalytic oxidation of NO.
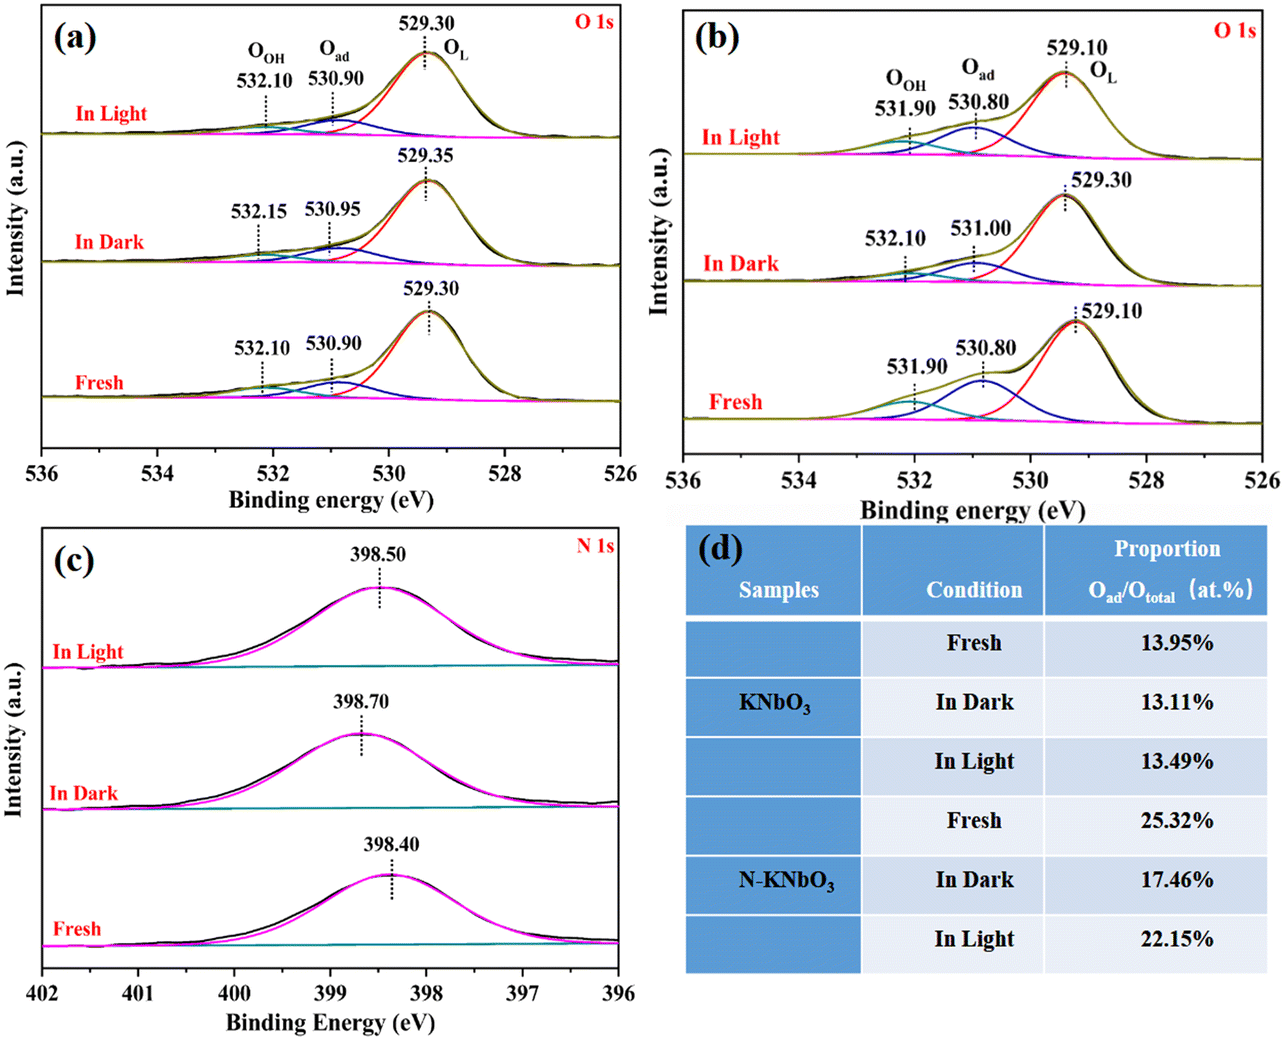
The XPS high-resolution spectra of O 1s were fitted to three characteristic peaks (OL, Oad, and OOH) in Fig. 10a and b.42 Compared with KNbO3, the three characteristic peak changes corresponding to O 1s of N-KNbO3 were consistent with those of Nb, which may be due to the doping of non-metallic N producing more OVs to enrich electrons. This was consistent with the EPR results. In addition, the electronic binding energy of the three characteristic peaks of O 1s of N-KNbO3 increases by 0.3 eV in the dark reaction, and decreases by 0.2 eV under visible light illumination, which was consistent with the changing trend of Nb 3d. The three characteristic peaks of O 1s of KNbO3 did not change significantly under the three conditions, indicating that the O atom remained stable during the catalytic reaction.
 |
| | Fig. 10 High-resolution XPS spectra of O 1s (a and b) and N 1s (c) and relative content of Oad (d) under different treatments over KNbO3 and N-KNbO3 samples. | |
Fig. 10c shows the XPS high-resolution spectra of N 1s. The electron binding energy was located at 398.40 eV, which belongs to the characteristic peak of N.43 The electron binding energy increased after the dark reaction, and the electron binding energy decreased under the irradiation of visible light. This was consistent with the changing trend of Nb 3d and O 1s, indicating that they participated as a whole in the process of photocatalytic NO oxidation.
To further explore the changes in the relative content of Oad during the reaction process, the calculation results are shown in Fig. 10d. During the reaction process, the relative content of Oad in KNbO3 did not change significantly, which also reflected the poor photocatalytic oxidation performance of KNbO3 for NO. The relative content of Oad of N-KNbO3 after the dark reaction was reduced by about 5% compared with that of fresh N-KNbO3, which was due to the adsorption of the target product NO2− or NO3− on the catalyst surface. Compared with the dark reaction, the Oad of N-KNbO3 increased under visible light irradiation, which may be due to the partial lattice oxygen being migrated out to generate more OVs under light irradiation. In addition, compared with KNbO3, N-KNbO3 had a significant increase in surface chemisorbed oxygen (Oad), which was due to the introduction of N to generate more OVs.
3.4.
In situ diffuse reflectance infrared Fourier transform spectroscopy (DRIFTS)
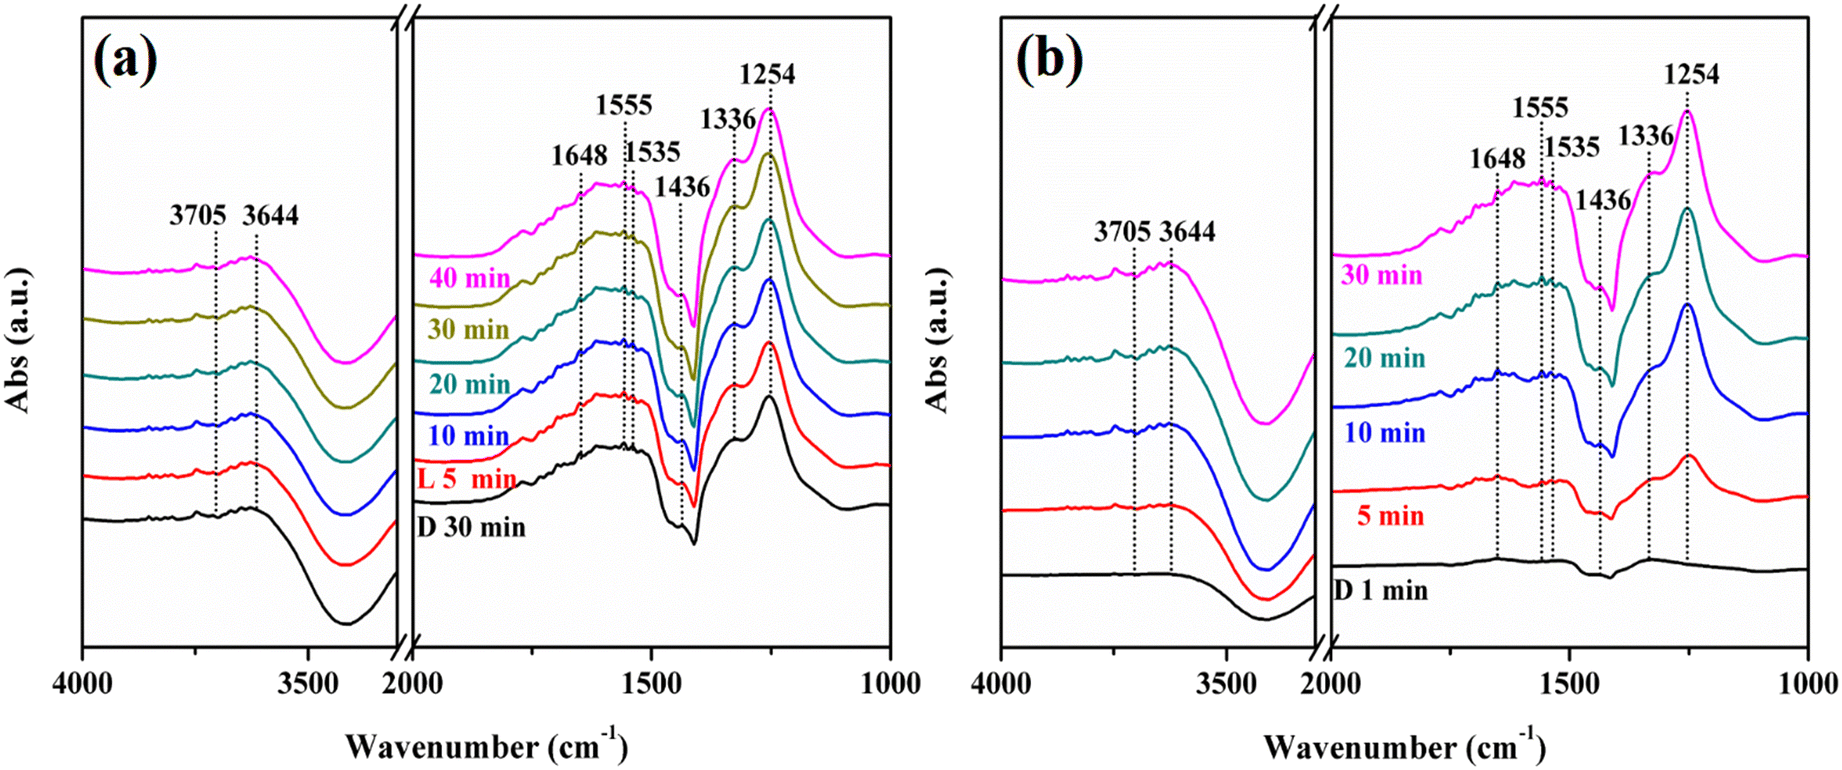
To further explore the reaction mechanism of this reaction, in situ DRIFTS characterization was performed. When the reaction gas was introduced, some infrared peaks appeared and the peaks were assigned as shown in Table 1. Fig. 11a and b show the spectra of the NO + O2 co-adsorption of KNbO3 under dark conditions and visible light, respectively. The peaks at 3705 cm−1 and 3644 cm−1 belong to the terminal hydroxyl and the bridging hydroxyl groups, respectively.44,45 With the extension of the adsorption time, these two peaks were continuously consumed. Besides, infrared peaks at 1648 cm−1, 1555 cm−1, 1535 cm−1, 1436 cm−1, 1336 cm−1 and 1254 cm−1 were generated, which were attributed to the bending vibration peak of H2O, bidentate nitrate (K+-NO3−), bridge bidentate nitrite (K+-NO2−), monodentate nitrite (K+-NO2−), bridge bidentate nitrate (Nb5+-NO3−), and bridge bidentate nitrite (Nb5+-NO2−).46 This indicated that NO mainly interacted with hydroxyl groups on the catalyst surface to form nitrate and nitrite under dark reaction conditions. When the adsorption was saturated, visible light was introduced. The bridge bidentate nitrate peaks and the bridge bidentate nitrite peaks at 1336 cm−1 and 1254 cm−1 increased continuously, indicating that visible light is beneficial to promoting the photocatalytic oxidation of NO.48
Table 1
In situ DRIFTS peak assignments of KNbO3 and N-KNbO3
| Wavenumber (cm−1) |
Assignment |
Ref. |
| 3705 |
–OH (terminal) |
44
|
| 3644 |
–OH (bridging) |
45
|
| 3540 |
NOH |
48
|
| 1648 |
H2O (bending vibration) |
24
|
| 1555 |
K+-NO3− (bidentate nitrates) |
47
|
| 1535,1507 |
K+-NO2− (bridging bidentate nitrites) |
43
|
| 1436 |
K+-NO2− (mondentate nitrites) |
40
|
| 1348,1336 |
Nb5+-NO3− (bridging bidentate nitrates) |
47
|
| 1260,1254 |
Nb5+-NO2− (bridging bidentate nitrites) |
48
|
| 1224 |
Nb5+-NO3− (bridged bidentate nitrates) |
49
|
| 1080 |
trans-N2O2− |
50
|
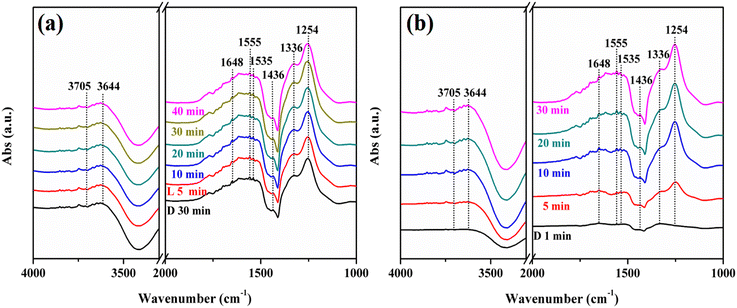 |
| | Fig. 11
In situ DRIFTS spectra of adsorbing NO + O2 and the visible light reaction process over KNbO3 samples (a and b) (D is equal to dark; L is equal to light). | |
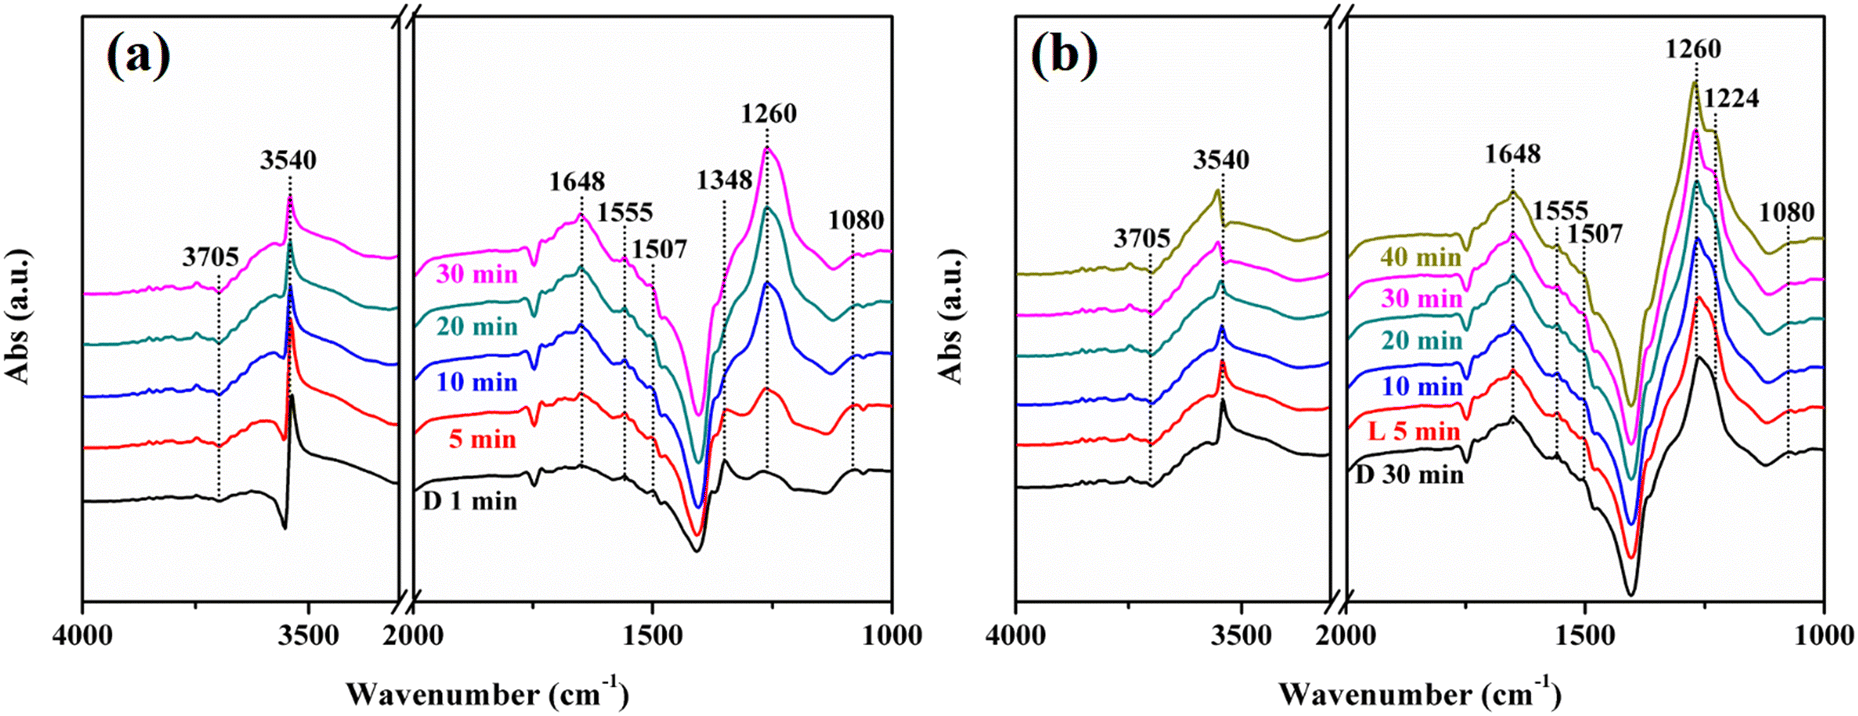
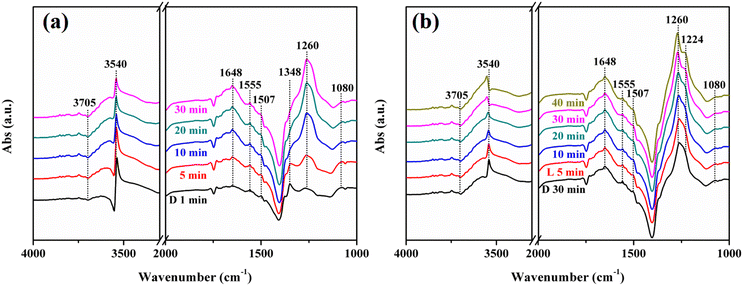
Fig. 12 exhibits the in situ DRIFTS of the NO + O2 co-adsorption of N-KNbO3. The reactive molecules NO + O2 were introduced under dark conditions. With the extension of the adsorption time, the terminal hydroxyl group at 3705 cm−1 and the N–OH at 3540 cm−1 decreased continuously.48 The H2O at 1648 cm−1 and the bidentate nitrate (K+-NO3−) at 1555 cm−1, bridge bidentate nitrite (K+-NO2−) at 1507 cm−1, bridge bidentate nitrite (Nb5+-NO2−) at 1348 cm−1 and bridge bidentate nitrates (Nb5+-NO3−) at 1260 cm−1 were formed.49 This was due to the activation of NO by hydroxyl groups on the catalyst surface, resulting in the formation of nitrate and nitrite accompanied by the generation of H2O. The trans-N2O2− at 1080 cm−1 also decreased with the prolongation of the reaction time, which was due to the reaction with hydroxyl groups to generate nitrite (1260 cm−1).50 The peak at 1348 cm−1 attributed to bridge bidentate nitrate decreased continuously until it disappeared, which was due to the conversion of nitrate to nitrite by the reaction gas NO (NO3− + NO → NO2−).
 |
| | Fig. 12
In situ DRIFTS spectra of adsorbing NO + O2 and the visible light reaction process over N-KNbO3 samples (a and b) (D is equal to dark; L is equal to light). | |
When the adsorption was saturated and visible light was introduced, the terminal hydroxyl group (3705 cm−1) and trans-N2O2− (1080 cm−1) were continuously consumed, and the 1260 cm−1 peak attributed to bridge bidentate nitrite was continuously increased. A new peak appears at 1224 cm−1, which was attributed to bridge bidentate nitrates (Nb5+-NO3−). This was due to the fact that visible light can promote the conversion of surface hydroxyl groups, H2O and O2 into ROS: ˙OH, ˙O2− and 1O2, thereby promoting the deconversion of NO and N2O2− into nitrate and nitrite. Moreover, the N–OH at 3540 cm−1 decreased continuously under visible light illumination and showed a slight blue shift, which were due to the adsorption of NO on OVs and the interaction with surface hydroxyl groups. A large number of ROS further reacted with N–OH to generate nitrate or nitrite under light conditions.
3.5. Mechanism of NO removal over N-KNbO3
1. The adsorption process of NO over N-KNbO3 in the dark.
(1) The NO reacted with surface hydroxyl groups:| | | NO-K+ + 2OH− (3705 cm−1) → K+-NO2− (1507 cm−1) + H2O (1655 cm−1) | (1-1) |
| | | NO-K+ + 2OH− (3644 cm−1) → K+-NO3− (1555 cm−1) + H2O | (1-2) |
| | | NO-Nb5+ + 2OH− (3705 cm−1) → Nb5+-NO2− (1260 cm−1) + H2O | (1-3) |
| | | NO-Nb5+ + 2OH− (3644 cm−1) → Nb5+-NO3− (1348 cm−1) + H2O | (1-4) |
(2) A certain amount of bridge bidentate nitrate continues to interact with NO to obtain bridge bidentate nitrite:
| | | Nb5+-NO3− (1348 cm−1) + NO → Nb5+-NO2− (1260 cm−1) | (1-5) |
(3) NO gained electrons at the OVs to form an intermediate species N2O42−
| | | 2NO + e− → N2O2− (1080 cm−1) | (1-6) |
2. The photocatalytic oxidation of NO over N-KNbO3.
(1) Photogenerated electrons and holes were generated under visible light:| | | N-KNbO3 + hν → h+ + e− | (2-1) |
(2) The photogenerated holes reacted with surface hydroxyl groups and water to generate hydroxyl radicals:
(3) The existence of OVs was conducive to the easier adsorption of O2, thereby capturing photogenerated electrons to generate superoxide radicals, and some superoxide radicals continue to react with holes to generate singlet oxygen:
(4) Visible light irradiation enriched the electron density on the sample surface to promote the generation of OVs, which was the reason for the good stability of the samples:
| | | N-KNbO3 + e− → N-KNbO3-OVs | (2-6) |
(5) The generated ROS (˙OH, ˙O2− and 1O2) further interacted with NO or intermediate N2O2− to generate nitrate or nitrite:
| | | NO-Nb5+ + ˙OH/1O2 → Nb5+-NO3− (1224 cm−1) + H | (2-7) |
| | | NO-Nb5+ + ˙O2− → Nb5+-NO3− (1224 cm−1) | (2-8) |
| | | N2O2− + ˙OH/1O2 → 2Nb5+-NO2− (1260 cm−1) + H+ | (2-9) |
| | | N2O2− + ˙O2− → 2Nb5+-NO2− (1260 cm−1) | (2-10) |
(6) Some NO2 reacted with ROS to form the target product nitrate or nitrite
| | | NO2-Nb5+ + ˙OH/1O2 → Nb5+-NO3− (1224 cm−1) + H+ | (2-11) |
| | | NO2-Nb5+ + ˙O2− → Nb5+-NO3− (1224 cm−1) | (2-12) |
| | | NO2-K+ + ˙OH/1O2 → K+-NO3− (1555 cm−1) + H+ | (2-13) |
| | | NO2-K+ + ˙O2− → K+-NO3− (1555 cm−1) | (2-14) |
The proposed process of the NO + O2 reaction over N-KNbO3 under visible light irradiation is described in Fig. 13. NO was adsorbed & activated at OVs and then the formed N2O2− intermediates reacted with the ROS induced by visible light irradiation into NO2− and NO3−. It is worth noting that the ability to generate free radicals (O2−, 1O2) was a key factor for the enhanced N-KNbO3 activity.
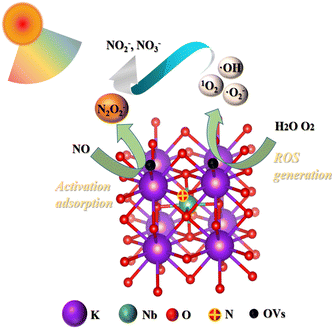 |
| | Fig. 13 The proposed process of the NO + O2 reaction over N-KNbO3 under visible light irradiation. NO was adsorbed & activated at OVs and then the formed N2O2− intermediates reacted with the ROS induced by visible light irradiation into NO2− and NO3−. | |
Furthermore, the energy band structures of KNbO3 and N-KNbO3 (Fig. S6 and S7†) and the photocatalytic oxidation mechanism of NO on KNbO3 (ESI† 10) are provided in the ESI.†
4. Conclusions
A series of N-KNbO3 was prepared by mechanical mixing, grinding and calcination of urea and KNbO3, and their photocatalytic NO oxidation performance was tested under simulated natural environment conditions. Combined with the activity and a series of characterization, the relevant mechanism of NO photocatalytic oxidation was explored. The conclusions were as follows:
(I) Compared with KNbO3, the photocatalytic NO oxidation performance of N-KNbO3 was significantly improved. It had good stability in five cycles and the production of toxic by-product NO2 decreased.
(II) The introduction of the non-metal element N can create new oxygen vacancies in the catalyst KNbO3 to promote the adsorption and activation of the reaction molecule O2. Besides, the impurity energy level formed by OVs can narrow the band gap and promote the effective utilization of visible light.
(III) The method of mechanically grinding urea with samples followed by calcination is a simple and effective method for the N-doping of samples.
This work provided a new idea for the design and preparation of N-doped photocatalysts for NO photocatalytic oxidation.
Conflicts of interest
There are no conflicts to declare.
Acknowledgements
This work was financially supported by the National Natural Science Foundation of China (no. 21872030) and the Key Program of Qingyuan Innovation Laboratory (Grant No. 00121001).
Notes and references
- L. Han, S. Cai, M. Gao, J. Y. Hasegawa, P. Wang, J. Zhang, L. Shi and D. Zhang, Chem. Rev., 2019, 119, 10916–10976 CrossRef.
- J. Zhao, Y. Xia, M. Li, S. Li, W. Li and S. Zhang, Environ. Sci. Technol., 2016, 50, 8705–8712 CrossRef PubMed.
- Y. Duan, Y. Wang, L. Gan, J. Meng, Y. Feng, K. Wang, K. Zhou, C. Wang, X. Han and X. Zhou, Adv. Energy Mater., 2021, 11, 2004001 CrossRef.
- J. Li, Z. Zhang, W. Cui, H. Wang, W. Cen, G. Johnson, G. Jiang, S. Zhang and F. Dong, ACS Catal., 2018, 8, 8376–8385 CrossRef.
- L. Wang, M. Xia, H. Wang, K. Huang, C. Qian, C. T. Maravelias and G. A. Ozin, Joule, 2018, 2, 1055–1074 CrossRef.
- Y. Zhang, Z. Liang, G. Zhang, J. Liu, Y. Wang, Y. Zhao, G. Li and Y. Lv, Catal. Sci. Technol., 2022, 12, 4871–4883 RSC.
- Q. Yang, X. Wang, X. Wang, Q. Li, L. Li, W. Yang, X. Chu, H. Liu, J. Men, Y. Peng, Y. Ma and J. Li, ACS Catal., 2021, 11, 14507–14520 CrossRef.
- K. Kobayashi, R. Atsumi, Y. Manaka, H. Matsumoto and T. Nanba, Catal. Sci. Technol., 2019, 9, 2898–2905 RSC.
- A. Filtschew, P. Beato, S. B. Rasmussen and C. Hess, Phys. Chem. Chem. Phys., 2021, 23, 1874–1887 RSC.
- L. Han, S. Cai, M. Gao, J. Y. Hasegawa, P. Wang, J. Zhang, L. Shi and D. Zhang, Chem. Rev., 2019, 119, 10916–10976 CrossRef.
- W. Dong, W. Zhang, Y. Cui, H. Sun, Z. Wu Huang and F. Dong, Catal. Sci. Technol., 2017, 7, 1324–1332 RSC.
- H. Wang, Y. Sun, G. Jiang, Y. Zhang, H. Huang, Z. Wu, S. C. Lee and F. Dong, Environ. Sci. Technol., 2018, 52, 1479–1487 CrossRef CAS PubMed.
- C. Huang, Y. Zhu, X. Wang, X. Liu, J. Wang and T. Zhang, J. Catal., 2017, 347, 9–20 CrossRef CAS.
- Y. Huang, Y. Liang, Y. Rao, D. Zhu, J. J. Cao, Z. Shen, W. Ho and S. C. Lee, Environ. Sci. Technol., 2017, 51, 2924–2933 CrossRef CAS PubMed.
- J. He, F. Gao, H. Wang, F. Liu, J. Lin, B. Wang, C. Liu, F. Huang, Z. Lin and M. Wang, Environ. Sci.: Nano, 2022, 9, 1952–1960 RSC.
- W. Tang, X. Xue, C. Yuan, J. Chen, L. Miao, Q. Feng, J. Xu, G. Rao, J. Wang, C. Zhou and Y. Guo, J. Mater. Chem. A, 2022, 10, 7238–7250 RSC.
- A. Sarkar and G. G. Khan, Nanoscale, 2019, 11, 3414–3444 RSC.
- Q. Ji, L. Bi, J. Zhang, H. Cao and X. S. Zhao, Energy Environ. Sci., 2020, 13, 1408–1428 RSC.
- X. Pan, M. Q. Yang, X. Fu, N. Zhang and Y. J. Xu, Nanoscale, 2013, 5, 3601–3614 RSC.
- G. Cheng, X. Tan, X. Song, X. Chen, W. Dai, R. Yuan and X. Fu, Appl. Catal., B, 2019, 251, 130–142 CrossRef CAS.
- H. Shao, X. Bai, H. Cui, G. Pan, P. Jing, S. Qu, J. Zhu, Y. Zhai, B. Dong and H. Song, Nanoscale, 2018, 10, 1023–1029 RSC.
- M. Hu, S. Du, B. Dong, Y. Qi, Z. Feng and F. Zhang, J. Mater. Chem. A, 2022, 10, 16541–16546 RSC.
- M. Zhou, G. Dong, J. Ma, F. Dong, C. Wang and J. Sun, Appl. Catal., B, 2020, 273, 119007 CrossRef CAS.
- G. Cheng, X. Liu, X. Song, X. Chen, W. Dai, R. Yuan and X. Fu, Appl. Catal., B, 2020, 277, 119196 CrossRef CAS.
- X. Song, G. Qin, G. Cheng, W. Jiang, X. Chen, W. Dai and X. Fu, Appl. Catal., B, 2021, 284, 119761 CrossRef CAS.
- F. Dong, S. Guo, H. Wang, X. Li and Z. Wu, J. Phys. Chem. C, 2011, 115, 13285–13292 CrossRef CAS.
- K. Wang, T. Peng, Z. Wang, H. Wang, X. Chen, W. Dai and X. Fu, Appl. Catal., B, 2019, 250, 89–98 CrossRef CAS.
- X. Wang, K. Wang, H. Wang, Z. Wang, X. Chen, W. Dai and X. Fu, Phys. Chem. Chem. Phys., 2021, 23, 186–195 RSC.
- R. Wang, Y. Zhu, Y. Qiu, C.-F. Leung, J. He, G. Liu and T.-C. Lau, Chem. Eng. J., 2013, 226, 123–130 CrossRef CAS.
- D. Yu, Z. Liu, J. Zhang, S. Li, Z. Zhao, L. Zhu, W. Liu, Y. Lin, H. Liu and Z. Zhang, Nano Energy, 2019, 58, 695–705 CrossRef CAS.
- A. I. Kontos, A. G. Kontos, Y. S. Raptis and P. Falaras, Phys. Status Solidi RRL, 2008, 2, 83–85 CrossRef CAS.
- S. S. Wong, M. J. Hülsey, H. An and N. Yan, Catal. Sci. Technol., 2022, 12, 5217–5228 RSC.
- A. Liu, J. Hu, J. He, X. Huang, N. Hu, Y. Li, Q. Huang, S. Guo, X. Liu, Z. Yang, Y. Zhou and Z. Zou, Catal. Sci. Technol., 2021, 11, 7963–7972 RSC.
- J. Yu, Z. Chen, L. Zeng, Y. Ma, Z. Feng, Y. Wu, H. Lin, L. Zhao and Y. He, Sol. Energy Mater. Sol. Cells, 2018, 179, 45–56 CrossRef CAS.
- X. Tan, G. Cheng, X. Song, X. Chen, W. Dai and X. Fu, Catal. Sci. Technol., 2019, 9, 3637–3646 RSC.
- Z. Wang, X. Wang, H. Wang, X. Chen, W. Dai and X. Fu, Appl. Catal., B, 2020, 277, 119169 CrossRef CAS.
- H. Shang, S. Huang, H. Li, M. Li, S. Zhao, J. Wang, Z. Ai and L. Zhang, Chem. Eng. J., 2020, 386, 124047 CrossRef CAS.
- J. He, J. Ye, K. Ge, J. Cao, C. Fu, Z. Li, Y. Zhang and Y. Yang, Catal. Sci. Technol., 2020, 10, 4809–4819 RSC.
- J. Xu, C. Liu, J. Niu and M. Chen, Sep. Purif. Technol., 2020, 230, 115861 CrossRef CAS.
- X. Song, W. Jiang, Z. Cai, X. Yue, X. Chen, W. Dai and X. Fu, Chem. Eng. J., 2022, 444, 136709 CrossRef CAS.
- Z. Wang, X. Ming, X. Wang, H. Wang, X. Chen, W. Dai, Y. Yan and X. Fu, Appl. Surf. Sci., 2022, 592, 153246 CrossRef CAS.
- K. Zhao, J. Qi, H. Yin, Z. Wang, S. Zhao, X. Ma, J. Wan, L. Chang, Y. Gao, R. Yu and Z. Tang, J. Mater. Chem. A, 2015, 3, 20465–20470 RSC.
- X. Tan, G. Qin, G. Cheng, X. Song, X. Chen, W. Dai and X. Fu, Catal. Sci. Technol., 2020, 10, 6923 RSC.
- K. Yang, Y. Li, K. Huang, X. Chen, X. Fu and W. Dai, Int. J. Hydrogen Energy, 2014, 39, 18312–18325 CrossRef CAS.
- Z. Wang, Y. Huang, M. Chen, X. Shi, Y. Zhang, J. Cao, W. Ho and S. C. Lee, ACS Appl. Mater. Interfaces, 2019, 11, 10651–10662 CrossRef CAS.
- M. Kantcheva, J. Catal., 2004, 223, 352–363 CrossRef CAS.
- W. C. Huo, X. A. Dong, J. Y. Li, M. Liu, X. Y. Liu, Y. X. Zhang and F. Dong, Chem. Eng. J., 2019, 361, 129–138 CrossRef CAS.
- R. V. Mikhaylov, A. A. Lisachenko, B. N. Shelimov, V. B. Kazansky, G. Martra and S. Coluccia, J. Phys. Chem. C, 2013, 117, 10345–10352 CrossRef CAS.
- W. Zhang, X. Shi, Z. Yan, Y. Shan, Y. Zhu, Y. Yu and H. He, ACS Catal., 2021, 11, 9825–9836 CrossRef CAS.
- C. Deng, J. Qian, C. Yu, Y. Yi, P. Zhang, W. Li, L. Dong, B. Li and M. Fan, RSC Adv., 2016, 6, 113630–113647 RSC.
|
| This journal is © The Royal Society of Chemistry 2023 |
Click here to see how this site uses Cookies. View our privacy policy here. 
 *ac and
Xianzhi
Fu
a
*ac and
Xianzhi
Fu
a