 Open Access Article
Creative Commons Attribution 3.0 Unported Licence
Iron molybdate catalysts synthesised via dicarboxylate decomposition for the partial oxidation of methanol to formaldehyde†
Geoffrey J. F.
Pudge
,
Graham J.
Hutchings
 ,
Simon A.
Kondrat‡
 ,
Kate
Morrison
,
Eleanor F.
Perkins
,
Alice V.
Rushby
and
Jonathan K.
Bartley
,
Kate
Morrison
,
Eleanor F.
Perkins
,
Alice V.
Rushby
and
Jonathan K.
Bartley
 *
*
Cardiff Catalysis Institute, School of Chemistry, Cardiff University, Main Building, Park Place, Cardiff CF10 3AT, UK. E-mail: BartleyJK@cardiff.ac.uk
First published on 8th June 2022
Abstract
A series of iron molybdate catalysts were synthesised via a sol gel route using either oxalic acid or malonic acid. Catalysts synthesised using malonic acid were found to give improved formaldehyde yields over those prepared using oxalic acid or a standard coprecipitation method. This was attributed to the iron and molybdenum malonate precursors forming discrete ions that when precipitated gave a homogeneous distribution of iron and molybdenum in the final catalyst. Metal oxalate precursors and materials synthesised using coprecipitation gave less homogeneous structures containing iron rich centres that led to combustion of methanol to carbon oxides.
Introduction
Formaldehyde is produced from methanol via two industrial processes; the dehydrogenation of methanol over a silver catalyst,1–5 or the selective oxidation of methanol over mixed metal oxide catalysts.6–9 The partial oxidation route is increasingly preferred as it uses a lower methanol feed (∼10%) and a lower temperature (300 °C) with a more robust catalyst, reducing the cost of formaldehyde production10 compared with the dehydrogenation route,10,11 which relies on high methanol feeds (90%) and high temperatures (600 °C).The industrial production of formaldehyde using mixed metal oxides is currently conducted using the Formox process, which uses an iron–vanadium, iron–vanadium–molybdenum or iron–molybdenum mixed oxide spinel catalyst. Iron molybdate was first reported as a catalyst for the oxidation of methanol to formaldehyde in 193112 and has been used as a commercial catalyst since the 1950s. Industrial catalysts comprise of the mixed metal oxide spinel phase, Fe2(MoO4)3 together with excess MoO3. The excess MoO3 is thought to have a dual role in the active catalyst; to improve selectivity by modifying the surface of the iron molybdate13–18 and to reduce deactivation due to loss of molybdenum leading to the formation of iron-rich phases,19–21 which lead to combustion products.6,22,23
Traditionally, iron molybdate catalysts have been synthesised by co-precipitating metal nitrate solutions using a base to yield precursors that are then calcined to form oxide catalysts with a low surface area (typically <10 m2 g−1).8,13,14 This preparation route is difficult to control leading to an inhomogeneous distribution of the metals and materials that contain mixtures of mixed oxide and single oxide phases. For iron molybdate materials this can lead to the formation of iron rich phases such as FeOx and FeMoO4, which reduce the selectivity of the catalysts.6,22,23
A number of different synthesis methods have been investigated to try and improve the homogeneity of the materials and increase the selectivity of the catalysts to formaldehyde. Mechanochemistry has been investigated as a synthesis methodology by Huang et al.24 and Dong et al.25 The mixtures of iron oxide and molybdenum oxide were ground at 600–700 °C, but the limitations of the solid-state reactions meant that the resultant materials were low surface area with molybdenum rich and iron rich phases present in the final catalysts. Hydrothermal synthesis from iron nitrate and ammonium heptamolybdate has been investigated, although these offer no improvement in homogeneity resulting in a mixture of phases similar to the coprecipitated materials.26,27 Alternative synthetic strategies have been used to obtain phase pure materials by designing nano-structured catalysts such as Fe2(MoO4)3 supported on MoO3 nanorods28 or MoOx/FeOx core shell structures,29,30 which showed high selectivity to formaldehyde, demonstrating the importance that the control of the catalyst phases has on the performance.
Sol–gel chemistry is a widely used technique for obtaining homogeneous mixed oxide materials by allowing the components to be atomically mixed in the precursor31 phase. The gel precursor contains a homogeneous distribution of ions at room temperature, although phase segregation can still occur during calcination at elevated temperatures.32 Traditional sol–gel methodologies utilise the hydrolysis and condensation of alkoxides, but the difference in hydrolysis rates of different metal alkoxides means the homogeneity is difficult to control for mixed oxides.
An alternative sol–gel strategy is to use small chelating molecules (traditionally citric acid) in aqueous solutions of metals to form the gels. This methodology gives more homogeneous solutions than traditional sol–gel chemistry and can be used for binary, ternary and quaternary metal oxides.32 Often a base is added as pH is a key factor in obtaining a homogeneous distribution of the different metals in the gel. Soares et al. investigated propanoic acid using this methodology to synthesise iron molybdate catalysts and found that the catalysts formed had a high surface area compared to coprecipitated materials. However, the formaldehyde selectivity was not maintained at high temperatures,8,33 which was thought to be due to loss of Mo during calcination, leading to Fe rich sites at the surface. Oudghiri-Hassani34 investigated dissolving iron and molybdenum nitrates in oxalic acid which acts as the chelating agent and solvent. The oxalate precursors were calcined to form the iron molybdate materials. Oudghiri-Hassani did not investigate the materials for methanol oxidation, but subsequently Yeo et al.35 found that they showed high selectivity to formaldehyde.
In this study we have extended our previous work to include malonic acid as a chelating agent/solvent to investigate the effect of the diacid chain length on the catalyst properties. Previous studies have suggested that the increased chain length allows the malonic acid to act as a bidentate ligand, leading to more isolated iron centres rather than the polymeric chains found with oxalic acid. This may improve the homogeneity of the materials, limiting the formation of iron rich species in the final catalyst, leading to improved performance for methanol oxidation to formaldehyde.
Experimental
Catalyst preparation
The preparation of the iron molybdate catalysts with Fe![[thin space (1/6-em)]](https://www.rsc.org/images/entities/char_2009.gif) :
:![[thin space (1/6-em)]](https://www.rsc.org/images/entities/char_2009.gif) Mo ratios of 1
Mo ratios of 1![[thin space (1/6-em)]](https://www.rsc.org/images/entities/char_2009.gif) :
:![[thin space (1/6-em)]](https://www.rsc.org/images/entities/char_2009.gif) 1.5, 1
1.5, 1![[thin space (1/6-em)]](https://www.rsc.org/images/entities/char_2009.gif) :
:![[thin space (1/6-em)]](https://www.rsc.org/images/entities/char_2009.gif) 2.2 and 1
2.2 and 1![[thin space (1/6-em)]](https://www.rsc.org/images/entities/char_2009.gif) :
:![[thin space (1/6-em)]](https://www.rsc.org/images/entities/char_2009.gif) 3.0 were carried out using a procedure described below with both oxalic acid and malonic acid.
3.0 were carried out using a procedure described below with both oxalic acid and malonic acid.
Iron nitrate, Fe(NO3)3·9H2O, ammonium molybdate, (NH4)6Mo7O24·4H2O, and the organic acid (molar ratios = 1/0.21/10, 1/0.31/10 and 1/0.42/10) were physically ground using a pestle and mortar for 10 min. The solid precursors were then heated on a hotplate at 160 °C (oxalic acid) or 130 °C (malonic acid) for 3 h. On cooling the resultant solids were calcined under flowing air (20 ml min−1) in a tubular furnace (500 °C, 2 h, 10 °C min−1) resulting in the final iron molybdate catalysts.
The oxalic acid derived materials were designated 1:1.5-O, 1:2.2-O and 1:3.0-O depending on the Fe![[thin space (1/6-em)]](https://www.rsc.org/images/entities/char_2009.gif) :
:![[thin space (1/6-em)]](https://www.rsc.org/images/entities/char_2009.gif) Mo atomic ratio, with the malonic acid materials designated 1:1.5-M, 1:2.2-M and 1:3.0-M.
Mo atomic ratio, with the malonic acid materials designated 1:1.5-M, 1:2.2-M and 1:3.0-M.
A catalyst was also prepared using a conventional co-precipitation method. A solution of ammonium heptamolybdate tetrahydrate, (NH4)6Mo7O24·4H2O, (9.71 g in 150 ml distilled water) was acidified to pH 2 using conc. HNO3 (70%). A solution of iron nitrate nonahydrate, Fe(NO3)3·9H2O (10.1 g in 150 ml distilled water) was added dropwise with vigorous stirring. The suspension was aged at 80 °C for 3 h, and the solution was cooled to room temperature and the precipitate was recovered by filtration, dried at 120 °C for 16 h and calcined in flowing air at (500 °C, 2 h, 10 °C min−1, 20 ml min−1) resulting in the final iron molybdate catalyst with a Fe![[thin space (1/6-em)]](https://www.rsc.org/images/entities/char_2009.gif) :
:![[thin space (1/6-em)]](https://www.rsc.org/images/entities/char_2009.gif) Mo atomic ratio of 1
Mo atomic ratio of 1![[thin space (1/6-em)]](https://www.rsc.org/images/entities/char_2009.gif) :
:![[thin space (1/6-em)]](https://www.rsc.org/images/entities/char_2009.gif) 2.2. This material was designated 1:2.2-C.
2.2. This material was designated 1:2.2-C.
Catalyst characterization
XRD measurements were obtained using a Panalytical X'pert Pro diffractometer using Cu Kα X-ray source operating with an accelerator voltage 40 kV and 40 mA current. X-ray patterns were recorded in the range 10–80° 2θ. The patterns produced were compared to reference patterns supplied by the International Centre for Diffraction Data (ICDD).Raman spectra were obtained using a Renishaw Ramascope, using an Ar+ laser of wavelength 514 nm as the light source. An Olympus BH2-UMA fitted with a 20× Leica optical zoom lens was used to focus the laser light. Samples were placed onto aluminium backing plates which are mounted onto an automated stage to allow for mapping operations. A series of spectra were obtained from a large area of the sample to confirm how homogeneous the samples were.
Elemental composition and oxidation state analysis of the calcined and uncalcined iron molybdate samples surfaces were conducted using a Thermo Scientific Kα X-ray photoelectron spectrometer (XPS), with monochromatic Al radiation operating at 72 W power with a spot size of 400 μm. Dual low energy electron and Ar+ neutralisation was used and all results calibrated against C(1s) results where applicable. The data was analysed using CasaXPS software using Scofield sensitivity factors corrected with an energy dependence of 0.6, after application of a Shirley background.
BET surface areas were determined by N2 absorption at −196 °C using a Quantachrome Quadrasorb-evo instrument. The samples (0.5–3.0 g) were prepared for analysis by removing physisorbed water at 120 °C for 2 h under a vacuum. Both the reference and sample were cooled to −196 °C and tested to attain an equilibrium measurement. Analysis was conducted at 5 different pressures along the isotherm before results were converted into surface area measurements (m2 g−1).
TGA experiments were undertaken using a Perking Elmer TGA 4000 equipped with an autosampler. 10–20 mg of sample were loaded into pre-weighed calcination boats and were heated 30–800 °C at a rate of 5 °C min−1. Both flowing air and nitrogen atmospheres were used where applicable using a flow rate of 30 ml min−1.
Catalyst testing
The catalytic performance of the iron molybdate catalysts was evaluated for the partial oxidation of methanol to formaldehyde in a laboratory plug flow microreactor. The catalyst was pressed and sieved between 400 and 600 μm. Typically, 0.3 g of the catalyst was placed in a quartz reactor tube (8 mm internal diameter) held between plugs of quartz wool. The reactor was placed in a tubular furnace (Carbolite) and temperature was monitored using a k-type thermocouple at the centre of the catalyst bed. Helium was delivered to a saturator containing methanol (99.5% Sigma-Aldrich) which was maintained at 5.2 °C in a thermostatically controlled water bath. The methanol/helium and oxygen were introduced using mass flow controllers (Bronkhorst) to give a total flow rate of 60 ml min−1 (MeOH![[thin space (1/6-em)]](https://www.rsc.org/images/entities/char_2009.gif) :
:![[thin space (1/6-em)]](https://www.rsc.org/images/entities/char_2009.gif) O2
O2![[thin space (1/6-em)]](https://www.rsc.org/images/entities/char_2009.gif) :
:![[thin space (1/6-em)]](https://www.rsc.org/images/entities/char_2009.gif) He = 5
He = 5![[thin space (1/6-em)]](https://www.rsc.org/images/entities/char_2009.gif) :
:![[thin space (1/6-em)]](https://www.rsc.org/images/entities/char_2009.gif) 10
10![[thin space (1/6-em)]](https://www.rsc.org/images/entities/char_2009.gif) :
:![[thin space (1/6-em)]](https://www.rsc.org/images/entities/char_2009.gif) 85). Both inlet and outlet lines were heated to 130 °C to prevent condensation. The data was collected and analyzed using an on-line gas chromatograph (Agilent 7820A) equipped with a Porapak Q (1 m) column and a Molsieve 13 Å (80–100 mesh) column for separation of the products. The products passed through a methaniser to convert them to methane, in order to overcome detection limitations, before analysis with an FID.
85). Both inlet and outlet lines were heated to 130 °C to prevent condensation. The data was collected and analyzed using an on-line gas chromatograph (Agilent 7820A) equipped with a Porapak Q (1 m) column and a Molsieve 13 Å (80–100 mesh) column for separation of the products. The products passed through a methaniser to convert them to methane, in order to overcome detection limitations, before analysis with an FID.
Results and discussion
The XRD patterns of the materials synthesised using malonic acid and oxalic acid are shown in Fig. 1, together with the standard coprecipitated material (1:2.2-C).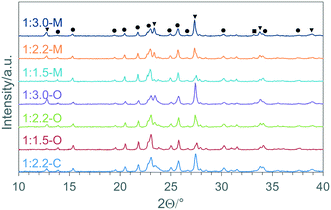 | ||
| Fig. 1 X-ray diffraction patterns of iron molybdate materials synthesised using malonic acid, oxalic acid and coprecipitation (key: ▼ MoO3; ● Fe2(MoO4)3; ■ Fe2O3). | ||
For all the materials, the mixed oxide phase, Fe2(MoO4)3, MoO3 and small amounts of Fe2O3 were identified using powder diffraction patterns published by the International Centre for Diffraction Data (α-Fe2(MoO4)3 – ICDD: 01-083-1701, α-MoO3 – ICDD: 00-005-0508, α-Fe2O3 ICDD: 01-071-5088). Using the reference intensity ratios (RIR) from these reference patterns, based on the intensity of the reflections in the powder pattern compared to corundum (I/Ic), the relative amounts of each phase could be estimated, and these are shown in Table 1.
| Sample | Composition from powder XRD patterns (%) | Theoretical composition (%) | |||
|---|---|---|---|---|---|
| Fe2(MoO4)3 | MoO3 | Fe2O3 | Fe2(MoO4)3 | MoO3 | |
| 1:2.2-C | 65.3 | 33.2 | 1.5 | 68.2 | 31.8 |
| 1:1.5-O | 85.7 | 13.5 | 0.8 | 100.0 | 0.0 |
| 1:2.2-O | 71.0 | 27.9 | 1.1 | 68.2 | 31.8 |
| 1:3.0-O | 48.4 | 49.5 | 2.1 | 50.0 | 50.0 |
| 1:1.5-M | 88.8 | 10.4 | 0.8 | 100.0 | 0.0 |
| 1:2.2-M | 68.8 | 28.7 | 2.5 | 68.2 | 31.8 |
| 1:3.0-M | 49.0 | 47.1 | 3.9 | 50.0 | 50.0 |
Although the use of RIR can only be considered semi-quantitative, there are some general observations that can be made from the analysis. The first thing to note is that all samples contain iron oxide. This is perhaps not surprising for the materials that contain a stoichiometric amount molybdenum (Fe![[thin space (1/6-em)]](https://www.rsc.org/images/entities/char_2009.gif) :
:![[thin space (1/6-em)]](https://www.rsc.org/images/entities/char_2009.gif) Mo = 1
Mo = 1![[thin space (1/6-em)]](https://www.rsc.org/images/entities/char_2009.gif) :
:![[thin space (1/6-em)]](https://www.rsc.org/images/entities/char_2009.gif) 1.5), but is unexpected in the materials containing excess molybdenum as this is thought to limit the formation of iron rich phases. The relative amount of iron rich phases is seen to increase with increasing molybdenum content which is counter intuitive and suggests that X-ray amorphous MoO3 is formed as the molybdenum content increases.
1.5), but is unexpected in the materials containing excess molybdenum as this is thought to limit the formation of iron rich phases. The relative amount of iron rich phases is seen to increase with increasing molybdenum content which is counter intuitive and suggests that X-ray amorphous MoO3 is formed as the molybdenum content increases.
A further observation to note from the XRD patterns is that the different synthetic methods do not lead to a large difference in composition, with the relative amounts of each phase consistent for the coprecipitated material and sol–gel samples made using oxalic and malonic acid (Table 1). This is surprising, as one of the considerations for using sol–gel chemistry is to improve the homogeneity of the final material, minimizing the amount of iron rich phases present in the final catalysts.
Katelnikovas et al. have evaluated different chelating agents using the expression:36
k = n + log![[thin space (1/6-em)]](https://www.rsc.org/images/entities/char_2009.gif) M M |
The composition of the materials was further studied using Raman spectroscopy and X-ray photoelectron spectroscopy (XPS). Representative Raman spectra taken from different areas of the materials (Fig. 2 and S1†) show that the materials display some compositional inhomogeneity with the MoO3![[thin space (1/6-em)]](https://www.rsc.org/images/entities/char_2009.gif) :
:![[thin space (1/6-em)]](https://www.rsc.org/images/entities/char_2009.gif) Fe2(MoO4)3 ratio varying across the samples, although this is less pronounced as the molybdenum content increases. However, it is clear that when a large number of spectra are compared from different areas of the materials there is the expected trend, with MoO3 peaks become more intense with increasing Mo
Fe2(MoO4)3 ratio varying across the samples, although this is less pronounced as the molybdenum content increases. However, it is clear that when a large number of spectra are compared from different areas of the materials there is the expected trend, with MoO3 peaks become more intense with increasing Mo![[thin space (1/6-em)]](https://www.rsc.org/images/entities/char_2009.gif) :
:![[thin space (1/6-em)]](https://www.rsc.org/images/entities/char_2009.gif) Fe ratio in the samples (Fig. S1†). One thing to note is that Fe2O3 was not observed by Raman spectroscopy, although this is unsurprising due to hematite being a good absorber of the incident radiation, leading to low scattering intensities compared to the molybdenum containing phases.
Fe ratio in the samples (Fig. S1†). One thing to note is that Fe2O3 was not observed by Raman spectroscopy, although this is unsurprising due to hematite being a good absorber of the incident radiation, leading to low scattering intensities compared to the molybdenum containing phases.
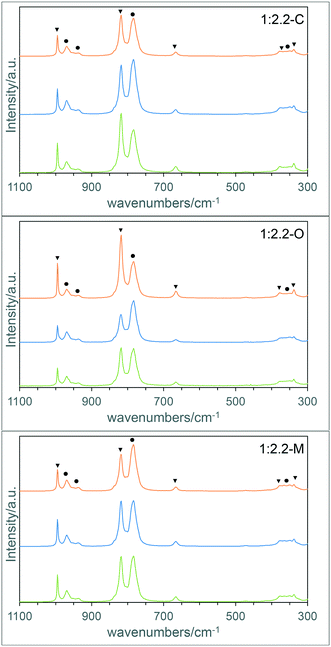 | ||
| Fig. 2 Representative Raman spectra from the 1:2.2-C, 1:2.2-O and 1:2.2-M materials (key: ▼ MoO3; ● Fe2(MoO4)3). | ||
XPS spectroscopy showed that all samples had a molybdenum rich surface compared to the bulk, and that this was higher for the oxalic acid and malonic acid derived materials than the coprecipitated sample (Table 2). This might be expected as an MoO3 monolayer on the surface of Fe2(MoO4)3 has been postulated to be the active site for methanol oxidation14 and surface enrichment of Mo has been observed previously by electron microscopy,37 XPS38 and low energy ion scattering on the outermost surface layer.16 In this study, the use of the dicarboxylate chelating agents seems to promote the formation of a Mo rich surface layer compared to the standard coprecipitated material (1:2.2-C).
| Sample | Surface area/m2 g−1 | Fe![[thin space (1/6-em)]](https://www.rsc.org/images/entities/char_2009.gif) : :![[thin space (1/6-em)]](https://www.rsc.org/images/entities/char_2009.gif) Mo surface ratio Mo surface ratio |
|---|---|---|
| 1:2.2-C | 3.9 | 1![[thin space (1/6-em)]](https://www.rsc.org/images/entities/char_2009.gif) : :![[thin space (1/6-em)]](https://www.rsc.org/images/entities/char_2009.gif) 3.0 3.0 |
| 1:1.5-O | 4.4 | 1![[thin space (1/6-em)]](https://www.rsc.org/images/entities/char_2009.gif) : :![[thin space (1/6-em)]](https://www.rsc.org/images/entities/char_2009.gif) 2.2 2.2 |
| 1:2.2-O | 4.6 | 1![[thin space (1/6-em)]](https://www.rsc.org/images/entities/char_2009.gif) : :![[thin space (1/6-em)]](https://www.rsc.org/images/entities/char_2009.gif) 3.6 3.6 |
| 1:3.0-O | 7.0 | 1![[thin space (1/6-em)]](https://www.rsc.org/images/entities/char_2009.gif) : :![[thin space (1/6-em)]](https://www.rsc.org/images/entities/char_2009.gif) 3.6 3.6 |
| 1:1.5-M | 2.2 | 1![[thin space (1/6-em)]](https://www.rsc.org/images/entities/char_2009.gif) : :![[thin space (1/6-em)]](https://www.rsc.org/images/entities/char_2009.gif) 2.0 2.0 |
| 1:2.2-M | 3.1 | 1![[thin space (1/6-em)]](https://www.rsc.org/images/entities/char_2009.gif) : :![[thin space (1/6-em)]](https://www.rsc.org/images/entities/char_2009.gif) 3.3 3.3 |
| 1:3.0-M | 3.4 | 1![[thin space (1/6-em)]](https://www.rsc.org/images/entities/char_2009.gif) : :![[thin space (1/6-em)]](https://www.rsc.org/images/entities/char_2009.gif) 3.3 3.3 |
BET surface areas were also obtained for the samples (Table 2). The oxalate route gave the highest surface areas which were found to increase with Mo content for both the sol–gel preparation methods. Previous studies using standard coprecipitation found that the surface area decreases with molybdenum content due to the increase in low surface area MoO3 formed.13,16,39 However, this rise in surface area with increased molybdenum, content was also observed by Soares et al. using a sol–gel method and similar Fe![[thin space (1/6-em)]](https://www.rsc.org/images/entities/char_2009.gif) :
:![[thin space (1/6-em)]](https://www.rsc.org/images/entities/char_2009.gif) Mo ratios,8 which was attributed to the sponge-like MoO3 morphologies observed.
Mo ratios,8 which was attributed to the sponge-like MoO3 morphologies observed.
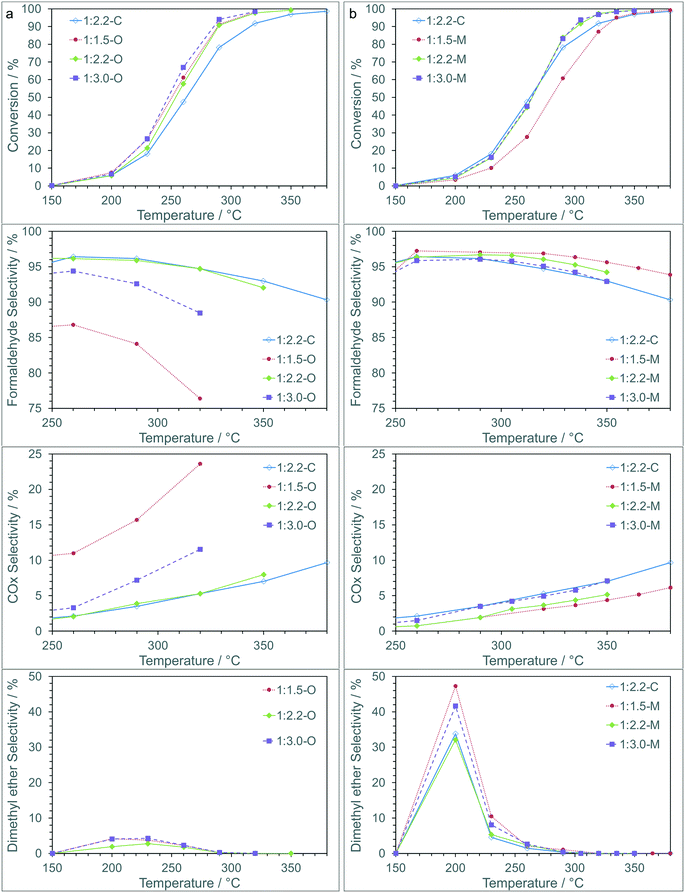
The iron molybdate materials were then tested as catalysts for the partial oxidation of methanol to formaldehyde (Fig. 3). The conversion of methanol over the catalysts can be linked to the method of preparation, with catalysts prepared using the sol–gel chemistry outperforming the coprecipitated catalysts, and the oxalate route showing better performance than those prepared using the malonate route. The activity is similar for all the sol–gel synthesised materials apart from the 1:1.5-M, which shows comparable activity to the coprecipitated catalyst (1:2.2-C) and does not reach full conversion until ∼380 °C. This is perhaps not surprising as the 1:1.5-M material has the lowest surface area and the lowest Fe![[thin space (1/6-em)]](https://www.rsc.org/images/entities/char_2009.gif) :
:![[thin space (1/6-em)]](https://www.rsc.org/images/entities/char_2009.gif) Mo surface ratio (Table 2), both of which are key indicators of performance.
Mo surface ratio (Table 2), both of which are key indicators of performance.
For the catalysts synthesised using malonic acid the selectivity to formaldehyde was high, with >95% observed across a broad temperature and conversion range. As the temperature was increased the selectivity to formaldehyde decreased as a greater amount of COX was produced. The catalysts prepared with oxalic acid showed a lower selectivity to formaldehyde, with the 1:1.5-O and 1:3.0-O in particular showing lower selectivity at fairly modest temperatures due to increased COX formation. The 1:2.2-O material showed very similar behavior to the coprecipitated iron molybdate (1:2.2-C). At low conversion dimethyl ether (DME) was observed for all catalysts (Table S1†), with higher selectivity observed over 1:2.2-C and the materials synthesized using malonic acid. As conversion increased, DME selectivity reduced to >1% above 300 °C.
Based on these results the malonate route shows clear advantages over the oxalate and coprecipitation routes with higher yields of formaldehyde over an extended temperature range and reaction rates (Fig. S2†) suggesting an increase in stability of these materials.
The precursors synthesised using the sol–gel routes were further characterised using XPS and thermogravimetric analysis (TGA) to understand the relationship between the catalyst performance and the species present in the precursors. The oxalate and malonate precursors can exist in different forms, depending on the chelating agent and the oxidation state of the iron and molybdenum.
The conjugate bases of both oxalic and malonic acid are well-established chelating ligands for metal cations that have been applied for the dissolution of metals in applications such as removing unwanted metal contaminants40,41 and selectively leaching of metals from raw materials.42 Both the organic acids chelate to molybdenum in a similar way, forming polymeric structures depending on the Mo oxidation state.43,44 Mo(V) dimers form which complex to give [Mo2O4(C2O4)3]3− or [Mo2O4(CH2C2O4)3]3− which are linked together by bridging oxalate or malonate ions (Fig. 4),44 whereas, Mo(VI) forms [MoO3(C2O4)2]2− or [MoO3(CH2C2O4)2]2− anions, which are bound together in polymeric species via Mo–O–Mo linear chains43 (Fig. 4b).
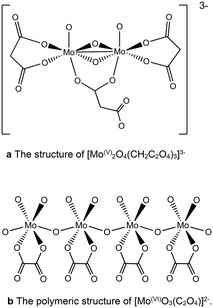 | ||
| Fig. 4 (a) The structure of [Mo(V)2O4(CH2C2O4)3]3−. (b) The polymeric structure of [Mo(VI)O3(C2O4)]2−. | ||
However, the acids show different behaviour in the presence of iron. It has been proposed that the longer chain length allows the malonic acid to act as a bidentate ligand,45–47 leading to isolated iron centres rather than the polymeric chains found with oxalic acid. This suggests that the different chain length of the diacid chelating agent could play a role in determining the homogeneity of the precursors, limiting the formation of iron rich regions within the catalysts. For both acids the iron complexes polymerise to form infinite chain structures as shown in Fig. 5a. For the Fe(III) chains the additional ligand can lead to crosslinking of these chains (Fig. 5b).
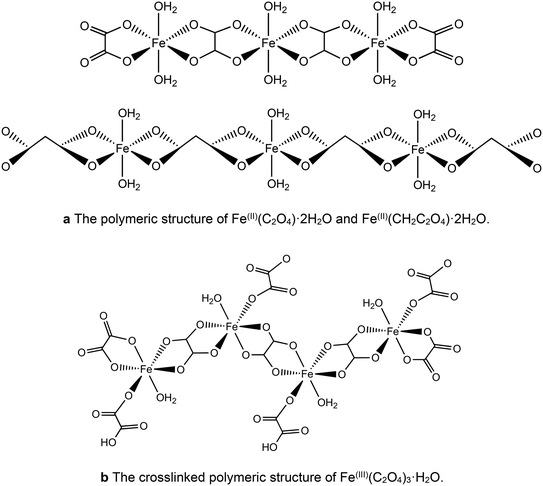 | ||
| Fig. 5 (a) The polymeric structure of Fe(II)(C2O4)·2H2O and Fe(II)(CH2C2O4)·2H2O. (b) The crosslinked polymeric structure of Fe(III)(C2O4)3·H2O. | ||
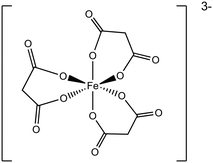
However, for malonic acid the longer carbon chain allows the formation of [Fe(III)(CH2C2O4)3]3− with the three bidentate ligands chelating to one Fe(III) centre to form discreet anions that do not polymerise (Fig. 6).
Therefore, the oxidation state of the cations can have a big influence on the composition and structure of the precursors and the homogeneity of the final oxide materials, depending on whether polymeric chains or discreet anions are present in the samples. XPS analysis of molybdenum could therefore give important information as to the species formed during the melting that occurs during the initial heat treatment step as Mo(IV), Mo(V) and Mo(VI) have clearly defined binding energies for Mo 3d5/2–Mo 3d3/2 doublets of 229.9–233.0, 231.2–234.3 and 232.5–235.6 respectively.48
From the XPS analysis (Table 3, Fig. S3†) it is clear that the oxalate and malonate samples had a large amount of Mo(V) present in the precursor, which is likely to lead to a higher proportion of isolated Mo ions rather than polymeric chains. This in turn could lead to a higher degree of mixing between iron and molybdenum in the precursors, limiting the formation of iron oxides which were found to be higher from the XRD analysis (Table 1). Conversely, standard coprecipitation methods (1:2.2-C) resulted in exclusively Mo(VI) species due to the formation of Fe2(MoO4)3 and MoO3 prior to calcination.
| Sample | MoV![[thin space (1/6-em)]](https://www.rsc.org/images/entities/char_2009.gif) : :![[thin space (1/6-em)]](https://www.rsc.org/images/entities/char_2009.gif) MoVI surface ratio MoVI surface ratio |
|---|---|
| 1:2.2-C | 0![[thin space (1/6-em)]](https://www.rsc.org/images/entities/char_2009.gif) : :![[thin space (1/6-em)]](https://www.rsc.org/images/entities/char_2009.gif) 1 1 |
| 1:1.5-O | 1![[thin space (1/6-em)]](https://www.rsc.org/images/entities/char_2009.gif) : :![[thin space (1/6-em)]](https://www.rsc.org/images/entities/char_2009.gif) 1.2 1.2 |
| 1:2.2-O | 1![[thin space (1/6-em)]](https://www.rsc.org/images/entities/char_2009.gif) : :![[thin space (1/6-em)]](https://www.rsc.org/images/entities/char_2009.gif) 1.1 1.1 |
| 1:3.0-O | 1![[thin space (1/6-em)]](https://www.rsc.org/images/entities/char_2009.gif) : :![[thin space (1/6-em)]](https://www.rsc.org/images/entities/char_2009.gif) 2.1 2.1 |
| 1:1.5-M | 1![[thin space (1/6-em)]](https://www.rsc.org/images/entities/char_2009.gif) : :![[thin space (1/6-em)]](https://www.rsc.org/images/entities/char_2009.gif) 2.7 2.7 |
| 1:2.2-M | 1![[thin space (1/6-em)]](https://www.rsc.org/images/entities/char_2009.gif) : :![[thin space (1/6-em)]](https://www.rsc.org/images/entities/char_2009.gif) 1.5 1.5 |
| 1:3.0-M | 1![[thin space (1/6-em)]](https://www.rsc.org/images/entities/char_2009.gif) : :![[thin space (1/6-em)]](https://www.rsc.org/images/entities/char_2009.gif) 2.4 2.4 |
TGA of the materials adds further evidence for the homogeneous mixing of the iron and molybdenum shown in the XPS results (Fig. 7).
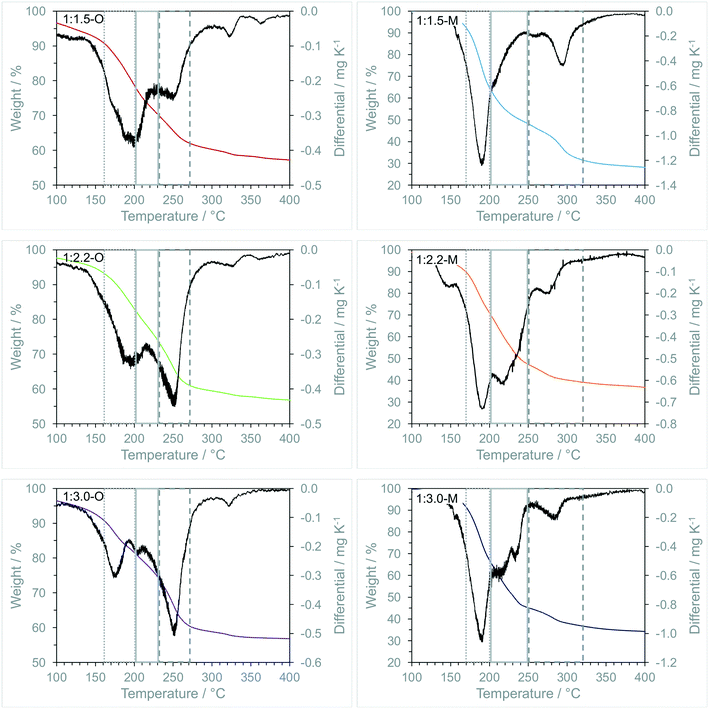 | ||
| Fig. 7 Thermogravimetric analysis of iron molybdate precursors synthesised using oxalic acid and malonic acid. | ||
For the oxalate samples, two large regions of mass loss were observed. The initial loss at 160–200 °C corresponded to iron oxalate decomposition in air as observed previously.49,50 The second major feature was between 230–270 °C which has been assigned to the decomposition of oxomolybdate oxalate which is again supported by literature examples.51–53 In addition to the major features, mass loss between 325–350 °C was assigned to the decomposition of ammonium molybdate species to form crystalline MoO3,54 with the minor change observed at 350–400 °C was attributed to the formation of Fe2(MoO4)3 during a solid phase reaction between Fe2O3 and MoO3 species.55
In all materials there was an overlap between the iron and molybdenum oxalate decompositions between 200–230 °C, which could be due to be secondary catalytic decarboxylation of oxomolybdate oxalate.56 Majumdar et al. studied the thermal decomposition of FeC2O4·2H2O and ZnC2O4·2H2O mixtures and observed a significant decrease in zinc oxalate decomposition temperatures. This was ascribed to the exothermic catalytic oxidation of CO to CO2 over Fe3O4 and the oxidation of Fe3O4 to Fe2O3.49 This caused localised high temperatures around these iron centres causing the activation of neighbouring carboxylate species. Increases in this overlapping region can be an indication of mixing of the oxalates and possibly the overall homogeneity of the material produced post calcination.
For the malonate samples, TGA shows similar behaviour to the oxalate samples, with decompositions assigned to molybdenum malonate at 176–214 °C (ref. 57) and iron malonate at 220–358 °C (ref. 46) respectively. As for the oxalate samples, there is an overlapping region in between these features, which becomes more prevalent with increasing molybdenum content and can be seen as a defined peak in the 1:2.2-M and 1:3.0-M precursors. If this is attributed to the exothermic decomposition of the molybdenum malonate caused the activation of neighbouring malonates, the increase in the mass loss in this region is a clear indicator of an increase in the intimate mixing between the two phases. This correlates with the XPS analysis showing a higher amount of Mo(V) present in the sample, which is less likely to form long polymeric chains and can lead to a better dispersion of Fe and Mo in the precursors.
Unlike isolated iron oxalate, which was linked to Fe2O3 production, decomposition of iron malonate has been shown to produce γ-Fe2O3 nanoparticles by Stefanescu and Stefanescu.45 This might have aided the formation of more homogeneous distribution by preventing the formation of large isolated areas of iron enrichment observed on the surface, although larger volumes of isolated iron malonate could be detrimental if not dispersed leading to localised high iron concentrations.
Conclusions
The synthesis of mixed metal oxide catalysts has been widely studied with a key focus on improving the homogeneity of the materials. In this study we have investigated the use of malonic and oxalic acids as chelating agents in the sol gel synthesis of iron molybdate. The metal malonate and oxalate precursors were decomposed and the resultant oxide catalysts were found to give improved activity over coprecipitated catalysts for the selective oxidation of methanol to formaldehyde. The highest yields of formaldehyde were observed for the catalysts synthesised using malonic acid with higher than stoichiometric molybdenum content (1:2.2-M and 1:3.0-M). This is proposed to be due to the longer chain length of malonic acid allowing it to act as a bidentate ligand, resulting in more isolated iron and molybdenum centres than in the polymeric chains formed with oxalic acid. These isolated metal centres can form a more homogenous material, reducing the amount of iron rich centres that have been attributed to reduced selectivity for iron molybdate catalysts.Conflicts of interest
There are no conflicts to declare.Acknowledgements
G. J. F. P. gratefully acknowledges financial support from a Sir Charles Wright Endowment Studentship, Cardiff University.References
- E. Cao and A. Gavriilidis, Catal. Today, 2005, 100, 154–163 CrossRef.
- W.-L. Dai, Q. Liu, Y. Cao and J.-F. Deng, Appl. Catal., A, 1998, 175, 83–88 CrossRef CAS.
- L. Lefferts, J. G. Van Ommen and J. R. H. Ross, Appl. Catal., 1986, 23, 385–402 CrossRef CAS.
- M. Qian, M. A. Liauw and G. Emig, Appl. Catal., A, 2003, 238, 211–222 CrossRef CAS.
- A. N. Pestryakov, N. E. Bogdanchikova and A. K. Gericke, Catal. Today, 2004, 91, 49–52 CrossRef.
- A. Andersson, M. Hernelind and O. Augustsson, Catal. Today, 2006, 112, 40–44 CrossRef CAS.
- K. I. Ivanov and D. Y. Dimirtov, Catal. Today, 2010, 154, 250–255 CrossRef CAS.
- A. P. V. Soares, M. F. Portela, A. Kiennemann and L. Hilaire, Chem. Eng. Sci., 2003, 58, 1315–1322 CrossRef.
- V. Diakov, B. Blackwell and A. Varma, Chem. Eng. Sci., 2002, 57, 1563–1569 CrossRef CAS.
- G. Reuss, W. Disteldorf, O. Grundler and A. Hilt, Ullmann's Encyclopedia of Industry Chemistry, VCH, Weinheim, Germany, 5th edn, 1992, vol. A11 Search PubMed.
- A. B. Stiles and T. A. Koch, Catalysis Manufacture, Marcel Dekker, New York, 2nd edn, 1995 Search PubMed.
- H. Adkins and W. R. J. Peterson, J. Am. Chem. Soc., 1931, 53, 1512–1520 CrossRef CAS.
- A. P. V. Soares, M. F. Portela, A. Kiennemann, L. Hilaire and J. M. M. Millet, Appl. Catal., A, 2001, 206, 221–229 CrossRef CAS.
- E. Söderhjelm, M. P. House, N. Cruise, J. Holmberg, M. Bowker, J.-O. Bovin and A. Andersson, Top. Catal., 2008, 50, 145–155 CrossRef.
- M. Badlani and I. E. Wachs, Catal. Lett., 2001, 75, 137–149 CrossRef CAS.
- K. Routray, W. Zhou, C. J. Kiely, W. Grünert and I. E. Wachs, J. Catal., 2010, 275, 84–98 CrossRef CAS.
- B. Delmon and G. F. Froment, Catal. Rev.: Sci. Eng., 1996, 38, 69–100 CrossRef CAS.
- I. E. Wachs and K. Routray, ACS Catal., 2012, 2, 1235–1246 CrossRef CAS.
- V. Diakov, D. Lafarga and A. Varma, Catal. Today, 2001, 67, 159–167 CrossRef CAS.
- A. P. V. Soares, M. F. Portela, A. Kiennemann and J. M. M. Millet, React. Kinet. Catal. Lett., 2002, 75, 13–20 CrossRef CAS.
- K. V. Raun, J. Johannessen, K. McCormack, C. C. Appel, S. Baier, M. Thorhauge, M. Høj and A. D. Jenson, Chem. Eng. J., 2019, 361, 1285–1295 CrossRef CAS.
- M. Carbucicchio and F. Trifirò, J. Catal., 1976, 45, 77–85 CrossRef CAS.
- T. H. Kim, B. Ramachandra, J. S. Choi, M. B. Saidutta, K. Y. Choo, S. D. Song and Y. W. Rhee, Catal. Lett., 2004, 98, 161–165 CrossRef CAS.
- Y. Huang, L. Cong, J. Yu, P. Eloy and P. Ruiz, J. Mol. Catal. A: Chem., 2009, 302, 48–53 CrossRef CAS.
- L. Dong, K. Chen and Y. Chen, J. Solid State Chem., 1997, 129, 30–36 CrossRef CAS.
- A. M. Beale, S. D. M. Jacques, E. Sacaliuc-Parvalescu, M. G. O'Brien, P. Barnes and B. M. Weckhuysen, Appl. Catal., A, 2009, 363, 143–152 CrossRef CAS.
- Y. Ding, S.-H. Yu, C. Liu and Z.-A. Zang, Chem. – Eur. J., 2007, 13, 746–753 CrossRef CAS PubMed.
- G. Jin, W. Weng, Z. Lin, N. F. Dummer, S. H. Taylor, C. J. Kiely, J. K. Bartley and G. J. Hutchings, J. Catal., 2012, 296, 55–64 CrossRef CAS.
- M. Bowker, M. House, A. Alshehri, C. Brookes, E. K. Gibson and P. P. Wells, Catal., Struct. React., 2015, 1, 95–100 Search PubMed.
- C. Brookes, P. P. Wells, G. Cibin, N. Dimitratos, W. Jones and M. Bowker, ACS Catal., 2014, 4, 243–250 CrossRef CAS.
- B. L. Cushing, V. L. Kolesnichenko and C. J. O'Connor, Chem. Rev., 2004, 104, 3893–3946 CrossRef CAS PubMed.
- A. E. Danks, S. R. Hall and Z. Schnepp, Mater. Horiz., 2016, 3, 91–112 RSC.
- A. P. V. Soares, M. F. Portela and A. Kiennemann, Stud. Surf. Sci. Catal., 1997, 110, 807–816 CrossRef CAS.
- H. Oudghiri-Hassani, Catal. Commun., 2015, 60, 19–22 CrossRef CAS.
- B. R. Yeo, G. J. F. Pudge, K. G. Bugler, A. V. Rushby, S. Kondrat, J. K. Bartley, S. Golunski, S. H. Taylor, E. Gibson, P. P. Wells, C. Brookes, M. Bowker and G. J. Hutchings, Surf. Sci., 2016, 648, 163–169 CrossRef CAS.
- A. Katelnikovas, J. Barkauskas, F. Ivanauskas, A. Beganskiene and A. Kareiva, J. Sol-Gel Sci. Technol., 2007, 41, 193–201 CrossRef CAS.
- M. Bowker, R. Holroyd, M. House, R. Bracey, C. Bamroongwongdee, M. Shannon and A. Carley, Top. Catal., 2008, 48, 158–165 CrossRef CAS.
- B. I. Popov, A. V. Pashis and L. N. Shkuratova, React. Kinet. Catal. Lett., 1986, 30, 129–135 CrossRef CAS.
- M. P. House, A. F. Carley, R. Echeverria-Valda and M. Bowker, J. Phys. Chem. C, 2008, 112, 4333–4341 CrossRef CAS.
- F. Vegliò, B. Passariello and C. Abbruzzese, Ind. Eng. Chem. Res., 1999, 38, 4443–4448 CrossRef.
- C. Ash, V. Tejnecký, L. Borůvka and O. Drábek, J. Contam. Hydrol., 2016, 187, 18–30 CrossRef CAS PubMed.
- P. Hu, Y. Zhang, T. Liu, J. Huang, Y. Yuan and Q. Zheng, J. Ind. Eng. Chem., 2017, 45, 241–247 CrossRef CAS.
- M. Cindrić, N. Strukan, V. Vrdoljak, M. Devčić, Z. Veksli and B. Kamenar, Inorg. Chim. Acta, 2000, 304, 260–267 CrossRef.
- B. Modec, J. V. Brenčič and J. Koller, Eur. J. Inorg. Chem., 2004, 2004, 1611–1620 CrossRef.
- O. Stefanescu and M. Stefanescu, J. Organomet. Chem., 2013, 740, 50–55 CrossRef CAS.
- M. M. Rahman, V. A. Mukhedkar, A. Venkataraman, A. K. Nikumbh, S. B. Kulkarni and A. J. Mukhedkar, Thermochim. Acta, 1988, 125, 173–190 CrossRef CAS.
- D. Xiao, Y. Guo, X. Lou, C. Fang, Z. Wang and J. Liu, Chemosphere, 2014, 103, 354–358 CrossRef CAS PubMed.
- J.-G. Choi and L. T. Thompson, Appl. Surf. Sci., 1996, 93, 143–149 CrossRef CAS.
- B. Boyanov, D. Khadzhiev and V. Vasilev, Thermochim. Acta, 1985, 93, 89–92 CrossRef CAS.
- E.-H. M. Diefallah, M. A. Mousa, A. A. El-Bellihi, E.-H. El-Mossalamy, G. A. El-Sayed and M. A. Gabal, J. Anal. Appl. Pyrolysis, 2002, 62, 205–214 CrossRef CAS.
- M. I. Diaz-Guemes, A. S. Bhatti and D. Dollimore, Thermochim. Acta, 1986, 106, 125–132 CrossRef CAS.
- J. Gopalakrishnan, B. Viswanathan and V. Srinivasan, J. Inorg. Nucl. Chem., 1970, 32, 2565–2568 CrossRef CAS.
- S. P. Goel and P. N. Mehrotra, Thermochim. Acta, 1983, 70, 201–209 CrossRef CAS.
- A. O. Kostynyuk, F. Gutenuar, A. N. Kalashnikova, Y. V. Kalashnikov and N. V. Nikolenko, Kinet. Catal., 2014, 55, 649–655 CrossRef CAS.
- M. Bowker, R. Holroyd, A. Elliott, P. Morrall, A. Alouche, C. Entwistle and A. Toerncrona, Catal. Lett., 2002, 83, 165–176 CrossRef CAS.
- R. Majumdar, P. Sarkar, U. Ray and M. R. Mukhopadhyay, Thermochim. Acta, 1999, 335, 43–53 CrossRef CAS.
- M. E. Brown, T. T. Bhengu and D. K. Sanyal, Thermochim. Acta, 1994, 242, 141–152 CrossRef CAS.
Footnotes |
| † Electronic supplementary information (ESI) available. See DOI: https://doi.org/10.1039/d2cy00699e |
| ‡ Current address: Department of Chemistry, Loughborough University, Loughborough LE11 3TU, UK. |
| This journal is © The Royal Society of Chemistry 2022 |

