Mechanistic effects of solvent systems on the Ni–Sn-catalyzed hydrodeoxygenation of lignin derivatives to none-oxygenates†
Han
He
 a,
Ding
Luo
 b,
Hao
Ma
a and
Shuqian
Xia
*a
aKey Laboratory for Green Chemical Technology of State Education Ministry, School of Chemical Engineering and Technology, Tianjin University, Tianjin 300350, China. E-mail: shuqianxia@tju.edu.cn
bShaanxi Key Laboratory of Chemical Additives for Industry, College of Chemistry and Chemical Engineering, Shaanxi University of Science and Technology, Xi'an 710021, China
First published on 17th November 2021
Abstract
The presence of water in organic systems usually inhibits the activity of the reaction. In the biphasic system composed of water–decane, the distribution of lignin-derived m-cresol hydrodeoxygenation (HDO) products catalyzed by Ni–Sn was affected by the presence of water. Water can facilitate the hydrogenation process by the dissociation of water to produce H protons. However, the formation of complete deoxidation products may be inhibited because of the catalyst surface reconstruction and the low solubility in an aqueous system. DFT calculation theoretically revealed that the presence of water not only can lower the barrier and stabilize the transition state but also can affect the rupture of the CAr–O bond. Also, the significant characteristics of solvent action were explained by the hydrogenation and the solvatochromic parameters. Among them, m-cresol has a good performance in hydrocarbon solvents (CnH2n) and hydrogen bond donor (HBD) solvents. However, the catalytic activity decreases in alcohols due to the synergistic effects like H-bonds and competitive adsorption between the solvent and the substrate. The mechanism of the solvent effects with different properties can provide a reference for the subsequent expansion of the system in a wide range. Therefore, the synergy between the solvent and the catalyst provides a promising method for upgrading reclaimed chemicals from lignin.
1. Introduction
Energy is an indispensable resource for consumption.1 Biomass, as a renewable organic carbon resource in nature, has attracted much attention due to its environmental benefits.2 Because biomass will produce a variety of oxygen-containing compounds after pyrolysis treatment, this will cause low calorific value, chemical instability and other characteristics, which become the biggest difference with fossil fuels.2–5 To this end, the research with hydrodeoxygenation (HDO) technology is dedicated to the efficient conversion of oxygen-containing compounds into high-energy liquid fuels and high value-added chemicals.3,6,7 Due to the complexity of oxygen-containing compounds in pyrolytic lignin, related model compounds, such as phenol, cresol, guaiacol and other monomers with a typical lignin structure (CAr–OH and CAr–OCH3), have been used to reveal the mechanism of HDO.1,8–11 The selective removal of specific oxygen-containing functional groups has become the biggest focus of upgrading biomass energy, which not only embodies atom economy but also combines it with sustainable clean and green energy.There are two main pathways for the HDO reaction of aromatic oxygenates: one is hydrogenation–deoxygenation (HYD), in which hydrocarbons are generated by dehydration after complete hydrogenation to ring saturation in the presence of high-density H2. The other is direct deoxygenation (DDO) in a trace of H2 or a hydrogen-donating solvent; a discrepancy in the strength of the adsorbed H*, which is near the benzene ring, and the oxygen atoms leads to the direct cleavage or hydrogenolysis of the CAr–O bond. The OH* is replaced by H*, which retains the aromatic ring in this way.7 The HDO processes mainly use dual-functional catalysts, which are composed of metal sites for active hydrogenation sites, combined with acid sites for the dehydration process. It was found that the acid sites near the metal resulted in a significantly higher rate of hydrogenation and hydrolysis.12 The increase may be attributed to the combination of a high concentration of the reaction substrate and the transfer hydrogen near the acid site, whereas the H2 pressure also has a significant relation with the surface coverage of H and the active adsorption sites, which can regulate the competition between the HYD and DDO routes.
Previous studies have provided significant progress for the HDO of lignin-derived phenols. Water is an influential component of biomass and one of the products in the HDO reaction process; it will be accompanied during the catalytic process.13 The influence of water as part of the catalytic system during the reaction process was often neglected. Of particular interest for catalysts containing oxyphilic metals is the dissociation of water on the surface and the effect of the formed OH* on the HDO reaction. The presence of oxygen-containing substances on the surface of bimetallic catalysts can deactivate the oxyphilic metal catalysts by blocking the oxidizing surface of the active sites.14 However, it has also been mentioned in some studies that OH* formed by water dissociation on the catalytic surface may serve as the Brønsted acid sites to assist the catalytic reaction.14,15 The role of water might change the electronic structure of the metal catalyst surface and the water molecules at the active site may directly participate in the surface reaction by proton transfer.8 However, for all we know, there is no theoretical study on the reaction mechanism of m-cresol HDO on Ni–Sn catalysts. This prompted us to combine experiments with first-principles calculations to investigate the mechanism of action of water on the system. Due to the limitation of reaction temperature and pressure, the reaction conditions selected in the study were close to subcritical water, which was reported to be favorable for biomass transformation as the reaction environment.16 The mechanism of Ni–Sn catalysis for m-cresol HDO in the biphasic system provides a basis for the extensive analysis.
Furthermore, the solvent is also a key link in the catalytic system, which has significant impacts on the reaction and product distribution in the hydrogenation. Liu et al.1 studied the effect of Co-doped MoO2 catalyst on the HDO reaction of guaiacol in different solvents. The solvents were n-hexane, ethanol and water for selective dehydroxylation or alkylation to control the distribution of products. The increasing hydrogen-bonding effect between the solvent and guaiacol weakens the adsorption strength of the catalyst to guaiacol, which leads to a decrease in catalytic activity. Feng et al.17 tested phenol hydrogenation catalyzed by Pd/C in a variety of solvents to understand their performance. The results found that the conversion of phenol decreased with the increase of solvent polarity/polarizability π*. In the hydrolysis of diphenyl ethers,18 Wang19 explored the effects of different solvents on the catalytic reaction and found that the Lewis basicity of a solvent was the key to the conversion to a low-oxygen saturated products.
Herein, we reported that the 5NiSn/SiO2 catalyst designed in the previous study was used to explore the effects of the biphasic system composed of organic solvent and water in organic systems, and different characteristic solvents on the reaction of phenolic HDO. In the biphasic system, the existence form of water determines the products of the reaction. Through calculating the addition of different amounts of water to the system, it is found that water modifies the electronic structure of the metal catalyst by inducing the charge transfer between the metal surface and the interface water molecules. Comparing the paths of the two systems, it is concluded that the molecules and transition states involved in the presence of water on the surface affect the adsorption and reaction energy of the intermediates. Subsequently, to understand the catalytic process, the interaction between solvent, substrate and catalyst needs to be studied. We conclude that the solvent effect is the main factor of Ni–Sn-catalyzed m-cresol conversion in organic solvents. The goal of this article is to look into the mechanism of how water and different solvents affect the Ni–Sn catalyzed reaction and to provide proof at the atomic level by electron effect and reaction path calculation.
2. Experimental
2.1. Catalyst preparation
Typically, 1.33 mmol Ni(NO3)2·6H2O and 0.27 mmol Sn(SO)4 were dispersed in deionized water to obtain 0.1 M precursor for the preparation of 5NiSn/SiO2 catalyst (molar ratio Ni/Sn = 5![[thin space (1/6-em)]](https://www.rsc.org/images/entities/char_2009.gif) :
:![[thin space (1/6-em)]](https://www.rsc.org/images/entities/char_2009.gif) 1, the metal loading of catalyst was 10 wt%). SiO2 was used as a carrier and stirred while adding the precursor. Then 1 M urea solution was prepared and added as a precipitant. The mixed solution was continuously stirred at 90 °C for 8 h and dried in an oven at 80 °C for 12 h. Subsequently, the powder was placed in a quartz tube and calcined at 600 °C at a heating rate of 10 °C min−1 in N2 for 3 h, and then reduced in H2 under the same heating conditions for 3 h. After cooling to room temperature, 1% O2/N2 was added for passivation to prevent the deep oxidation of the catalyst in the air.
1, the metal loading of catalyst was 10 wt%). SiO2 was used as a carrier and stirred while adding the precursor. Then 1 M urea solution was prepared and added as a precipitant. The mixed solution was continuously stirred at 90 °C for 8 h and dried in an oven at 80 °C for 12 h. Subsequently, the powder was placed in a quartz tube and calcined at 600 °C at a heating rate of 10 °C min−1 in N2 for 3 h, and then reduced in H2 under the same heating conditions for 3 h. After cooling to room temperature, 1% O2/N2 was added for passivation to prevent the deep oxidation of the catalyst in the air.
2.2. Characterization
X-ray diffraction (XRD) patterns were measured with Smartlab using Cu Kα radiation in the 20°–80° diffraction angle range to verify the crystal structure, and the samples were also measured at a scanning rate of 1° min−1 to obtain detailed information. The crystal size and distribution of the 5NiSn/SiO2 catalysts were investigated via high-resolution transmission electron microscopy (HR-TEM) and energy dispersive X-ray spectroscopy (EDS). The imaging was performed using a JEM-F200 field-emission gun with an acceleration voltage of 200 kV. Gatan Digital Micrograph software was used for data analysis. X-ray photoelectron spectra (XPS) were carried out on a Thermo Fisher K-Alpha+ instrument coupled with an Al Kα X-ray radiation source at the pressure of 5 × 10⁻⁸ Pa. The binding energy was calibrated with the C 1s peak at 284.8 eV. Pyridine-Fourier transform infrared (Py-FTIR) spectroscopy was conducted using a Bruker VERTEX70 Fourier transform infrared spectrometer equipped with an in-suit cell. The spectral range was from 1400 to 4000 cm−1 with a resolution of 4 cm−1.2.3. Catalytic reactions
All HDO reactions were carried out in a 100 mL high-pressure reactor equipped with mechanical stirring. For the first typical reaction, m-cresol (0.5 g, 4.62 mmol), catalyst (10 mg), n-tridecane (internal standard, 0.5 g) and n-decane (solvent, 18 g) were added to the reactor sequentially, and then x water (x = a × n(m-cresol) mol (a ≥ 0)) was added. For the second reaction, m-cresol (0.5 g), catalyst (10 mg), n-tridecane (0.5 g) and solvent (18 g) were added to the reactor.After purging the reactor 3 times with H2, 3.8 MPa H2 was maintained at ambient temperature. The reaction was carried out at 300 °C and 500 rpm stirring. After the reaction was completed, the products were analyzed using a gas chromatograph (Persee GC-1100) and a gas chromatograph-mass spectrometer (GC-MS, Agilent GC-7890B msd-579a). The calibration curve of the standards was used to quantify the composition of the products. The product yield and selectivity for each product were calculated as follows:
2.4. Computational method
The calculation was performed using a plane wave-based DFT method implemented in the Vienna Ab initio Simulation Package (VASP).20 The core electron effects were treated using the projected augmented wave (PAW) method.21 The partial occupancies were determined according to the Methfessel–Paxton scheme with a smearing of 0.1 eV, and the energy and force tolerances were 10−6 eV and 0.015 eV Å−1, respectively.22 The Brillouin zone was sampled with a 3 × 3 × 1 Monkhorst–Pack grid for the geometry optimization of the surface.23 The modeling method in the previous study was used; owing to the surface and interior difference of catalyst particles, the surface of 5NiSn (111) was modelled and optimized by making a relaxed ratio of Ni/Sn = 5 in the top two layers of the Ni (111) slab. A p (4 × 4) supercell 5NiSn (111) structure with four layers of thickness on the surface was established, and the bottom two layers were fixed. Phenol was used instead of m-cresol as the model molecule to reduce the calculation cost.To establish the environment in the presence of water molecules, ab initio molecular dynamics (AIMD) simulations were performed on a 5NiSn (111) surface model composed of water and phenol.24 All AIMD simulations were run with a cut-off energy of 400 eV and a Monkhorst–Pack k-point mesh of (1 × 1 × 1). The time step was set to 1 fs to allow a larger time step in AIMD simulation. The phenol + water/5NiSn system was thermalized with AIMD simulations at 580 K in the canonical ensemble (NVT). Charge transfer was determined by Bader charge analysis on the system adsorption model. The stable structure obtained from the phenol + water/5NiSn (111) AIMD simulation was used as the starting configuration in the ground-state optimization calculations of all the tested reaction intermediates, and no additional AIMD simulations were performed for the intermediates (Fig. S1†). Transition state (TS) and minimum energy path (MEP) were obtained by using the climbing image nudged elastic band (CINEB) method.25 The obtained TS reuses the imaginary frequency to verify that there was only one imaginary frequency in the normal mode analysis of the deoxidation transition state.
The adsorption energy (Eads) was calculated with the following formula:
| Ea = Etotal − Eslab − Eads |
3. Results and discussion
3.1. Catalyst characterization
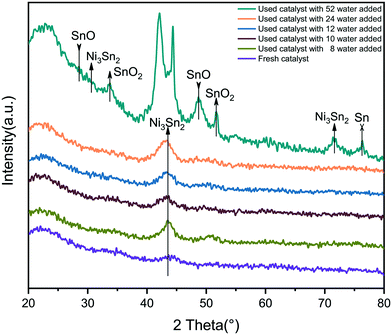
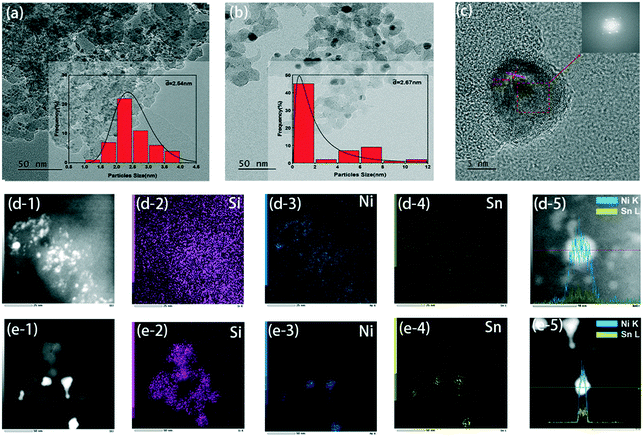
X-ray diffraction (XRD) results of the fresh catalyst and the used catalyst are shown in Fig. 1. The Ni–Sn alloy formed in the fresh 5NiSn/SiO2 catalyst is the dispersion peak of the Ni3Sn2 intermetallic compound (IMC), which was due to the high dispersion of the active component on the carrier. When the amount of water added in the reaction system was less than 24 water molecules, the diffraction peak intensity of Ni3Sn2 changed slightly, indicating that a small amount of water has little effect on the crystal structure of the catalyst. But as the water content continued to increase in the system, the intensity of the diffraction peak at Ni3Sn2 was observed to increase, and the IMC particles started to agglomerate. The crystallinity of the material in the initial state may be low or the crystal grains may be small, resulting in a wider diffraction peak. When 52 water molecules were added to the system, it was observed that the crystal grains grew due to the increase in crystallinity or the melting and recrystallization of small crystal grains in the catalyst after reaction, so the diffraction peaks became sharp and clear from the original peak with a poor degree of separation, and the peak splitting phenomenon occurred. Moreover, the addition of more water was accompanied by the formation of oxides of some Sn species and the agglomeration of Sn itself. The addition of water can also cause the leaching of active components, leading to changes in the structure of the catalyst and thus affecting the activity of the catalyst.The morphology and particle distribution of the catalyst obtained from TEM images are shown in Fig. 2(a) and (b). The bimetallic particles were evenly dispersed on the nano-silica. For the fresh 5NiSn/SiO2 catalyst, the average size of the formed Ni–Sn alloy was about 2.5 nm. Larger metal particles were found in the catalyst after adding 52 water molecules to the system. Although the average size of the particles increased a little, more large-size particles appeared, which may be the result of the oxidation or increased crystallinity via recrystallization of the metal catalyst surface caused by the excessive addition of water. Fig. 2(c) is the HRTEM image of Fig. 2(b), where the lattice of 0.21 nm is exposed to the (111) plane, indicating that the change of the reaction system has no effect on the catalyst structure. The corresponding HAADF-STEM images (Fig. 2(d) and (e)) and element mapping clearly showed that the two metals were obviously dispersed on the support. Elemental mapping analysis of Ni and Sn gave a direct visual evidence of particle distribution in the same part of the catalyst. In addition, linear scanning results of the catalysts (Fig. 2(d-5) and (e-5)) also indicated the variation trend and good distribution of element content of Ni species and Sn species in the grain interval.
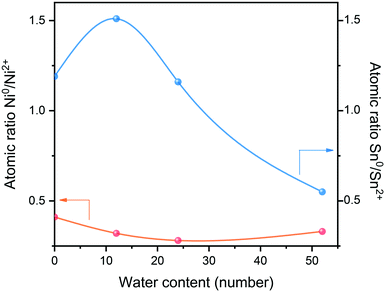
Further XPS analysis was used to determine the phases of Ni and Sn in the catalyst and to explore the electronic structure and composition of the catalytic surface. The measured chemical states indicate at least two kinds of Ni and Sn present on the surface of the catalyst, as shown in Fig. 3. The Ni XPS spectrum is shown in Fig. 3(a), where multiple bands of nickel species can be observed. Doublet bands of Ni0 appeared at 853.2 eV and 869.2 eV for Ni 2p3/2 and Ni 2p1/2, respectively.26 Doublet bands of Ni2+ presented at 855.9–856.4 eV and 873.0–873.7 eV, which partially overlapped with the bands of the Ni0 satellite belt. According to the splitting peak of the Ni 2p3/2 spectrum, as the water content of the system increased to 52 water, the binding energy of Ni0 and Ni2+ reduced from 853.3 eV and 856.4 eV to 852.51 eV and 855.9 eV, respectively. The micro-migration of these peaks indicated that electron transfer from Sn to Ni has occurred in the formed Ni–Sn alloy phase, which was also related to the lower electronegativity of Sn (1.82) than Ni (1.88). In the case of the Sn XPS spectrum (Fig. 3(b)), the double bands of Sn 3d5/2 and Sn 3d3/2 were around 486.1 eV and 494.5 eV, respectively. However, in the high-resolution Sn 3d5/2 nuclear energy level spectrum, Sn2+ and Sn4+ have similar binding energies and cannot be distinguished by peak separation and fitting.27 The peaks at 487.0 eV and 495.4 eV belong to Snσ+ species, which are related to the oxides of tin on the carrier.28,29 In addition, the Sn species on the surface were partially reduced from Sn4+ to Sn2+, and then from Sn2+ to Sn0. As the water content increased in the system, the atomic ratio of Ni0/Ni2+ fluctuated slightly (Table S1†), and the proportion of Sn0/Sn2+ increased and then decreased; the electronic properties of the catalyst also changed accordingly.
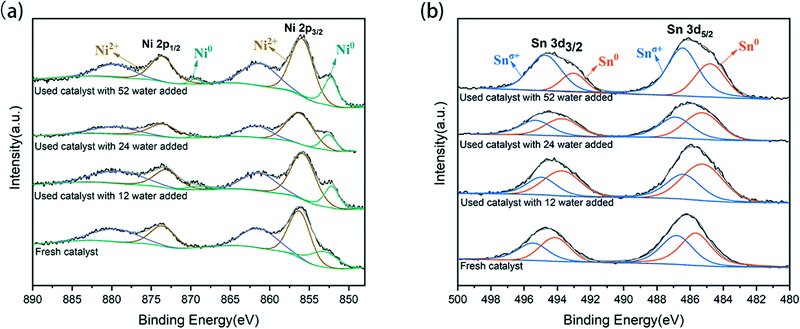 | ||
| Fig. 3 XPS spectra of 5NiSn/SiO2 catalysts after various system reactions: (a) Ni 2p region and (b) Sn 3d region. | ||
These trends are better illustrated in Fig. 4: when 12 water were added into the system, a water monolayer would be formed, and the Ni0/Ni2+ ratio decreased slightly while the Sn0/Sn2+ ratio increased significantly. This was because more H* protons produced by hydrolysis contributed to the coordination effect between Ni–Sn and the adsorbed hydrogen at the active center of pre-reduced Ni, leading to hydrogen overflow. Hydrogen spillover promoted the reduction of Snδ+ species and produced more Sn0. However, the subsequent increase of water content showed that both Sn0 and Ni0 were decreasing, which was probably as a result of surface oxidation of the catalyst in the water environment.
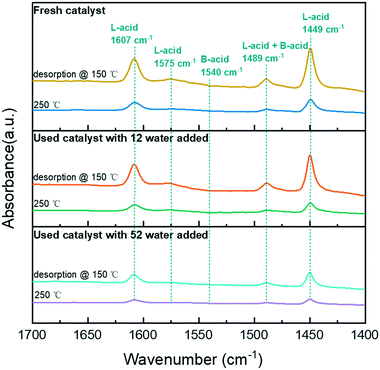
The significant increase in hydrogenation and hydrolysis resulting from the acid site near the metal is due to the high concentration of reactants bound to the hydrogen transfer near the acid site.12 Therefore, the acidity of the catalyst is critical for phenol HDO. Thus, the surface acidity of the catalyst was analyzed by Py-FTIR (Fig. 5). According to a previous study, the bands at 1449, 1575, and 1607 cm−1 were attributed to pyridine vibrations adsorbed at Lewis acid (L-acid) sites.30 With the addition of water in the system, the band of the catalyst was decreased significantly, indicating that the addition of water reduced the L-acid strength of the catalyst. The concentration of acid sites of the catalyst in the water addition system was reduced (Table S2†). All the catalysts have no bands at 1540 cm−1, which indicated the absence of pyridine adsorption at the Brønsted acid (B-acid) site on the catalysts. In the reaction system with water, some L-acid sites were unstable and easily converted to B-acid sites.31 Therefore, the strength of the L-acid with water participating in the reaction was reduced to varying degrees.
3.2. HDO of m-cresol in the biphasic system
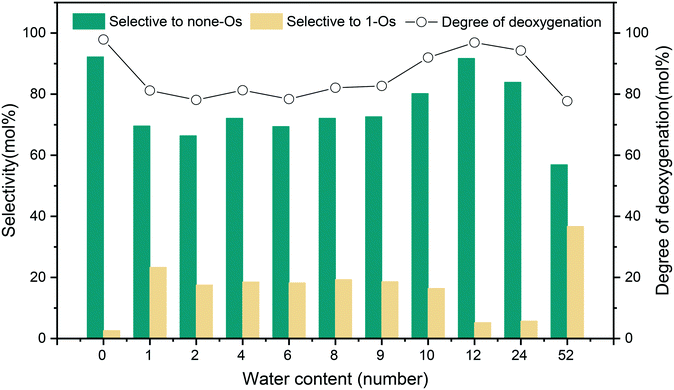
The HDO reaction network of m-cresol on the 5NiSn/SiO2 catalyst is shown in Scheme S1.† Under high H2 pressure, singly oxygenated (1-Os) products (MCHone and MCHol) were generated firstly by hydrogenation and then deoxygenated to generate the completely deoxidized (none-Os) product (MCHane). The biphasic system composed of n-decane and water affected the catalytic activity and selectivity of m-cresol HDO, as shown in Fig. 6. The HDO of m-cresol occurs both in the organo-hydrophobic n-decane layer and in the hydrophilic water layer but in different ways. If the water content is less than 12 water, the addition of water seems unfavorable to the conversion of m-cresol, affecting the HDO effect of the catalyst to some extent. This is due to the competitive adsorption of water and the reactants on the active sites, resulting in reduced catalyst activity. Thus, the addition of some water reduced the selectivity to the completely deoxidized products (none-Os) during the m-cresol HDO in the biphasic system. It can be inferred from the previous characterization results of XRD and TEM tests that the surface structure of the 5NiSn/SiO2 catalyst was reconstructed in the water-rich system, resulting in the reduction of catalytic activity. By comparing the TEM images of the catalysts after the reaction of monophasic and biphasic system, the number of particles larger than 4 nm increased and even alloy particles larger than 10 nm have appeared (Fig. 2). The XRD characterization results (Fig. 1) indicated that the enhancement and more crystalline of Ni–Sn alloy diffraction was due to the water content in the system being greater than 24 water. At the same time, the presence of metal oxides was also found, indicating that the addition of too much water greatly affected the crystal structure of the catalyst. The presence of oxygen-containing compounds will block the catalytically active sites and lead to degradation of the catalyst functionality and chronic deactivation. From the Py-FTIR analysis, the acid strength of the catalyst surface after the reaction was reduced to varying degrees when water was present in the system. Since the acidic sites of the catalyst usually assist in deoxygenation, the decrease in acidity also leads to a decrease in the performance of the catalyst. Furthermore, the low solubility of none-Os in hydrophilic environments is one of the factors. All of the effects caused the main increase in the selectivity for MCHone and MCHol as 1-Os products, while the selectivity for MCHane (none-Os) decreased.However, the degree of deoxidation and the selectivity to the product for the system with water content between 12 water and 24 water were almost the same as that of the system without water (0 water). This may be because some of the water on the catalyst surface were present in the form of a layer of water molecules, protons donated by water, and the produced OH* will act as the Brønsted acid sites to promote the reaction. This is because the interaction between hydrogen transfer near the acid site and the substrate increased the hydrogenation rate. Some studies claim that water as a solvent can also significantly accelerate the diffusion rate of protons.32 Hydrogen diffusion and reaction efficiency can be improved by water molecules to provide protons to the catalytic surface and then receive additional proton transfer. Moreover, the hydrolyzed protons and pressurized hydrogen in water can participate in the hydrogenation and the removal of OH*, which improves the efficiency of the HDO reaction to a certain extent.
In general, when a small amount of water as steam was present in the system, the main factor leading to catalytic reaction was the oxidation of the catalyst surface and the competitive adsorption of steam molecules with the reactants. When a certain amount of water forms a single aqueous layer, the dissociation of water increases the local acidity because of the interaction between hydrogen transfer and substrate in the system. The catalyst may be distributed between the two phases, resulting in the promotion of the hydrogenation reaction to a certain extent.
The presence of water affects the adsorption stability of the surface and the electronic state of the metal surface by inducing the charge transfer between the metal surface and the interfacial water molecules. Therefore, in the model, phenol and different numbers of water molecules (vacuum, 1, 4, 9, 12, and 24 water molecules) are placed on the metal surface. 1, 4, and 9 water molecules represent different concentrations of steam, 12 water molecules represents a water monolayer, and 24 water molecules represents a water double-layer environment (Fig. 7). Calculations found that with the increase of the water molecules, the benzene ring became less electron rich, and more electron transfer occurred between the catalytic surface and the water, which may make it more difficult for the hydrogenation to occur. The partial atomic charges of phenol in the state of neutralization and adsorption in gas (Table 1) illustrate the difference in phenol adsorption on the surface of the catalyst in different systems. The charge difference of carbon atoms on the benzene ring have significant differences in different aqueous systems, but there was little difference in the charge of the phenolic hydroxyl atoms. The partial charge of the total carbon atoms of the phenolic benzene ring in the gas phase is 0.16 |e|, and the catalytic surface with different amounts of water decreased by 0.18, 0.09, 0.12, 0.24, and 0.11 |e|, respectively. When phenol and 12 water molecules were co-adsorbed on the catalytic surface, the charge density on the carbons of phenol decreases the most. This can increase the electron-induced effect and weaken the electron conjugation effect. The ability to accept electrons on phenol is improved, resulting in an increase in local acidity. The change in the partial charge of the carbon atoms indicates that the addition of water causes the adsorption of carbon in phenol unstable on the catalytic surface, affecting the cycloaddition hydrogenation. The partial charge of the O atom of phenols in the gas phase is 1.18 |e|, and the changes of the catalytic surface change about 0.01–0.03 |e| after adsorption in the presence of different amounts of water. The partial charge of the H atom of the hydroxyl group in the gas phase is −0.65 |e| and varies from 0 |e| to 0.02 |e| in different environments. With the addition of water, the partial charge change on the hydroxyl group in phenol may be due to the adsorption of oxygen atoms on the surface.
| Atom | Vacuum | Single water | 4 water | 8 water | 12 water | 24 water |
|---|---|---|---|---|---|---|
| C1 | −0.57 | −0.44 | −0.44 | −0.66 | −0.58 | −0.49 |
| C2 | 0.08 | 0.01 | −0.09 | 0.07 | 0.13 | 0.04 |
| C3 | 0.16 | 0.06 | 0.17 | 0.17 | 0.14 | 0.07 |
| C4 | 0.15 | 0.05 | 0.28 | 0.23 | −0.07 | 0.11 |
| C5 | 0.20 | 0.19 | 0.11 | 0.10 | 0.19 | 0.19 |
| C6 | 0.14 | 0.11 | 0.04 | 0.13 | 0.11 | 0.13 |
| Total C | 0.16 | −0.02 | 0.07 | 0.04 | −0.08 | 0.05 |
| O | 1.18 | 1.19 | 1.17 | 1.19 | 1.21 | 1.21 |
| H | −0.65 | −0.65 | −0.63 | −0.65 | −0.67 | −0.66 |
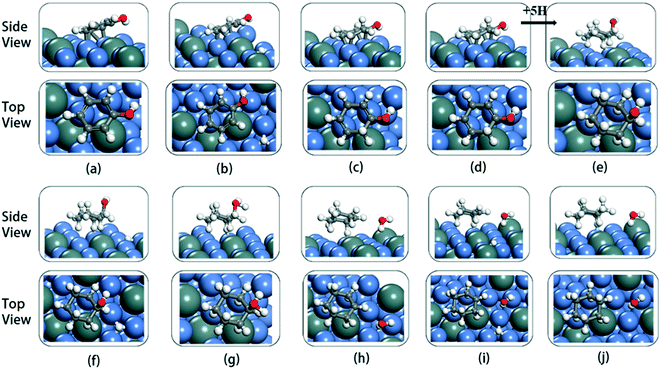
The cyclic hydrogenation and deoxygenation reactions start with the adsorption of phenol on the 5NiSn (111) surface (see eqn (i) in Scheme S2†), as shown in Fig. 8(a). Fig. 8(b)–(d) show the subsequent steps of the ring hydrogenation, where a π bond of the aromatic ring was hydrogenated into a single bond to produce C6H6OH* by surface adsorption. The cyclic hydrogenation continues until the unsaturated aromatic ring converts to a saturated ring and forms C6H11OH* (eqn (iv) in Scheme S2†) in the presence of adsorbed hydrogen (5H*) on the surface, as shown in Fig. 8(e). The intermediate formed by the weaker interaction between the produced alcohol and the metal surface will be desorbed in advance. The transition state in the hydrogenation step is labeled TS1–TS8 in Fig. 9. It can be seen from Table 2 that the activation barrier (Ea) of the hydrogenation step in the presence of single water was higher than that in the vacuum, and the Ea of C–O bond fracture was 0.51 eV higher.
| Reaction step | Vacuum | Single water molecule |
|---|---|---|
| C1–H formation | 0.01 | 0.92 |
| C2–H formation | 0.54 | 0.53 |
| C3–H formation | 0.08 | 0.08 |
| C4–H formation | 0.12 | 0.15 |
| C5–H formation | 0.65 | 0.88 |
| C6–H formation | 0.41 | 0.89 |
| C–O cleavage | 1.27 | 1.78 |
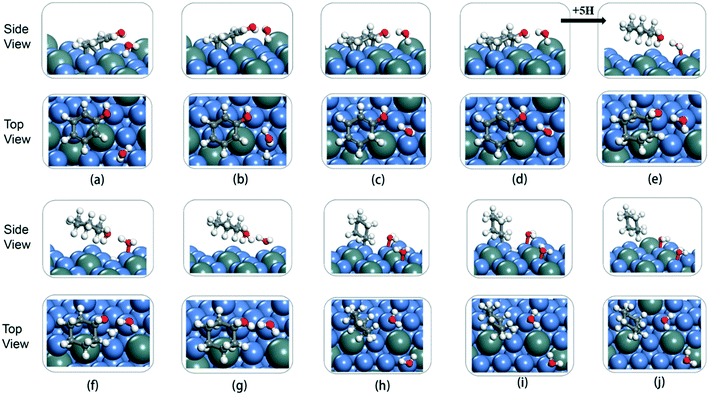
To fully illustrate the effect of the presence of water on every single step of the reaction, each basic step of each pathway was examined in the reaction; the addition of a single water molecule was examined as an example and is shown in Fig. 10. In addition to cyclic hydrogenation, the most critical step in the HDO reaction of phenols is the cleavage of the C–O bond, since the removal of oxygen-containing functional groups was the goal of the reaction. Because of the polarity of the hydroxyl functional group of phenol, the presence of water can affect the strength of the C–O bond through hydrogen bond interaction with surrounding water molecules. Compared with the fracture of the phenol C–O bond (TS7 in Fig. 9) in vacuum conditions, the reaction energy increased in the presence of water (TS7 in Fig. S2†). However, since the solvated water molecule can stabilize the protons, the formed hydronium ion in one of the water molecules in the transition state will lower the potential barrier in the liquid phase.33 The cyclohexyl species obtained after benzene ring hydrogenation and C–O bond cleavage were in the form of vertical adsorption in the single water environment, as shown in Fig. 10(h)–(j). In the vacuum environment, phenol and its reaction intermediates were adsorbed in the form of carbon rings parallel to the catalytic surface (Fig. 8). However, the vertical structure in the optimization process was more unstable than the geometric structure adsorbed by the carbon ring parallel to the catalytic surface, and the system energy needs to be increased to maintain the balance. It can also be seen from Table 2 that the bond-forming energy of C–H and the bond-breaking energy barrier of C–O both increased during the hydrogenation of the benzene ring in the presence of a single water molecule.
By comparing the energy barrier of the two reaction paths (Fig. 11), a relatively stable system can be obtained by introducing H* into C6H5–OH* in the presence of water in the initial hydrogenation process, and the subsequent formation of C1–H bond needs to overcome the high activation energy. Moreover, the formation of C5–H and C6–H bonds was a thermodynamically unfavorable form in the presence of a water molecule, and then the attack of H* needs to overcome a larger energy barrier to reach a stable equilibrium state. However, it can also be seen from Fig. 11 that the phenol adsorption energy decreased in the presence of water and the transition states of the catalytic surface were more stable. This is because the water-rich region forms around the OH group, which improves the H-bond strength between the reactant and the water molecule, thus affecting the stability of the transition state.34 The final formed C6H12 was on the catalytic surface with the removed H2O, but it has a more stable state in the system with water molecules.
3.3. Solvent effect on m-cresol HDO
The different properties of the reaction solvents are shown in Table 3. It can be seen from the table that water has the highest polarity and HBD ability. Alkanes have low polarity generally, without HBD ability and HBA ability. Among them, HBD–HBA solvents have higher polarity and better hydrogen supply capacity, and the polarity of HBA solvents is lower than that of HBD–HBA solvents.17 These properties of solvents affect the catalytic activity of phenols in the HDO reaction.| Solvent | E NT | α | β | π*d |
|---|---|---|---|---|
| a Polarity. b Hydrogen bond donation (HBD) ability. c Hydrogen bond acceptance (HBA) ability. d Polarity/polarizability π*. | ||||
| m-Cresol | — | 1.13 | 0.34 | 0.68 |
| Water | 1.000 | 1.17 | 0.47 | 1.09 |
| Isopropanol | 0.546 | 0.76 | 0.84 | 0.48 |
| HFIP | 1.068 | 1.96 | 0.00 | 0.65 |
| Ethyl acetate | 0.228 | 0.00 | 0.45 | 0.55 |
| 2-Me-THF | 0.179 | 0.00 | 0.45 | — |
| 1,4-Dioxane | 0.164 | 0.00 | 0.37 | 0.55 |
| n-Hexane | 0.009 | 0.00 | 0.00 | −0.04 |
| n-Heptane | 0.012 | 0.00 | 0.00 | −0.08 |
| n-Octane | 0.012 | 0.00 | 0.00 | 0.01 |
| n-Decane | 0.012 | 0.00 | 0.00 | 0.03 |
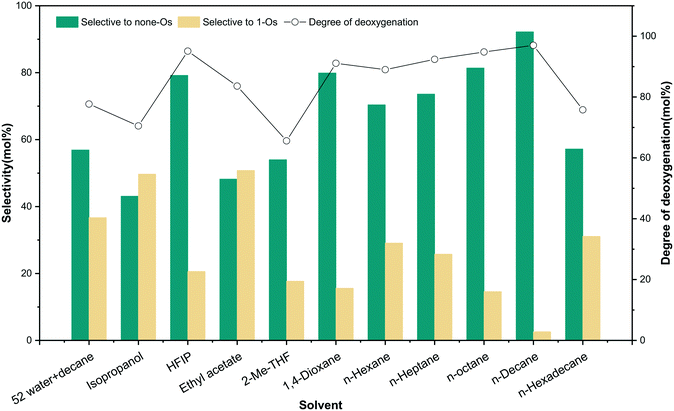
The involvement of solvent and the interaction between solvent and substrate affect the distribution of products.36 To unveil the effect of solvents on m-cresol HDO, four different kinds of solvents were selected for testing according to their performance. The first kind of solvent is a Lewis basic protic solvent: isopropanol.37 It has a high polarity, as shown in Table 3 by the value of ENT, which is an HBD–HBA solvent. The second type of solvent is HFIP, a protic solvent that does not have Lewis basicity but has the best HBD ability. The third type of aprotic HBA solvents were tested with ethyl acetate, 2-Me-THF and 1,4-dioxane. The last option is aprotic non-polar solvents that have neither hydrogen bonds for acceptors nor Lewis basicity: n-hexane, n-heptane, n-octane, n-decane, and n-hexadecane. The influence of alkanes with different carbon numbers on the reaction was also investigated. Table S3† summarizes the results of the reaction of m-cresol with 5NiSn/SiO2 at 3.8 MPa H2 (RT) at 300 °C for 1 h. The results revealed that the solvent affected the reaction greatly, and the HDO results of m-cresol were described by comparing the selectivity of different solvent systems to none-Os products (Fig. 12).
In fact, the reaction carried out in isopropanol produced a large amount of none-Os and 1-Os products, while more none-Os products were produced in HFIP with a higher degree of deoxygenation. The result revealed obviously that isopropanol inhibited the HDO activity of the reaction. It is probably due to the enhancement of the H-bond between the substrate and the solvent, which weakens the adsorption strength of the catalyst to the substrate. m-Cresol and alcohols may form competitive adsorption on the same active site on the catalytic surface, resulting in a decrease in the selectivity of HDO products. In addition, the charge distribution of the solute polarizes the solvent through the electrostatic interaction between the dipole moment of the polar solvent and the solute molecule. The polarization can also affect the charge distribution of the solute, thereby affecting the energy and stability of the system. A study has also shown that isopropanol as a solvent with high Lewis basicity can hinder the catalyst performance.19 Although HFIP is a strong polar solvent with good HBD ability, it showed good catalytic performance because it does not have Lewis basicity. In the third group of solvents, the selectivity to none-Os increased sequentially with decreasing ENT: ethyl acetate (48.2%), 2-Me-THF (54.0%), and 1,4-dioxane (79.9%). For HBA solvent, the solvent molecule can provide a lone pair of electrons through the oxygen atom, and the interaction between the metal and the lone pair of electrons blocks the active site.38 Therefore, this type of solvent interacts with m-cresol (HBD substance with α = 1.13) so that suppressing the adsorption of m-cresol on the metal surface will reduce the catalytic activity. In the fourth group of solvents, the selectivity for the none-Os product was generally high, but the reactions in long-chain alkanes with lower solubility will produce more cracked products (methane) at high temperatures. In linear alkanes with lower carbon numbers, the deoxidation rate increased gradually with the growth of the alkane chain length. However, the low solubility of substrate in the longer-chain alkanes and the interaction between solvent and catalyst lead to the increase of the adsorption strength of the solvent and the decrease of the hydrogenation rate of m-cresol. Among the tested solvents (Fig. S3†), the adsorption of n-hexadecane (ΔEa = 0.05 eV) on the 5NiSn catalytic surface was more stable at high temperature, meaning that the interaction between the reactants and the catalyst will be weakened. The hydrogen bond effect between the solvent and m-cresol (hydrocarbons < HBA solvents < HBD–HBA solvents < water < HBD solvents) will weaken the adsorption strength of the catalyst for m-cresol, which may lead to the gradual decrease of the activity of the catalyst (Table S4†). Moreover, the solubility of H2 in the solvent also affects the performance of the catalyst. For example, the solubility of H2 in n-heptane (4.70 mol m−3) is higher than that in ethyl acetate (3.54 mol m−3); the reaction in n-heptane had higher conversion and none-Os product selectivity. These consequences further suggested that the type of solvent has significant effects on the yield and distribution of the product. In order to explain the significant characteristics of the solvent action, the hydrogenation and the solvatochromic parameters of the solvent were studied (Table 3). For the same group of solvents in Fig. S4,† the selectivity of complete HDO products as a function of the empirical parameter of solvent polarity. Selectivity in hydrocarbon and HBA solvents tends to decrease with increasing polarity ENT.
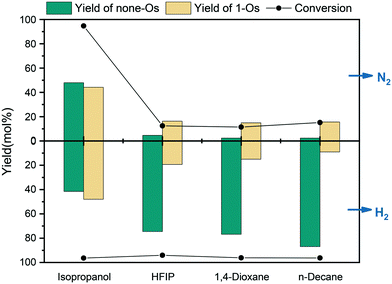
In the biphasic system with 52 water added (Fig. 12), more hydrogenation products containing one oxygen atom (1-Os) appeared, while the selectivity of none-Os decreased. The reaction results in different solvents indicated that more hydrogenated 1-Os products appeared in HBD–HBA solvents, while the yield of none-Os was lower. We can speculate that hydrogen atoms or protons were supplied by water or can also be supplied by a hydrogen-supplying solvent.
As shown in Fig. 13, the reaction in n-decane replaced H2 with N2, which inhibited the HDO of m-cresol. In the conversion of m-cresol in HBD solvents, HFIP decreased from 94.1% in H2 to 12.5% in N2. The conversion in H2 was 96.2% and in N2 was reduced to 11.4% with the HBA solvent 1,4-dioxane. In isopropanol, the conversion of m-cresol in H2 was 96.4% and in N2 was 94.7%. Therefore, the HDO of isopropanol and m-cresol may not require additional H2 supplementation. In contrast, H2 may form competitive adsorption with alcohol on the catalyst surface, resulting in a negative impact on the selectivity of the product. In addition, at the same initial pressure, the selectivity of the final deoxidation product none-Os in N2 was 6.5% higher than that in H2, indicating that the addition of H2 has a certain inhibitory effect on the complete HDO of m-cresol on the catalytic surface in alcohol solvents to a certain extent. Previous studies have shown that the release of H* in alcohol was easier than the dissociation of H2.39 Therefore, the competitive adsorption of H2 and alcohol on the catalyst surface may reduce the release rate of H* in alcohol, thereby inhibiting the dissolution of alcohol. Thus, the solvent of choice for the hydrodeoxygenation of m-cresol at high hydrogen pressure can be a long-chain alkane or HBD solvents.
4. Conclusions
The effect of water on m-cresol HDO was studied in a reaction system with organic solvent as a main body. Water at the subcritical period can be considered as the promoter of the 5NiSn/SiO2 catalyst, which can assist the HDO process of m-cresol. The monolayer water dissociates at the catalytic surface, facilitating hydrogenation by proton transfer of hydrogen to the reactant adsorption site. However, the presence of a certain amount of water will reduce the catalytic activity by oxidizing the surface of the catalyst or competitive adsorption with the reactants. DFT calculations also provide a theoretical proof for the effect of water in terms of charge and transition state simulation. In the biphasic system, water changes the electronic structure of the catalyst by inducing charge transfer between the metal surface and the interface water molecules. It can be concluded from the path calculation that the molecules and transition states involved in the presence of water on the surface will affect the adsorption and reaction energy of the intermediates. It is proved that the presence of water lowers the potential barrier and stabilizes the transition state. The proton transfer of water was beneficial to the HDO activity, but in the biphasic reaction of water and n-decane, the activity of the m-cresol HDO reaction and the selectivity of the product have a greater negative impact.The catalytic properties of Ni–Sn for m-cresol HDO in different kinds of solvents were discussed. The solvent effect is the main factor of Ni–Sn catalyzed m-cresol conversion in organic solvents. The high reactivity in HBD and alkane solvents is due to the solvent not showing Lewis alkalinity. The interaction between the lone pair of electrons provided by the solvent molecule of the HBA solvent and the metal will hinder the active site and reduce the catalytic activity through inhibiting the adsorption of the substrate. Although alcohols, being HBA solvents, have the capacity to donate hydrogen, the synergistic effects like H-bonds and the competitive adsorption with the reactants lead to low deoxidation selectivity, and more hydrogenated products are generated. The mechanism of solvent effects with different properties in organic systems will provide a reference for the subsequent expansion of the system in a wide range.
Conflicts of interest
There are no conflicts to declare.Acknowledgements
Financial support by the National Basic Research Program of China (973) special preliminary study program (2014CB260408) is gratefully acknowledged.References
- G.-H. Liu, Z.-M. Zong, Z.-Q. Liu, F.-J. Liu, Y.-Y. Zhang and X.-Y. Wei, Fuel Process. Technol., 2018, 179, 114–123 CrossRef CAS.
- Y. Liao, S.-F. Koelewijn, G. Van den Bossche, J. Van Aelst, S. Van den Bosch, T. Renders, K. Navare, T. Nicolaï, K. Van Aelst, M. Maesen, H. Matsushima, J. M. Thevelein, K. Van Acker, B. Lagrain, D. Verboekend and B. F. Sels, Science, 2020, 367, 1385–1390 CrossRef CAS PubMed.
- C. Zhao, Y. Kou, A. A. Lemonidou, X. Li and J. A. Lercher, Angew. Chem., Int. Ed., 2009, 48, 3987–3990 CrossRef CAS.
- J. He, C. Zhao and J. A. Lercher, J. Am. Chem. Soc., 2012, 134, 20768–20775 CrossRef CAS PubMed.
- P. A. Zapata, J. Faria, M. P. Ruiz, R. E. Jentoft and D. E. Resasco, J. Am. Chem. Soc., 2012, 134, 8570–8578 CrossRef CAS PubMed.
- M.-Y. Chen, Y.-B. Huang, H. Pang, X.-X. Liu and Y. Fu, Green Chem., 2015, 17, 1710–1717 RSC.
- C. Zhang, C. Jia, Y. Cao, Y. Yao, S. Xie, S. Zhang and H. Lin, Green Chem., 2019, 21, 1668–1679 RSC.
- Y. Yoon, R. Rousseau, R. S. Weber, D. Mei and J. A. Lercher, J. Am. Chem. Soc., 2014, 136, 10287–10298 CrossRef CAS.
- Q. Tan, G. Wang, L. Nie, A. Dinse, C. Buda, J. Shabaker and D. E. Resasco, ACS Catal., 2015, 5, 6271–6283 CrossRef CAS.
- K. Lee, G. H. Gu, C. A. Mullen, A. A. Boateng and D. G. Vlachos, ChemSusChem, 2015, 8, 315–322 CrossRef CAS PubMed.
- X. Liu, W. An, Y. Wang, C. H. Turner and D. Resasco, Catal. Sci. Technol., 2018, 8, 2146–2158 RSC.
- W. Song, Y. Liu, E. Baráth, C. Zhao and J. A. Lercher, Green Chem., 2015, 17, 1204–1218 RSC.
- H. Wang, J. Male and Y. Wang, ACS Catal., 2013, 3, 1047–1070 CrossRef CAS.
- A. J. R. Hensley, Y. Wang, D. Mei and J.-S. Mcewen, ACS Catal., 2018, 8(3), 2200–2208 CrossRef CAS.
- D. Hibbitts, Q. Tan and M. Neurock, J. Catal., 2014, 315, 48–58 CrossRef CAS.
- M. Möller, P. Nilges, F. Harnisch and U. Schröder, ChemSusChem, 2011, 4, 566–579 CrossRef.
- G. Feng, Z. Liu, P. Chen and H. Lou, RSC Adv., 2014, 4, 49924–49929 RSC.
- X. Wang and R. Rinaldi, ChemSusChem, 2012, 5, 1335 CrossRef CAS.
- X. Wang and R. Rinaldi, ChemSusChem, 2012, 5, 1455–1466 CrossRef CAS.
- W. Kohn and L. J. Sham, Phys. Rev., 1965, 140, A1133–A1138 CrossRef.
- P. E. Blöchl, Phys. Rev. B: Condens. Matter Mater. Phys., 1994, 50, 17953–17979 CrossRef.
- M. Methfessel and A. T. Paxton, Phys. Rev. B: Condens. Matter Mater. Phys., 1989, 40, 3616–3621 CrossRef CAS.
- H. J. Monkhorst and J. D. Pack, Phys. Rev. B: Solid State, 1976, 13, 5188–5192 CrossRef.
- G. Kresse and J. Hafner, Phys. Rev. B: Condens. Matter Mater. Phys., 1993, 48, 13115–13118 CrossRef CAS PubMed.
- G. Henkelman and H. Jónsson, J. Chem. Phys., 1999, 111, 7010–7022 CrossRef CAS.
- A. M. Tarditi, N. Barroso, A. E. Galetti, L. A. Arrúa, L. Cornaglia and M. C. Abello, Surf. Interface Anal., 2014, 46, 521–529 CrossRef CAS.
- G. Wang, H. Wang, H. Zhang, Q. Zhu, C. Li and H. Shan, ChemCatChem, 2016, 8, 3137–3145 CrossRef CAS.
- S. Pisduangdaw, J. Panpranot, C. Methastidsook, C. Chaisuk, K. Faungnawakij, P. Praserthdam and O. Mekasuwandumrong, Appl. Catal., A, 2009, 370, 1–6 CrossRef CAS.
- P. Reangchim, T. Saelee, V. Itthibenchapong, A. Junkaew, N. Chanlek, A. Eiad-ua, N. Kungwan and K. Faungnawakij, Catal. Sci. Technol., 2019, 9, 3361–3372 RSC.
- M. R. Basila, T. R. Kantner and K. H. Rhee, J. Phys. Chem., 1964, 68, 3197–3207 CrossRef CAS.
- X. Liu, X. Liu, G. Xu, Y. Zhang, C. Wang, Q. Lu and L. Ma, Green Chem., 2019, 21, 5647–5656 RSC.
- V. V. Rozanov and O. V. Krylov, Russ. Chem. Rev., 1997, 66, 107–119 CrossRef.
- L. Zhu and J. W. Bozzelli, J. Phys. Chem. A, 2003, 107, 3696–3703 CrossRef CAS.
- T. W. Walker, A. K. Chew, H. Li, B. Demir, Z. C. Zhang, G. W. Huber, R. C. Van Lehn and J. A. Dumesic, Energy Environ. Sci., 2018, 11, 617–628 RSC.
- Y. Marcus, Chem. Soc. Rev., 1993, 22, 409–416 RSC.
- N. Shi, Q. Liu, Q. Zhang, T. Wang and L. Ma, Green Chem., 2013, 15, 1967–1974 RSC.
- W. Guan, X. Chen, J. Zhang, H. Hu and C. Liang, Renewable Energy, 2020, 156, 249–259 CrossRef CAS.
- H. Takagi, T. Isoda, K. Kusakabe and S. Morooka, Energy Fuels, 1999, 13, 1191–1196 CrossRef CAS.
- R. Ma, W. Hao, X. Ma, Y. Tian and Y. Li, Angew. Chem., Int. Ed., 2014, 53, 7310–7315 CrossRef CAS PubMed.
Footnote |
| † Electronic supplementary information (ESI) available. See DOI: 10.1039/d1cy01965a |
| This journal is © The Royal Society of Chemistry 2022 |


