Nanocrystalline rhenium-doped TiO2: an efficient catalyst in the one-pot conversion of carbohydrates into levulinic acid. The synergistic effect between Brønsted and Lewis acid sites†
Sorin
Avramescu
a,
Cristian D.
Ene
 b,
Madalina
Ciobanu
b,
Josefine
Schnee
b,
Madalina
Ciobanu
b,
Josefine
Schnee
 c,
Francois
Devred
d,
Cristina
Bucur
e,
Eugeniu
Vasile
f,
Luke
Colaciello
g,
Ryan
Richards
 *g,
Eric M.
Gaigneaux
 *d and
Marian Nicolae
Verziu
 *hi
*hi
aDepartment of Organic Chemistry, Biochemistry and Catalysis, Faculty of Chemistry, University of Bucharest, Bdul Regina Elisabeta, 4-12, Bucharest 030016, Romania
b“Ilie Murgulescu” Institute of Physical Chemistry, Romanian Academy, Splaiul Independentei 202, 060021 Bucharest, Romania
cNormandie Université, ENSICAEN, UNICAEN, CNRS, Laboratoire Catalyse et Spectrochimie, Boulevard Maréchal Juin 6, 14000 Caen, France
dInstitute of Condensed Matter and Nanosciences (IMCN) – Molecular Chemistry, Materials and Catalysis (MOST) – Université Catholique de Louvain (UCLouvain), Place Louis Pasteur 1, box L4.01.09, 1348 Louvain-la-Neuve, Belgium. E-mail: eric.gaigneaux@uclouvain.be
eNational Institute of Materials Physics, Atomistilor 105b, 077125 Magurele-Ilfov, Romania
fFaculty of Applied Chemistry and Materials Science, University Politehnica of Bucharest, 1-7 Gh Polizu Street, Bucharest, 011061, Romania
gColorado School of Mines, Department of Chemistry, Golden, Colorado 80401, USA. E-mail: rrichard@mines.edu
hInstitute of Organic Chemistry “C. D. Nenitescu” of Romanian Academy, 202B Spl. Independentei, P.O. Box 35-108, Bucharest, Romania
iDepartment of Bioresources and Polymer Science, Advanced Polymer Materials Group, Faculty of Applied Chemistry and Materials Science, University Politehnica of Bucharest, 1-7 Gh Polizu Street, 011061, Bucharest, Romania. E-mail: marian.verziu@upb.ro
First published on 22nd November 2021
Abstract
Catalytic activity of TiO2, 2%Re–TiO2 and 10%Re–TiO2 in the conversion of carbohydrates into levulinic acid under autoclave conditions was evaluated. These materials were prepared by aerogel method, for the first time to the best of our knowledge, and characterized by XPS, SEM-EDX, DRIFTS, DR UV-vis, Raman, N2 adsorption/desorption isotherms, TGA and XRD. Further, the surface acidity was probed by NH3-TPD and pyridine-FT-IR where it was observed that increasing the amount of rhenium doped into TiO2 led to an increase in the total number of acid sites (Lewis + Brønsted) but with an overall lower strength. The presence of both Brønsted and Lewis acid sites led to the hypothesis that these materials may be well suited for conversion of carbohydrates into levulinic acid. Indeed a levulinic acid yield of 57% was reached over 10%Re–TiO2 for a low mass ratio catalyst to glucose (1![[thin space (1/6-em)]](https://www.rsc.org/images/entities/char_2009.gif) :
:![[thin space (1/6-em)]](https://www.rsc.org/images/entities/char_2009.gif) 5). Moreover, the 10%Re–TiO2 catalyst was reused in the conversion of glucose for four catalytic cycles without a significant loss of the catalytic activity.
5). Moreover, the 10%Re–TiO2 catalyst was reused in the conversion of glucose for four catalytic cycles without a significant loss of the catalytic activity.
Introduction
The growing exploitation of fossil resources as well as the consequent negative impact with the associated carbon footprint led to an increase of the research interest in the conversion of biomass into valuable chemicals.1 Among these value-added chemicals a significant amount of attention has been attracted by levulinic acid (LA)2–4 due to its carbonyl and carboxyl group which can react with other functional groups to form a wide range of chemicals.5 Moreover, levulinic acid is one of the first 12 compounds with the highest added-value obtainable from biomass selected by U.S. Department of Energy (DOE).6The production of levulinic acid can be carried out either by acid hydrolysis of furfuryl alcohol, as achieved by French organic synthesis and U.S. Fitch companies, or by the conversion of hexoses (glucose, fructose) within the temperature range of 140–225 °C.7,8
The first synthesis of levulinic acid was reported in 1840 by the Dutch professor Mulder and was the result of the acid hydrolysis of sucrose.9 The production of LA from cellulose involves several steps (Scheme 1): 1) Brønsted acid sites are mainly responsible for hydrolysis of cellulose to glucose; 2) isomerisation of glucose to fructose takes place over Lewis acid sites; 3) the dehydration of fructose to hydroxymethylfurfural (HMF) requires a combined action of Brønsted and Lewis acid sites; 4) the last step, the HMF rehydration to levulinic and formic acid is carried out over Brønsted acid sites.4,10,11 Although the isomerization of glucose to fructose is a function of Lewis acid concentration, formation of humic species is also facilitated by an increase of Lewis acidity.3 Therefore, the acidic properties of the catalyst play a key role in the selectivity to LA.
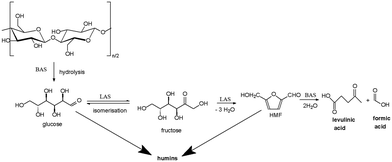 | ||
| Scheme 1 Conversion of cellulose to levulinic acid. LAS = Lewis acid sites; BAS = Brønsted acid sites. | ||
The dehydration of glucose to LA over MFI type zeolites with different SiO2/Al2O3 ratios, and consequently with different strengths of acidic sites, was investigated by Zeng et al. in subcritical water. While an increase in the amount of strong acid sites facilitated the catalytic conversion of glucose to levulinic acid, the large pores of the catalyst also promote other reactions which led to a decrease in the yield of LA.12
The influence of the Brønsted to Lewis ratio on catalytic processes was also studied by Weingarten et al. in the conversion of glucose into levulinic acid over solid metal(IV) phosphate with different ratios of phosphorus to metal(IV), where the Lewis acid centers are attributed to M4+, and Brønsted acid sites are represented by P(OH) groups. An increase in this ratio led to an increase in levulinic acid selectivity.3
The Lewis acidity of TiO2 combined with the Brønsted one of WO3 led to an increase in HMF yield from 8 to 58% obtained by dehydration of glucose.13 On the other hand, dehydration of glucose to HMF can also be influenced by the structure of TiO2, as anatase shows a higher catalytic activity compared to rutile.14 The catalytic activity of TiO2-based catalysts in the dehydration processes such as: glycerol,15,16 2-propanol,17n-butanol18 or bioethanol19 was also reported in the literature. Moreover, TiO2 is also one of the cheapest Lewis acidic metal oxides.
Recently, Bernardo et al. reported the catalytic performances of HReO4 in the synthesis of levulinic acid from different carbohydrate sources. A 100% yield of LA was obtained by the conversion of fructose at 140 °C for 1 h.20 On the other hand, the use of homogenous catalysts implies some disadvantages such as their difficult separation at the end of reaction as well as the catalyst recycling.21 As for titanium catalysts, dehydration of alcohols can also be carried out in the presence of rhenium based catalysts.22,23
In this work, we propose the preparation of nanoscale TiO2 doped with rhenium by a modified aerogel method in order to generate the Brønsted acid sites, for first time to the best of our knowledge, on the surface of titania whose presence is absolutely necessary in the production of levulinic acid. We also show that the concept of a synergistic effect between Lewis and Brønsted acid sites for boosting the conversion of glucose into levulinic acid can also be extended to titania doped with rhenium materials. The influence of the oxidation state of titanium and rhenium within Ti–Re–Ox active species over acid properties of rhenium doped titania materials was another aim of this study.
Experimental
Catalysts preparation
The preparation of TiO2, 2% Re–TiO2, and 10% Re–TiO2 catalysts followed a modified aerogel synthesis.24 The synthesis for the 10% Re–TiO2 sample, which can be tailored to the desired weight percent loading of rhenium is provided here.To start, 0.5 g of ReCl3 (Research Organic/Inorganic Chemical Corp) was dissolved in 25 mL of methanol. The resulting solution had a dark red color. Next, 5 mL of titanium(IV) tetraisopropoxide (Sigma Aldrich) was added to 30 mL of toluene (Fisher Chemical). The two separate solutions were added into a 100 mL beaker and allowed to stir for several minutes. Hydrolysis of the solution was completed with the addition of 3 mL of nanopure H2O quickly followed by 2 droplets of concentrated HCl (Sigma Aldrich). Gelation of the solution occurs over about 10 minutes. Once fully gelled, stirring was terminated and the resulting gel was allowed to sit for 4 hours.
The gel was then transferred to an autoclave for supercritical drying at 265 °C for 5 hours. At the end of this time, the system was vented and cooled, leaving behind a dark blue powder. This powder was collected in a ceramic crucible, placed into a muffle furnace, and calcined, in air, at 500 °C for one hour with a temperature ramp of 5 °C min−1. Post-calcination, the powdered sample maintained a dark color and fluffy consistency.
To synthesize the TiO2 reference, the above procedure was followed as written, but without any addition of rhenium precursor. All starting materials used were of analytical grade.
The real weight percents of rhenium from Re–TiO2 materials were obtained by inductively coupled plasma – optical emission spectrometry (ICP-OES, Perkin Elmer Optima 8300) (Table 1).
| Material labeled | Re loading (% wt) |
|---|---|
| TiO2 | 0 |
| 2% Re–TiO2 | 1.9 |
| 10% Re–TiO2 | 9.9 |
Catalyst characterization
The UV-vis diffuse reflectance spectra were recorded, under ambient conditions, on a JASCO V570 spectrophotometer. As reference, a certified reflectance standard, Spectralon, was used and the measurements were carried out in the 190–1500 nm range.Textural characteristics of the as prepared materials were determined using N2 adsorption/desorption isotherms at −196 °C acquired with a Micromeritics Tristar equipment. Samples were degassed overnight under primary vacuum at 150 °C prior to measurements.
The structural characterization was carried out using a Bruker D8 Advance diffractometer equipped with a Linxeye XE-T detector. Each diffractogram was recorded in the 5–80° (2 theta) range using 0.015° as increment step and 0.15 s as integration time. EVA software (Bruker) was used for data treatment. Crystallography open database (COD) was used for phases identification.25,26 For determination of crystallite sizes the Debye–Scherrer equation was used (1):
 | (1) |
D = is the average crystallite size, λ represents the X-ray source wavelength (1.5418 Å), β is full width half maximum of the diffracted peaks, θ is the diffraction angle and k is Scherrer constant (0.9 for spherical particles).
Surface morphology of undoped or doped TiO2 was performed by scanning electron microscopy (SEM) analysis coupled with energy dispersive X-ray spectrometry (EDXS). The analysis was performed using a Quanta Inspect F50 SEM device (Hitachi, Berkshire, United Kingdom), equipped with a field emission gun (FEG) with 1.2 nm resolution and coupled with an EDAX spectrometer with 133 eV resolution at Mn K.
Raman analysis was carried out using a Renishaw inVia confocal Raman microscope system. The excitation laser wavelength was 473 nm. The Raman spectra were acquired in the extended spectral region from 100 to 3200 cm−1. Raman studies were carried out under ambient conditions and the region analyzed was from 100 to 1500 cm−1.
Temperature-programmed desorption (TPD) of ammonia was used to evaluate the total acidity of our materials. Hiden Catlab reactor combined with a QGA Hiden quadrupole mass spectrometer was used to perform the experiments. Samples were pretreated under argon (30 mL min−1, 5.0 Air Liquide) at 200 °C during 2 hours. NH3 adsorption was performed at 60 °C during 1 hour by flowing a mixture of Ar (20 mL min−1) and 5% NH3 in He (10 mL min−1). The catalyst was then flushed in Ar (30 ml min−1) during 2 hours and then the NH3 desorption measurement is performed under Ar (30 ml min−1) from 60 to 600 °C (heating rate of 10 °C min−1).
The nature of acid sites (Lewis/Brønsted) on the materials surfaces was determined by in situ FT-IR spectroscopy upon pyridine adsorption, on a Nicolet Nexus FT-IR spectrometer equipped with a KBr beam splitter and a mercury cadmium telluride (MCT) cryo-detector. Samples were pressed into a self-supported disc (2 cm2 area, 10 mg cm−2). The resulting pellets were placed into a homemade IR cell which was equipped with KBr windows and connected to a vacuum line. The latter line served for evacuation steps and for introduction of small doses of pyridine vapor. Thanks to a movable sample holder, the pellets were set alternatively into the IR beam for spectra acquisition at room temperature and into a furnace at the top of the cell for thermal treatments. Before analysis, the samples were first pre-treated overnight under vacuum (10−6 Torr) at 120 °C. Then, they were exposed to 1 Torr of pyridine (non-deuterated h5-one, 99+% grade from Aldrich) at room temperature for 1 hour. FT-IR spectra were measured in situ from 650 to 4000 cm−1 (128 scans, 4 cm−1 resolution) throughout the experiment, and treated with the Thermo Scientific OMNIC software.
Other Fourier transform infrared spectroscopy measurements (FT-IR) were performed using a Varian 3100 Excalibur spectrometer equipped with DRIFT accessory. The IR spectrum was collected in the region 4000–500 cm−1 at a resolution of 2 cm−1. The spectrum was analyzed with the program analyzer IR—KnowItAll.
Thermal measurements were performed on a Netzsch simultaneous thermal analyzer 449 F1 Jupiter under dynamic air atmosphere (30 mL min−1) with a heating rate of 10 °C min−1 from room temperature to 1000 °C by using alumina crucibles covered with center-pierced alumina lids.
X-ray photoelectron spectroscopy (XPS) spectra were obtained in an AXIS Ultra DLD (Kratos surface analysis) setup using Al Kα1 (1486.74 eV) radiation produced by a monochromatized X-ray source at an operating power of 300 W (15 kV × 20 mA). The base pressure in the analysis chamber was at least 1.0 × 10⁻⁹ mbar. Sample neutralization was achieved using a flood gun. The detail spectra were taken at 20 eV pass energy. Binding energies were referenced to the C1s peak standard value of 284.6 eV. The spectra were fitted using Voigt profiles, according to the procedure described in ref. 27.
The contents of rhenium and titanium were determined by ICP-OES (Optima 8300 Perkin Elmer) after calibrating the instrument with standard solutions.
Due to presence of humin on the surface of Re doped TiO2 after catalytic process, the catalysts tested were calcined at 500 °C in order to clean their surface before XPS, Raman and SEM analysis.
Catalytic tests
The conversion of glucose or cellulose into levulinic acid under autoclave conditions was carried out as follows: to a solution of 0.16 g of glucose or a slurry of 0.16 g of microcrystalline cellulose powder (Avicel, Merck) in 10 mL water was added 0.016 g or 0.048 g of catalyst, respectively. The reactor was closed and heated up to 180 °C or 210 °C, respectively, for 24 h under vigorous stirring. The separation of catalyst from the liquid after reaction was carried out by centrifugation.For recycling tests, the recovered catalyst was washed with distilled water and tested in the same conditions aforementioned.
Following the reaction, the water-soluble compounds were silylated (100 μL pyridine, 100 μL BSTFA (N,O-bis(trimethylsilyl) trifluoroacetamide) and TMCS (trimethylchlorosilane)) and analyzed by GC-MS chromatography (SATURN 2100 – Varian, equipped with a HP-5MS inert column (30 mm × 0.25 mm ID × 0.25 μm film, the carrier gas used is helium with a flow of 1 mL min−1, the injector was operated at 250 °C and the oven temperature was programmed as follows: 50 °C for 2 min, then gradually increased to 280 °C at 5 °C min−1.
The catalytic impact of leaching on the conversion of glucose into levulinic acid was evaluated as follows: 0.032 g (2% Re–TiO2) was boiled in 5 mL water, at 180 °C, for 24 h, under stirring. In the liquid phase, after the remaining catalyst was separated by centrifugation, 0.16 g glucose was added and kept at 180 °C for 24 h, under stirring.
The equations used to calculate the conversion and yields are:
 | (2) |
 | (3) |
m i = initial mass of glucose (cellulose)
m f = final mass of glucose (cellulose) after reaction
Results and discussion
Catalysts characterization
The insertion of rhenium into TiO2 structure was accompanied by a significant decrease of specific surface area while the pores size showed only minor modification (Table 2). The decrease in specific area resulting from the insertion of rhenium could be due to the higher atomic weight of rhenium compared to that of titanium as well as a possible increase in the degree of aggregation of particles as a result of doping process.| Catalyst | Specific surface area (m2 g−1) | Pore size (nm) |
|---|---|---|
| TiO2 | 86 | 24 |
| 2% Re–TiO2 | 84 | 26 |
| 10% Re–TiO2 | 67 | 22 |
The presence of mesopores28 of undoped TiO2, highlighted by the hysteresis loop formed by N2 adsorption/desorption isotherms, was preserved even after insertion of rhenium species into TiO2 (ESI,† Fig. S1).
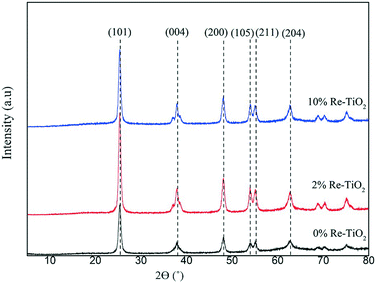
The XRD patterns of the prepared catalysts are presented in Fig. 1. TiO2 showed XRD diffraction lines at 2θ = 25.4°, 37.8°, 48.5°, 54°, 55.4° and 62.9° characteristic of the (101), (004), (200), (105), (211) and (204) planes of the pure anatase phase of TiO2, respectively.29 The highlighting of the anatase structure was very important due to its higher catalytic performance compared with rutile structure in the hydrolysis process.14
The non-occurrence of any phase segregation of the two oxides (TiO2 and ReOx) was highlighted by the absence of diffraction lines characteristic for rhenium oxides even for 10 wt% of Re suggesting the substitution of Ti4+ by rhenium ions. Re–O–Ti bonds will indeed be confirmed in the following. This is interesting because diffraction lines of ReOx were very well noticed for Re impregnated on α-Fe2O3 or SiO2 systems at comparable loadings (10 or 13 wt%) as ours, and for which the presence of Re single oxide was a drawback.30,31
The substitution of Ti4+ with rhenium species should lead to modifications of lattice parameters all more so as rhenium and titanium showed many oxidation states as was highlighted in the XPS spectra (vide infra), which influence the value of the ionic radius. Taking into account that TiO2 crystallizes in the tetragonal system (a = b ≠ c), we calculated these lattice parameters, using the eqn (4) for (200) and (004) planes and the data were presented in Table 3:
 | (4) |
| Catalyst | Lattice parameters (Å) | Crystallite size (nm) | ||
|---|---|---|---|---|
| a = b | c | Unit cell volume (Å3) | ||
| TiO2 | 3.7822 | 9.4928 | 135.79 | 12.48 |
| 2% Re–TiO2 | 3.7825 | 9.4869 | 135.73 | 13.30 |
| 10% Re–TiO2 | 3.7838 | 9.4835 | 135.77 | 13.43 |
h, k, l: Miller's indexes
d: interplanar distance
As it is well known, besides the oxidation state of the metal, its coordination can influence the value of ionic radius and, on the surface of titania there can be both octahedral Ti4+ (ionic radius of Ti4+ is 0.6 Å)32 and tetrahedral Ti4+ (ionic radius of Ti4+ is 0.42 Å).32 Therefore the both types of Ti4+ could be substituted by rhenium species.
The ionic radius of Re4+ (0.63 Å) is close to the ionic radius of octahedral Ti4+ (0.6 Å) and a change of the cell parameters would not have to be highlighted along the substitution. However, for 2%Re–TiO2 and for 10%Re–TiO2 especially, an increase of the lattice parameter a as well as a decrease of parameter c were noticed. This phenomenon took place because the ionic radius of tetrahedral Re7+ (0.38 Å),32 whose presence is highlighted in XPS spectra (vide infra), is smaller than that for octahedral or tetrahedral Ti4+ which led to a lattice compression along the c axis.33 Moreover, taking into account that the ionic radius decreases with increasing of oxidation state of the rhenium species, we suppose that the lack of segregation phases with increasing the amount of rhenium inserted into TiO2 structure is due to the high rhenium concentration in high oxidation state as highlighted in XPS spectra (vide infra).
The SEM images were collected to understand the surface morphology as well as to know the particle sizes. As shown in Fig. S2a–c† after insertion of rhenium species into TiO2 structure the uniform spherical-shaped particles was kept and the modifications of particles size were not significant, the average diameter of particles remaining in all materials below 20 nm. Moreover, the particles morphology of the nano-catalysts was, mainly, kept even after catalytic process (Fig. S2c and d†).
The investigation of the elemental distribution of rhenium doped titania by SEM-EDX mapping also highlighted the presence of surface titania (Fig. S3†). In order to highlight the presence of the nanoparticles as well as obtaining the information about the morphology and size of the particles for undoped and doped TiO2 involved an enlargement of the image up to 400![[thin space (1/6-em)]](https://www.rsc.org/images/entities/char_2009.gif) 000 times was made (Fig. S2†). On the other hand, the blurred SEM images (Fig. S2†) as result of their enlargement made very difficult to achieve the elemental EDX mapping and establish the distribution of rhenium species on the nanoparticle surface.
000 times was made (Fig. S2†). On the other hand, the blurred SEM images (Fig. S2†) as result of their enlargement made very difficult to achieve the elemental EDX mapping and establish the distribution of rhenium species on the nanoparticle surface.
DRIFT spectra of both undoped and Re-doped TiO2 products display common features (Fig. 2) mainly originating from solvent and organic precursors fragments adsorbed or chemically fixed on the particles surface. The very large and asymmetric band spanning the 3700–2500 cm−1 wavenumber interval and the narrower band at around 1630 cm−1 can arguably be assigned to antisymmetric and symmetric O–H stretching (belonging to water and metal-bound hydroxide) and H–O–H bending, respectively. A sharp partially covered band can be noticed at about 3680 cm−1 for both unaltered and 2% Re–TiO2 catalysts; it could be related to the existence of Ti–OH groups hydrogen bonded to HOH molecules. Regarding the 10% Re–TiO2 spectrum, only a shoulder can be distinguished at this position.34 Most of the bands within the 1600–400 cm−1 region arise from bond vibrations within the remaining isopropoxide residues as follows: asymmetric C–H deformation at around 1480 cm−1, symmetric C–H bending at approximatively 1345 cm−1, CH2 wagging at about 1285 cm−1.35 It is worth noting that the above-mentioned bands are relatively less intense in the case of 10% Re–TiO2 sample. Moreover, the large band with a maximum at 925 cm−1 in 0% Re- and 2% Re–TiO2 spectra can be assigned to overlapped C–O and Ti–O stretching vibrations. In the case of 10% Re–TiO2 it shows a much reduced intensity that allows us to observe another signal at 805 cm−1 stemming from a combination of C–C–C and Ti–O stretches.36 These observations indicate that the organic content of 10% Re–TiO2 should be significantly lower in comparison with the other samples. In addition, in the 10% Re–TiO2 spectrum, a shoulder can be distinguished at a higher wavenumber value (around 1020 cm−1) onto the band at 925 cm−1 which can be related to the Re![[double bond, length as m-dash]](https://www.rsc.org/images/entities/char_e001.gif) O stretching vibrations.37 Additionally, some small baseline humps can be observed in the overtone region at approximately 2000 cm−1 for 10% Re–TiO2, which can also be associated with the occurrence of rhenium oxide species.38
O stretching vibrations.37 Additionally, some small baseline humps can be observed in the overtone region at approximately 2000 cm−1 for 10% Re–TiO2, which can also be associated with the occurrence of rhenium oxide species.38
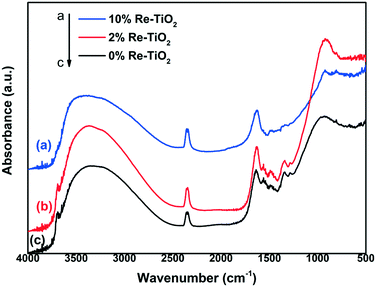 | ||
| Fig. 2 DRIFT spectra of the three investigated materials: a) 10% Re–TiO2; b) 2%Re–TiO2 and c) 0%Re–TiO2 | ||
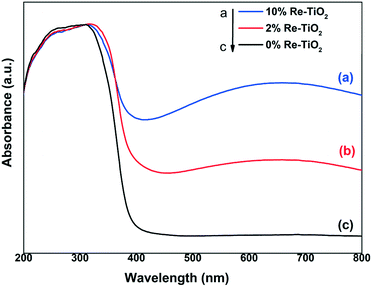
The electronic spectrum of the undoped TiO2 is dominated by an asymmetric band spanning the entire UV domain (Fig. 3), which shows a well defined shoulder at 270 nm and a maximum at around 310 nm. These features can be assigned to ligand to metal charge transfer (LMCT), namely from the π orbitals of O2− to the empty 2eg (higher energy) and 2t2g (lower energy) orbitals of octahedral Ti4+, respectively.39 As no d electrons are present, the visible region of the pure TiO2 spectrum is devoid of any absorption bands. By introducing rhenium as dopant, the initial white color of TiO2 turns grey-purple, with a light hue for 2% rhenium and a darker one for 10% rhenium.
Two major modifications occur in the UV-vis spectra of the resulting materials. First, a highly broad band with a maximum roughly at 660 nm appears in the visible region, whose intensity increases with increasing rhenium content. This band originates mainly from the d-d transition (from 2t2g to 2eg) of newly formed Ti3+ (d1) ions (Oh symmetry).40 Secondly, the widening of the highly intense band from UV into visible (towards 450 nm) while preserving its maximum and shoulder positions is most probably due to the emergence of a Ti3+ originating charge transfer transition40 that takes place at lower energy than that involving Ti4+ which it strongly overlaps with.
Out of the rhenium species identified in the XPS spectra (vide infra), only Re(III), Re(IV), and Re(VI) (in Oh high spin geometry as appropriate for O2− ligands) display d–d transitions and, for their representative complexes, the maxima of these bands are located at approximatively 670 nm,41 400 nm (ref. 42) and 540 nm (ref. 42) respectively. However, any rhenium absorption bands beyond 450 nm are most probably enveloped in the Ti3+ wide and relatively intense d–d transition band. On the other hand, the absorption band stemming from the corresponding Re(IV) d–d transition is most likely masked by the low-energy edge of the charge transfer bands. As for Re(VII) (d0) tetrahedral species, their LMCT bands occur at high energy in UV and, therefore, are also covered by the TiO2 bands.43,44
The insertion of rhenium into TiO2 structure generated additional energy levels in the band gap of TiO2 which led to a decrease of band gap energy from 3.1 to 2.4 eV (Fig. S4†). The narrowing of band gap can be due to both Ti3+ formation and presence of rhenium species in high oxidation state.45,46
For 2%Re–TiO2, XPS Re 4f and Ti 2p spectra were deconvoluted (Fig. 4). For Ti 2p spectra, the one component at lower binding energy (BE) (456.2 eV) is attributed to Ti3+ (ref. 47) while the other one at 458.6 eV is attributed to Ti4+ in TiO2.48 It is well known that both the oxidation state and the environment (surrounding the atom) influence the BE of the same atom. The peak fitting for Re 4f revealed that there are three oxidation states present in the sample: Re3+ (42.1 eV)49 Re4+ (43.4 eV)50 and Re7+ (45.9 eV).50 The undoped TiO2 has also shown the presence of Ti3+ highlighted by the peak at 457.3 eV (Fig. 4) but the insertion of rhenium species into TiO2 led to an increase of this peak intensity (Fig. 4).
For 10%Re–TiO2, the Ti 2p XPS spectrum has been decomposed into two Gaussian peaks marked as Ti3+ (457.3 eV)51 and Ti4+ in TiO2 (458.7 eV)49 in Fig. 4. For Re 4f, which is decomposed using three Gaussian curves, the component at 42.5 eV may represent Re3+,49 the 44.3 eV = Re6+,49 and 45.5 eV = Re7+.50 The increase of the rhenium percentage into TiO2 structure led also to an increase of intensity of the peaks for Ti3+ compared with 2%Re–TiO2 and TiO2.
Recently, H. Khan and I. K. Swati45 have analyzed by XPS the formation of Ti3+ species as a result of the insertion of Fe3+ into TiO2 structure but with a very high Ti4+/Ti3+ ratio. It is noteworthy in our study that an increase in doping of TiO2 with rhenium up to 10% led to an increase of the intensity of the Ti3+ peak highlighted by a decrease of Ti4+/Ti3+ ratio from 22.4 (for TiO2) to 0.6 (for 10%Re–TiO2). On the other hand, the increase of rhenium amount inserted into titania was accompanied by an increase Re7+/Re4+ ratio from 0.29 (for 2%Re–TiO2) to 2.77(for 10%Re–TiO2). Therefore, there is a close correlation between the formation of Ti3+ and the high oxidation state of rhenium species. This is interesting as the low stability of Ti3+ in air is well known. Thus, the high stability of Ti3+ into TiO2 structure could be due to a partial charge transfer from rhenium to titanium through Re–O–Ti bond. Another interesting thing was noticed for the binding energy of O 1s level. The peak of O 1s for TiO2; 2% Re–TiO2 and 10% Re–TiO2 can be deconvoluted into three components (Fig. S5†). Whereas the two peaks located at around 529.9 eV and 531.9 eV are common for all the three materials and correspond to the lattice oxygen atoms (Ti–O bond) and surface adsorbed OH groups, respectively52 the insertion of rhenium into titania generates a new component located at around 528 eV, whose intensity increases when the amount of rhenium inserted is augmented (Fig. S5†). The formation of this new component is quite abnormal all more so with the binding energy of Re–O in Re2O7 is around 532 eV.53 Referring to the literature, this component could highlight the formation of Re–O–Ti because the oxygen may attract electron both from Ti and Re.54 Moreover the unique strong metal support interaction (SMSI) property of TiO2 with transition metals55 is well known. Therefore, these changes such as the increase of oxidation state of rhenium corroborated with reduction at Ti3+ are due to the formation of Re–Ti–Ox structural units as results of the strong redox interactions of Re and Ti.
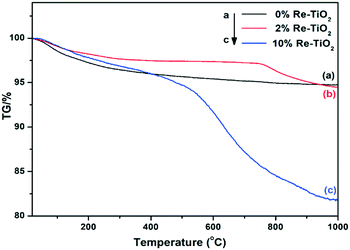
Thermal analyses (simultaneously recorded TG and DSC curves) of all the three materials were investigated from room temperature up to 1000 °C under dynamic air atmosphere. The first mass loss of the rhenium-free TiO2 material (Fig. 5) spans in the 25–142 °C temperature interval with a mass change of 2% and corresponds to both physically adsorbed and chemisorbed water molecules.56 The second step between 142 and 300 °C with a decrease in mass of 1.5%, might be assigned to both the weakly bound OH groups57 and the combustion of the spectroscopically identified organic residues.
The remaining segment of the TG curve presents a slight drift up to around 650 °C (a weight loss of 1%) which can be assigned to the strongly bounded OH groups55 followed by a stable plateau. The DSC events associated to these steps in the TG curve (Fig. S6†) are rather poorly resolved except for a remarkably large endothermic effect occurring in the 380–760 °C range which corresponds to the anatase to rutile phase transition.58 Up to about 340 °C, the TG curves of 2%Re- and 10%Re–TiO2 catalysts closely resemble that of the undoped TiO2.
In this temperature window the two steps have slightly different limits but globally indicate a lower mass loss with respect to the rhenium-free TiO2, i.e. 1% (27–161 °C) and 1% (161–333 °C) for 2%Re–TiO2 and 2% (25–189 °C) and 1% (189–339 °C) for 10%Re–TiO2. Starting from 340 °C, the difference between the two rhenium-based materials becomes salient. The TG curve of 2%Re–TiO2 is practically constant up to 726 °C (the corresponding drift represents only 0.4%) whereupon it starts to decrease abruptly to 1000 °C in at least two strongly overlapped steps (Δm = 1.1 and 1.5% within the 726–816 and 816–1000 °C intervals, respectively – see also DTG curve in Fig. S7†) which corresponds to the loss of existing Ren+ species as Re2O7.59 For the 10%Re–TiO2, there is a significant drift of TG curve (Δm = 1.3%) within the 339–471 °C range followed by two overlapped steps: a strong one up to 762 °C (Δm = 9.8%) and a less steep one around 1000 °C (Δm = 3.5%). These weight losses can be also related to the loss of the Ren+ ions as volatile Re2O7 in the oxygen-rich atmosphere. The difference in the thermal stability of the two Re-containing catalysts can be partly explained by the different nature and relative content of Ren+ species hosted by the TiO2 lattice. Moreover, the occurrence of quite a similar step at higher temperature (above 760 °C) for both Re-based materials might indicate the existence of a common Ren+–O–Ti4+ based structure, most probably as these species are reportedly stable over 700 °C (ref. 59) and Re7+ is present in both Re-containing samples as indicated by XPS.
The high volatility of bulk rhenium oxides species, well known, could be reduced by the interaction of the ReOx structure with a support.60 Y. Yuan and Y. Iwasawa suggested that the formation of Re–O–Fe bonds led to the stabilization of Re species.31 The high stability of our materials represented by the stability of oxidized rhenium species over 700 °C could be due to the formation of Ren+–O–Ti4+ bond. Regarding the associated DSC signals, it is worth highlighting that the endothermic event of the undoped TiO2 phase transition is no longer observable likely as a result of both structural changes induced by Ti3+ and Ren+ species into TiO2 network and the exothermic events related to Re2O7 formation (Fig. S7 and S8†). Blocking the transition from anatase to rutile as a result of the rhenium presence into TiO2 anatase structure is in agreement with the literature showing that doping of TiO2 with large cations with high valence (>4) led to a higher anatase phase stability.61
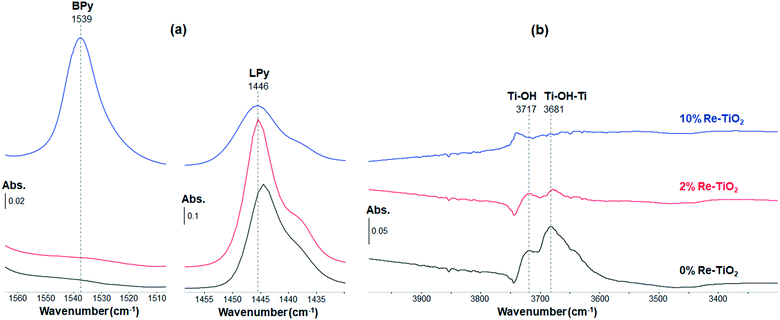
The stretches of M–N (metal–nitrogen) and N–H (pyridinium ion) bonds lead to IR absorption bands in the spectral region from 1400 to 1600 cm−1.13 Thus, the interaction of pyridine with the materials studied herein led to the identification of Lewis and Brønsted acid sites due to characteristic IR bands at about 1450 cm−1 and 1540 cm−1, respectively.62 According to the in situ FT-IR spectra shown on Fig. 6, TiO2 possesses Lewis acid sites (Fig. 6a).63 Its surface OH groups (Fig. 6b) are not strong enough to protonate pyridine (absence of a band at 1540 cm−1 on Fig. 6a). From Fig. 6a, increasing the wt% of Re induces a modification of the ratio between the number of Brønsted acid sites and that of Lewis acid sites from 0 (for TiO2 and 2%Re–TiO2) to 1.36 (for 10%Re–TiO2).
The characterization of doped and undoped TiO2 by in situ pyridine-FT-IR under dehydrated conditions (Fig. 6) suggested that an increase of the amount of rhenium inserted into TiO2 structure up to 10 wt% by aerogel method, leading to an increase of Re(VI) and Re (VII) concentration (Fig. 4), was accompanied by the formation of a new type of acid sites, namely Brønsted, on the surface of TiO2 (Fig. 6a). This is possibly due to the presence of rhenium in high oxidation state (VI and VII) into TiO2 structure which can attract hydroxyl ions to the surface in line with the neutralization of the excess charge resulting from the substitution of Ti4+ ions.64 These hydroxyl ions become Brønsted acid sites as highlighted by the band at 1539 cm−1 (Fig. 6a). Therefore, on the surface of 10%Re–TiO2, there could be both weak Re(VI, VII)–OH and stronger bridging Re(VI, VII)–(OH)–Ti Brønsted acid sites.65 This is even more interesting as TiO2-supported rhenium catalysts, prepared by incipient wetness impregnation, are reported to possess only Lewis acid sites.66 On the other hand, the low Re7+/Re4+ ratio (0.29), highlighted by XPS analysis, justifies the lack of Brønsted acid sites for 2%Re–TiO2. Therefore, the presence of only Lewis acid sites on the surface of 2%Re–TiO2 is due to the low oxidation state of rhenium (Re(IV)) and to the fact that the substitution of Ti4+ with Re4+ did not lead to modifications which could generate Brønsted acid sites such as an imbalance of charge as in the case of 10%Re–TiO2.
The insertion of rhenium into titania structure up to 10 wt% led to some modifications in the spectral region from 3800 to 3600 cm−1 such as the drastic decrease of intensities associated with bridging hydroxyl groups Ti–(OH)–Ti (3681, 3645 cm−1) and hydroxyl isolated Ti–OH (3717 cm−1) band67 accompanied by the appearance of a new band at 3739 cm−1 (Fig. 6b) which could be assigned to 6Ti3+–OH,68 or to Re6+–OH, Re7+–OH bonds. However, the total desorption of pyridine from the Brønsted acid sites at 200 °C (Fig. S9†) suggests a relatively weak strength of the Brønsted acidity. Re6+–OH, Re7+–OH could be the main Brønsted acid sites of 10%Re–TiO2.
The low oxidation state of rhenium species (Re(IV)) from 2%Re–TiO2, highlighted by XPS analysis (Fig. 4), did not lead to a decrease of the electron density in the –OH group of the Re–OH bond as marked as for 10%Re–TiO2, which limited the interaction with pyridine molecule in order to the identification of Brønsted acid sites.
The shift of the band assigned to Lewis acid sites to higher or lower wavenumber69 is due to the nature of the metal ion present on the surface of TiO2. Thus, we inferred that the shift from 1443 cm−1 to 1446 cm−1 along with the rhenium introduction into the TiO2 structure could be due to the coordinatively unsaturated rhenium cations. Also worth mentioning is the presence of the shoulder at lower wavenumber (1437 cm−1), which could be attributed to the presence of coordinately unsaturated cations with a lower Lewis acidity and namely of Ti3+.70
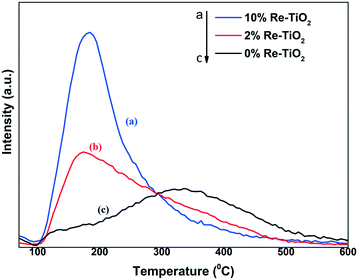
The NH3-TPD measurements of TiO2 and Re–TiO2 materials show the presence of acidic sites with varying strengths. The desorption peak of TiO2 around 350 °C corresponds to a high concentration of acidic sites with medium strength. On the other hand, the broad distribution of desorption from 100 °C to 600 °C showed also the presence of acidic sites with weak (100–200 °C), medium (200–400 °C) and strong (>400 °C) strengths. By the insertion of rhenium into TiO2 an increase of density and acid sites concentration was observed (Table 4) but with a weaker strength compared with undoped TiO2 (Fig. 7). Taking into account the strong Lewis acidity of Ti(IV),71 the decrease of acidity strength for Re–TiO2 materials is a consequence of the moderate Lewis acidity of rhenium ions72 as well as of the generation of Ti3+ by the insertion of rhenium into titania. Moreover, the ionic radii of Re7+ and of tetrahedral Ti4+, namely the Lewis acid sites, being close, the decrease of titania acidity is also due to substitution tetrahedral Ti4+ ions by Re(VII).
| Catalyst | Total amount of acid sites (μmol g−1) | Acid sites density (μmol m−2) |
|---|---|---|
| TiO2 | 100 | 1.16 |
| 2% Re–TiO2 | 150 | 1.78 |
| 10% Re–TiO2 | 220 | 3.28 |
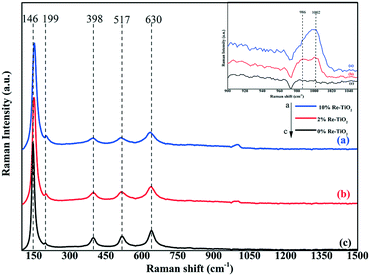
One of the most suited techniques in the characterization of metal oxide catalyst is Raman spectroscopy. Fig. 8 shows the Raman spectra for the TiO2 and Re–TiO2 catalysts with different Re loadings. According to literature the TiO2-anatase structure shows Raman bands below 700 cm−1 precisely at 146 cm−1, 199 cm−1, 398 cm−1, 517 cm−1 and 630 cm−1.73
Investigation by Raman spectroscopy under ambient conditions of rhenium oxide on various oxide supports such as Re2O7/TiO2 highlighted only the presence of isolated hydrated ReO4 species as understood from Raman bands at 970 and ≈920 cm−1.65 Although our Re–TiO2 materials were exposed to air, besides the presence of the bands at ≈980 cm−1 due to hydrated rhenium oxide species, a band at ≈1000 cm−1 was noticed, being assigned to the symmetric stretching mode of ReOx species which involve three terminal Re![[double bond, length as m-dash]](https://www.rsc.org/images/entities/char_e001.gif) O bonds and one bridging Re–O–Ti.65 As it is known all rhenium ions prefer octahedral coordination, except Re(VII) which may also exhibit the tetrahedral one.74 The band at ≈1000 cm−1 could be assigned to Re(VII) tetrahedrally coordinated from Re–O–Ti bond and terminal Re
O bonds and one bridging Re–O–Ti.65 As it is known all rhenium ions prefer octahedral coordination, except Re(VII) which may also exhibit the tetrahedral one.74 The band at ≈1000 cm−1 could be assigned to Re(VII) tetrahedrally coordinated from Re–O–Ti bond and terminal Re![[double bond, length as m-dash]](https://www.rsc.org/images/entities/char_e001.gif) O bond.65 Moreover, an increase in doping TiO2 with rhenium up to 10% was accompanied by a decrease of the band intensity at ≈980 cm−1 and an increase of the band at ≈1000 cm−1 due to the increase of Re
O bond.65 Moreover, an increase in doping TiO2 with rhenium up to 10% was accompanied by a decrease of the band intensity at ≈980 cm−1 and an increase of the band at ≈1000 cm−1 due to the increase of Re![[double bond, length as m-dash]](https://www.rsc.org/images/entities/char_e001.gif) O and Re–O–Ti bonds concentration which is in accord with the increase of the signal for Re(VII) from XPS spectra.
O and Re–O–Ti bonds concentration which is in accord with the increase of the signal for Re(VII) from XPS spectra.
The Re–O–Re linkage shows Raman bands between 150–200 cm−1,65 a slight shift of the band from 146 cm−1 to higher wavenumber as well as its slight widening for Re-doped TiO2 due to formation of Re–O–Re bonds was also observed. Moreover, all peaks became slightly wide after rhenium doping as a result of the formation of new Re–O–Ti bonds due to the rhenium incorporation into TiO2 host lattice. Therefore, compared with impregnation method, the insertion of rhenium into TiO2 anatase structure by aerogel method led to formation of Re–O–Re and Re–O–Ti bonds whose strength is not affected under ambient conditions.
Based on the information obtained from XPS, TG-DSC, SEM-EDX, pyridine-FT-IR and Raman analyses regarding the formation of new Lewis and Brønsted acid sites as a result of the insertion of rhenium into titania, we propose the following structure of the active sites (Scheme 2).
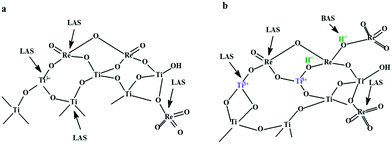 | ||
| Scheme 2 The proposed structure of the active sites for a) 2%Re–TiO2 and b) 10%Re–TiO2. BAS: Brønsted acid sites; LAS: Lewis acid sites. | ||
Catalytic performances
The conversion of carbohydrates with satisfactory yields of levulinic acid over heterogeneous catalysts requires high temperature, long reaction time or high catalyst to carbohydrate mass ratio from 1![[thin space (1/6-em)]](https://www.rsc.org/images/entities/char_2009.gif) :
:![[thin space (1/6-em)]](https://www.rsc.org/images/entities/char_2009.gif) 2 to 2.2
2 to 2.2![[thin space (1/6-em)]](https://www.rsc.org/images/entities/char_2009.gif) :
:![[thin space (1/6-em)]](https://www.rsc.org/images/entities/char_2009.gif) 1.4,75,76 Thus, a ZSM-5 to glucose mass ratio of 1
1.4,75,76 Thus, a ZSM-5 to glucose mass ratio of 1![[thin space (1/6-em)]](https://www.rsc.org/images/entities/char_2009.gif) :
:![[thin space (1/6-em)]](https://www.rsc.org/images/entities/char_2009.gif) 2 allowed at 180 °C in 8 h the production of levulinic acid yields up to 15%.75
2 allowed at 180 °C in 8 h the production of levulinic acid yields up to 15%.75
Taking into account that pure TiO2 shows low catalytic activity in the hydrolysis of carbohydrates to platform molecules,14 we showed, in this study, that the modification of the nature of acid surface sites due to the insertion of rhenium into TiO2 structure led to an improvement of its catalytic performance in the conversion of glucose to levulinic acid even for low catalyst to carbohydrates mass ratio (Fig. 9).
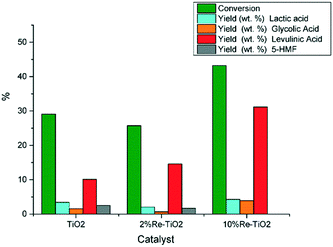 | ||
| Fig. 9 Conversion of glucose under autoclave conditions (0.16 g glucose; 0.032 g catalyst, 10 mL water, 180 °C). | ||
As shown on Fig. 9 the conversion of glucose over 10%Re–TiO2 led to higher yield of levulinic acid compared with that obtained over 2%Re–TiO2 or TiO2, as consequence of the synergistic effect between Brønsted and Lewis acid sites on the surface of 10%Re–TiO2. Furthermore, the excess of Lewis acidity could lead to the conversion of glucose into humins,4 and to decrease levulinic acid yield consequently,77 in agreement with the results obtained in this study over 2%Re–TiO2 or TiO2 compared to those obtained over 10%Re–TiO2 (Fig. 9). Moreover, the production of 5-HMF from carbohydrates, whose formation plays an essential role in the synthesis process of levulinic acid, can be the result both of the presence of Lewis acid sites and of an autocatalysis process involving formic acid, the byproduct (Scheme 1).78 On the other hand, the lack of Brønsted acid sites on the surface of TiO2 or 2%Re–TiO2 (Fig. 6a) would not justify the observed formation of levulinic acid (Fig. 9). However its presence, highlighted by GC-MS analysis, could be due to the conversion of some Lewis acid sites into Brønsted acid sites as a result of the exposure to air of these materials, leading to the formation of bonds between the oxygen of the water and metal ions (Lewis acid sites)79 as well as of the generation of the Brønsted acidity under subcritical water conditions.
The higher yield in levulinic acid over 2%Re–TiO2 compared to that of TiO2 is due to the formation of a higher Brønsted acid sites (Re4+–OH and/or Ti4+–OH) concentration as a result, probably, of the interaction between water and Lewis acid sites (rhenium and titanium ions) which are in higher concentration than for TiO2, as shown by NH3-TPD analysis (Table 4). The strength of these Brønsted acid sites is a weak one all more so the pretreatment of the catalysts under vacuum conditions at 120 °C before the pyridine-FT-IR analysis did not allow their identification. On the other hand, hot water enhances Re oxidation and leaching, with the formation of HReO4.80 Rhenium leaching, highlighted by ICP-OES analysis, was more pronounced for 10% Re–TiO2 (≈70 ppm) compared to 2%Re–TiO2 (≈17 ppm) due to higher amount of rhenium species on the surface of titania while leaching of titanium was smaller than 0.1 ppm irrespective of the catalyst tested. These results were not surprising since it is well known solubility of Re2O7 in water. Furthermore, the leached rhenium, used as “homogeneous catalyst”, did not become selective in the conversion of glucose into levulinic acid.
The catalytic performances of 2% Re–TiO2 were also influenced by the amount of tested catalyst thus, an increase to 0.048 g of catalyst led to an increase both of the glucose conversion and of the yield in levulinic acid (Fig. 10).
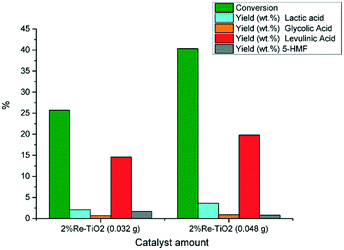 | ||
| Fig. 10 Conversion of glucose under autoclave conditions (0.16 g glucose; 0.032 g or 0.048 g catalyst, 10 mL water, 180 °C). | ||
In principle, the rehydration of 5-HMF, which is unstable in water, could lead to formic acid in equal molar ratio with levulinic acid. Further, formic acid tends to decompose to CO2, H2, CO, and H2O under heating and acidic conditions,81 which could explain why it was not identified in the analysis of reaction products by GC-MS. Moreover, the presence of Lewis acidity could promote the degradation of formic acid.81 The absence of HMF in our study carried out at 210 °C (Fig. 11) was due to its rapid conversion into levulinic acid, formic acid and humins82 and the presence of Re6+–OH, Re7+–OH as Brønsted acid sites next to Lewis sites on 10%Re–TiO2 led to the best results highlighted by a conversion of glucose up to 91.5% and a yield of levulinic acid up to 56.9% for a small catalyst to glucose mass ratio (1![[thin space (1/6-em)]](https://www.rsc.org/images/entities/char_2009.gif) :
:![[thin space (1/6-em)]](https://www.rsc.org/images/entities/char_2009.gif) 5) (Fig. 11). Recently, I. Thapa et al. reported at lower temperature (120 °C) the production of levulinic acid with a yield similar with those aforementioned but from fructose using a solvent mixture (water/γ-valerolactone) and a higher catalyst(Dowex 50 × 8–100 resin) to fructose mass ratio (1
5) (Fig. 11). Recently, I. Thapa et al. reported at lower temperature (120 °C) the production of levulinic acid with a yield similar with those aforementioned but from fructose using a solvent mixture (water/γ-valerolactone) and a higher catalyst(Dowex 50 × 8–100 resin) to fructose mass ratio (1![[thin space (1/6-em)]](https://www.rsc.org/images/entities/char_2009.gif) :
:![[thin space (1/6-em)]](https://www.rsc.org/images/entities/char_2009.gif) 1).83
1).83
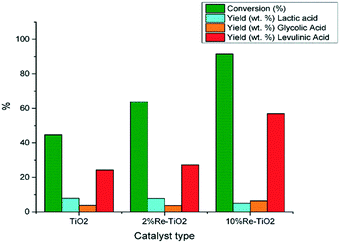 | ||
| Fig. 11 Conversion of glucose under autoclave conditions (0.16 g glucose; 0.032 g catalyst, 10 mL water, 210 °C). | ||
The catalytic performances of rhenium based catalysts were also influenced, besides the nature and strength of acid sites, by the catalyst amount tested in the conversion of glucose. Indeed, the conversion of glucose and levulinic acid yield were enhanced by an increase of the catalyst to glucose mass ratio from 1![[thin space (1/6-em)]](https://www.rsc.org/images/entities/char_2009.gif) :
:![[thin space (1/6-em)]](https://www.rsc.org/images/entities/char_2009.gif) 5 to 1
5 to 1![[thin space (1/6-em)]](https://www.rsc.org/images/entities/char_2009.gif) :
:![[thin space (1/6-em)]](https://www.rsc.org/images/entities/char_2009.gif) 3 (Fig. 12). On the other hand, the levulinic acid yield (38.9%) obtained by the increase of mass ratio for 2%Re–TiO2 up to 1
3 (Fig. 12). On the other hand, the levulinic acid yield (38.9%) obtained by the increase of mass ratio for 2%Re–TiO2 up to 1![[thin space (1/6-em)]](https://www.rsc.org/images/entities/char_2009.gif) :
:![[thin space (1/6-em)]](https://www.rsc.org/images/entities/char_2009.gif) 3 was smaller than that obtained over 10%Re–TiO2 (levulinic acid yield of 56.9%) for 1
3 was smaller than that obtained over 10%Re–TiO2 (levulinic acid yield of 56.9%) for 1![[thin space (1/6-em)]](https://www.rsc.org/images/entities/char_2009.gif) :
:![[thin space (1/6-em)]](https://www.rsc.org/images/entities/char_2009.gif) 5 mass ratio (Fig. 11), fact due to the presence only of very weak Brønsted acid sites (Re4+–OH and Ti4+–OH sites) on the surface of 2%Re–TiO2 as resulting of dissociative adsorption of water on Reδ+–O2− and Reδ+–O2−–Tiδ+ acid–base pairs.84 On the other hand, the increase of oxidation state of rhenium from +4 (2%Re–TiO2) to +7 (10%Re–TiO2) involved a decrease of electron density on oxygen atoms and so an increase of the Brønsted acid sites strength.
5 mass ratio (Fig. 11), fact due to the presence only of very weak Brønsted acid sites (Re4+–OH and Ti4+–OH sites) on the surface of 2%Re–TiO2 as resulting of dissociative adsorption of water on Reδ+–O2− and Reδ+–O2−–Tiδ+ acid–base pairs.84 On the other hand, the increase of oxidation state of rhenium from +4 (2%Re–TiO2) to +7 (10%Re–TiO2) involved a decrease of electron density on oxygen atoms and so an increase of the Brønsted acid sites strength.
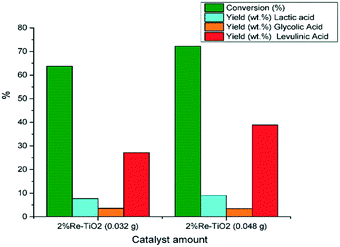 | ||
| Fig. 12 Conversion of glucose under autoclave conditions (0.16 g glucose; 0.032 g or 0.048 g catalyst, 10 mL water, 210 °C). | ||
Therefore, both nature and strength of Brønsted acid sites do play an important role in determining the catalyst performances concerning the conversion of glucose into levulinic acid.
The hydrothermal stability of 10%Re–TiO2 as well as its catalytic performances in the conversion of glucose were investigated at 210 °C in four catalytic cycles for 1:10 catalyst to glucose mass ratio (Fig. 13). It is known that, in aqueous medium, solid acids may lose their catalytic activity due to the poisoning of their acid sites by water but the interactions of H2O with Lewis acid sites of TiO4 tetrahedra do not show high strength so their hydration is quite low which justify the catalytic activity of TiO2 in aqueous media.85
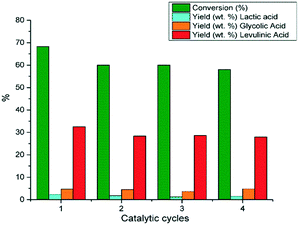 | ||
| Fig. 13 Conversion of glucose under autoclave conditions (0.16 g glucose; 0.016 g 10%Re–TiO2, 10 mL water, 210 °C). | ||
The water-tolerant Lewis acid sites of TiO2 tetrahedra allowed the reusability of 10%Re–TiO2 for four catalytic cycles without a significant loss of the catalytic activity (Fig. 13). Moreover, after four catalytic cycles the Raman bands assigned to anatase structure for rhenium doped titania (10%Re–TiO2) tested were preserved (Fig. S10†). On the other hand, the leaching of rhenium aforementioned was also highlighted by XPS analysis (Fig. S11†) where only Re3+ (42 eV) and Ti4+ (458.5 eV) species were found. Therefore, we suppose that the leaching of Re(VI) and Re (VII) accompanied by the absence of Ti3+ showed that the presence of Ti3+ in fresh catalyst was due to bond with Re(VI) or Re(VII) as result of a partial charge transfer from rhenium to titanium all more so Ti3+ has low stability in air.
The slight decrease of conversion as well as of lactic and levulinic acid yields from first to second catalytic cycle could be due to the partial deactivation of Lewis acid sites on the TiO2 surface86 as well as of the rhenium leaching. On the other hand, 10%Re–TiO2 kept anatase structure in the conversion of glucose even at 210 °C despite rhenium leaching.
The cleavage of C–O bonds over rhenium catalysts has been reported in the literature and depends on the oxidation state of rhenium, thus Re(VII) oxide was efficient in the activation of β-O-4 bond.87 Taking this prior art into account as well as the fact that cellulose is a polysaccharide and the glucose units are connected by β-1,4-glycosidic bonds, we also evaluated at 210 °C the effect of insertion of rhenium into TiO2 structure on catalytic performances of doped TiO2 in the conversion of microcrystalline cellulose to levulinic acid. The low catalytic activity of TiO2 was in agreement with that reported by H. Lin et al.88 leading to a cellulose conversion of 59% and a 11% levulinic acid yield in 24 h and for 1![[thin space (1/6-em)]](https://www.rsc.org/images/entities/char_2009.gif) :
:![[thin space (1/6-em)]](https://www.rsc.org/images/entities/char_2009.gif) 5 catalyst to cellulose mass ratio. The presence of Re(VII) on the surface of TiO2 led to a significant increase of the conversion up to 77% due to the cleavage of glycosidic bonds but the increase of levulinic acid yield was only 3% from 11 to 14%.
5 catalyst to cellulose mass ratio. The presence of Re(VII) on the surface of TiO2 led to a significant increase of the conversion up to 77% due to the cleavage of glycosidic bonds but the increase of levulinic acid yield was only 3% from 11 to 14%.
Conclusions
In this work, nano-particles such as TiO2, 2%Re–TiO2 and 10%Re–TiO2 were prepared by a modified aerogel method, for the first time to the best of our knowledge, and tested at 180 °C or 210 °C as solid acid catalysts for the glucose or cellulose conversion to levulinic acid.The physico-chemical characterizations of these catalysts highlighted both the successful insertion of Re into titania structure and the formation of Ren+–O–Ti4+(Ti3+) bonds.
The nature of acid sites on Re-doped TiO2 was influenced by the oxidation state of rhenium and titanium. If the Lewis acid sites are represented by Ti4+, Ti3+ and Ren+, the generation of Brønsted acid sites on the surface of 10%Re–TiO2 is due to the presence of high oxidation state of rhenium (Re6+, Re7+) which can attract hydroxyl ions to the surface in line with the neutralization of the excess charge resulting from the substitution of Ti4+ions.
The doping of TiO2 with rhenium up to 10% weight led to an improvement of its catalytic performance highlighted by the increase of levulinic acid yield from 27.2% to 57% due to synergistic effect between Brønsted and Lewis acid sites. On the other hand, the presence of Ren+ species led to an increase in anatase phase stability at high temperature and the developing of these materials or their testing in other catalytic processes could be a topic of the future scientific researches.
Author contributions
Sorin Avramescu: methodology, validation, resources; Cristian D. Ene: investigation, writing – review & editing, writing-original draft, visualization; Madalina Ciobanu: investigation; Josefine Schnee: investigation; Francois Devred: investigation; Cristina Bucur: investigation; Eugeniu Vasile: investigation; Luke Colaciello: methodology; Ryan Richards: supervision, writing – review & editing; Eric M. Gaigneaux: supervision, writing – review & editing; Marian Nicolae Verziu: conceptualization, supervision, writing–original draft, writing – review & editing.Conflicts of interest
The authors declare no competing financial interest.Acknowledgements
The authors acknowledge Professor Marco Daturi (Normandie Université, ENSICAEN, UNICAEN, CNRS, Laboratoire Catalyse et Spectrochimie, Caen, France), supervisor of JS during her post-doctoral stay in his team, for having let her manage this collaboration in full autonomy.References
- P. Gallezot, Chem. Soc. Rev., 2012, 41, 1538–1558 RSC
.
- S. S. Chen, T. Maneerung, D. C. W. Tsang, Y. S. Ok and C. H. Wang, Chem. Eng. J., 2017, 328, 246–273 CrossRef CAS
.
- R. Weingarten, Y. T. Kim, G. A. Tompsett, A. Fernández, K. S. Han, E. W. Hagaman, W. C. ConnerJr, J. A. Dumesic and G. W. Huber, J. Catal., 2013, 304, 123–134 CrossRef CAS
.
- N. A. S. Ramli and N. A. S. Amin, Appl. Catal., B, 2015, 163, 487–498 CrossRef CAS
.
- A. Morone, M. Apte and R. A. Pandey, Renewable Sustainable Energy Rev., 2015, 51, 548–565 CrossRef CAS
.
- H. Jeong, S. K. Jang, C. Y. Hong, S. H. Kim, S. Y. Lee, S. M. Lee, J. W. Choi and I. G. Choi, Bioresour. Technol., 2017, 225, 183–190 CrossRef CAS
.
- X. Li, R. Xu, J. Yang, S. Nie, D. Liu, Y. Liu and C. Si, Ind. Crops Prod., 2019, 130, 184–197 CrossRef CAS
.
- W. Deng, Q. Zhang and Y. Wang, Catal. Today, 2014, 234, 31–41 CrossRef CAS
.
- K. Yan, C. Jarvis, J. Gu and Y. Yan, Renewable Sustainable Energy Rev., 2015, 51, 986–997 CrossRef CAS
.
- X. Zhang, X. Zhang, N. Sun, S. Wang, X. Wang and Z. Jiang, Renewable Energy, 2019, 141, 802–813 CrossRef CAS
.
- F. Chambona, F. Rataboul, C. Pinel, A. Cabia, E. Guillon and N. Essayem, Appl. Catal., B, 2011, 105, 171–181 CrossRef
.
- W. Zeng, D. G. Cheng, H. Zhang, F. Chen and X. Zhan, React. Kinet., Mech. Catal., 2010, 100, 377–384 CAS
.
- G. Parameswaram and R. Sounak, Energy Fuels, 2019, 33, 5293–5303 CrossRef
.
- W. Masaru, A. Yuichi, I. Toru, N. Ryo and I. Hiroshi, Appl. Catal., A, 2005, 295, 150–156 CrossRef
.
- C. Liebig, S. Paul, B. Katryniok, C. Guillon, J. L. Couturier, J. L. Dubois, F. Dumeignil and W. F. Hoelderich, Appl. Catal., B, 2013, 132, 170–182 CrossRef
.
- M. Giuseppe, G. L. Elisa, V. Vincenzo, S. Giuseppe, S. Diana and P. Leonardo, Catal. Today, 2017, 281, 60–70 CrossRef
.
- P. L. Gustavo, R. L. Román and V. Tomás, Catal. Today, 2018, 305, 182–191 CrossRef
.
- A. Cyganiuk, R. Klimkiewicz, A. Bumajdad, A. Ilnicka and J. P. Lukaszewicz, Mater. Sci. Eng., B, 2015, 198, 35–42 CrossRef CAS
.
- C. Guangwen, L. Shulian, J. Fengjun and Y. Quan, Catal. Today, 2007, 125, 111–119 CrossRef
.
- J. R. Bernardo, M. C. Oliveira and A. C. Fernandes, Mol. Catal., 2019, 465, 87–94 CrossRef CAS
.
- C. Fan, H. Guan, H. Zhang, J. Wang, S. Wang and X. Wang, Biomass Bioenergy, 2011, 35, 2659–2665 CrossRef CAS
.
- T. J. Korstanje, E. F. Waard, J. T. B. H. Jastrzebski and R. J. M. K. Gebbink, ACS Catal., 2012, 2, 2173–2181 CrossRef CAS
.
- S. Raju, M. E. Moret and R. J. M. K. Gebbink, ACS Catal., 2015, 5, 281–300 CrossRef CAS
.
- K. M. Shrestha, C. M. Sorensen and K. J. Klabunde, J. Mater. Res., 2013, 28, 431–439 CrossRef CAS
.
- S. Gražulis, A. Daškevič, A. Merkys, D. Chateigner, L. Lutterotti, M. Quirós, N. R. Serebryanaya, P. Moeck, R. T. Downs and A. Le Bail, Nucleic Acids Res., 2012, 40, D420–D427 CrossRef PubMed
.
- S. Grazulis, D. Chateigner, R. T. Downs, A. T. Yokochi, M. Quiros, L. Lutterotti, E. Manakova, J. Butkus, P. Moeck and A. Le Bail, J. Appl. Crystallogr., 2009, 42, 726–729 CrossRef CAS PubMed
.
- C. M. Teodorescu, J. M. Esteva, R. C. Karnatak and A. E. Afif, Nucl. Instrum. Methods Phys. Res., Sect. A, 1994, 345, 141–147 CrossRef CAS
.
- M. Thommes, K. Kaneko, A. V. Neimark, J. P. Olivier, F. R. Reinoso, J. Rouquerol and K. S. W. Sing, Pure Appl. Chem., 2015, 87, 1051–1069 CAS
.
- L. Ye, J. Mao, J. Liu, Z. Jiang, T. Peng and L. Zan, J. Mater. Chem. A, 2013, 1, 10532–10537 RSC
.
- N. Martínez, R. García, J. L. G. Fierro, C. Wheeler, R. N. Austin, J. R. Gallagher, J. T. Miller, T. R. Krause, N. Escalona and C. Sepúlved, Fuel, 2016, 186, 112–121 CrossRef
.
- Y. Yuan and Y. Iwasawa, J. Phys. Chem. B, 2002, 106, 4441–4449 CrossRef CAS
.
- R. D. Shannon, Acta Crystallogr., Sect. A: Cryst. Phys., Diffr., Theor. Gen. Crystallogr., 1976, 32, 751–766 CrossRef
.
- L. Xu, M. P. Garrett and B. Hu, J. Phys. Chem. C, 2012, 116, 13020–13025 CrossRef CAS
.
- M. J. Velasco, F. Rubio, J. Rubio and J. L. Oteo, Spectrosc. Lett., 1999, 32, 289–304 CrossRef CAS
.
- V. A. Zeitler and C. A. Brown, J. Phys. Chem., 1957, 61, 1174–1177 CrossRef CAS
.
- P. D. Moran, G. A. Bowmaker, R. P. Cooney, K. S. Finnie, J. R. Bartlett and J. L. Woolfrey, Inorg. Chem., 1998, 37, 2741–2748 CrossRef CAS PubMed
.
- I. E. Wachs, Colloids Surf., A, 1995, 105, 143–149 CrossRef CAS
.
- S. Lwin, C. Keturakis, J. Handzlik, P. Sautet, Y. Li, A. I. Frenkel and I. E. Wachs, ACS Catal., 2015, 5, 1432–1444 CrossRef CAS
.
- H. Hartmann, H. L. Schläfer and K. H. Hansen, Z. Anorg. Allg. Chem., 1956, 284, 153–161 CrossRef CAS
.
- C. Dijkgraaf and J. P. G. Rousseau, Spectrochim. Acta, 1967, 23, 1267–1270 CrossRef CAS
.
- I. N. Booysen, B. Jadoo and M. P. Akerman, J. Mol. Struct., 2018, 1165, 8–13 CrossRef CAS
.
- S. Lwin, Y. Li, A. I. Frenkel and I. E. Wachs, ACS Catal., 2015, 5, 6807–6814 CrossRef CAS
.
- P. J. Aymonino, H. Schultze and A. Müller, Z. Naturforsch., B: Anorg. Chem., Org. Chem., Biochem., Biophys., Biol., 1969, 24, 1508–1510 CrossRef CAS
.
- D. Nikolova, R. E. Kardjieva, H. Kolev and M. Gabrovska, Catal. Today, 2020, 357, 590–601 CrossRef CAS
.
- H. Khan and I. K. Swati, Ind. Eng. Chem. Res., 2016, 55, 6619–6633 CrossRef CAS
.
- B. Wen, Q. Hao, W. J. Yin, L. Zhang, Z. Wang, T. Wang, C. Zhou, A. Selloni, X. Yang and L. M. Liu, Phys. Chem. Chem. Phys., 2018, 20, 17658–17665 RSC
.
- E. O. Filatova, A. S. Konashuk, S. S. Sakhonenkov, A. A. Sokolov and V. V. Afanasev, Sci. Rep., 2017, 7, 4541 CrossRef CAS
.
- I. C. Nica, M. S. Stan, M. Popa, M. C. Chifiriuc, V. Lazar, G. G. Pircalabioru, I. Dumitrescu, M. Ignat, M. Feder, L. C. Tanase, I. Mercioniu, L. Diamandescu and A. Dinischio, Int. J. Mol. Sci., 2017, 18, 249–273 CrossRef
.
- A. Suknev, V. Zaikovskii, V. Kaichev, E. Paukshtis, E. Sadovskaya and B. Balzhinimaev, J. Energy Chem., 2015, 24, 646–654 CrossRef
.
- E. S. Shpiro, M. A. Ryashentseva, K. M. Minachev, G. V. Antoshin and V. I. Avaev, J. Catal., 1978, 55, 402–406 CrossRef CAS
.
- J. D. P. Counsell, A. J. Roberts, W. Boxford, C. Moffitt and K. Takahashi, J. Surf. Anal., 2014, 20, 211–215 CrossRef CAS
.
- B. Bharti, S. Kumar, H. N. Lee and R. Kumar, Sci. Rep., 2016, 6, 32355 CrossRef CAS PubMed
.
- S. Ghosh, H. C. Lu, S. H. Cho, T. Maruvada, M. C. Price and D. J. Milliron, J. Am. Chem. Soc., 2019, 141, 16331–16343 CrossRef CAS
.
- W. Xie, R. Li and Q. Xu, Sci. Rep., 2018, 8, 8752 CrossRef PubMed
.
- B. M. Reddy and A. Khan, Catal. Rev.: Sci. Eng., 2005, 47, 257–296 CrossRef CAS
.
- C. Y. Wu, K. J. Tu, J. P. Deng, Y. S. Lo and C. H. Wu, Materials, 2017, 10, 566–581 CrossRef PubMed
.
- A. Di Paola, M. Bellardita, L. Palmisano, Z. Barbieriková and V. Brezová, J. Photochem. Photobiol., A, 2014, 273, 59–67 CrossRef CAS
.
- M. M. Mahlambi, A. K. Mishra, S. B. Mishra, R. W. Krause, B. B. Mamba and A. M. Raichur, J. Therm. Anal. Calorim., 2012, 110, 847–855 CrossRef CAS
.
- G. Rouschias, Chem. Rev., 1974, 74, 531–566 CrossRef CAS
.
- I. T. Ghampson, C. Sepúlveda, R. García, J. L. G. Fierroc and N. Escalona, Catal. Sci. Technol., 2016, 6, 4356–4369 RSC
.
- D. A. H. Hanaor and C. C. Sorrell, J. Mater. Sci., 2011, 46, 855–874 CrossRef CAS
.
- X. Xiaoding, J. C. Mol and C. Boelhouwer, J. Chem. Soc., Faraday Trans., 1986, 82, 2707–2718 RSC
.
- F. Huang, T. Jiang, X. Xu, L. Chen, G. Laurenczy, Z. Fei and P. J. Dyson, Catal. Sci. Technol., 2020, 10, 7857–7864 RSC
.
- A. Khlyustova, N. Sirotkin, T. Kusova, A. Kraev, V. Titov and A. Agafonov, Mater. Adv., 2020, 1, 1193–1201 RSC
.
- M. A. Vuurman, D. J. Stufkens, A. Oskam and I. E. Wachs, J. Mol. Catal., 1992, 76, 263–285 CrossRef CAS
.
- Z. Qingde, T. Yisheng, L. Guangbo, Z. Junfeng and H. Yizhuo, Green Chem., 2014, 16, 4708–4715 RSC
.
- H. Lin, J. Long, Q. Gu, W. Zhang, R. Ruan, Z. Li and X. Wang, Phys. Chem. Chem. Phys., 2012, 14, 9468–9474 RSC
.
- P. M. Kumar, S. Badrinarayanan and M. Sastry, Thin Solid Films, 2000, 358, 122–130 CrossRef CAS
.
- M. M. Mohamed, Appl. Catal., A, 2004, 267, 135–142 CrossRef CAS
.
- Z. Wenhua, L. Liming, W. Li, L. Lingyun, C. Liang, X. Faqiang, Z. Jin and W. Ziyu, Phys. Chem. Chem. Phys., 2015, 17, 20144–20153 RSC
.
- S. Manoj, A. L. R. Sergio, G. Kavita, S. Shweta, S. C. P. Otero and A. D. Tinoco, Coord. Chem. Rev., 2018, 363, 109–125 CrossRef
.
- X. Zilei, H. Jiadong, S. Zhigao, Y. Qizheng and X. Weiqing, RSC Adv., 2015, 5, 38499–38502 RSC
.
- M. Lubas, J. J. Jasinski, M. Sitarz, L. Kurpaska, P. Podsiad and J. Jasinski, Spectrochim. Acta, Part A, 2014, 133, 867–871 CrossRef CAS
.
- T. E. Crumpton, J. F. W. Mosselmans and C. Greaves, J. Mater. Chem., 2005, 15, 164–167 RSC
.
- T. C. Acharjee and Y. Y. Lee, Environ. Prog. Sustainable Energy, 2018, 37, 471–480 CrossRef CAS
.
- D. Daqian, W. Jianjian, X. Jinxu, L. Xiaohui, L. Guanzhong and W. Yanqin, Green Chem., 2014, 16, 3846–3853 RSC
.
- S. Kang, J. Fu and G. Zhang, Renewable Sustainable Energy Rev., 2018, 94, 340–362 CrossRef CAS
.
- A. Ranoux, K. Djanashvili, I. W. C. E. Arends and U. Hanefeld, ACS Catal., 2013, 3, 760–763 CrossRef CAS
.
- M. Y. Wen, I. Wender and J. W. Tierney, Energy Fuels, 1990, 4, 372–379 CrossRef CAS
.
- M. O. Haus, A. Meledin, S. Leiting, Y. Louven, N. C. Roubicek, S. Moos, C. Weidenthaler, T. E. Weirich and R. Palkovits, ACS Catal., 2021, 11, 5119–5134 CrossRef CAS
.
- Y. Liu, H. Li, J. He, W. Zhao, T. Yang and S. Yang, Catal. Commun., 2017, 93, 20–24 CrossRef CAS
.
- R. Weingarten, W. C. Conner Jr. and G. W. Huber, Energy Environ. Sci., 2012, 5, 7559–7574 RSC
.
- I. Thapa, B. Mullen, A. Saleem, C. Leibig, R. T. Baker and J. B. Giorgi, Appl. Catal., A, 2017, 539, 70–79 CrossRef CAS
.
- L. H. Vieira, L. C. Alejandro, C. W. Jones and L. Martins, Appl. Catal., A, 2020, 602, 117687–117696 CrossRef CAS
.
- N. Kiyotaka, N. Ryouhei, K. Masaaki and H. Michikazu, J. Phys. Chem. C, 2013, 117, 16028–16033 CrossRef
.
- K. M. A. Santos, M. A. Elise, I. Giada, E. P. B. Luiz, S. Carsten and A. F. Marco, ChemCatChem, 2019, 11, 3054–3063 CrossRef CAS
.
- Z. Qi, B. Zhang, J. Ji, X. Li, T. Dai, H. Guo, A. Wang, L. Lu and C. Li, ChemPlusChem, 2018, 83, 500–505 CrossRef CAS PubMed
.
- H. Lin, J. Strull, Y. Liu, Z. Karmiol, K. Plank, G. Miller, Z. Guo and L. Yang, Energy Environ. Sci., 2012, 5, 9773–9777 RSC
.
Footnote |
| † Electronic supplementary information (ESI) available. See DOI: 10.1039/d1cy01450a |
| This journal is © The Royal Society of Chemistry 2022 |

