Comparison of the catalytic performance of Au/TiO2 prepared by in situ photodeposition and deposition precipitation methods for CO oxidation at room temperature under visible light irradiation†
Qiuzhong
Li
ab,
Caijie
Wu
ac,
Ke
Wang
ac,
Xiaoxiao
Wang
ac,
Xun
Chen
ac,
Wenxin
Dai
 *ac and
Xianzhi
Fu
a
aResearch Research Institute of Photocatalysis, State Key Laboratory of Photocatalysis on Energy and Environment, Fuzhou University, Fuzhou, 350108, China. E-mail: daiwenxin@fzu.edu.cn
bCollege of Chemistry and Material, Ningde Normal University, Ningde, 352100, China
cQingyuan Innovation Laboratory, Quanzhou 362801, China
First published on 2nd November 2021
Abstract
A Au/TiO2-PD sample was prepared via a mild in situ photodeposition method followed by heat treatment. As compared to Au/TiO2-DP prepared by deposition precipitation, this Au/TiO2-PD sample owned the smaller sizes of Au nanoparticles (Au NPs), and exhibited a better catalytic activity for CO oxidation under visible light irradiation or otherwise. The results of XPS, in situ EPR and in situ DRIFTS tests indicated that TiO2 could transfer electrons to Au NPs caused the increase in surface electron density of Au NPs, resulting in the enhanced adsorption of CO at Au sites. This adsorbed CO could interact with the lattice O of TiO2 to form CO2 accompanied by oxygen vacancy, while O2 could be adsorbed at the oxygen vacancy to form the lattice O of TiO2 again. Moreover, the other oxygen atom of O2 adsorbed at oxygen vacancy may form activated O− species at adjacent Au sites, which can further react with another CO adsorbed at Au sites to form CO2. As compared with Au/TiO2-DP, the Au/TiO2-PD sample showed more electron transfer from TiO2 to Au sites (meaning more CO activation) and then the more activation of O2, resulting in an ultra-high activity of CO oxidation. Further, under visible light, the Au/TiO2-PD sample also exhibited a more obvious photopromoted effect due to the higher surface electron density of Au NPs induced by LSPR effect than Au/TiO2-DP. This study showed that the effect of Au NPs size on CO oxidation may somewhat be attributed to the electron transfer behavior.
1. Introduction
As is well known, the presence of CO is extremely harmful to human health and even life-threatening in an open space or a confined room. Research on the elimination of trace CO at room temperature is very necessary. In addition, in the proton exchange membrane fuel cell (PEMFC), H2 mainly comes from the water gas shift; however, the small amount of CO (0.5–2 vol%) produced by the water–gas shift will cause the noble metal (Pt or Pt–Ru) on the electrode to be poisoned and deactivated,1,2 H2 must undergo CO removal and purification treatment before entering the fuel cell, e.g., the preferential oxidation of CO in the H2-rich gas is also a very important research topic.3,4The catalytic oxidation of CO has always been a basic subject in catalysis research as it is a system with both theoretical research and application value. Since Haruta et al. carried ultrafine Au nanoparticles (Au NPs) on a reducing carrier for the catalytic oxidation of CO at low-temperature,5 gold, which has always been considered to be inert, has received great attention. Among them, Au/TiO2 has superior activity than Pt/MO in CO catalytic oxidation and has become one of the research hotspots.6–12 In the past 30 years, the research directions of CO catalytic oxidation mainly boil down to two aspects—one, to effectively improve the efficiency of the catalyst and the other, is to explore the mechanism of the catalytic reaction. However, the superior activity of the catalyst particularly depends on the activation of CO at the Au sites. Moreover, the control of the Au NP size, surface structure, and dispersion state are also the key factors for improving CO oxidation over Au-supported catalysts.13 The well-dispersed Au NPs with smaller size exhibit a higher activity.14 For example, as the particle size of Au is less than 3 nm, it shows good catalytic performance but when its particle size is greater than 5 nm, it may lose this unique performance.15 Moreover, properly controlling the defects on the surface of the support can also effectively improve the activity of the catalyst.16 In addition, the mode of interaction between the noble metal and support is also considered very important, and has a direct impact on the activity of the catalyst, even changing the reaction conditions.17–19
Ultrafine Au NPs have a lower melting point due to the small size effect and surface effect; the melting point of 2 nm Au NPs is only about 300 °C.20 Thus, the traditional pre-heat treatment with high temperature will easily cause Au NPs to sinter and aggregate, destroy the original asymmetric coordination, and significantly reduce the catalytic activity. In order to obtain highly dispersed and stable Au NPs, a suitable preparation method and strict control of the conditions are required. In the traditional impregnation method (IMP), loaded Au NPs usually have a large particle size (>10 nm),21 poor dispersion, and weak interaction between Au and the support. The commonly used methods also include co-precipitation (CP),22 deposition–precipitation (DP),23,24 chemical vapor deposition (CVD),25 and photodeposition (PD) method.26 Among them, the PD method is used to support Au on TiO2, which can obtain smaller Au particles than the DP method.27 Chen and co-workers used the PD method to load Au on P25 to obtain Au NPs with a particle size of about 1.5 nm, the particle size of Au will increase with the prolongation of the photodeposition time, and the prepared catalyst has better catalytic performance and selectivity for CO oxidation.28
Furthermore, our previous works have found that both UV and visible light could promote CO oxidation over Au/TiO2.29–35 On the one hand, the photogenerated electrons form TiO2 excited by UV can transfer to the Au NPs, resulting in CO activation and its oxidation,29,33 and the addition of an electron promoter can further boost CO oxidation.31,32,35 On the other hand, the localized surface plasmon resonance (LSPR) effect of Au NPs induced by visible light can benefit the increase in the surface electron density, and then the CO activation and its oxidation over Au/TiO2.8,34,36
In this work, for comparing the photoassisted catalytic performances of Au NPs with different particle sizes for oxidizing CO, two kinds of Au/TiO2 (Au/TiO2-PD and Au/TiO2-DP) with different Au NPs size were prepared by in situ photodeposition and deposition precipitation methods, respectively, and were then performed the respective catalytic activity of oxidizing CO under visible light irradiation at room temperature. Both the samples could easily oxidize CO at room temperature, and adding visible light could further promote CO oxidation. However, Au/TiO2-PD prepared by photodeposition exhibits higher activity and photo-promoted activity compared to Au/TiO2-DP prepared by deposition precipitation. Furthermore, the influence of the preparation methods on the surface electron density of the Au/TiO2 catalyst, as well as the adsorption, activation, and conversion behaviors of CO and O2 were also investigated through photoelectrochemistry, gas sensitivity response, UV-vis DRS, TPD, XPS, in situ DRIFTS, and in situ EPR. Finally, the reaction mechanism under the action of visible light was proposed.
2. Experimental section
2.1. Preparation of TiO2(EG) and TiO2
In a similar typical procedure synthesis of TiO2(EG), briefly, 2.5 mL tetrabutyl titanate (Shanghai Chemicals Co.) was added to 75 mL ethylene glycol (EG, Shanghai Chemicals Co.) and magnetically stirred for 10 min at room temperature. Then, 2.5 mL water was added into the mixture and kept stirred for 1 h. The resulting white sol was transferred into a 100 mL Teflon-lined stainless-steel autoclave, and placed in an oven for solvothermal treatment at 150 °C for 4 h before it was cooled to the room temperature. The white products were collected via centrifugation and further washed by water three times and ethanol one time, respectively. After drying in an oven at 80 °C overnight, the precursor was marked as TiO2(EG) and used for further preparation. TiO2(EG) was calcined in a muffle furnace at 350 °C for 3 h, and pure TiO2 was obtained. All the chemicals were used of analytical grade and without further purification.2.2. Preparation of Au/TiO2-PD and Au/TiO2-DP
The in situ photodeposition synthesis of Au/TiO2-PD was carried out as follows. According to the theoretical loading of Au, a certain amount of HAuCl4·3H2O solution (0.01 g mL−1) was added into 20 mL water, and the pH value was adjusted to 9.0 by adding 0.1 mol L−1 NaOH solution with vigorous stirring at room temperature. TiO2(EG) (50 mg) was dispersed into the above suspension solution and stirred for 2 h. In situ photodeposition was conducted on xenon-lamp parallel light source system (Beijing Pfeiffer Technology Co. Ltd, PLS-SXE300) equipped with a band pass filter that only allows the transmission of 365 nm UV. All the UV treatments were operated at an operation current of 15 A. The power density of UV light was measured to be 1.26 mW cm−2 by a radiometer (International Light Technologies, Inc. ILT950). The dispersion was then subjected to UV treatment at room temperature under stirring for 10 min, the light purple Au/TiO2(EG) product was collected via centrifugation and further washed by water several times, and then dried at 80 °C for 12 h. Au/TiO2(EG) was transferred into an alumina crucible, and then placed into a muffle furnace for calcination at 350 °C for 3 h at the heating rate of 1 °C min−1 from room temperature; the Au/TiO2 sample was obtained as Au/TiO2-PD. The product was used for various characterizations and catalysis tests. When there was no special explanation in the paper, the Au loading amount of Au/TiO2 catalyst was 0.6 wt%. The catalyst was prepared by the DP method reported in the literature;36,37 the sample was denoted as Au/TiO2-DP, the Au theoretical loading amount was 0.6 wt.%, and the actual loading amount was 0.58 wt%. The details for the synthesis of Au/TiO2-DP was carried out as follows: HAuCl4·3H2O solution (1.2 mL 0.01 g mL−1) was added into 100 mL water, and the 0.1 mol L−1 NaOH solution was used to adjust the pH value to 9.0 with vigorous stirring at room temperature. TiO2 (1.0 g) was dispersed into the above suspension solution and stirred for 2 h under dark. Then, 0.1 mol L−1 NaBH4 solution was used to reduce the Au solution for 2 h. The precipitate was centrifuged and washed with deionized water for several times, and finally dried at 80 °C for 12 h. In the followed sections, if not specified, the Au/TiO2-PD and Au/TiO2-DP samples were specified as the samples with 0.6 wt% Au loading.2.3. Characterization
X-ray diffraction (XRD) measurement was detected by the powder X-ray diffractometer with Cu Kα1 radiation (λ = 0.15418 nm) operated at 40 kV 40 mA (Bruker D8 Advance). Thermogravimetric (TG) analysis was obtained on a Netzsch STA 449C at a heating rate of 10 °C min−1 in N2 stream. Scanning electron microscopy (SEM) studies were performed on a SU8000 (Hitachi). Transmission electron microscopy (TEM) studies together with an electron-diffraction image was carried out on a TECNAI G2F20 with field emission gun at 300 kV. Energy dispersive X-ray (EDX) spectrum were also obtained with an EDX spectrometer. Aberration-corrected high-angle annular dark field scanning transmission electron microscopy (HAADF-STEM) measurements were taken on a JEM-ARM200F instrument (University of Science and Technology of China) at 200 kV. The FT-IR spectra for the samples were obtained using a Thermo Scientific Nicolet iS50 FT-IR Spectrometer at room temperature. The gold loading of the Au/TiO2 catalysts was determined by inductively coupled plasma mass spectrometry (ICP-MS, XSERIES 2 Thermo, USA).The UV-vis diffuse reflectance spectra (UV-vis DRS) of the catalysts were measured with a Varian Cary 5000 UV-vis-NIR spectrophotometer. X-ray photoelectron spectroscopy (XPS) was taken with a Quantum 2000 system, whose data were collected using the Al Kα X-ray beam (1486.6 eV) operated on a ThermoScientific ESCALab250 spectrometer. The binding energies were corrected for the charge shift using the C 1s peak of carbon (BE = 284.80 eV) as the calibration. The photoelectrochemical experiments were performed on a Metrohm Autolab AUT302N Electrochemical workstation using a typical three-electrode electrochemical cell configuration, and filled with 0.2 M Na2SO4 electrolyte, with platinum as the counter electrode and an Ag/AgCl (saturated KCl solution) electrode as the reference electrode. The surface area was determined by a Micromeritics Instrument ASAP2020; the sample was first degassed at 200 °C for 2 h.
The in situ electron paramagnetic resonance (EPR) spectral signals were recorded using a Bruker A-300E at room temperature; the operation frequency was 9.84 GHz, and the working power was 15.92 MW.
Temperature programmed desorption (TPD) was carried out with a Micromeritics Autochem2910 instrument. In the TPD experiments, the specific process for the samples was carried out as reported in the previous work of our research group.37 The TPD experiments for the sample proceeded as follows: (1) Prior to the introduction of adsorbed gas, 100 mg sample was firstly pre-heated in high-purity He gas (50 mL min−1) at 200 °C for 2 h. (2) After cooling down to room temperature, the pre-adsorbed stream of CO was introduced into the sample for 1 h at room temperature with a flow rate of 30 mL min−1. (3) He gas was switched for 10 min. (4) Heating to 350 °C in He stream at a ramping rate of 10 °C min−1. At the same time as recording the signals of TCD, the mass signals of m/z = 28 and 44 were recorded to detect the masses of CO and CO2 molecules, respectively. For testing TPD under visible light irradiation, visible light (420–760 nm) was introduced on the surface of the sample during the process of CO adsorption.
The in situ diffuse reflectance infrared Fourier transform spectroscopy (in situ DRIFTS) measurements were conducted using the specially designed in situ DRIFTS reactor cell and a smart collector accessory on a Bruker Vexter 80v FT-IR Spectrometer with an MCT detector. First, the sample was loaded in an in situ DRIFTS reactor cell and subjected to evacuation at 200 °C for 1 h in an He atmosphere (the flow rate at 50 mL min−1) to remove the physically adsorbed water. After cooling down to 25 °C, the spectrum of the sample was collected as a collection background. Then, 5 vol% CO balanced with high purity He as the probe gas was introduced into the system with the total flow rate at 10 mL min−1, and the data were continuous collected for 40 min under dark or visible light. Then, the reaction gas was switched to 5 vol% O2, balanced with high purity He with the total flow rate at 10 mL min−1. During this process of the in situ DRIFTS experiment, the recorded data was within the 4000–1000 cm−1 spectral range with a resolution of 8 cm−1. Each spectrum was obtained by averaging 64 scans in order to reduce the ratios of signal-to-noise.
2.4. Catalytic performances
The catalytic activity of CO oxidation was conducted in a fixed-bed flow reactor at atmospheric pressure.36 The catalyst sample (300 mg with a grain of 0.2–0.3 mm) was packed in a square quartz cell with a cooling water system, which controlled the temperature of the reaction at 25 °C, and the total flow rate was 100 mL min−1 (WHSV = 20![[thin space (1/6-em)]](https://www.rsc.org/images/entities/char_2009.gif) 000 mL h−1 g−1 cat.). The feed stream contained 0.3 vol% CO, 0.3 vol% O2, and He as the balance gas. During the catalytic performance testing process, visible light produced by a 300 W Xenon lamp with a cut-off filter (≦420 nm) and another IR (>760 nm) cut-off filter was introduced. For testing the activity of the catalysts in the dark, the quartz cell was enclosed with an Al foil to shut down the light irradiation. The diagram of the catalytic reactor with or without visible light irradiation is shown in Scheme S1.† The outlet stream was analyzed using an online gas chromatograph (GC) system equipped with a thermal conductivity detector (Agilent 7890A, TDX-01). The CO conversion (XCO, %) and turnover frequency (TOF, h−1) of CO conversion were calculated as follows.
000 mL h−1 g−1 cat.). The feed stream contained 0.3 vol% CO, 0.3 vol% O2, and He as the balance gas. During the catalytic performance testing process, visible light produced by a 300 W Xenon lamp with a cut-off filter (≦420 nm) and another IR (>760 nm) cut-off filter was introduced. For testing the activity of the catalysts in the dark, the quartz cell was enclosed with an Al foil to shut down the light irradiation. The diagram of the catalytic reactor with or without visible light irradiation is shown in Scheme S1.† The outlet stream was analyzed using an online gas chromatograph (GC) system equipped with a thermal conductivity detector (Agilent 7890A, TDX-01). The CO conversion (XCO, %) and turnover frequency (TOF, h−1) of CO conversion were calculated as follows.where NCO refers to the mol gas flow rate (mol h−1), MAu refers to the mol weight of Au (196.97 g mol−1), mCat refers to the weight of the catalyst (g), and wAu refers to the loading amount of Au (wt%).
3. Results and discussion
3.1. Characterization of the catalysts
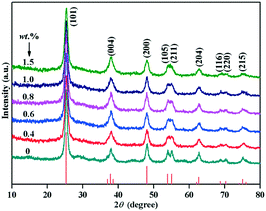
Fig. 1 showed the XRD pattern of Au/TiO2-PD and TiO2 samples with different loading amounts of Au. The diffraction peaks at the 2θ values of 25.28, 37.80, 48.04, 53.89, 55.06, 62.69, 68.76, 70.30, and 75.02° corresponded to the (101), (004), (200), (105), (211), (204), (116), (220), and (215) planes of anatase TiO2 (JCPDS no. 21-1272), respectively. No additional diffraction peaks were detected in all the samples, indicating that the samples were pure anatase, and the broad diffraction peaks demonstrated the poor crystallinity of the samples. In addition, no typical diffraction peak of Au was found in all the Au/TiO2-PD samples with different Au loading amount, indicating that Au was highly dispersed in the samples.ICP-MS was used to determine the loading amount of Au in the Au/TiO2-PD samples; the relationship between the actual loading amount and the theoretical loading amount showed that a better photodeposition effect could be obtained when the loading amount was lower (Fig. S1†). When the loading amount reached more than 1.0 wt%, the actual loading amount was already lower than the theoretical value, and the higher the loading amount, the greater and larger the deviation.
The absorption bands of FT-IR spectroscopy located at 2936 cm−1 and 2870 cm−1 were attributed to the stretching vibration of –CH2 in the EG molecule (Fig. S2†).38 The band located at 3300–3700 cm−1 belonged to the O–H stretching vibration of the EG molecule and the surface adsorption hydroxyl groups, indicating that there was a chemically adsorbed glycol group on the surface of the support. The absorption band at 1350–1500 cm−1 was attributed to the carbonate species. After loading Au, the number of adsorbed species on the Au/TiO2(EG) surface was significantly reduced, the surface of the Au/TiO2 sample had no –CH2 stretching vibration characteristic absorption, and the carbonate species and surface adsorbed water were also reduced significantly after the heat treatment.
The TG curves show a weight loss (ca. 10%) in the a and b section (from 30 to 200 °C), which represents the desorption process of physically adsorbed water of the corresponding sample. The weight loss in b and c section (from 200 to 400 °C) was attributed to the thermal decomposition process of the chemisorbed EG and the thermal desorption of hydroxyl groups on the catalyst surface (Fig. S3†). In comparison with the TG curve, it could be found that the weight loss rate of the Au/TiO2(EG) sample in the b and c segment (ca.13%) was significantly lower than that of the TiO2(EG) sample (ca. 21%). In order to investigate the important role of the EG group chemically adsorbed on the surface of TiO2(EG) during the loading of Au by the in situ PD method, calcined TiO2 was used as the support and the loading of Au according to the in situ PD method was carried out; it was found that the reduction of Au could not be observed after 10 min under UV (365 nm) irradiation, and when a certain amount of EG was added as the sacrificial agent, the reduction of Au could also not be observed, which indicated that the EG group chemically adsorbed by itself on TiO2(EG) could be used as a sacrificial agent and play a key role in photodeposition, which could quickly capture holes and become oxidized, thus effectively preventing the recombination of photogenerated electrons and holes. Here, Au3+ firstly interacted with the OH groups of EG (similar to the hydroxyls of the oxide support39,40), and were then reduced to the Au species (seeing Fig. S4†) interlinked with the O atom at the TiO2 surface. This in situ photodeposition of the Au/TiO2-PD sample is shown in Scheme 1.41
SEM, HRTEM, STEM, and EDX were performed to investigate the surface morphology of the Au/TiO2 sample and the distribution of Au NPs. The SEM image of the Au/TiO2-PD sample displays an irregular morphology (Fig. 2a), and the particles are large and uneven. In the HRTEM image (Fig. 2b), the lattice fringes with a fringe spacing of 0.35 and 0.23 nm correspond to the (101) plane of TiO2 and the (111) plane of Au, respectively, proving the successful loading of Au NPs. Moreover, the presence of Au NPs could also be detected in the EDX image (Fig. 2e). In order to observe the distribution of Au on the TiO2 surface more intuitively, the spherical aberration corrected HAADF-STEM test was performed (Fig. 2c and d); it could be found that the Au NPs were mainly loaded on the edge of TiO2, and were semi-encapsulated by the carrier and embedded on the surface of the TiO2. This structure could reduce its surface free energy so as to be more stable. From the high-resolution image, it could be clearly seen that the surface of the irregularly-shaped Au NPs had its unique lattice fringe characteristics; after heat treatment, the Au NPs were not severely sintered but still had obvious corners and steps. This asymmetric coordinated Au atom was more conducive to the adsorption and activation of the reactant molecules. The STEM result showed that the size of the Au NPs was mainly distributed around 3.5 nm and had a good normal distribution, indicating that Au loaded by the in situ PD method had uniform small nanoparticles and good dispersion, while the Au NPs in Au/TiO2-DP, which were prepared by the DP method, were obviously larger (Fig. 2f), whose size was mainly distributed around 5–6 nm.
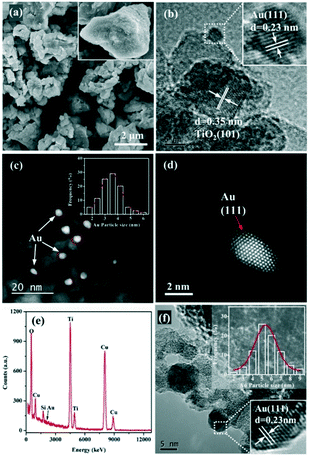 | ||
| Fig. 2 (a) SEM, (b) HRTEM, (c and d) STEM, and (e) EDX images of the Au/TiO2-PD sample, and (f) HRTEM images of the Au/TiO2-DP sample. | ||
The N2 adsorption–desorption curves of TiO2(EG), Au/TiO2-PD, and Au/TiO2-DP were shown a hysteresis loop in the adsorption–desorption curve of each sample, which was a typical type IV adsorption curve, indicating that all the three samples were mesoporous materials (Fig. S5†). TiO2(EG) had a large specific surface, which was conducive to the highly dispersed loading of the Au NPs on their surface (Table S1†). After Au loading and heat treatment, the specific surface and pore volume of the Au/TiO2-PD sample were significantly reduced, while the pore size was correspondingly increased. In contrast, the specific surface, pore size, and pore volume of Au/TiO2-DP were slightly increased.
3.2. Photocatalytic activities of Au/TiO2-PD and Au/TiO2-DP samples
In order to compare the influence of the preparation method on the performance of the sample, the photocatalytic activities of Au/TiO2-PD with different amounts of Au and Au/TiO2-DP samples for CO oxidation were investigated (Fig. 3). CO (3000 ppm) conversion over Au/TiO2 with 0.4 wt% Au loading was over 82% in the dark, and it could get to 100% under visible light irradiation. Visible light had an obvious light-promoting effect on the catalyst. As the Au loading reached 0.6 wt%, 0.8 wt%, and 1.0 wt%, CO could be converted completely in the dark; thus, adding visible light could not further increase the CO conversion. Furthermore, when the Au loading reached 1.5 wt%, the conversion rate of CO was only 88% in the dark; the main reason was that the increase in the loading amount caused the aggregation of Au NPs to increase obviously, resulting in decreased activity. However, CO could still be completely converted under visible light irradiation. Considering that the Au/TiO2-PD sample with 0.6 wt% Au has good catalytic activity, according to the rule of less Au loading, it was regarded in comparison to Au/TiO2-DP with the same Au loading. It can be seen that CO conversion was only ca. 42.5% over Au/TiO2-DP with 0.6 wt% Au in dark, and it only increased up to ca. 60.4% under visible light irradiation, indicating that the catalytic activity of Au/TiO2-DP was obviously lower than that of Au/TiO2-PD.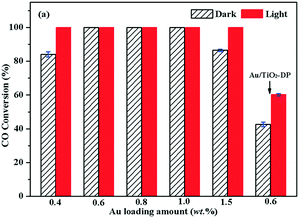 | ||
| Fig. 3 Conversion of CO oxidation over Au/TiO2-PD with different amount of Au and 0.6 wt% Au/TiO2-DP samples at room temperature, cCO = 3000 ppm. | ||
To exhibit the photo-promoted activity of the Au/TiO2-PD with 0.6 wt% Au (its photoassisted effect could not be shown in Fig. 3 due to the total oxidation of CO with low concentration in dark), the CO concentration was up to 30![[thin space (1/6-em)]](https://www.rsc.org/images/entities/char_2009.gif) 000 ppm. As can be seen in Fig. 4, the catalytic activity of this Au/TiO2-PD (0.6 wt% Au) seemed to be slightly attenuated in the initial 5 h; this may be because the CO concentration was relatively high, and the carbonate-like generated in the initial stage formed a certain accumulation on the surface of the catalyst, resulting in a decrease in the active sites. With the introduction of visible light, the TOF value of Au/TiO2-PD could increase from 650 h−1 in dark up to 860 h−1 (increased by about 37%), and exhibited a better catalytic stability than that in the dark condition. This photo-promoted effect could be maintained in the next cycle. As compared to the Au/TiO2-PD sample, Au/TiO2-DP with the same Au loading (0.6 wt%) showed a worse activity and photo-promoted activity, with a TOF value of 445 h−1 in dark and 556 h−1 under visible light irradiation (increased by about 25%). Apparently, the Au/TiO2-PD exhibited a higher catalytic activity in dark and a better photo-promoted effect than Au/TiO2-DP.
000 ppm. As can be seen in Fig. 4, the catalytic activity of this Au/TiO2-PD (0.6 wt% Au) seemed to be slightly attenuated in the initial 5 h; this may be because the CO concentration was relatively high, and the carbonate-like generated in the initial stage formed a certain accumulation on the surface of the catalyst, resulting in a decrease in the active sites. With the introduction of visible light, the TOF value of Au/TiO2-PD could increase from 650 h−1 in dark up to 860 h−1 (increased by about 37%), and exhibited a better catalytic stability than that in the dark condition. This photo-promoted effect could be maintained in the next cycle. As compared to the Au/TiO2-PD sample, Au/TiO2-DP with the same Au loading (0.6 wt%) showed a worse activity and photo-promoted activity, with a TOF value of 445 h−1 in dark and 556 h−1 under visible light irradiation (increased by about 25%). Apparently, the Au/TiO2-PD exhibited a higher catalytic activity in dark and a better photo-promoted effect than Au/TiO2-DP.
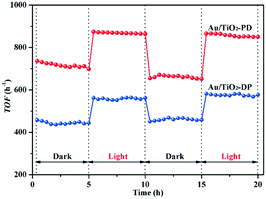 | ||
Fig. 4 The TOF of CO oxidation over 0.6 wt% Au/TiO2-PD and 0.6 wt% Au/TiO2-DP samples at room temperature, cCO = 30![[thin space (1/6-em)]](https://www.rsc.org/images/entities/char_2009.gif) 000 ppm. 000 ppm. | ||
3.3. Analysis of the high catalytic performance of Au/TiO2-PD
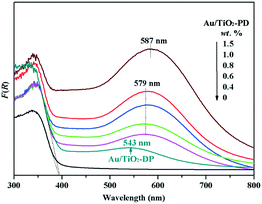
To explore the reason for the difference in the photo-promoted effect of the Au/TiO2-PD and Au/TiO2-DP samples, UV-vis DRS was used to analyze the visible light absorption performance of the Au/TiO2-PD and Au/TiO2-DP samples (Fig. 5). Both TiO2 and Au/TiO2 samples had intrinsic absorption peaks of TiO2 in the ultraviolet region; after loading with Au, there was a new absorption peak for the Au/TiO2-PD sample in the visible light region (≥579 nm), which was attributed to the LSPR effect of Au NPs, and as the loading amount increased, the LSPR effect also increased gradually. In contrast, the LSPR effect of the Au/TiO2-DP sample was significantly weaker, and the absorption wavelength of visible light was blue-shifted. This stronger LSPR effect of the Au NPs over Au/TiO2-PD may be the reason that Au/TiO2-PD has a higher surface charge density.Moreover, TiO2 exhibited a weak photocurrent due to visible light excitation caused by the surface defects; after loading Au, the visible light caused the LSPR effect of Au NPs, resulting in an increase in the photocurrent. Fig. 6 shows that the photocurrent response of the Au/TiO2-PD sample was more obvious than that of the Au/TiO2-DP and TiO2 samples, indicating that the charge transfer effect of Au/TiO2-PD was higher. It also indicated that the LSPR effect of the Au NPs caused by visible light played a decisive role in the electron transfer between Au and TiO2.
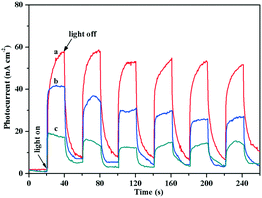 | ||
| Fig. 6 Transient photocurrent responses of (a) Au/TiO2-PD, (b) Au/TiO2-DP, and (c) TiO2 samples under visible light irradiation. | ||
The XPS spectra were obtained to further study the composition of the surface elements and the chemical valence states of the Au/TiO2-PD and Au/TiO2-DP samples. It could be seen that fresh Au/TiO2-PD has two characteristic peaks of Au 4f located at 83.04 and 86.69 eV, which were assigned to the binding energy of 4f7/2 and 4f5/2 for Au0 (Fig. 7a). It was lower than the standard binding energy (84.0 and 87.7 eV)42 because the Fermi level of TiO2 was higher than that of Au NPs. The electrons in the defect sites of TiO2 surface would transfer to the surface of Au NPs, resulting in the increased electron density of Au and the formation of a new Fermi level at the same time. After the dark reaction, the binding energy of Au 4f shifted negatively, indicating that the electron density on the surface of the Au NPs further increased. This was because when CO were adsorbed on the Au atoms, the C atoms in the CO molecules provided electron pairs to form covalent coordination bonds with the empty orbitals of Au atoms, resulting in an increase in the electron density on the surface of the Au NPs. Meanwhile, the negative charge enriched on the Au atoms would feed back the π* bond to the CO molecules; the synergistic effect of the two also promoted the stable adsorption of CO on the Au atoms. For the fresh Au/TiO2-DP sample, the characteristic peaks of Au0 4f7/2 and Au0 4f5/2 were located at 83.17 and 86.84 eV, respectively. After the dark reaction, the binding energy of Au 4f was only slightly negatively shifted, indicating that Au NPs and TiO2 had different modes of action, which had a significant impact on the electron density on the surface of the Au NPs, and also affected the adsorption of CO on the Au NPs and the electron transfer.
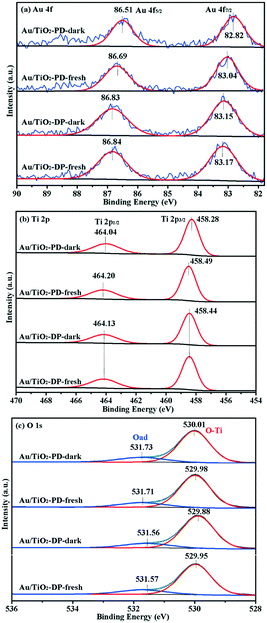 | ||
| Fig. 7 The XPS spectra of Au/TiO2-PD and Au/TiO2-DP samples: (a) Au 4f, (b) Ti 2p, and (c) O 1s. Here, fresh denotes the fresh sample, and dark denotes the sample after reaction under dark. | ||
For the Ti 2p spectra (Fig. 7b), the Au/TiO2-PD sample showed two peaks at 458.49 and 464.20 eV, which were attributed to the spin-orbit peaks of Ti 2p3/2 and Ti 2p1/2,43 respectively; after the dark reaction, the location of the electron binding energy showed a negative shift. For the Au/TiO2-DP sample, the Ti 2p peaks appeared at electron binding energies of 458.44 and 464.13 eV, which could also be attributed to Ti 2p3/2 and Ti 2p1/2, respectively, but there was no negative shift in the electron binding energy after the dark reaction. The negative shift in the electron binding energy indicated that there was electron transfer to Ti4+ on the surface of TiO2. On the one hand, the electron came from the electron transfer on Ti4+–CO (CO was adsorbed on Ti4+ through the σ-bond or electrostatic interaction).6 On the other hand, too many electrons accumulated on the Au NPs would also transfer to the conduction band of TiO2 through the interface of Au and TiO2. The test results also showed that the electron transfer trend of the Au/TiO2-PD samples was more obvious.
The XPS spectra of O 1s is shown in Fig. 7c; the peak located at 529.87–530.01 eV was attributed to the lattice oxygen (Ti–O), and the peak located at 531.56–531.71 eV was attributed to the surface adsorbed oxygen (Oad).12,44 The fitting results are listed in Table 1; compared with the Au/TiO2-DP sample, the fresh Au/TiO2-PD sample had more lattice oxygen but less surface adsorbed oxygen, which was because after the later heat treatment, the surface adsorbed species were significantly reduced, while the Au/TiO2-DP sample only dried at a low temperature, and still had more –OH on the surface of it. Meanwhile, there were much more oxygen vacancies in Au/TiO2-DP (the EPR test results were proved), and O2 forms an O2− adsorbed state after adsorbing on the oxygen vacancies;45 the electron-rich oxygen vacancies might be the reason for the lower binding energy of its lattice oxygen. After the dark reaction, lattice oxygen was temporarily “missing” due to its participation in the reaction, and the lattice oxygen of the Au/TiO2-PD sample decreased more obviously than Au/TiO2-DP; the adsorbed oxygen increased more, indicating that the Au/TiO2-PD sample had more lattice oxygen participating in the reaction, and more O2 were adsorbed and activated at the same time, which might be one of the reasons for the better activity.
| Samples | O–Ti | Oad | Oad/O–Ti | ||
|---|---|---|---|---|---|
| Binding energy (eV) | Area (a.u.) | Binding energy (eV) | Area (a.u.) | ||
| Au/TiO2-PD-fresh | 529.98 | 287![[thin space (1/6-em)]](https://www.rsc.org/images/entities/char_2009.gif) 568 568 |
531.71 | 49404 | 0.17 |
| Au/TiO2-PD-dark | 530.01 | 275![[thin space (1/6-em)]](https://www.rsc.org/images/entities/char_2009.gif) 306 306 |
531.73 | 56030 | 0.20 |
| Au/TiO2-DP-fresh | 529.95 | 285![[thin space (1/6-em)]](https://www.rsc.org/images/entities/char_2009.gif) 023 023 |
531.57 | 57292 | 0.20 |
| Au/TiO2-DP-dark | 529.88 | 274![[thin space (1/6-em)]](https://www.rsc.org/images/entities/char_2009.gif) 801 801 |
531.56 | 59610 | 0.22 |
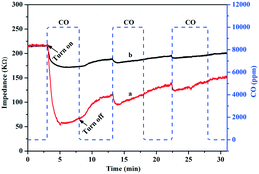
According to the boundary adsorption theory, electron transfer could occur when the gas molecule was adsorbed on the surface of the semiconductor; when the surface state energy level of the gas molecules is higher than the Fermi level of the semiconductor, the adsorbed gas molecules can act as the electron donors to transfer electrons to the semiconductor. Conversely, the adsorbed gas molecules can act as electron acceptors to receive electrons from the semiconductor. Wang and co-workers confirmed these electron transfer behaviors by CO adsorption on WO3 and CuWO4/WO3 with a gas sensitivity test.46 For CO adsorbed on Au/TiO2, the electrons transferred from CO to the surface of Au NPs over the Au/TiO2-PD and Au/TiO2-DP samples could also be confirmed by the CO gas sensitivity (Fig. 8). After passing CO gas into the test chamber, the impedance on the surface of the Au/TiO2-PD and Au/TiO2-DP samples significantly decreased, proving that CO transferred electrons to the Au NPs when it was adsorbed on the surface of the samples. After the CO reaction gas was turned off, the impedance appeared to increase, and the change in the impedance became significantly smaller after passing CO gas intermittently, indicating that the adsorption of CO tended to “saturation”, and the electron transfer was gradually in dynamic equilibrium. Furthermore, it could also be found that the CO gas response of Au/TiO2-PD was more sensitive than Au/TiO2-DP, which illustrated that Au/TiO2-PD had a stronger ability to adsorb and activate CO, and CO could transfer more electrons to the Au/TiO2 sample. Apparently, the adsorbed CO would be easily oxidized to CO2 due to its pre-oxidation (lost electrons) over Au/TiO2-PD.
During the process of oxidizing CO, the adsorption and activation of O2 may be a key factor. It was reported that the adsorbed O2 traps electrons in the conduction band of TiO2 to form free radicals O2−, which could be observed by the EPR test,47 and the EPR signal strength was positively correlated with the quantity changes of O2−. Therefore, the adsorption and activation of O2 molecules on the catalyst could be reflected according to this change feature. At the room temperature, Hu and coworkers believed that O2 molecules were not easy to directly activate and dissociate into oxygen atoms at the Au site;48 the dissociation energy of O2 molecules on Au NPs (step points) was at least 0.93 eV via calculation. The dissociation energy at the Au–TiO2 interface drops to 0.52 eV, which was also reported in the literature.49 Liu and co-workers found that the surface lattice oxygen of the Au/TiO2 catalyst was not easy to directly exchange with the O atoms in the O2 molecule but it acted as a supplementary “oxygen source” after CO reacted with the lattice oxygen through the oxygen isotope exchange experiment,50 which also proved that the adsorption activation of O2 molecules was directly related to the conversion efficiency of CO.
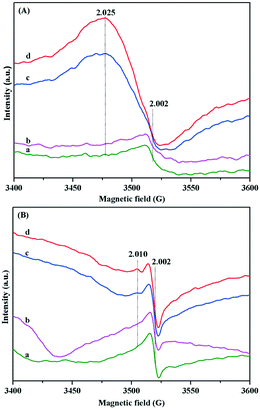
Based on the above results, the adsorption activation of O2 on the surface of Au/TiO2-PD and Au/TiO2-DP samples and the change after O2 adsorption were investigated by in situ EPR. The sample was pretreated at 220 °C for 1 h and continued even in evacuation. After cooling to room temperature, the test was carried out immediately. Both the Au/TiO2-PD and Au/TiO2-DP samples had the peak located at g = 2.002, which was attributed to the oxygen vacancy.51 For Au/TiO2-PD (Fig. 9A), it had a weak and asymmetric oxygen vacancy signal peak after evacuation, and the signal did not change significantly, followed by the injection of O2 but a strong signal peak occurred at g = 2.025 when injected of CO, which was attributed to the rearrangement of the activated O2− on Ti4+,41 and its signal was further enhanced with the introduction of visible light, indicating that the LSPR effect of the Au NPs increased the surface charge density and promoted the generation of more O2− under the excitation of visible light. For Au/TiO2-DP (Fig. 9B), the signal peak of the oxygen vacancy was strong and symmetrical but it was significantly weaker after O2 was injected. After the subsequent injection of CO, the signal with g = 2.002 was re-enhanced, and a weak rearranged signal peak appeared at g = 2.010, which also increased with the introduction of visible light. The experimental results showed that O2 was not easily activated directly in the absence of CO but after CO was adsorbed on Au, the formation of the covalent bond induced the enrichment of electrons in Au NPs, which promoted the adsorption and activation of O2 at the interface. Moreover, after CO reacted with the lattice oxygen at the interface of Au–TiO2 and the product CO2 was desorbed, new oxygen vacancies would form at the interface, which could further promote the activation of O2 at the Au–TiO2 interface to form the Au–O species.52 Comparing the difference in the intensity of the signal, it could also be found that the activation capacity of Au/TiO2-PD for O2 was stronger than that of Au/TiO2-DP, which further caused the superior activity of Au/TiO2-PD.
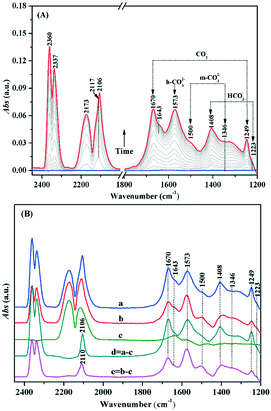
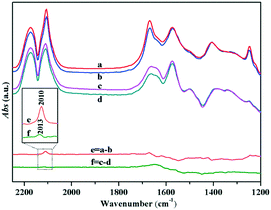
Similarly, the adsorption and activation of CO may also be another key factor during the process of CO oxidation. In situ DRIFTS was used for understanding the chemical adsorption characteristics of CO and the reaction mechanism on the Au/TiO2-PD and Au/TiO2-DP samples. As shown in Fig. 10A, after CO adsorption on the surface of Au/TiO2-PD under dark, the peaks at 2117 and 2173 cm−1 were assigned to the stretching vibration of the gas phase CO molecules;53–55 those at 1670 and 1249 cm−1 could be assigned to the carboxylate (CO2−) of the intermediate species. This CO2− would be quickly transferred into CO2, for which the asymmetric stretching vibration of CO2 molecules were observed at 2360 and 2337 cm−1.56 In addition, the observed monodentate carbonate (m-CO32−) at 1573 cm−1, and 1500 and 1346 cm−1 and the observed bicarbonates (HCO3−) at 1408 and 1223 cm−1, respectively,44,57,58 which means that the intermediate CO2− could be transformed into bidentate coordination carbonate (b-CO32−) deposited on the TiO2 surface.6 Moreover, the peak located at 1643 cm−1 may be originated from the bending vibration of the chemisorbed water on the TiO2 surface (δHOH). For Au/TiO2-DP, the vibrational peaks of b-CO32− and HCO3− were blue-shifted to 1577 and 1412 cm−1 after CO adsorption, respectively. The intensity of the CO2 vibration peak was weak, and the ability of CO oxidation was poor (Fig. 10B). It could also be found that there was only the stretching vibration of gas phase CO on the surface of pure TiO2 when it adsorbed CO, which proved that CO oxidation could not occur on the surface of pure TiO2. Furthermore, the absorption spectrum of CO adsorbed on Au NPs could be obtained by curve “d” and curve “e”; the peak at 2106 cm−1 was assigned to the linear adsorption of CO on Au(110) on the surface of Au/TiO2-PD,6,11,59,60 while it blue-shifted to 2110 cm−1 on the surface of Au/TiO2-DP and the strength was weak,61 which also revealed that the Au NPs loaded by the PD method had a higher electron density than that of the DP method.
The in situ DRIFTS of the Au/TiO2-PD and Au/TiO2-DP samples after CO adsorption, followed by the injection of the O2–He mixture gas (Fig. 11). Both the samples could quickly convert CO after O2 was injected; it only took about 192 s for Au/TiO2-PD to completely convert CO, while it took about 240 s for Au/TiO2-DP, indicating that Au/TiO2-PD had a higher CO conversion efficiency. In addition, the spectral signal of the intermediate species was rapidly enhanced but started to attenuate when it reached the maximum (the green curve in Fig. 11). At this time, the content of gas phase CO was less, and the overall performance was the desorption process of the intermediate species into CO2. But, after passing O2 for 20 min, the signal of the intermediate species was basically no longer attenuated, indicating that some intermediate species could not be completely desorbed at the room temperature. Moreover, comparing the attenuation degree of the infrared adsorption peak intensity of the surface species on the two samples could confirm that the adsorbed species on the surface of Au/TiO2-PD was easier to desorb. It was worth noting that the peaks of b-CO32− for Au/TiO2-PD and Au/TiO2-DP were respectively red-shifted from 1573 and 1577 cm−1 to 1565 and 1570 cm−1 after passing O2, respectively; the possible reason was that the oxygen vacancy was formed when CO consumed O2 at the interface of the catalyst during the oxidation process, while b-CO32− adsorbed on the oxygen vacancy would form bidentate coordination. After passing O2–He, O2 was adsorbed and activated at the interface and the supplement oxygen defects, resulting in a change in the adsorption position of b-CO32−.
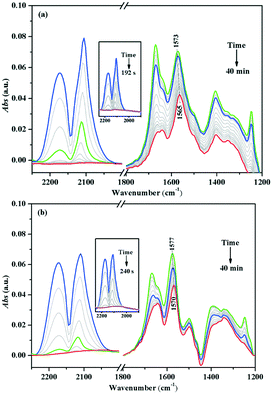 | ||
| Fig. 11 In situ DRIFTS of (a) Au/TiO2-PD and (b) Au/TiO2-DP samples after adsorbing CO and switching to the O2–He mixture gas, and the complete conversation of CO (inset) at room temperature. | ||
Due to the LSPR effect of Au NPs, the Au surface would have extra electrons, resulting in promotion of the chemical adsorption of CO on Au NPs under visible light irradiation (Fig. 12). Meanwhile, the introduction of visible light also enhanced the carboxylate vibration band, which might be due to the enhancement of CO adsorption promoting its reaction with the lattice oxygen at the interface of Au–TiO2 to generate more [Ti4+–OCO–]. Furthermore, a blue shift had occurred in the infrared absorption spectrum of CO adsorbed on the Au NPs under visible light irradiation, which might also be because of the increase in the surface electron density of Au NPs, which induced some oxygen atoms (generated after dissociating the supplement lattice oxygen on the oxygen vacancies) to co-adsorb with CO at the corner of Au NPs (CO–Auδ+–Oδ−).27 Note that some surplus electrons on the Au surface would transfer to the conduction band of TiO2 under visible light irradiation, which resulted in an increase in the surface electron density of TiO2,62 and caused the infrared absorption background to increase and be uplifted (Fig. 12). These rich electrons at TiO2 may benefit the adsorption of oxygen molecule (Fig. 9).
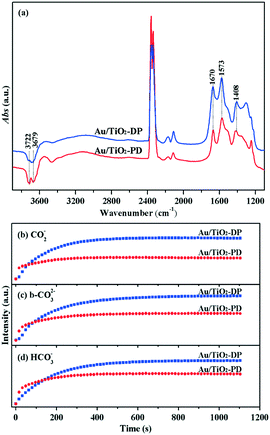
The conversion rate of the intermediate species is the rate-limiting step of the CO oxidation process.63 In order to simulate the change characteristics of the intermediate species in the activity test experiment, the CO/O2 mixture gas was injected into the Au/TiO2-PD and Au/TiO2-DP samples. The corresponding in situ DRIFTS images and the curves of the intensity of the main intermediate species versus time are given (Fig. 13). It could be found that CO2 exhibited strong infrared adsorption in the presence of O2, indicating that CO could be quickly oxidized to CO2. Moreover, the hydroxyl consumption peaks could be observed at 3722 and 3679 cm−1,57 indicating that it was oxidized to H2O and then H2O was also involved in the oxidation process of CO. From Fig. 13b–d, it was found that the infrared absorption intensity of the intermediate species (such as carboxylate, carbonate, and bicarbonate) on the surface of Au/TiO2-PD maintained a low intensity and stable state after a rapid increase, while Au/TiO2-DP maintained a relatively high intensity and stable state after a slow increase, indicating that Au/TiO2-PD had faster CO adsorption and activation ability than Au/TiO2-DP in the co-existence of CO and O2, and had the ability to generate and transform the intermediate species more quickly, which further proved the superiority of the in situ PD method.
The TPD-MS online test could obtain the desorption temperature of CO (Fig. 14a) and CO2 (Fig. 14b), and compare the difference in the CO adsorption and conversion performance of the Au/TiO2-PD and Au/TiO2-DP samples. Fig. 14 showed the TPD-MS results of the Au/TiO2-PD and Au/TiO2-DP samples with adsorbed CO under dark or visible light irradiation. For Au/TiO2-PD, the desorption temperatures of CO and CO2 were about 80 °C and 85 °C, respectively, while the desorption temperatures of CO and CO2 were about 100 °C for Au/TiO2-DP. However, the intensity of the desorption peak of Au/TiO2-PD was stronger than that of Au/TiO2-DP, indicating that the desorption amount of Au/TiO2-PD was greater. It could also be found that the desorption peaks of CO and CO2 for Au/TiO2-PD and Au/TiO2-DP become stronger after CO adsorption under visible light irradiation, which further indicated that the adsorption and conversion of CO on Au NPs was promoted by visible light irradiation.
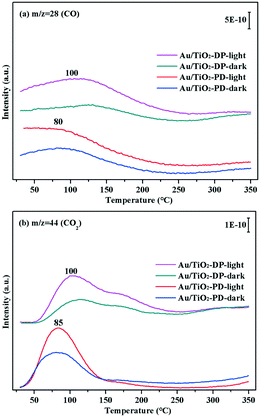 | ||
| Fig. 14 The TPD-MS results of Au/TiO2-PD and Au/TiO2-DP samples after adsorbing CO under visible light irradiation and dark conditions, recorded masses were 28 (CO) (a) and 44 (CO2) (b). | ||
3.4. Possible mechanism of Au/TiO2 catalytic oxidation of CO under visible light irradiation
Based on the above results, and combined with the mechanism of CO thermal catalytic oxidation,55,64 the possible reaction mechanism of CO oxidation over Au/TiO2-PD and Au/TiO2-DP under visible light irradiation was proposed. | (1) |
| O–Ti–VO⋯Auδ− → O–Ti–VO(e−)⋯Au | (2) |
| O–Ti–O⋯Auδ− + CO → O–Ti–O⋯Auδ−–CO | (3) |
 | (4) |
 | (5) |
 | (6) |
 | (7) |
The activated CO molecules reacted with OH adsorbed on the surface of Au NPs to form –COOH. Then, –COOH further reacted with the lattice oxygen to generate HCO3− (Process (8)).67
 | (8) |
Process (2) of the oxygen vacancy-captured electrons also occurred on the new generated oxygen vacancy, which promoted the adsorption of O2 at this oxygen vacancy to form the adsorbed O2− species. O2− offered one oxygen atom to generate a new lattice oxygen of TiO2 and form the other oxygen atom with the electron (Process (9)). This O− species might overflow to the adjacent Au atom with excited holes (Process (10)), and reacted quickly with CO adsorbed at Auδ− to form CO2 (Process (11)).68,69
| O–Ti–VO(e−)⋯Au + O2 → O–Ti–O2−⋯Au → O–Ti–O⋯Au + O− | (9) |
| Auδ+ + O− → Au–O | (10) |
| O–Ti–O⋯Auδ−–CO + Au–O → Au + O–Ti–O⋯Auδ− + CO2 | (11) |
This above reaction process could be understood by the Mars–van-Krevelen (MvK) mechanism.65 During this process, the CO molecules did not directly react with the O2 molecules because O2 molecules have high dissociation energy on Au NPs at the room temperature. It is not easy to directly activate and dissociate into oxygen atoms.66 It is the LSPR-promoted recycling between the lattice oxygen and oxygen vacancy that plays a key role in CO oxidation. Au NPs in Au/TiO2-PD exhibited a higher electron density than that of Au/TiO2-DP induced by the LSPR effect, resulting in the more activation of CO and O2, and Au/TiO2-PD showed a higher reaction activity than Au/TiO2-DP.
The above reaction processes showed that the electron density on the surface of the Au NPs increased after Au/TiO2 absorbed visible light through the LSPR effect, which promoted the adsorption and oxidation of CO. Meanwhile, the rapid CO conversion with lattice oxygen also promoted the activation and dissociation of the adsorbed oxygen, which further improved the efficiency of CO oxidation. This work showed that the smaller Au NPs not only provided more active sites but also had higher surface electron density to active CO, especially under visible light irradiation.
4. Conclusions
In this work, a TiO2-supported Au NPs sample (Au/TiO2-PD) was prepared by the mild in situ photodeposition method with TiO2(EG) precursor. Compared with the Au/TiO2-DP sample prepared by the traditional DP method, Au/TiO2-PD had a smaller size of Au NPs, and exhibited a higher catalytic activity of CO oxidation in the dark. Visible light could enhance CO oxidation on both the samples but Au/TiO2-PD exhibited a higher light-assisted catalytic activity. It is showed that the visible light-induced LPSR effect of the Au NPs could enhance the surface electron density of the Au NPs, which benefited CO adsorption at the Au site. This adsorbed CO would interact with the lattice oxygen of TiO2 to form the oxygen vacancy, while O2 would remedy the oxygen vacancy to regenerate lattice oxygen. The Au NPs in Au/TiO2-PD exhibited a higher electron density than that of Au/TiO2-DP induced by the LSPR effect, resulting in the greater activation of CO and O2, and Au/TiO2-PD showed a higher reaction activity than Au/TiO2-DP. This work showed that the smaller Au NPs not only provided more active sites but also had higher surface electron density toward active CO, especially under visible light irradiation.Conflicts of interest
There are no conflicts to declare.Acknowledgements
This work was financially supported by the National Natural Science Foundation of China (no. 21872030) and Key Program of Qingyuan Innovation Laboratory (Grant No. 00121001).Notes and references
- J. C. Amphlett, R. F. Mann and B. A. Peppley, Int. J. Hydrogen Energy, 1996, 21, 673–678 CrossRef CAS.
- H. F. Oetjen, V. M. Schmidt, U. Stimming and F. Trila, J. Electrochem. Soc., 1996, 143, 3838–3842 CrossRef CAS.
- M. Anpo and J. M. Thomas, Chem. Commun., 2006, 3273–3278 RSC.
- T. Kamegawa, J. Morishima, M. Matsuoka, J. M. Thomas and M. Anpo, J. Phys. Chem. C, 2007, 111, 1076–1078 CrossRef CAS.
- M. Haruta, N. Yamada, T. Kobayashi and S. Iijima, J. Catal., 1989, 115, 301–309 CrossRef CAS.
- P. Konova, A. Naydenov, C. Venkov, D. Mehandjiev, D. Andreeva and T. Tabakova, J. Mol. Catal. A: Chem., 2004, 213, 235–240 CrossRef CAS.
- J. H. Yang, J. D. Henao, M. C. Raphulu, Y. Wang, T. Caputo, A. J. Groszek, M. C. Kung, M. S. Scurrell, J. T. Miller and H. H. Kung, J. Phys. Chem. B, 2005, 109, 10319–10326 CrossRef CAS PubMed.
- X. Q. Deng, B. Zhu, X. S. Li, J. L. Liu, X. Zhu and A. M. Zhu, Appl. Catal., B, 2016, 188, 48–55 CrossRef CAS.
- C. D. Powell, A. W. Daigh, M. N. Pollock, B. D. Chandler and C. J. Pursell, J. Phys. Chem. C, 2017, 121, 24541–24547 CrossRef CAS.
- J. Saavedra, C. Powell, B. Panthi, C. J. Pursell and B. D. Chandler, J. Catal., 2013, 307, 37–47 CrossRef CAS.
- Q. Yao, C. Wang, H. Wang, H. Yan and J. Lu, J. Phys. Chem. C, 2016, 120, 9174–9183 CrossRef CAS.
- S. Zhang, X. S. Li, B. Zhu, J. L. Liu, X. B. Zhu, A. M. Zhu and B. W. L. Jang, Catal. Today, 2015, 256, 142–147 CrossRef CAS.
- H. P. Zhou, H. S. Wu, J. Shen, A. X. Yin, L. D. Sun and C. H. Yan, J. Am. Chem. Soc., 2010, 132, 4998–4999 CrossRef CAS PubMed.
- M. Daté, Y. Ichihashi, T. Yamashita, A. Chiorino, F. Boccuzzi and M. Haruta, Catal. Today, 2002, 72, 89–94 CrossRef.
- A. I. Kozlov, A. P. Kozlova, H. Liu and Y. Iwasawa, Appl. Catal., A, 1999, 182, 9–28 CrossRef CAS.
- H. Wu and L. Wang, Catal. Commun., 2011, 12, 1374–1379 CrossRef CAS.
- Y. Nobutada, K. Naoto, M. Hiroki, M. Toshiaki and E. Koichi, Catal. Today, 2011, 164, 169–175 CrossRef.
- Q. Fu, H. Saltsburg and M. Flytzani-Stephanopoulos, Science, 2003, 301, 935–938 CrossRef CAS.
- M. Valden, X. Lai and D. W. Goodman, Science, 1998, 281, 1647–1650 CrossRef CAS.
- M. Haruta, Chem. Rec., 2003, 3, 75–87 CrossRef CAS.
- P. Claus, A. Brückner, C. Mohr and H. Hofmeister, J. Am. Chem. Soc., 2000, 122, 11430–11439 CrossRef CAS.
- Y. J. Chen and C. Yeh, J. Catal., 2001, 200, 59–68 CrossRef CAS.
- G. R. Bamwenda, S. Tsubota, T. Nakamura and M. Haruta, Catal. Lett., 1997, 44, 83–87 CrossRef CAS.
- C. Galletti, S. Fiorot, S. Specchia, G. Saracco and V. Specchia, Chem. Eng. J., 2007, 134, 45–50 CrossRef CAS.
- M. Okumura, S. Nakamura, S. Tsubota, T. Nakamura, M. Azuma and M. Haruta, Catal. Lett., 1998, 51, 53–58 CrossRef CAS.
- L. Chang, Y. Yeh and Y. Chen, Int. J. Hydrogen Energy, 2008, 33, 1965–1974 CrossRef CAS.
- F. Boccuzzi, A. Chiorino, M. Manzoli, P. Lu, T. Akita, S. Ichikawa and M. Haruta, J. Catal., 2001, 202, 256–267 CrossRef CAS.
- Y. F. Yang, P. Sangeetha and Y. W. Chen, Int. J. Hydrogen Energy, 2009, 34, 8912–8920 CrossRef CAS.
- W. Dai, X. Chen, X. Wang, P. Liu, D. Li, G. Li and X. Fu, Phys. Chem. Chem. Phys., 2008, 10, 3256–3262 RSC.
- K. Yang, C. Meng, L. Lin, X. Peng, X. Chen, X. Wang, W. Dai and X. Fu, Catal. Sci. Technol., 2015, 6, 829–839 RSC.
- K. Yang, K. Huang, Z. He, X. Chen, X. Fu and W. Dai, Appl. Catal., B, 2014, 158–159, 250–257 CAS.
- K. Yang, Y. Li, K. Huang, X. Chen, X. Fu and W. Dai, Int. J. Hydrogen Energy, 2014, 39, 18312–18325 CrossRef CAS.
- W. Dai, X. Zheng, H. Yang, X. Chen, X. Wang, P. Liu and X. Fu, J. Power Sources, 2009, 188, 507–514 CrossRef CAS.
- J. Liu, R. Si, H. Zheng, Q. Geng, W. Dai, X. Chen and X. Fu, Catal. Commun., 2012, 26, 136–139 CrossRef CAS.
- K. Yang, C. Meng, L. Lin, X. Peng, X. Chen, X. Wang, W. Dai and X. Fu, Catal. Sci. Technol., 2015, 6, 829–839 RSC.
- K. Yang, J. Liu, R. Si, X. Chen, W. Dai and X. Fu, J. Catal., 2014, 317, 229–239 CrossRef CAS.
- Y. Zhang, Q. Li, C. Liu, X. Shan, X. Chen, W. Dai and X. Fu, Appl. Catal., B, 2018, 224, 283–294 CrossRef CAS.
- L. S. Zhong, J. S. Hu, A. M. Cao, Q. Liu, W. G. Song and L. J. Wan, Chem. Mater., 2007, 19, 1648–1655 CrossRef CAS.
- M. Anpo and Y. Kubokawa, Rev. Chem. Intermed., 1987, 8, 105–124 CrossRef CAS.
- M. Anpo and M. Sunamoto, J. Phys. Chem., 1989, 93, 1187–1189 CrossRef CAS.
- P. Liu, Y. Zhao, R. Qin, S. Mo, G. Chen, L. Gu, D. M. Chevrier, P. Zhang, Q. Guo, D. Zang, B. Wu, G. Fu and N. Zheng, Science, 2016, 352, 797–800 CrossRef CAS.
- J. D. Grunwaldt, M. Maciejewski, O. S. Becker, P. Fabrizioli and A. Baiker, J. Catal., 1999, 186, 458–469 CrossRef CAS.
- Q. Zhu, Y. Peng, L. Lin, C. M. Fan, G. Q. Gao, R. X. Wang and A. W. Xu, J. Mater. Chem. A, 2014, 2, 4429–4437 RSC.
- L. Liu, X. Gu, Y. Cao, X. Yao, L. Zhang, C. Tang, F. Gao and L. Dong, ACS Catal., 2013, 3, 2768–2775 CrossRef CAS.
- M. Y. Xing, B. X. Yang, H. Yu, B. Z. Tian, S. Bagwasi, J. L. Zhang and X. Q. Gong, J. Phys. Chem. Lett., 2013, 4, 3910–3917 CrossRef CAS.
- Z. Wang, X. Wang, H. Wang, X. Chen, W. Dai and X. Fu, Appl. Catal., B, 2020, 265, 118588 CrossRef CAS.
- F. Zuo, L. Wang, T. Wu, Z. Zhang, D. Borchardt and P. Feng, J. Am. Chem. Soc., 2010, 132, 11856–11857 CrossRef CAS.
- Z. P. Liu and P. Hu, J. Am. Chem. Soc., 2002, 124, 14770–14779 CrossRef CAS PubMed.
- Z. P. Liu, X. Q. Gong, J. Kohanoff, C. Sanchez and P. Hu, Phys. Rev. Lett., 2003, 91, 266102 CrossRef.
- H. Liu, A. I. Kozlov, A. P. Kozlova, T. Shido, K. Asakura and Y. Iwasawa, J. Catal., 1999, 185, 252–264 CrossRef CAS.
- D. Windmann and R. J. Behm, Acc. Chem. Res., 2014, 47, 740–749 CrossRef.
- J. Zhang, H. Wang, L. Wang, S. Ali, C. Wang, L. Wang, X. Meng, B. Li, D. S. Su and F.-S. Xiao, J. Am. Chem. Soc., 2019, 141, 2975–2983 CrossRef CAS.
- B. Schumacher, Y. Denkwitz, V. Plzak, M. Kinne and R. J. Behm, J. Catal., 2004, 224, 449–462 CrossRef CAS.
- P. Kast, G. Kučerová and R. J. Behm, Catal. Today, 2015, 244, 146–160 CrossRef CAS.
- F. Boccuzzi and A. Chiorino, J. Phys. Chem. B, 2000, 104, 5414–5416 CrossRef CAS.
- Y. Denkwitz, B. Schumacher, G. Kučerová and R. J. Behm, J. Catal., 2009, 267, 78–88 CrossRef CAS.
- Y. Denkwitz, M. Makosch, J. Geserick, U. Hörmann, S. Selve, U. Kaiser, N. Hüsing and R. J. Behm, Appl. Catal., B, 2009, 91, 470–480 CrossRef CAS.
- L. Liu, Y. Jiang, H. Zhao, J. Chen, J. Cheng, K. Yang and Y. Li, ACS Catal., 2016, 6, 1097–1108 CrossRef CAS.
- D. A. Panayotov, S. P. Burrows, J. T. Yates and J. R. Morris, J. Phys. Chem. C, 2011, 115, 22400–22408 CrossRef CAS.
- S. Derrouiche, P. Gravejat and D. Bianchi, J. Am. Chem. Soc., 2004, 126, 13010–13015 CrossRef CAS.
- I. X. Green, W. Tang, M. McEntee, M. Neurock and J. T. Yates, J. Am. Chem. Soc., 2012, 134, 12717–12723 CrossRef CAS.
- A. Aiboushev, F. Gostev, I. Shelaev, A. Kostrov, A. Kanaev, L. Museur, M. Traore, O. Sarkisova and V. Nadtochenko, Photochem. Photobiol. Sci., 2013, 12, 631–637 CrossRef CAS.
- Y. Zhang, J.-X. Liu, K. Qian, A. Jia, D. Li, L. Shi, J. Hu, J. Zhu and W. Huang, Angew. Chem., 2021, 60, 12074–12081 CrossRef CAS PubMed.
- J. D. Henao, T. Caputo, J. H. Yang, M. C. Kung and H. H. Kung, J. Phys. Chem. B, 2006, 110, 8689–8700 CrossRef CAS PubMed.
- P. Schlexer, D. Widmann, R. J. Behm and G. Pacchioni, ACS Catal., 2018, 8, 6513–6525 CrossRef CAS.
- Z. Duan and G. Henkelman, ACS Catal., 2018, 8, 1376–1383 CrossRef CAS.
- T. Fujitani, I. Nakamura and M. Haruta, Catal. Lett., 2014, 144, 1475–1486 CrossRef CAS.
- I. X. Green, W. Tang, M. Neurock and J. T. Yates, Jr., Science, 2011, 333, 736–739 CrossRef CAS PubMed.
- J. Saavedra, C. J. Pursell and B. D. Chandler, J. Am. Chem. Soc., 2018, 140, 3712–3723 CrossRef CAS.
Footnote |
| † Electronic supplementary information (ESI) available. See DOI: 10.1039/d1cy01829a |
| This journal is © The Royal Society of Chemistry 2022 |


