In–Co–Zn/C–N catalysts derived from ZIFs for selective hydrogenation of CO2 into methanol†
Bing
Liu
 *,
Tingfeng
Fang
and
Yumei
He
Key Laboratory of Catalysis and Energy Materials Chemistry of Ministry of Education & Hubei Key Laboratory of Catalysis and Materials Science, South-Central University for Nationalities, Wuhan 430074, China. E-mail: liubing@mail.scuec.edu.cn; Fax: +86 27 67842572; Tel: +86 27 67842572
First published on 20th November 2021
Abstract
Recently, In2O3-based catalysts have shown great promise in methanol synthesis from CO2 hydrogenation due to their high methanol selectivity. However, low CO2 conversion restricts their application. Herein, we report In2O3 combined with zeolitic imidazolate framework (ZIF)-derived Co–Zn/C–N catalysts for the CO2 hydrogenation reaction in a fixed-bed reactor. The catalysts were characterized by X-ray diffractometry, transmission electron microscopy, CO2 and H2 temperature desorption measurements, X-ray photoelectron spectroscopy, and in situ diffuse reflectance infrared Fourier transform spectroscopy. Compared to pure In2O3, In–Co–Zn/C–N-4 (PM) shows higher CO2 conversion, with even higher methanol selectivity. A CO2 conversion of 7.0% was achieved with a methanol selectivity over 77% and the space time yield (STY) of methanol was 3.3 mmol gcat−1 h−1 under the conditions of H2/CO2 = 3![[thin space (1/6-em)]](https://www.rsc.org/images/entities/char_2009.gif) :
:![[thin space (1/6-em)]](https://www.rsc.org/images/entities/char_2009.gif) 1, 2 MPa, 300 °C and GHSV = 6 L gcat−1 h−1. The In–Co–Zn/C–N-4 (IMP) catalyst shows much lower methanol selectivity (46.6%) and stability due to the formation of Co3InC0.75. ZnO effectively weakens the interactions between Co and In, and the physically-mixed method further prevents the formation of Co3InC0.75. DRIFTS results were used to predict the possible methanol and CO production pathway through a formate intermediate for the In–Co–Zn/C–N catalyst.
1, 2 MPa, 300 °C and GHSV = 6 L gcat−1 h−1. The In–Co–Zn/C–N-4 (IMP) catalyst shows much lower methanol selectivity (46.6%) and stability due to the formation of Co3InC0.75. ZnO effectively weakens the interactions between Co and In, and the physically-mixed method further prevents the formation of Co3InC0.75. DRIFTS results were used to predict the possible methanol and CO production pathway through a formate intermediate for the In–Co–Zn/C–N catalyst.
1. Introduction
Methanol synthesis from CO2 hydrogenation has recently attracted significant attention.1 However, the preparation of highly active and stable catalysts for CO2 hydrogenation into methanol is a key problem to solve. Catalyst research mainly focuses on two categories, i) metal-based catalysts, including modified Cu (ref. 2) and noble metals such as Au,3 Pd (ref. 4) and Pt,5 and ii) metal oxide catalysts with oxygen vacancies, such as In2O3 (ref. 6) and CeO2.7 Co-Based catalysts have been widely investigated in the Fischer–Tropsch synthesis reaction. Although CO2 conversion is quite high on Co-based CO2 hydrogenation catalysts, the main product is methane due to its strong H2 dissociation ability.8| CO2 + 3H2 → CH3OH + H2O, CO2 + 4H2 → CH4 + 2H2O |
Bavykina et al. found that In/Co catalysts show high methanol selectivity. An indium oxide surface shows enriched oxygen vacancies upon the addition of Co, which are thought to be the active sites of In/Co catalysts in selective CO2 conversion into methanol.9,10 We also found that the appropriate proximity of In2O3 and Co/C–N is crucial for methanol synthesis. The impregnated 50% In2O3/Co/C–N catalyst exhibits 88.4% methanol selectivity at 300 °C and 2 MPa.11 Aside from the combining of Co with In2O3, partial oxidation of Co/C–N into Co@Co3O4/C–N also increased methanol selectivity in our previous research. A decrease in surface metallic Co content weakens the H2 dissociation ability of metallic Co. The oxygen vacancies on the Co3O4 surface also promote methanol production.12 In conclusion, how to balance weak CO2 adsorption and strong H2 dissociative adsorption is a key challenge associated with Co-based CO2 hydrogenation catalysts.
Metal–organic frameworks (MOFs), which are made up of metal ions and organic ligands, have been widely explored in various fields, especially electrocatalysis, due to their rich pore structures, high surface area and high thermal and chemical stability.13–16 Among these MOF materials, zeolitic imidazolate frameworks (ZIFs) consisting of metal ions (Zn2+, Co2+) and imidazole are active catalysts for many reactions.17 ZIF materials can also act as precursors to prepare nitrogen-doped porous carbon supported metal or metal oxide catalysts under designed calcination conditions. For instance, Zhou et al. prepared Co/C–N catalysts via the pyrolysis of ZIF-67 for the synthesis of secondary amines.18 Li et al. prepared ZIF-67 derived Co-based porous carbon catalysts with cubic or rhombic dodecahedron morphology for the CO2 methanation reaction.19 Zhou et al. exploited N-doped porous carbon incorporating Co nanoparticles and CoO species for the direct oxidation of alcohols to esters.20
In light of these results, herein we explored ZIF-derived Co–Zn/C–N catalysts with or without In and their activity in methanol synthesis from the CO2 hydrogenation reaction. The production selectivity varies according to different Zn/Co molar ratios. Moreover, the addition of In effectively prevents the production of CO and methane. The effect that the In addition method has on the catalytic performance was also thoroughly studied in detail. The optimized In–Co–Zn/C–N (PM) catalyst demonstrates high stability, where the space time yield (STY) of methanol is 3.3 mmol gcat−1 h−1 (XCO2 = 7.0%, SMeOH = 77.7%) steadily within 50 h at 2 MPa and 300 °C.
2. Experimental section
2.1 Catalyst preparation
The In–Co–Zn/C–N-4 (PM) catalyst was prepared by physical mixing. In2O3 was prepared via the calcination of In(OH)3 as before.19 0.39 g of In2O3 powder was first dispersed in 1.0 mL of deionized water, then added dropwise into 1.5 g of ZIF-67@ZIF-8-4 with grinding. After this, the sample was dried at 100 °C for 10 h and calcined at 600 °C (10 °C min−1) for 5 h under a N2 atmosphere (20 mL min−1). The weight percentage of In was the same as that of the In–Co–Zn/C–N-4 (IMP) catalyst.
2.2 Catalyst characterization
The powder X-ray diffraction (PXRD) patterns were recorded on an automated powder X-ray diffractometer (40 kV, 40 mA, Bruker-D8) using a Cu Kα radiation source (λ = 1.54056 Å) in the range of 10–80° with a step size of 2° min−1.Transmission electron microscopy (TEM) images of the samples were obtained using a FEI Tecnai G220 instrument. The samples are prepared by directly suspending the catalyst in ethanol via ultrasonic treatment. A copper microscope grid covered with perforated carbon was dipped into the solution and then dried.
X-ray photoelectron spectroscopy (XPS) data were recorded on a Thermo VG scientific ESCA MultiLab-2000 spectrometer equipped with a monochromatized Al Kα source (1486.6 eV) at a constant analyzer pass energy of 25 eV. The binding energy was estimated to be accurate to within 0.2 eV. Co 2p, Zn 2p, N 1s and O 1s spectra were acquired, where the C 1s was set at 284.6 eV and taken as a reference for binding energy (BE) calibration. The software XPS PEAK was used to fit the XPS spectra using a mixture of Gaussian and Lorentzian functions in a 40/60 ratio and a Shirley background.
CO2 temperature-programmed desorption (CO2-TPD) measurements were performed using a BELCAT-II instrument from the MicrotracBEL Company. The catalyst was pretreated under a He atmosphere at 300 °C for 30 min and then cooled to 100 °C. Next, the samples were saturated with 10% CO2/He at around 100 °C for 60 min and then flushed with He for 30 min to evacuate the surface adsorbed CO2. Next, the catalyst was heated under a flow of He from 100 °C to 500 °C. Around 50 mg of catalyst was used at a heating rate of 10 °C min−1 and a flow rate of 25 mL min−1. The sample for the H2-TPD experiments were pretreated under an Ar atmosphere, and then the samples were saturated with 10% H2/Ar, where the other experiment conditions were the same as those used in the CO2-TPD measurements.
In situ diffuse reflectance infrared Fourier transform spectroscopy (DRIFTS) was carried out on a Nicolet NEXUS 6700 spectrometer equipped with a liquid nitrogen-cooled mercury cadmium telluride (MCT) detector. The catalyst was pretreated using N2 at 300 °C for 30 min, then cooled to 100 °C at a heating rate of 5 °C min−1 and flow rate of 18 mL min−1. Next, the flow rate was changed to 10 mL min−1 and the background spectrum was scanned at 100 °C. Then, the catalyst was scanned in a flowing reactant gas mixture with a H2/CO2/N2 ratio of 67.5/22.5/10.0 at 10 mL min−1 at 100 °C for 1 h.
After that, the temperature was increased from 100 °C to 300 °C, with each temperature being maintained for 15 min.
2.3 Typical procedure of CO2 hydrogenation
All catalytic tests were performed in a fixed-bed stainless steel mini-reactor (length of 53 cm and inside diameter of 8 mm). A mixed feed gas (22.5% CO2, 67.5% H2 and 10.0% N2) was used without further purification. N2 was added for interior label calculation. The pressure of the reactor was controlled using a backpressure regulator. For each experiment, 0.2 g of catalyst to be tested was mixed with 0.2 g of silica. The system was pressurized to 2 MPa using a mixed gas feed at 20 mL min−1. The reaction for each catalyst was kept for around 50 h at the desired temperature. The gas products were analyzed online using an Agilent GC 3000 gas chromatograph equipped with thermal conductivity and flame ionization detectors. The liquid products were collected in a cold trap and analyzed offline using an Agilent GC 4890 gas chromatograph equipped with a flame ionization detector. The reaction parameters of CO2 conversion (XCO2), selectivity and STY are defined as below (where MeOH refers to methanol).3. Results and discussion
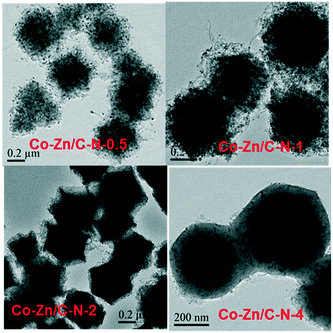
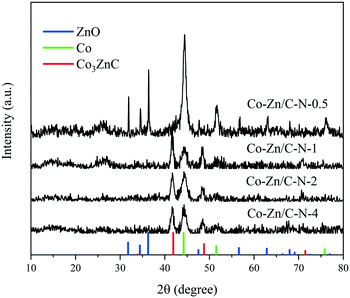
The morphology of ZIF-67@ZIF-8 was characterized by TEM, as shown in Fig. S1,† wherein ZIF-67@ZIF-8 displays uniform rhombic dodecahedra that are 450–600 nm in size. The good morphology of the rhombic dodecahedra reveal their good crystallinity. After calcination at 600 °C for 5 h, the integrity of the rhombic dodecahedral shape is not destroyed (Fig. 1). The morphology of Co–Zn/C–N is much more distinct with an increase in the Zn/Co molar ratio. The metallic Co is well dispersed in the nitrogen doped carbon material.The X-ray diffraction patterns of ZIF-67@ZIF-8 are shown in Fig. S2,† which confirm the ZiF-67 and ZIF-8 structures. The XRD patterns of Co–Zn/C–N (Fig. 2) show peaks with 2θ angles at 44.2°, 51.5°, 75.9°, which can be assigned to the (111), (200), and (220) crystalline planes of metallic Co (JCPDS Card No. 15-0806). The diffraction peaks of ZnO (JCPDS Card No. 36-1451) can also be observed for the Co–Zn/C–N-0.5 catalyst. However, the diffraction peaks of ZnO disappear, and the diffraction peaks of Co3ZnC (JCPDS Card No. 29-0524) are observed with an increase in the Zn/Co molar ratio, which indicates a strong interaction between Co and Zn in the calcination process. The crystal size of metallic Co can be calculated as 9.7, 7.0, 7.1, and 9.3 nm for Co–Zn/C–N-0.5, Co–Zn/C–N-1, Co–Zn/C–N-2, and Co–Zn/C–N-4 respectively. PXRD patterns of the Co/C–N, Zn/C–N and C–N material are also shown in Fig. S3.† The diffraction peaks of metallic Co and ZnO can be observed in the patterns of the Co/C–N and Zn/C–N samples separately. There is only a broad peak at 24.3° ascribed to the (002) crystalline planes of graphite carbon in the pattern of the C–N sample. PXRD patterns of the spent Co–Zn/C–N catalysts are shown in Fig. S4.† The diffraction peaks of ZnO are observed after reaction for the Co–Zn/C–N-1 catalyst, which are not observed for the fresh Co–Zn/C–N-1 catalyst. The crystal size of the catalyst remains keeps constant after reaction, for instance, the crystal size of metallic Co is 9 nm both before and after reaction for the Co–Zn/C–N-4 catalyst.
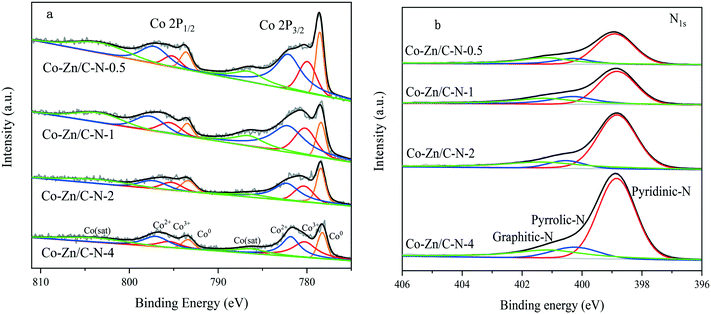
Fig. 3 shows the XPS spectra of the Co–Zn/C–N catalysts. The binding energy distance between the peak Co 2p3/2 and Co 2p1/2 splitting is approximately 15.0 eV, which indicates the presence of a mixture of Co2+ and Co3+ (Fig. 3a).21 The weak satellite peaks at 786.8 eV and 802.6 eV can be attributed to Co2+ in the octahedral sites of CoO, which indicates the presence of abundant Co2+. The asymmetrical Co 2p3/2 and 2p1/2 signals of Co–Zn/C–N can be deconvoluted into three peaks corresponding to Co3+ and Co2+ and metallic Co. Two fitting peaks at 780.4 eV and 795.4 eV correspond to Co3+, the peaks at 782.2 eV and 797.3 eV can be ascribed to Co2+, while the peaks at 778.4 eV and 793.3 eV can be indexed to metallic Co.22 The presence of Co3+ and Co2+ is due to the surface of metallic cobalt nanoparticles in the catalyst being oxidized into cobalt oxides during their storage in air. The N 1s XPS spectrum (Fig. 3b) can be fitted into three peaks with BEs at 398.8, 400.3 and 401.2 eV, corresponding to pyridinic N, pyrrolic N and graphitic N, respectively.23 The nitrogen content increases with an increase in the Zn/Co molar ratio. The surface molar ratio of Zn/Co is higher than the calculated number (Table 1), which probably indicates that Zn/C–N is mainly on the surface and that Co/C–N is mainly at the core of the catalyst.
| Catalyst | Co | Zn | O | N | Zn/Co |
|---|---|---|---|---|---|
| Co–Zn/C–N-0.5 | 1.4 | 1.4 | 10.5 | 5.0 | 1.0 |
| Co–Zn/C–N-1 | 1.1 | 1.7 | 10.3 | 5.1 | 1.5 |
| Co–Zn/C–N-2 | 0.8 | 2.4 | 9.7 | 7.9 | 3.0 |
| Co–Zn/C–N-4 | 1.0 | 5.3 | 8.4 | 14.8 | 5.3 |
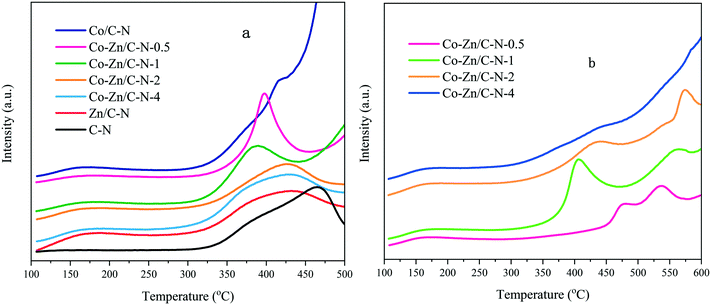
CO2-TPD profiles of Co–Zn/C–N (Fig. 4a) were measured to determine the basic properties of the catalysts. As can be seen from the data, the curves of the samples clearly drift upward to over 500 °C, which is probably due to the decomposition of a small amount of ZIF.24 For the Zn/C–N catalyst, a broad peak appears in the data at around 170 °C, indicating weak basic sites. A similar desorption peak can be observed for other catalysts, but not for the C–N sample, which means that this CO2 desorption peak can be ascribed to CO2 adsorption on ZnO. Strong desorption can be observed at 470 °C for the C–N sample, which can be ascribed to the strong basic sites of N. In our catalytic activity experiments, the reaction temperature was set as 275 °C, so the strong basic sites mainly effect the catalyst activity and selectivity. Furthermore, compared with Zn/C–N and C–N, the strong basic sites move towards a lower temperature. The curves of Co–Zn/C–N-2 and Co–Zn/C–N-4 are similar to that of Zn/C–N, indicating that the catalyst surface is almost covered with Zn/C–N upon an increase in the ZIF-8 content. The strong basic sites of N element further move from 430 °C for Zn/C–N to 385 °C for the Co–Zn/C–N-1 catalysts. This is maybe due to the interactions between Co and ZnO weakening the strong basic sites.
The H2-TPD data of the Co–Zn/C–N catalysts (Fig. 4b) show three major peaks: a low temperature peak (about 170 °C), a medium temperature peak (350–500 °C) and a high temperature peak (>500 °C), indicating the different adsorbed states of hydrogen. The low temperature peak is due to chemisorbed hydrogen on the surface of metallic Co, whereas the medium and high temperature peaks are maybe caused by the desorption of spillover hydrogen from the surface of metallic Co to the bulk.20 Comparing Co–Zn/C–N-0.5 with Co/Zn/C–N-1, the H2 desorption peak notably moves towards a low temperature. The peaks become less intense upon an increase in the content of Zn, which indicates that the surface of the metallic Co is partially covered with Zn.
Fig. 5 shows the effect of reaction temperature on the conversion of CO2 over the Co/C–N, Zn/C–N and Co–Zn/C–N catalysts. The dotted lines indicate the equilibrium conversions of methanation, RWGS and the methanol synthesis reaction. From Fig. 5, it can be seen that the methanation and methanol synthesis reactions are exothermic reactions. The equilibrium conversion decreases with an increase in the reaction temperature, with the equilibrium conversion of methanation being much higher than that of the methanol synthesis reaction. On the contrary, the RWGS reaction is an endothermic reaction. CO2 conversion increases with an increase in reaction temperature for all of the catalysts. This means that the reaction activity is mainly affected by dynamics. The CO2 conversion of Co/C–N is nearly to the equilibrium conversion of methanation, and the main product of Co/C–N is methane at 275 °C. The CO2 conversion decreases sharply with an increase in the Zn/Co ratio. For instance, the CO2 conversions of Co–Zn/C–N-0.5, Co–Zn/C–N-1, Co–Zn/C–N-2 and Co–Zn/C–N-4 are 47.4%, 13.6%, 6.6% and 2.6%. Co–Zn/C–N-2 and Co–Zn/C–N-4 only show catalytic activity above 275 °C.
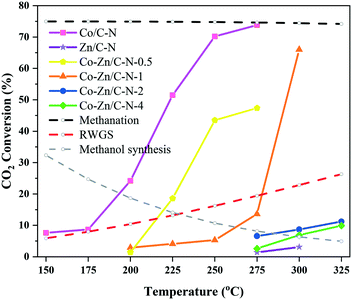 | ||
| Fig. 5 Effect of reaction temperature on the conversion of CO2 over the Co/C–N, Zn/C–N and Co–Zn/C–N catalysts. | ||
The products selectivity and STY of methanol of Co–Zn/C–N at 275 °C are shown in Fig. 6. It is noted that the methanol selectivity increases with an increase in the Zn/Co molar ratio. For instance, the main product (SCH4 = 91.6%) is methane for the Co–Zn/C–N-0.5 catalyst. Co–Zn/C–N-0.5 mainly shows metallic Co activity, which promotes the reaction of CO2 hydrogenation into methane (CO2 + 4H2 → CH4 + 2H2O). With double the Zn content, the methane selectivity falls to 62.4% for the Co–Zn/C–N-1 catalyst, and the selectivity of methanol increases from 4.8% to 31.6%. CO is also observed for the Co–Zn/C–N-1 catalyst, and the selectivity of CO is 3.8%. The methanol selectivity increases with a further increase in the Zn/Co molar ratio. The methanol selectivity is 64.5% for the Co–Zn/C–N-4 catalyst. With an increase in the Zn/Co molar ratio, the function of metallic Co is weakened, and the interaction between Co and Zn increases and results in a new CO2 hydrogenation process (RWGS, CO2 + H2 → CO + H2O or CO2 + 3H2 → CH3OH + H2O). The STY values of methanol were calculated to be 1.4, 2.7, 1.9, and 1.0 mmol gcat−1 h−1 for the Co–Zn/C–N-0.5, Co–Zn/C–N-1, Co–Zn/C–N-2, and Co–Zn/C–N-4 catalysts.
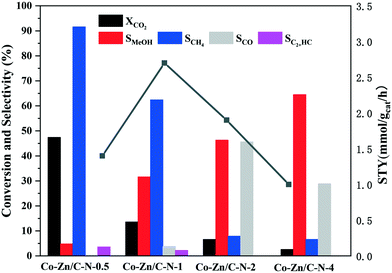 | ||
Fig. 6 CO2 conversion and product selectivity of the Co–Zn/C–N catalysts. Reaction conditions: H2![[thin space (1/6-em)]](https://www.rsc.org/images/entities/char_2009.gif) : :![[thin space (1/6-em)]](https://www.rsc.org/images/entities/char_2009.gif) CO2 = 3, P = 2 MPa, T = 275 °C, and GHSV = 6 L gcat−1 h−1. CO2 = 3, P = 2 MPa, T = 275 °C, and GHSV = 6 L gcat−1 h−1. | ||
In our earlier experiments, the 50% In2O3/Co/C–N catalyst showed stable 9.5% CO2 conversion with 88.4% methanol selectivity at 300 °C. However, the methanol selectivity fell to 29.2% for the 10% In2O3/Co/C–N catalyst due to the formation of Co3InC0.75.19 The strong interaction between Co and In enhances the formation of mixed-metal carbide Co3InC0.75 phases. Zn maybe prevents the formation of Co3InC0.75 and improves the synthesis of methanol. Therefore, In–Co–Zn/C–N catalysts were prepared via incipient wetness impregnation and physical mixing methods to explore the function of In and Zn.
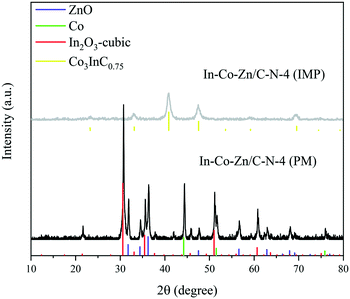
Unfortunately, Co3InC0.75 (JCPDS Card No. 89-7234) still forms in the In–Co–Zn/C–N-4 (IMP) catalyst because of the migration of Co on the catalyst surface (Fig. 7). However, no phase of Co3InC0.75 is formed in the In–Co–Zn/C–N-4 (PM) catalyst. As shown in Fig. 6, the PXRD patterns of In–Co–Zn/C–N-4 (PM) show peaks for cubic In2O3 (JCPDS Card No. 44-1087), metallic Co (JCPDS Card No. 15-0806) and ZnO (JCPDS Card No. 36-1451).Rhombohedral In2O3 (JCPDS Card No. 22-0336) is observed after reaction for the In–Co–Zn/C–N-4 (IMP) catalyst. Meanwhile, there are no crystal changes before and after reaction for the In–Co–Zn/C–N-4 (PM) catalyst (Fig. S6†).
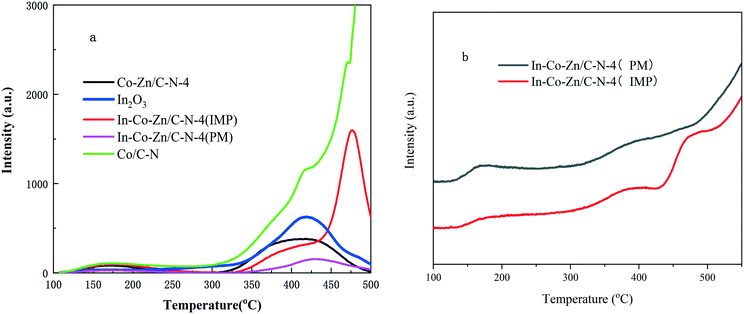
The CO2-TPD profiles of the In–Co–Zn/C–N-4 catalysts are shown in Fig. 8a. For the In2O3 sample, there is only one desorption at 415 °C, which corresponds to the presence of chemisorbed CO2 at the thermally induced oxygen vacancy sites of In2O3.25 The In–Co–Zn/C–N-4 (IMP) catalyst shows a similar desorption peak temperature to that of the Co/C–N catalyst, which implies that the coating effect of ZnO was totally destroyed. This is also the reason for the formation of Co3InC0.75. However, In–Co–Zn/C–N-4 (PM) shows a similar desorption to that of In2O3. The CO2-TPD results are consistent with the PXRD results. In–Co–Zn/C–N-4 (IMP) and In–Co–Zn/C–N-4 (PM) show similar H2-TPD profiles, as shown in Fig. 8b, which means that the H2 desorption is not the main effect factor.
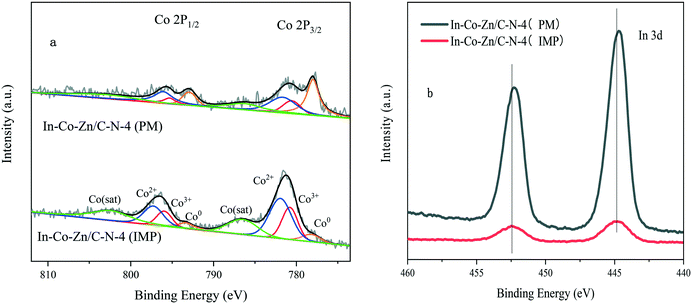
Fig. 9 shows the XPS spectra of the In–Co–Zn/C–N catalyst. Co mainly exists in the state of metallic Co in the In–Co–Zn/C–N (PM) catalyst. However, most of the Co is oxidized into Co3O4 in the In–Co–Zn/C–N (IMP) catalyst (Fig. 9a). The intensity of the In 3d of In–Co–Zn/C–N (PM) is much higher than that of the In–Co–Zn/C–N (IMP) catalyst (Fig. 9b). The peaks at 444.7 and 452.2 eV in the spectrum of the In–Co–Zn/C–N (PM) catalyst can be attributed to the 3d5/2 and 3d3/2 of In3+, respectively, which are similar to those of pure In2O3.26 The shift of 0.3 eV of In 3d in the spectrum of In–Co–Zn/C–N (IMP) toward a higher energy compares to that of In–Co–Zn/C–N (PM). The XPS spectra of Co 2p and In 3d for In–Co–Zn/C–N (IMP) both affirm the incorporation of Co into the In2O3 crystal lattice, for instance, in the form of Co3InC0.75.
In order to address the function of In, the catalyst activity of In–Co–Zn/C–N-4 was evaluated, with the results shown in Fig. 10. Although the three catalysts exhibit similar CO2 conversion, the addition of In effectively prevents the production of CO and methane. In particular, for the In–Co–Zn/C–N-4 (PM) catalyst, the selectivity of methane decreased to zero, and the selectivity of methanol increased to 77.7% with a 7.0% CO2 conversion at 300 °C. The STY values of methanol increased almost linearly from 1.5 to 2.7 and 3.3 mmol gcat−1 h−1 for the Co–Zn/C–N-4, In–Co–Zn/C–N-4 (IMP) and In–Co–Zn/C–N-4 (PM) catalysts.
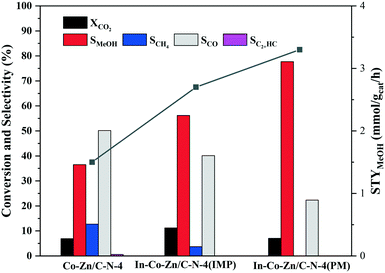 | ||
Fig. 10 CO2 conversion and product selectivity of the In–Co–Zn/C–N-4 catalyst. Reaction conditions: H2![[thin space (1/6-em)]](https://www.rsc.org/images/entities/char_2009.gif) : :![[thin space (1/6-em)]](https://www.rsc.org/images/entities/char_2009.gif) CO2 = 3, P = 2 MPa, T = 300 °C, and GHSV = 6 L gcat−1 h−1. CO2 = 3, P = 2 MPa, T = 300 °C, and GHSV = 6 L gcat−1 h−1. | ||
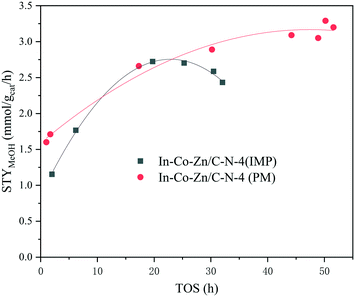
Compared with the In–Co–Zn/C–N-4 (IMP) catalyst, In–Co–Zn/C–N-4 (PM) exhibits high stability, and no deactivation of its activity is observed within 50 h at 300 °C (Fig. 11). The STY of methanol reaches 3.3 mmol gcat−1 h−1 steadily over 50 h. However, the In–Co–Zn/C–N-4 (IMP) catalyst exhibits a maximum methanol STY value of 2.7 mmol gcat−1 h−1 over a reaction time of 20 h, and then falls slowly to 2.3 mmol gcat−1 h−1 over 30 h. A comparison was made between In–Co–Zn/C–N-4 (PM) and some typical CO2 hydrogenation catalysts. As shown in Table 2, in terms of CH3OH STY, In–Co–Zn/C–N-4 (PM) exhibits a better performance than In2O3, and even 50% In2O3/Co/C–N with a high loading of In.19 Although Pt/In2O3,27 Ni/In2O3 (ref. 28) and InNi3C0.5/m-ZrO2 (ref. 29) present higher CH3OH STY values, their activity tests were all performed at considerably higher GHSV (24![[thin space (1/6-em)]](https://www.rsc.org/images/entities/char_2009.gif) 000 and 12
000 and 12![[thin space (1/6-em)]](https://www.rsc.org/images/entities/char_2009.gif) 000 ml gcat−1 h−1vs. 6000 ml gcat−1 h−1) and higher reaction pressure (5 and 4 MPa vs. 2 MPa). The CH3OH STY value of In–Co–Zn/C–N-4 (PM) is also higher than those of Cu-based catalysts.30,31
000 ml gcat−1 h−1vs. 6000 ml gcat−1 h−1) and higher reaction pressure (5 and 4 MPa vs. 2 MPa). The CH3OH STY value of In–Co–Zn/C–N-4 (PM) is also higher than those of Cu-based catalysts.30,31
| Catalyst | GHSV (ml gcat−1 h−1) | P (MPa) | T (°C) | X CO2 (%) | S MeOH (%) | STYMeOH (mmol gcat−1 h−1) | Ref. |
|---|---|---|---|---|---|---|---|
| 50% In2O3/Co/C–N | 3000 | 2 | 300 | 9.5 | 88.4 | 2.5 | 19 |
| In2O3 | 6000 | 2 | 300 | 4.4 | 64.5 | 1.7 | 19 |
| In2O3 | 15![[thin space (1/6-em)]](https://www.rsc.org/images/entities/char_2009.gif) 000 000 |
4 | 330 | 7.1 | 39.7 | 3.6 | 25 |
| 2.5% Pt/In2O3 | 24![[thin space (1/6-em)]](https://www.rsc.org/images/entities/char_2009.gif) 000 000 |
2 | 300 | 8.3 | 41.0 | 8.7 | 27 |
| 9.7% Ni/In2O3 | 21![[thin space (1/6-em)]](https://www.rsc.org/images/entities/char_2009.gif) 000 000 |
5 | 300 | 18.5 | 54.0 | 17.2 | 28 |
| In–Co–Zn/C–N-4 (PM) | 6000 | 2 | 300 | 7.0 | 77.7 | 3.3 | This work |
| InNi3C0.5/m-ZrO2 | 12![[thin space (1/6-em)]](https://www.rsc.org/images/entities/char_2009.gif) 000 000 |
4 | 300 | 11.2 | 85.4 | 19.3 | 29 |
| Cu/Zn/ZrO2 | 3600 | 3 | 240 | 12.1 | 54.1 | 2.4 | 30 |
| Cu/Zn/Al2O3 | 3600 | 3 | 230 | 18.7 | 43 | 2.2 | 31 |
In situ DRIFTS measurements were carried out by switching from N2 to a CO2 + H2 mixture to identify the evolution of surface species over the In–Co–Zn/C–N-4 catalyst, and try to understand the mechanism of the CO2 activation and hydrogenation reaction. As shown in Fig. 12a, for the In–Co–Zn/C–N-4 (PM) catalyst, the IR peaks at 1255 and 1545 cm−1 can be assigned to monodentate HCOO* (m-HCOO*) species, which appear at 200 °C, and the intensity of these peaks increases with an increase in temperature. A substantial increase in bidentate HCOO* (b-HCOO*, 1421 cm−1) is also observed from 100 °C to 300 °C. Meanwhile, the peak for bidentate H3CO* (b-H3CO*) at 1143 cm−1 and terminal H3CO* (t-H3CO*) at 1096 cm−1 start to appear at 200 °C, and then the signal of the methanol peak (2881 cm−1) appears at the same temperature.32,33 The presence of multiple peaks in the region between 3590 and 3730 cm−1 can be attributed to CO2 overtones (3590 and 3625 cm−1) and OH vibrations (bridged hydroxyl groups, b-OH at 3697 cm−1 and isolated hydroxyl groups, i-OH at 3730 cm−1).34 The intensity of both peaks decreases with an increase in the temperature, however, the CO2 adsorption peaks are still present at 300 °C, which indicates the strong adsorption of CO2 on the catalyst. Simultaneously, the signal for CH3OH at 2881 cm−1 is observed at around 225 °C.
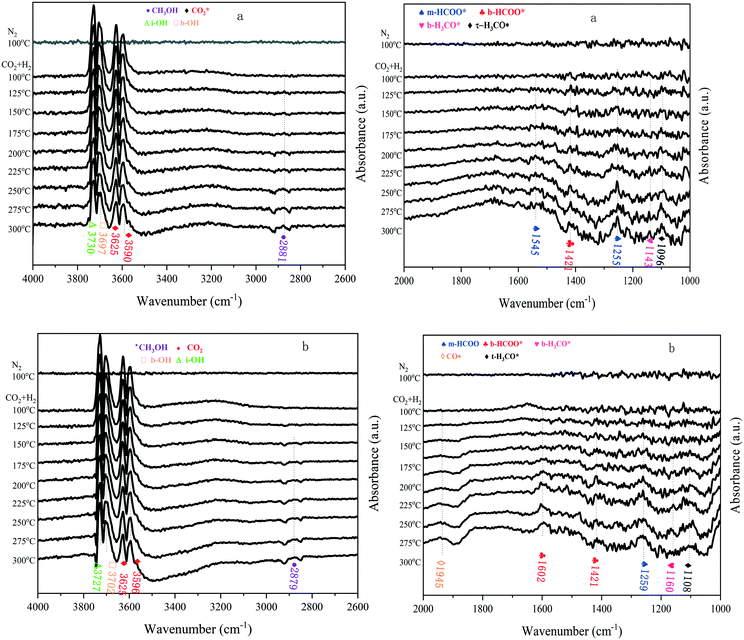 | ||
| Fig. 12 In situ DRIFTS spectra of a) In–Co–Zn/C–N-4 (PM) and b) In–Co–Zn/C–N-4 (IMP) at different temperatures. | ||
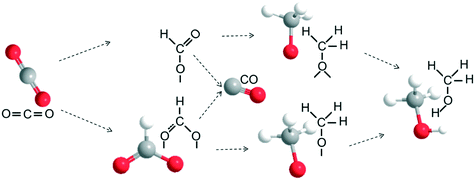
The In–Co–Zn/C–N-4 (IMP) catalyst has a similar IR spectrum (Fig. 12b), however, a significant increase in the concentration of bridged adsorbed CO (1945 cm−1) on metallic Co (ref. 35) is observed from 175 to 300 °C, which is not present in the spectrum of the In–Co–Zn/C–N-4 (PM) catalyst. The DRIFTS results are consistent with the catalyst reaction activity results, showing that the In–Co–Zn/C–N-4 (IMP) catalyst produces both CO and methanol, while the In–Co–Zn/C–N-4 (PM) catalyst mainly catalyzes the hydrogenation of CO2 into methanol. From the DRIFTS results, it can be seen that the RWGS and methanol synthesis reaction seem to occur at the same time. A possible reaction pathway for the hydrogenation of CO2 on the In–Co–Zn/C–N-4 catalyst was proposed based on the DRIFTS results (Fig. 13). In the first reaction period, CO2 adsorbs on In2O3 that has reacted with active H* spillover from metallic Co into two types of formate (b-HCOO* and m-HCOO*) intermediates, the formate species further hydrogenate into H3CO* and t-H3CO* separately, and finally form methanol. Meanwhile, aside from the methanol pathway, some of the formate species hydrogenate into CO, especially for the In–Co–Zn/C–N-4 (IMP) catalyst.
4. Conclusions
In conclusion, we successfully developed an In–Co–Zn/C–N catalytic system for the hydrogenation of CO2 into methanol. In–Co–Zn/C–N-4 (PM) exhibits high stability, and the STY of methanol reaches 3.3 mmol gcat−1 h−1 (XCO2 = 7.0%, SMeOH = 77.7%) steadily over 50 h at 2 MPa and 300 °C. In comparison, the In–Co–Zn/C–N-4 (IMP) catalyst exhibits a maximum methanol STY value of 2.7 mmol gcat−1 h−1 over a reaction time of 20 h, and then falls slowly to 2.3 mmol gcat−1 h−1 over 30 h under the same reaction conditions. The ZnO effectively weakens the interaction between Co and In, and the physical mixing method further prevents the formation of Co3InC0.75. The DRIFTS results were used to predict the possible methanol and CO production pathway via formate intermediates for the In–Co–Zn/C–N catalyst.Conflicts of interest
The authors declare that they have no known competing financial interests or personal relationships that could have appeared to influence the work reported in this paper.Acknowledgements
This project was supported by the Natural Science Foundation of Hubei Province (No. 2020CFB802).References
- K. Larmier, W. C. Liao, S. H. Tada, E. Lam, R. Verel, A. Bansode, A. Urakawa, A. Comas-Vives and C. Coperet, Angew. Chem., 2017, 129, 2358–2363 CrossRef
.
- S. Kattel, P. J. Ramírez, J. G. G. Chen, J. A. Rodriguez and P. Liu, Science, 2017, 355, 1296–1299 CrossRef CAS PubMed
.
- Y. Hartadi, D. Widmann and R. J. Behm, J. Catal., 2016, 333, 238–250 CrossRef CAS
.
- A. García-Trenco, E. R. White, A. Regoutz, D. J. Payne, M. S. P. Shaffer and C. K. Williams, ACS Catal., 2017, 7, 1186–1196 CrossRef
.
- B. Liu, B. Ouyang, Y. H. Zhang, K. L. Lv, Q. Li, Y. B. Ding and J. L. Li, J. Catal., 2018, 366, 91–97 CrossRef CAS
.
- O. Martin, A. J. Martín, C. Mondelli, S. Mitchell, T. F. Segawa, H. Roland, C. Drouilly, D. Curulla-Ferré and J. Pérez-Ramírez, Angew. Chem., Int. Ed., 2016, 55, 626–6265 Search PubMed
.
- B. Ouyang, W. L. Tan and B. Liu, Catal. Commun., 2017, 95, 36–39 CrossRef CAS
.
- F. Q. Xie, S. Y. Xu, L. D. Deng, H. M. Xie and G. L. Zhou, Int. J. Hydrogen Energy, 2020, 45, 26938–26952 CrossRef CAS
.
- A. Bavykina, I. Yarulina, A. J. A. Abdulghani, L. Gevers, M. N. Hedhili, X. H. Miao, A. R. Galilea, A. Pustovarenko, A. Dikhtiarenko, A. Cadiau, A. Aguilar-Tapia, J. L. Hazemann, M. K. Sergey, S. Oud-Chikh, L. Cavallo and J. Gascon, ACS Catal., 2019, 9, 6910–6918 CrossRef CAS
.
- A. Pustovarenko, A. Dikhtiarenko, A. Bavykina, L. Gevers, A. Ramírez, A. Russkikh, T. Selvedin, A. Aguilar, J. L. Hazemann, S. Ould-Chikh and J. Gascon, ACS Catal., 2020, 10, 5064–5076 CrossRef CAS
.
- T. F. Fang, B. Liu, Y. Lian and Z. H. Zhang, Ind. Eng. Chem. Res., 2020, 59, 19162–19167 CrossRef CAS
.
- Y. Lian, T. F. Fang, Y. H. Zhang, B. Liu and J. L. Li, J. Catal., 2019, 379, 46–51 CrossRef CAS
.
- H. Yang, X. W. He, F. Wang, Y. Kang and J. Zhang, J. Mater. Chem., 2012, 22, 21849–21851 RSC
.
- H. G. Zhang, S. H. Wang, M. Y. Wang, Z. X. Feng, S. Karakalos, L. L. Luo, Z. Qiao, X. H. Xie, C. M. Wang, D. Su, Y. Y. Shao and G. Wu, J. Am. Chem. Soc., 2017, 139, 14143–14149 CrossRef CAS
.
- Y. Z. Chen, R. Zhang, L. Jiao and H. L. Jiang, Coord. Chem. Rev., 2018, 362, 1–23 CrossRef CAS
.
- M. Y. Yang, L. Jiao, H. L. Dong, L. J. Zhou, C. Q. Teng, D. M. Yan, T. N. Ye, X. X. Chen, Y. Liu and H. L. Jiang, Sci. Bull., 2021, 66, 257–264 CrossRef CAS
.
- J. Yang, F. J. Zhang, H. Y. Lu, X. Hong, H. L. Jiang, Y. Wu and Y. D. Li, Angew. Chem., Int. Ed., 2015, 54, 10889–10893 CrossRef CAS
.
- P. Zhou, C. L. Yu, L. Jiang, K. L. Lv and Z. H. Zhang, J. Catal., 2017, 352, 264–273 CrossRef CAS
.
- W. H. Li, A. F. Zhang, X. Jiang, C. Chen, Z. M. Liu, C. S. Song and X. W. Guo, ACS Sustainable Chem. Eng., 2017, 5, 7824–7831 CrossRef CAS
.
- Y. X. Zhou, Y. Z. Chen, L. N. Cao, J. L. Lu and H. L. Jiang, Chem. Commun., 2015, 51, 8292–8295 RSC
.
- K. Chen, S. L. Bai, H. Y. Li, Y. J. Xue, X. Y. Zhang, M. C. Liu and J. B. Jia, Appl. Catal., A, 2020, 599, 117614–117621 CrossRef CAS
.
- J. P. Hong, B. Wang, G. Q. Xiao, N. Wang, Y. H. Zhang, A. Y. Khodakov and J. L. Li, ACS Catal., 2010, 20, 5554–5566 Search PubMed
.
- Z. L. Yuan, B. Liu, P. Zhou, Z. H. Zhang and Q. Chi, J. Catal., 2019, 370, 347–356 CrossRef CAS
.
- Y. N. Miao, Y. Wang, D. H. Pan, X. H. Song, S. Q. Xu, L. J. Gao and G. M. Xiao, Catalysts, 2019, 9, 94–108 CrossRef
.
- K. H. Sun, Z. G. Fan, J. Y. Ye, J. M. Yan, Q. F. Ge, Y. N. Li, W. J. He, W. M. Yang and C. J. Liu, J. CO2 Util., 2015, 12, 1–6 CrossRef CAS
.
- N. Akkharaphatthawon, N. Chanlek, C. K. Cheng, M. Chareonpanich, J. Limtrakul and T. Witoon, Appl. Surf. Sci., 2019, 489, 278–286 CrossRef CAS
.
- Z. Han, C. Z. Tang, J. J. Wang, L. D. Li and C. Li, J. Catal., 2021, 394, 236–244 CrossRef CAS
.
- X. Y. Jia, K. H. Sun, J. Wang, C. Y. Shen and C. J. Liu, J. Energy Chem., 2020, 50, 409–415 CrossRef
.
- C. Meng, G. F. Zhao, X. R. Shi, P. J. Chen, Y. Liu and Y. Lu, Sci. Adv., 2021, 7, eabi6012 CrossRef CAS PubMed
.
- L. Li, D. S. Mao, J. Yu and X. M. Guo, J. Power Sources, 2015, 279, 394–404 CrossRef CAS
.
- C. M. Li, X. D. Yuan and K. Fujimoto, Appl. Catal., A, 2014, 469, 306–311 CrossRef CAS
.
- W. W. Wang, Z. P. Qu, L. X. Song and Q. Fu, J. Catal., 2020, 382, 129–140 CrossRef CAS
.
- S. S. Dang, B. Qin, Y. Yang, H. Wang, J. Cai, Y. Han, S. G. Li, P. Gao and Y. H. Sun, Sci. Adv., 2020, 6, eaaz2060 CrossRef CAS
.
- L. Proaño, E. Tello, A. Trevino, S. X. Wang, M. A. Arellano-Trevino and M. Cobo, Appl. Surf. Sci., 2019, 479, 25–30 CrossRef
.
- L. Nie, Z. Li, T. Kuang, S. Lu, S. X. Liu, Y. H. Zhang, B. Peng, J. L. Li and L. Wang, Chem. Commun., 2019, 55, 10559–10562 RSC
.
Footnote |
| † Electronic supplementary information (ESI) available. See DOI: 10.1039/d1cy01663f |
| This journal is © The Royal Society of Chemistry 2022 |


