Synthesis of Al-incorporated sulfated zirconia with improved and stabilized surface sulfur species for removal of trace olefins from aromatics†
Sitan
Wang
 ,
Tao
Yin
,
Xuan
Meng
,
Tao
Yin
,
Xuan
Meng
 ,
Naiwang
Liu
 * and
Li
Shi
 *
*
The State Key Laboratory of Chemical Engineering, East China University of Science and Technology, Shanghai 200237, People's Republic of China. E-mail: liunw@ecust.edu.cn; yyshi@ecust.edu.cn; Tel: +021 64252274
First published on 13th November 2021
Abstract
Al-Incorporated sulfated zirconia with improved and stabilized surface sulfur species was synthesized via the co-precipitation method and used as an effective catalyst to remove trace olefins from aromatics in a fixed-bed reactor. The textural and chemical properties of various catalysts were characterized by XRD, 27Al MAS NMR, N2 adsorption, EA, XPS, H2-TPR, FT-IR, and pyridine-infrared (IR) spectroscopy techniques to elucidate the Al promoting effect on acid centres and catalytic performance. The results demonstrated that incorporating Al into zirconia could effectively stabilize the tetragonal zirconia with small grain size and improve surface sulfur species, thereby balancing the distribution of Brønsted and Lewis acid sites. Consequently, sulfated zirconia incorporating Al at the level of Al/Zr < 7.5 mol% exhibited more outstanding catalytic activity and stability under a long reaction time compared with conventional sulfated zirconia. Notably, superior reusability with a negligible drop in olefins conversion over five reaction cycles was obtained in the presence of the Al2.50-SZ. The alkylation reaction process of olefins with aromatics was further investigated by the GC-MS technique when Alx-SZ was used as the catalyst.
1. Introduction
Aromatic hydrocarbons (benzene, toluene and xylene), produced primarily through catalytic reforming and cracking processes, are essential raw materials in petrochemical processes and refineries.1 However, undesirable olefins as by-products are contained in aromatics owing to manufacturing process technology limitations. These olefins can efficiently react with other substances to form unwanted components because of their active chemical properties, which are destructive to the downstream technological processes and applications of aromatics. Therefore, it is indispensable to remove these impurities from aromatic products.Clay treatment2 is widely adopted in the petrochemical industry to remove olefins. This treatment is mainly based on the strong adsorption of the material toward olefins. Thus, limited by adsorption saturation, the lifetime of clay is quite short. Furthermore, deactivated clay cannot be regenerated due to its poor thermal stability, and it becomes hazardous solid waste and causes environmental pollution problems. Another feasible method is to catalyze the reaction between olefins and aromatics to form long-chain alkylbenzenes. Then, it can be removed by distillation. This reaction is essentially an alkylation reaction, as shown in Scheme 1, which can be effectively promoted by an acid reagent. Thus, clay modified by Lewis acids such as AlCl3, ZnCl2 was applied to this reaction and demonstrated excellent catalytic performance.2 However, the thermal stability of the modified clay is not improved, which means that deactivated clay still inevitably brings environmental pollution.
For the sake of eliminating pollution problems to meet the increasing demands for environmental protection, it is urgent for us to develop environmentally friendly catalysts to replace clay materials. Consequently, various environmentally friendly catalysts, such as modified zeolites,1 ionic liquids,3 organic–inorganic hybrid silica4 and sulfated zirconia,5 have been studied in removing trace olefins from aromatics by our previous work. An outstanding olefins conversion was obtained when treated by sulfated zirconia, and the deactivated catalyst could be regenerated by high-temperature calcination. Besides, due to their unique acid properties, environmental friendliness, as well as excellent renewability, sulfated zirconia has been frequently investigated and applied in isomerization,6,7 alkylation,5,8 acylation,9 condensation10 and esterification reactions,11 which makes it a promising catalyst for industrial processes. Nevertheless, an unsatisfactory lifetime under the long reaction time is challenging for it available in the industrial process. Previous studies9,12,13 have confirmed that the deactivation of sulfated zirconia derives from two aspects: (1) the rapid leach of surface sulfur species results in a decrease of acidity. (2) Coke is formed on the surface of the catalyst and eventually covers the active sites. Typically, deactivated sulfated zirconia caused by coking can be regenerated by high-temperature calcination, but the re-sulfonation cannot restore the lost surface sulfur species. The conventional sulfated zirconia,14 synthesized by post-sulfonation and calcination, has a low sulfate content and relatively weak interaction with surface sulfur species, which in turn results in limited acidity and rapid sulfur species leaching of the catalyst.
It has been found that changing the calcination temperature is a feasible approach to controlling sulfate loading on sulfated zirconia. A. K. Amin et al.15 reported that high sulfur content of sulfated zirconia could be accomplished by calcination at 400 °C, but another property, this temperature exerts adverse effects on the favourable tetragonal zirconia phase and crystallinity.16,17 In our recent research,18 metallic oxides (Fe2O3, Co2O3, Ni2O3) were introduced to sulfated zirconia when it was synthesized by a solvent-free method; results showed that metallic oxides could effectively improve the amounts of S6+ and adjust active sites on the zirconia surface. Thus, improved catalytic activity was observed when the catalyst was applied to remove olefins from aromatics. In addition, many attempts have been reported to increase the sulfur content of sulfated zirconia and enhance interaction between sulfur species and zirconia by modified sulfated zirconia with Al, thereby improving the catalytic activity and stability of sulfated zirconia. J. H. Wang et al.19 proposed that the promoting effect of Al on sulfated zirconia in butane isomerization was attributed to increased sulfur retention. M. A. Coelho et al.20 considered that incorporating small amounts of Al into zirconia before sulfation could increase the concentration of intermediate strength acid sites, which lead to enhanced activity and stability for n-butane isomerization. J. H. Wang et al.21 claimed that the balanced distribution of acid site strengths with an improved amount of weak Brønsted acid sites is related to the presence of Al in sulfated zirconia. C. L. Chen et al.22 found that the incorporated Al functions to stabilize the tetragonal zirconia phase due to the fact that phase transformation could be retard by Al. Most reports in this field have considered isomerization as a test reaction, but few studies have examined the catalytic performance of alkylation for removing trace olefins from aromatics. Furthermore, the detailed mechanism of acid site formation in the Al-incorporated sulfated zirconia is expected.
In our present study, sulfated zirconia with improved surface sulfur content and sulfur retention was synthesized by incorporating Al into the zirconia with a co-precipitation method. Various characterization techniques, such as XRD, N2 adsorption, 27Al MAS NMR, EA, XPS, FT-IR, pyridine-infrared (IR) spectroscopy and H2-TPR, were employed to reveal the nature of the promoting effect on structure and acid centres by Al incorporation. The alkylation of olefins with aromatics catalyzed by the Alx-SZ catalyst was verified by GC-MS analysis of the reaction products. Meanwhile, the catalytic activity, stability and reusability of Al-incorporated catalyst were systematically evaluated in removing trace olefins from aromatics and compared with conventional sulfated zirconia with no Al incorporation. As a result, it was found that the zirconia crystal structure and surface sulfur species were susceptible to Al incorporation, which in turn contributed to the stabilization of surface sulfur species, improvement of Brønsted acidity, as well as remarkable enhancement of catalytic performance.
2. Experimental section
2.1. Synthesis of catalysts
Al-Incorporated sulfated zirconia catalysts were synthesized by a precipitation–impregnation method. At the first step, ZrOCl2·8H2O and Al(NO3)3·9H2O with different ratios were dissolved in deionized water and then added dropwise into (25%) NH3·H2O while stirring well until pH = 9.5. After precipitation, the hydroxide suspension was stirred for another 0.5 h and then aged at room temperature for 12 h. Subsequently, the obtained white colloidal solution was filtered, thoroughly washed with deionized water to remove chloride ions until no chloride ions were detected by the AgNO3 test, and dried at 120 °C for 12 h. The obtained composite zirconia–alumina hydroxide was then immersed for 1 h in 2 M H2SO4 solution and a solid-to-liquid ratio of 1![[thin space (1/6-em)]](https://www.rsc.org/images/entities/char_2009.gif) :
:![[thin space (1/6-em)]](https://www.rsc.org/images/entities/char_2009.gif) 5 was used (by weight). Following filtration without washing, the sample was dried at 120 °C for 24 h and then calcined at 650 °C for 3 h under dry air. The obtained catalysts were named as Alx-SZ, X represented the molar percentage ratio of Al/Zr. For comparison, conventional sulfated zirconia, marked as SZ, was synthesized using the same route except for a mixture containing ZrOCl2·8H2O and NH3·H2O during precipitation. The deactivated catalyst was collected and regenerated at 550 °C for 3 h under airflow. The sample was labelled as SZ-RN/Alx-SZ-RN, N referred to the time of regenerations.
5 was used (by weight). Following filtration without washing, the sample was dried at 120 °C for 24 h and then calcined at 650 °C for 3 h under dry air. The obtained catalysts were named as Alx-SZ, X represented the molar percentage ratio of Al/Zr. For comparison, conventional sulfated zirconia, marked as SZ, was synthesized using the same route except for a mixture containing ZrOCl2·8H2O and NH3·H2O during precipitation. The deactivated catalyst was collected and regenerated at 550 °C for 3 h under airflow. The sample was labelled as SZ-RN/Alx-SZ-RN, N referred to the time of regenerations.
2.2. Characterization of catalysts
![[thin space (1/6-em)]](https://www.rsc.org/images/entities/char_2009.gif) cos
cos![[thin space (1/6-em)]](https://www.rsc.org/images/entities/char_2009.gif) θ.
θ.
![[thin space (1/6-em)]](https://www.rsc.org/images/entities/char_2009.gif) :
:![[thin space (1/6-em)]](https://www.rsc.org/images/entities/char_2009.gif) 100). It should be noted that before characterization, all samples and KBr powder were dehydrated in a vacuum oven at 400 °C for 12 h, and the dehydrated samples were pressed into self-supporting wafers (d = 10 mm) without allowing moisture absorption. The relative humidity of ambient conditions was controlled below 25% to suppress the influence of hydration on the characterization experiment. In addition, the accessible surface acid properties were also measured via FT-IR spectroscopy using pyridine as the probe molecule. The powder sample was pressed into a self-supporting wafer with a diameter of 13 mm, degassed in vacuum at 380 °C for 2 h, and then cooled down to 80 °C. After cooling down, the sample was exposed to pyridine vapour, immediately followed by an increase in temperature to desorb the excess pyridine. The spectra were scanned at 200 °C, 450 °C after aping vacuum for 15 min.
100). It should be noted that before characterization, all samples and KBr powder were dehydrated in a vacuum oven at 400 °C for 12 h, and the dehydrated samples were pressed into self-supporting wafers (d = 10 mm) without allowing moisture absorption. The relative humidity of ambient conditions was controlled below 25% to suppress the influence of hydration on the characterization experiment. In addition, the accessible surface acid properties were also measured via FT-IR spectroscopy using pyridine as the probe molecule. The powder sample was pressed into a self-supporting wafer with a diameter of 13 mm, degassed in vacuum at 380 °C for 2 h, and then cooled down to 80 °C. After cooling down, the sample was exposed to pyridine vapour, immediately followed by an increase in temperature to desorb the excess pyridine. The spectra were scanned at 200 °C, 450 °C after aping vacuum for 15 min.
2.3. Catalytic activity tests
The aromatics (Table 1) used in the experiments were provided by Sinopec Zhenhai Refining & Chemical Company, with a bromine index (BI) of about 1200 mg Br/(100 g). Bromine index is an indicator of olefin content in aromatics. Based on ASTM Standard D 2710-92, BI is defined as the number of milligrams of bromine consumed by 100 g of hydrocarbon sample.| Component | Content (wt%) |
|---|---|
| Non-aromatics | 2.53 |
| Benzene | 0.01 |
| Toluene | 0.04 |
| Ethylbenzene | 6.47 |
| p-Xylene | 8.75 |
| m-Xylene | 18.74 |
| o-Xylene | 12.26 |
| C9 | 33.31 |
| C10+ | 17.89 |
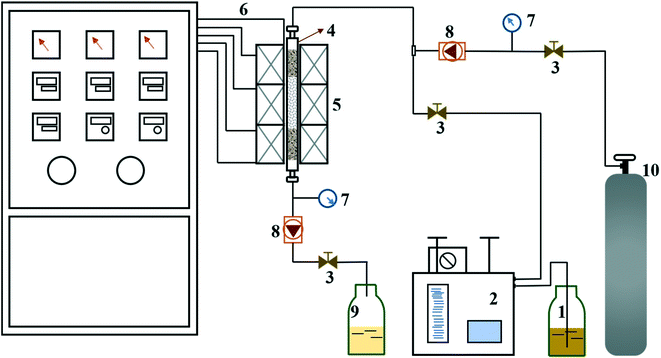
The experimental apparatus for catalytic activity test is schematically shown in Fig. 1. The reaction proceeded in a fixed-bed tubular microreactor equipped with a double plunger pump to control the flow rate at 0.5 ml min−1 and a heating system to maintain the temperature at 175 °C. The pressure was carried out at 1.0 MPa by the back pressure valve. The constant temperature zone of the microreactor was filled with dried catalyst (1.72 g, 40–60 mesh), and the liquid hourly space velocity (LHSV) was kept at 30 h−1. Before the reaction, the system was flushed with N2 for 1 h at the reaction temperature to remove physically adsorbed water from the catalyst and reactor. During the reaction, the reactants and products were collected every hour and analyzed by a bromine index analyzer (LC-6). The conversion of olefins was calculated following the equation below:
3. Results and discussion
3.1. Structure and composition analysis
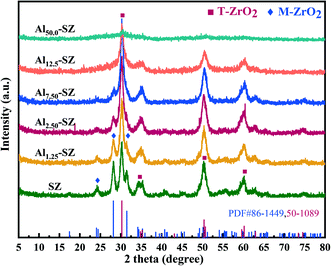
The structure and surface properties of as-synthesized catalysts with different ratios of Al/Zr were characterized to elucidate the effect of Al incorporation. Fig. 2 contains the XRD patterns of SZ and Alx-SZ. These catalysts exhibited diffraction peaks of tetragonal zirconia phase (T-ZrO2) at around 2θ = 30.2°, 35.3°, 50.3°, 60.2° and monoclinic zirconia phase (M-ZrO2) at around 2θ = 24.5°, 28.2°, 31.4°. It could be ascertained that all the peaks in Fig. 2 are attributed to T-ZrO2 or M-ZrO2. No peaks associated with Al/Al2O3/Al2(SO4)3 were observed, demonstrating that the Al was well-dispersed into the ZrO2. Interestingly, it was observed that the amount of M-ZrO2 decreased dramatically as aluminium content increased, while the amount of T-ZrO2 increased and became predominant. This result was consistent with the previous observations that the transformation from the metastable tetragonal phase to the monoclinic phase could be retarded by introducing Al2O3 into the ZrO2.7,23–25 D. J. Zalewski et al.26 proposed that aluminium incorporated by the co-precipitation method is mainly concentrated in the lattice gap of zirconia and prevents the overgrowth of zirconia particles, thereby zirconia with a small crystallite size was formed. Meanwhile, the small crystallite size of zirconia is beneficial to stabilize metastable T-ZrO2 during calcination.27Table 2 provides the crystal phase data and the sulfur content of SZ and Alx-SZ. It was worth noting that the crystallite size of samples obviously decreased with the aluminium incorporation increased, and then more T-ZrO2 was produced, as shown in Table 2. The previous investigation indicated that the tetragonal zirconia phase is essential for sulfated zirconia appearing super acid and that the stable tetragonal zirconia phase is an indispensable structural condition for catalytic activity.28–30| Sample | M-ZrO2 (%) | T-ZrO2 (%) | Relative crystallinity (%) | Crystallite size (Å) | Sulfur content (wt%) |
|---|---|---|---|---|---|
| SZ | 58.6 | 41.4 | 87 | 146 | 2.7 |
| Al1.25-SZ | 41.2 | 58.8 | 78 | 124 | 2.8 |
| Al2.50-SZ | 29.7 | 70.3 | 68 | 117 | 2.9 |
| Al7.50-SZ | 24.9 | 75.1 | 64 | 108 | 4.8 |
| Al12.5-SZ | 23.8 | 76.2 | 51 | 88 | 5.6 |
| Al50.0-SZ | 6.3 | 93.7 | 26 | 67 | — |
Based on the elemental analysis results in Table 2, the order of sulfur content was Al12.5-SZ > Al7.50-SZ > Al2.50-SZ > Al1.25-SZ > SZ. Interestingly, this order was consistent with the order of the proportion of T-ZrO2 in catalysts, indicating that the tetragonal zirconia phase was more active and more accessible to react with sulfur species than the monoclinic zirconia phase. P. Z. Wang et al.31 also found that the sulfur loading of sulfated zirconia was highly correlated with the content of T-ZrO2 and DFT calculation results confirmed the higher adsorption energies of SO3 (−356.5 kJ mol−1) on the surface of T-ZrO2. It seems that surface sulfur species of the tetragonal zirconia phase is thermal stability favourable. Thus, Al-incorporated catalysts with more T-ZrO2 containing could better retain surface sulfur species after high-temperature calcination.
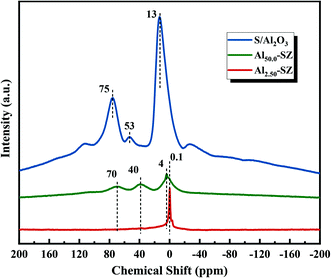
Moreover, the incorporated aluminium also significantly affected the relative crystallinity of zirconia when it played a role in retarding the crystal phase transformation. As shown in Table 2, a gradual decrease of zirconia crystallinity appeared from no aluminium to Al/Zr = 50.0%, consistent with the decline of the intensity of the diffraction peaks in the XRD patterns. Significantly, an extremely low crystallinity of the catalyst with high aluminium content (Al/Zr = 50.0%) was observed. Here, to understand this effect caused by incorporated aluminium, 27Al MAS NMR technique was used to analyze the coordination state of aluminium in Al2.50-SZ, Al50.0-SZ catalysts and S/Al2O3. The recorded spectra are shown in Fig. 3. The sample labelled S/Al2O3 was obtained by impregnating Al(OH)3 with 2 M H2SO4 solution and then calcined at 650 °C for 3 h. Compared with S/Al2O3, the coordination state of aluminium in Al-incorporated catalysts had changed significantly, particularly only an intense resonance peak was observed at around 0.1 ppm on the spectra of Al2.50-SZ. As reported by W. M. Hua et al.,32 this Al resonance peak (0.1 ppm) is considered Al3+ species in octahedral coordination; therefore, the incorporated aluminium could be introduced into the lattice of the zirconia, forming isomorphs or solid solution with zirconia.32,33 It confirmed that the Zr–O–Al bonds could be formed during calcination, which would inevitably restrict the formation of Zr–O–Zr bonds. On the other hand, for Al50.0-SZ with high aluminium content, the aluminium exhibited other different coordination states in addition to octahedral coordination, which was similar to S/Al2O3. The peaks at 40 and 70 ppm correspond to the pentacoordinate and tetrahedral Al species in γ-Al2O3 crystal structure, respectively.34,35 Thus, an understanding might be that with the incorporation of excessive aluminium, some of the aluminium would exist on its own besides being present in the lattice of zirconia. These separate aluminium would act as a barrier between the Zr(OH)4 crystallites and form γ-Al2O3 under 650 °C calcination, thereby preventing Zr(OH)4 from crystallization and growth.36 As crystallinity of zirconia is also a factor indirectly affecting the activity of the catalyst,30 it could assume that not high aluminium content but the appropriate amount of aluminium incorporated might promote an enhancement in catalytic activity.
The N2 adsorption–desorption isotherms and BJH pore size distribution curves of prepared catalysts were displayed in Fig. 4a and b. Obviously, the isotherms of all catalysts could be classified as the type IV isotherm accompanied by the type H2 hysteresis loop, which is assigned to the typical characteristic of mesoporous material. The accumulation of nanocrystals led to the formation of intercrystalline voids, thereby the appearance of mesopores in the catalyst.36,37 Furthermore, the hysteresis loop was caused by capillary condensation in these mesopores.38Table 3 lists the physical properties, including the surface area, pore volume and pore diameter, of SZ and Alx-SZ with different aluminium content. It could be seen from data that in a certain range of aluminium incorporating, BET surface areas of samples increased with aluminium content. Especially Al2.50-SZ had a higher BET surface area of 130.0 m2 g−1 as compared to conventional SZ. However, Al12.5-SZ appeared a noticeable drop in BET surface area (107.7 m2 g−1). The BET surface of Al50.0-SZ was only 65.7 m2 g−1, indicating that aluminium incorporated negatively impacted the structure of catalysts when aluminium containing was at a high level.
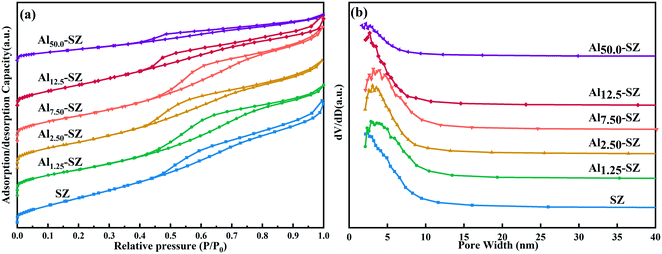 | ||
| Fig. 4 (a) The N2 adsorption–desorption isotherms and (b) pore size distribution plots of SZ and Alx-SZ. | ||
| Sample | S BET (m2 g−1) | Pore volumeb (cm3 g−1) | Pore sizec (nm) |
|---|---|---|---|
| a S BET = multi-point BET total specific surface area was obtained from adsorption data. b Pore volume = pore volume was obtained at P/P0 = 0.99. c Pore size = adsorption average pore diameters measured using Barrett–Joyner–Halenda (BJH) method. | |||
| SZ | 124.8 | 0.201 | 4.9 |
| Al1.25-SZ | 125.8 | 0.195 | 5.1 |
| Al2.50-SZ | 130.0 | 0.192 | 5.2 |
| Al7.50-SZ | 124.9 | 0.200 | 5.1 |
| Al12.5-SZ | 107.7 | 0.147 | 4.5 |
| Al50.0-SZ | 65.7 | 0.085 | 4.5 |
Catalysts modified with small amounts of aluminium appeared almost the same pore volume as SZ (0.201 cm3 g−1), while the pore volume of Al12.5-SZ (0.147 cm3 g−1) and Al50.0-SZ (0.085 cm3 g−1) was remarkably smaller than that of SZ. It supported the assumption that the pores of catalysts could be blocked by nanocrystals of γ-Al2O3, formed by excessive aluminium during calcination, which was consistent with the analysis of 27Al MAS NMR. The average pore size and uniform pore distribution of Alx-SZ measured by the BJH method were similar to those of SZ, as shown in Fig. 4b and Table 3.
Generally, a high specific surface area is likely conducive to the catalytic reaction on account of more reactants can be adsorbed on active sites. The above results obviously clarified the influence of aluminium incorporation on the textural properties of sulfated zirconia. Specific surface areas could be improved even with a slight aluminium incorporated. On the contrary, excessive aluminium blocked the pores of catalysts and reduced the specific surface area.
3.2. Acidity and active sites analysis
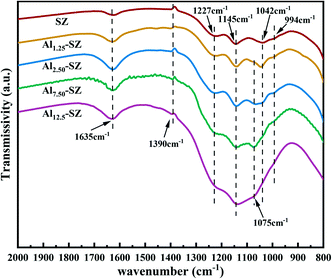
![[double bond, length as m-dash]](https://www.rsc.org/images/entities/char_e001.gif) O asymmetric stretching vibrations of sulfate groups.44–47 From the data in Fig. 5, it was apparent that the stretching vibrations of S–O and S
O asymmetric stretching vibrations of sulfate groups.44–47 From the data in Fig. 5, it was apparent that the stretching vibrations of S–O and S![[double bond, length as m-dash]](https://www.rsc.org/images/entities/char_e001.gif) O were enhanced after aluminium incorporation, indicating that more sulfur species onto zirconia was exposed. The result was consistent with the sulfur content given in Table 2. Furthermore, the aluminium incorporated into the zirconia weakened the sulfate absorption at 1042 cm−1, accompanied by the emergence of a new band at 1075 cm−1. Previous studies45,46 have pointed out that the blueshifting of the bands (1042 cm−1 to 1075 cm−1) suggests the formation of strong bonds between surface sulfur species and zirconia. The split peak at 1075 cm−1 could also be assigned to the typical characteristic of partially ionized S
O were enhanced after aluminium incorporation, indicating that more sulfur species onto zirconia was exposed. The result was consistent with the sulfur content given in Table 2. Furthermore, the aluminium incorporated into the zirconia weakened the sulfate absorption at 1042 cm−1, accompanied by the emergence of a new band at 1075 cm−1. Previous studies45,46 have pointed out that the blueshifting of the bands (1042 cm−1 to 1075 cm−1) suggests the formation of strong bonds between surface sulfur species and zirconia. The split peak at 1075 cm−1 could also be assigned to the typical characteristic of partially ionized S![[double bond, length as m-dash]](https://www.rsc.org/images/entities/char_e001.gif) O bonds in partially ionic nature sulfate species, which plays a crucial role in forming the Brønsted acid site in sulfated zirconia. Similarly, V. Vishwanathan et al.48 suggested that the occurrence of Brønsted and Lewis acid sites is significantly associated with the stretching vibration of asymmetric S
O bonds in partially ionic nature sulfate species, which plays a crucial role in forming the Brønsted acid site in sulfated zirconia. Similarly, V. Vishwanathan et al.48 suggested that the occurrence of Brønsted and Lewis acid sites is significantly associated with the stretching vibration of asymmetric S![[double bond, length as m-dash]](https://www.rsc.org/images/entities/char_e001.gif) O at the higher frequency. The peak at around 1390 cm−1, detected in all samples, can be assigned to the asymmetric stretching band of covalent S
O at the higher frequency. The peak at around 1390 cm−1, detected in all samples, can be assigned to the asymmetric stretching band of covalent S![[double bond, length as m-dash]](https://www.rsc.org/images/entities/char_e001.gif) O. The covalent sulfate groups are associated with the Lewis acid sites in sulfated zirconia.46,49,50 Consequently, acid sites might be affected by incorporating aluminium into the sulfated zirconia catalyst.
O. The covalent sulfate groups are associated with the Lewis acid sites in sulfated zirconia.46,49,50 Consequently, acid sites might be affected by incorporating aluminium into the sulfated zirconia catalyst.
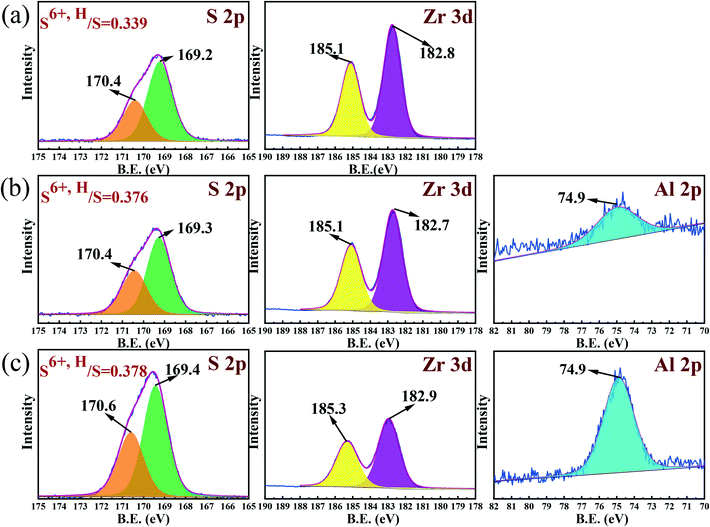
The peak area in XPS spectra has a linear relationship with sulfur content when the mass of the sample is the same. The order of S 2p peak area of three catalysts was SZ < Al2.50-SZ < Al12.5-SZ, consistent with the analysis result of sulfur content in Table 2. Consequently, a fitted peak area can be regarded as an indicator of absolute content value. In order to clarify the influence of aluminium incorporation on S6+,H, the ratio of S6+,H/ST was calculated and shown in Fig. 6. Notably, the proportion of sulfur species attributed to S6+,H in Al-incorporated catalysts was evidently higher than that in the aluminium-free catalyst. The two different binding energy of sulfur species indicated that the sulfates were in different chemical environments. Equally, the difference in FT-IR spectra above also confirmed the existence of varying sulfur species.
Based on the preceding analysis, an envisioned structural relation between sulfur species and zirconia was proposed, as displayed in Scheme 2. The model reveals that the electron shift of S atoms in sulfate groups would occur since the electron withdrawing effect of hydroxyl group adjacent to the sulfate group, resulting in the appearance of ionic nature sulfates.54–56 The sulfur species of ionic nature sulfates were assigned to S6+,H. Moreover, the sulfate groups without being affected by hydroxyl groups were anchored to the surface of zirconia as covalent sulfate groups, and they could be considered S6+,L. On the other hand, the sulfur species in Al-incorporated sulfated zirconia would not only be anchored to Zr sites but also to Al sites, because of the dehydration condensation between –Al–OH and HSO4− during calcination would lead to the formation of Al–O–S.33 Guided by the principle of electronegativity equalization, as proposed by Sanderson, it could be known that the electronegativity of Al3+ (1.61 eV) is higher than that of Zr4+ (1.33 eV). Thus, the positively charged electricity on S atoms in Al–O–S bonds could be enhanced because the strong electron-withdrawing of Al3+ decreased the charges transferred from Al atoms to S atoms. As a result, the surface sulfur species anchored to Al sites were in a state of high binding energy.
| C(pyridine on L site) = 1.42 × IA(L)R2/W |
| C(pyridine on B site) = 1.88 × IA(B)R2/W |
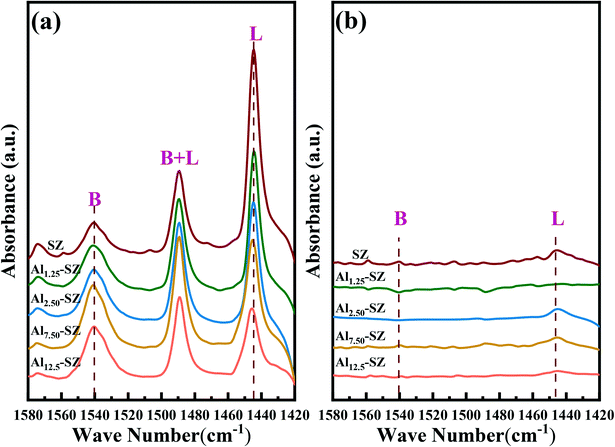 | ||
| Fig. 7 FT-IR spectra of SZ and Alx-SZ after pyridine adsorption at 80 °C and desorption at (a) 200 °C; and (b) 450 °C. | ||
| Sample | T | TL | TB | WL | WB | SL | SB | Sulfate concentration (S atoms per nm2) |
|---|---|---|---|---|---|---|---|---|
| T, total acidity, evacuation at 200 °C; S, strong acidity, evacuation at 450 °C; W, weak acidity; B, Brønsted acidity; L, Lewis acidity. Units = μmol g−1. | ||||||||
| SZ | 107 | 81 | 26 | 77 | 26 | 4 | — | 4.0 |
| Al1.25-SZ | 92 | 52 | 40 | 51 | 40 | 1 | — | 4.1 |
| Al2.50-SZ | 90 | 45 | 45 | 42 | 45 | 3 | — | 4.2 |
| Al7.50-SZ | 88 | 39 | 48 | 39 | 48 | — | — | 7.2 |
| Al12.5-SZ | 80 | 31 | 49 | 30 | 49 | 1 | — | 9.8 |
Table 4 shows that a trace amount of Al incorporation (Al/Zr = 1.25%) caused a 14% reduction in the total acidity (decreased from 107 μmol g−1 to 92 μmol g−1). Fortunately, this unexpected sharp decline did not continue with the doubling of Al content but became smooth. Further analysis on Lewis and Brønsted acidity was noteworthy that Brønsted acidity increased with the ratio of Al/Zr. It demonstrated that aluminium incorporation was conductive to generate more Brønsted acid sites for sulfated zirconia. However, Lewis acidity appeared the opposite trend. The following statement could better explain the changes in the acid type and acidity. The improvement of acid sites was associated with sufficient sulfate species loading on sulfated zirconia. Data have testified in Fig. 2 and Table 2 that Al promoted the growth of tetragonal zirconia with small grain size, resulting in more sulfur species being well retained on the surface of catalysts. Meanwhile, the incorporated Al could enhance the partially ionic nature sulfur species, which could be responsible for promoting Brønsted acid.44,45,60,61 Moreover, as reported in the literature, Lewis sites are dominant in low-sulfate-content sulfated zirconia catalysts36 and the surface concentration of the sulfate largely determines the amounts of Brønsted acid sites.62 The Al incorporated also contributed to improving the surface sulfate concentration of the catalysis, as displayed in Table 4. Thus, the Brønsted acid sites were enhanced (Fig. S1†), while accumulated sulfur species might cover part of the Lewis acid sites. On the other hand, the strong one in various samples was insignificant compared to the total acidity, leading to the regular of the weak acidity obtained by subtraction consistent with that of total acidity.
3.3. Catalytic activity and reusability for alkylation
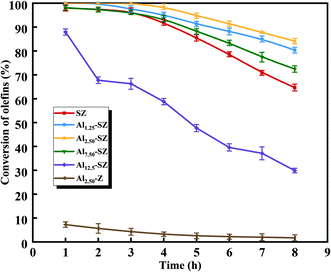
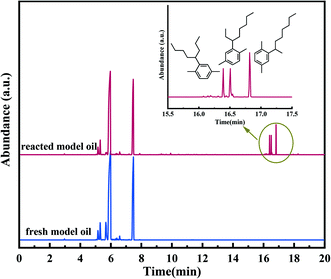
According to our previous study,5,18,59,63,64 during the SZ-catalyzed alkylation of olefins and aromatics, the continuous decrease with the reaction time of olefin conversion was observed, demonstrating the deactivation of the SZ catalyst. In this study, to better understand the promoting effect of aluminium incorporation on the catalytic activity and stability of sulfated zirconia, SZ and Alx-SZ catalysts with different ratios of Al/Zr were evaluated in alkylation for the removal of trace olefins from aromatics. In order to accelerate the evaluation of the stability of a catalyst, the liquid hourly space velocity in our test was amplified to 30 h−1 while it was generally 1 h−1 adopted by the industrial process. The results of the continuous 8 hours of reaction were displayed in Fig. 8. It was worth mentioning that the catalytic activity and stability were enhanced due to the Al incorporation (the molar ratio of Al/Zr = 1.25 to 7.50%) and then was dropped at a higher Al content. The poor catalytic performance of the Al2.50-Z without being sulfated by H2SO4 solution was obtained, indicating that the modification of sulfate groups is essential for the excellent catalytic activity of the catalysts. The SZ catalyst performed excellent catalytic activity within the first 2 hours of the reaction. However, it was disappointing that the activity decline trend continued from the 3rd hour to the end of the reaction. The conversion of olefin at the 8th hour was only 64.67%. Simultaneously, what was striking about the data in Fig. 8 was that Al1.25-SZ, Al2.50-SZ and Al7.5-SZ all performed higher activity than sulfated zirconia. The final olefins conversion of the Al2.50-SZ catalyst was improved to 84.10%. On the contrary, the Al12.5-SZ catalyst exhibited rapid deactivation. It could hence claim that the low-aluminium-incorporated sulfated zirconia has outstanding performance concerning their catalytic activity and stability, while the high aluminium content is detrimental to the lifetime of the catalyst.In order to validate the alkylation process for removing olefins from aromatics using Alx-SZ as the catalyst, the model oil was used as feedstock, and the reaction was carried out under the same conditions as the catalytic activity test. The model oil was prepared by adding a certain amount of p-xylene (19 wt%) and 1-octene (1 wt%). The GC-MS technique was applied to analyze the reacted model oil as well as fresh oil, and the results were presented in Fig. 9. It could be seen from the graph above that the new peaks appeared at 16.4, 16.5 and 16.8 min. These new components detected in the reacted oil were identified to be reaction products. On the other hand, the mass spectrometry analysis (Fig. S2†) confirmed that these products were C16H26 (m/z = 218) formed by the reaction of 1-octene (C8H16) with p-xylene (C8H10), and the structures of the reaction products were shown in Fig. 9, respectively. No dimerization products were found; therefore, the reaction using Alx-SZ as the catalyst in removing trace olefins in aromatics belongs to the Friedel–Crafts alkylation reaction.
In addition, different commercial solid acid catalysts, such as zeolite (USY), activated clay and modified clay (ROC), were also evaluated in removing trace olefins from aromatics at the same reaction conditions. The catalytic performances (Fig. S3†) demonstrated that Al-incorporated sulfated zirconia (Al/Zr < 7.50 mol%) appeared more excellent catalytic activities over the whole 8 hours compared with these commercial solid acid catalysts. Moreover, the lifetime of Al-incorporated sulfated zirconia was significantly extended, and the industrial application is promising.
Interestingly, the catalytic activity of as-synthesized catalysts was not positively correlated with the surface sulfur loading. It could be considered that the surface sulfur loading and sulfur species significantly affect the acid sites according to the analysis of acid properties in section 3.2.2, which, in turn, determined the catalytic performance. Thus, to gain a better understanding of the correlation between the acid type, acidity, and activity of the catalyst, we plotted relevant data in Fig. 10. It was noteworthy that whether initial reaction activity or final reaction activity of the catalyst was considered, the correlations between reactivity and acidity were similar. Even these catalysts with different acidity performed relatively high catalytic activity under the initial reaction condition. Still, as the reaction continued, the negative influences of inadequate acidity and plentiful acidity in the catalyst on catalytic activity were highlighted. It can also be inferred from Fig. 10 that both Lewis acid and Brønsted acid contributed to catalytic activity, which was consistent with prior studies1,4,59,65 that both Lewis acid and Brønsted acid play a vital role in the alkylation.
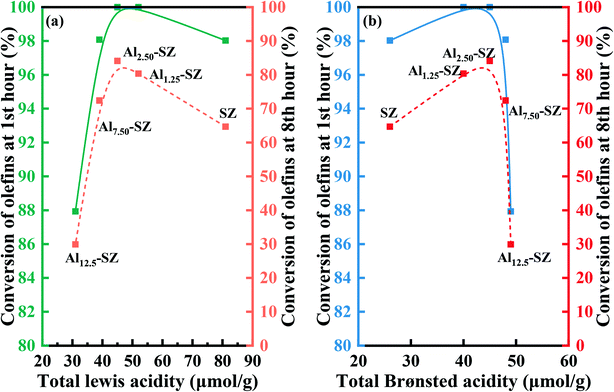 | ||
| Fig. 10 (a) The correlation between total Lewis acidity and catalytic activity. (b) Correlation between total Brønsted acidity and catalytic activity. | ||
Guided by GC-MS analysis and the mechanism proposed by S. Narayanan et al.66,67 for aniline alkylation reaction, the mechanism of olefin alkylation on both Lewis and Brønsted acid sites could be considered to follow the process shown in Scheme 3. Firstly, olefins are adsorbed on Brønsted acid sites to form stable carbocations, while benzene is adsorbed on Lewis acid sites due to its strong electron donating properties. Then, the carbocation reacted with benzene, adsorbed on Lewis acid sites to accomplish the alkylation reaction; meanwhile, benzene could be desorbed to release Lewis acid sites. Moreover, the proton, lost by benzene adsorbed on Lewis acid sites to balance the positive charge, migrate to the Brønsted acid sites to recover the hydroxyl group. Finally, Lewis acid and Brønsted acid sites are both recovered and continue with the next cycle. However, when the acidity in catalysts is excessive, especially for Brønsted acid, the product adsorbed on the acid site is challenging to desorb, resulting in final coking. Overall, the appropriate acidity in the catalyst was also a factor that allowed sulfated zirconia with excellent activity and high stability when applied in the alkylation of aromatics with olefins, while incorporating Al into zirconia properly contributed to balancing the distribution of Brønsted and Lewis acid sites of the catalysts.
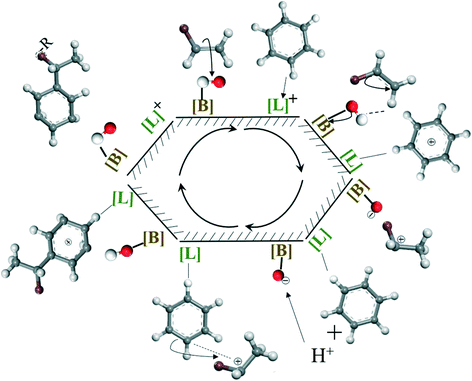 | ||
| Scheme 3 The mechanism of olefins alkylation on both Lewis and Brønsted acid sites (benzene as a representative for aromatics). | ||
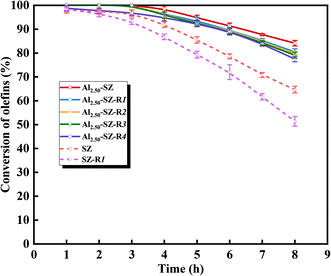
Apart from catalytic activity and stability, reusability is also a vital factor affecting the performance of the catalyst in the actual process of removing trace olefins from aromatics. In our present study, the reusability of catalysts was estimated by successive reaction cycles, and Al2.50-SZ and SZ were selected for comparison. After each catalytic reaction, the catalyst was separated, dried at 110 °C overnight and regenerated at 550 °C in air for 3 h. Then the reaction was performed under the same reaction conditions as before. As seen in Fig. 11, it was evident that the activity of Al2.50-SZ was almost fully recovered during the first four runs and only a 7.90% decline of the final conversion after five runs. Instead, the activity of SZ could not entirely be recovered after regenerating only once. Although the reactivity recovered to 95% ∼ 98% of the fresh SZ catalyst within four hours, the conversion of olefin plunged to 79.3% at the fifth hour. The continuous effect of deactivation finally resulted in the conversion at the eighth hour was only 51.4%, equivalent to 79.4% of the reactivity of fresh SZ under the equal reaction conditions. A sample calcination treatment can re-expose the active sites covered by the coke deposit to recover the catalytic activity, but this treatment cannot compensate for the loss of surface sulfate species. The activity results showed that Al2.50-SZ performed more excellent stability and reusability than SZ, which was likely caused by Al2.50-SZ losing fewer sulfur species during the reaction and regeneration.
3.4. Stability of surface sulfur species analysis
SZ-R2 (regenerate) and Al2.50-SZ-R5 (regenerate) were characterized by elemental analysis and pyridine-FTIR spectroscopy (FT-IR spectra are given in Fig. S4†). As Table 5 shows, the sulfur content of SZ-R2 decreased by 44.4%, while that of Al2.50-SZ only dropped by 27.6% after regenerated five times, which was consistent with the conjecture that Al2.50-SZ lost fewer sulfur species. In the meanwhile, both Lewis acidity and Brønsted acidity in the two samples were changed. For SZ-R2, the plummet of Lewis acidity could be observed; thereby, the total acidity was reduced considerably. It was undoubtedly related to the disappearance of active sites caused by the loss of sulfur species, a typical characteristic of conventional sulfated zirconia deactivation. Additionally, the total acidity of Al2.50-SZ-R5 was slightly decreased, and the transformation of the Brønsted acid site to Lewis acid site could be observed from Table 5. This transformation may be explained by the fact that the drop of surface sulfur loading, which in turn decreased the surface sulfur concentration of Al-incorporated sulfated zirconia and Lewis sites, previously covered by excess sulfur species, were re-exposed.| Sample | T | TL | TB | WL | WB | SL | SB | Sulfur (wt%) |
|---|---|---|---|---|---|---|---|---|
| T, total acidity, evacuation at 200 °C; S, strong acidity, evacuation at 450 °C; W, weak acidity; B, Brønsted acidity; L, Lewis acidity. Units = μmol g−1. | ||||||||
| SZ | 107 | 81 | 26 | 77 | 26 | 4 | — | 2.7 |
| SZ-R2 | 77 | 52 | 25 | 48 | 25 | 4 | — | 1.5 |
| Al2.50-SZ | 90 | 45 | 45 | 42 | 45 | 3 | — | 2.9 |
| Al2.50-SZ-R5 | 85 | 52 | 33 | 50 | 33 | 2 | — | 2.1 |
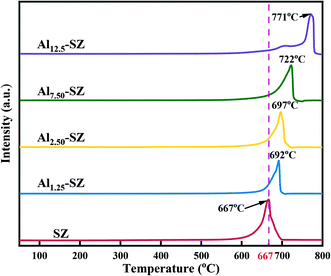
Fig. 12 presents the characterization data for H2-TPR. It could be found that a sharp peak was observed in the patterns of various samples, which was attributed to the reduction of surface sulfur species.68 The most significant aspect of this figure was that the peaks of the Al-incorporated catalysts shifted to high reduction temperature and exhibited larger areas than that of SZ. It was likely that the Al–O–S bond had higher bond energy, making it hard for the catalyst to release sulfur species. Under the previous analysis of XPS, aluminium incorporation allowed the catalyst to gain more sulfur with high binding energy, which was assigned to the sulfur that interacted with the Al–O bond. Therefore, the Al–O–S bond dominated a stronger “anchor” role to sulfur species than the Zr–O–S bond. On the other hand, as mentioned in section 3.1, sulfur species on the surface of T-ZrO2 exhibited superior thermal stability, while aluminium incorporation could enhance the crystallization of T-ZrO2. Taken together, it seemed that aluminium incorporation could improve the strength and stability of surface sulfate species. And this promotion resulted in the catalyst performing outstanding stability and reusability.
4. Conclusions
Al-Incorporated sulfated zirconia was successfully synthesized by incorporating Al into the zirconia with a co-precipitation method and evaluated in alkylation for removing trace olefins from aromatics. Incorporation of Al at the level of Al/Zr <7.5 mol% enhanced catalytic activity and reusability, attributed to the superior acid site loading and increased sulfur contents retained in ZrO2, while higher Al concentrations reduced the specific surface area and weakened Lewis acid sites, resulting in lower activity and lifetime. In particular, the most outstanding catalytic activity was obtained by Al2.50-SZ, which also performed a negligible drop in olefins conversion over five reaction cycles when it came to the reusability of catalysts. According to the characterization results, it was ascertained that the structural and surface sulfate species of the catalyst were significantly affected by the presence of Al. Incorporating small amounts of Al into zirconia can effectively promote forming abundant Zr–O–Al bonds and stabilising the tetragonal zirconia with small grain size, both of which contribute to improving and stabilizing surface sulfur species. Furthermore, Al promoters play a significant role in increasing the surface sulfur concentration and enhancing the partially ionic nature surface sulfur species, resulting in the increase of Brønsted acid sites with the decrease of Lewis acid sites.Conflicts of interest
There are no conflicts to declare.Acknowledgements
We gratefully acknowledge financial support from the National Natural Science Foundation of China (No. 21808054).Notes and references
- X. Pu, N. Liu and L. Shi, Microporous Mesoporous Mater., 2015, 201, 17–23 CrossRef CAS.
- X. Pu, N. Liu, Z. Jiang and L. Shi, Ind. Eng. Chem. Res., 2012, 51, 13891–13896 CrossRef CAS.
- Y. Tian, X. Meng and L. Shi, Ind. Eng. Chem. Res., 2013, 52, 6655–6661 CrossRef CAS.
- N. Liu, X. Pu and L. Shi, Chem. Eng. Sci., 2014, 119, 114–123 CrossRef CAS.
- J. Yao, N. Liu, L. Shi and X. Wang, Catal. Commun., 2015, 66, 126–129 CrossRef CAS.
- G. X. Yu, X. L. Zhou, C. Tang, C. L. Li, J. A. Wang and O. Novaro, Catal. Commun., 2008, 9, 1770–1774 CrossRef CAS.
- A. I. Rabee, L. J. Durndell, N. E. Fouad, L. Frattini, M. A. Isaacs, A. F. Lee, G. A. Mekhemer, V. C. dos Santos, K. Wilson and M. I. Zaki, Mol. Catal., 2018, 458, 206–212 CrossRef CAS.
- V. S. Marakatti, S. Marappa and E. M. Gaigneaux, New J. Chem., 2019, 43, 7733–7742 RSC.
- F. Cavani, S. Guidetti, C. Trevisanut, E. Ghedini and M. Signoretto, Appl. Catal., A, 2011, 409, 267–278 CrossRef.
- I. Dosuna-Rodríguez, C. Adriany and E. M. Gaigneaux, Catal. Today, 2011, 167, 56–63 CrossRef.
- N. Essayem, V. Martin, A. Riondel and J. C. Védrine, Appl. Catal., A, 2007, 326, 74–81 CrossRef CAS.
- M. A. Abedin, S. Kanitkar, S. Bhattar and J. J. Spivey, Catal. Today, 2021, 365, 71–79 CrossRef CAS.
- P. Wang, J. Zhang, G. Wang, C. Li and C. Yang, J. Catal., 2016, 338, 124–134 CrossRef CAS.
- Y. Zhang, T. Chen, G. Zhang, G. Wang and H. Zhang, Appl. Catal., A, 2018, 562, 258–266 CrossRef CAS.
- A. K. Amin, W. Trisunaryanti and K. Wijaya, J. Nano Res., 2019, 57, 31–39 CAS.
- P. Nascimento, C. Akratopoulou, M. Oszagyan, G. Coudurier, C. Travers, J. F. Joly and J. C. Vedrine, in New Frontiers in Catalysis - Proceedings of the 10th International Congress on Catalysis, Budapest, 1993, pp. 1185–1197, DOI:10.1016/s0167-2991(08)64443-2.
- S. Ohyama, Top. Catal., 2003, 22, 337–343 CrossRef CAS.
- N. Liu, X. Wang, L. Shi and X. Meng, New J. Chem., 2019, 43, 3625–3632 RSC.
- J. Wang and C. Mou, Microporous Mesoporous Mater., 2008, 110, 260–270 CrossRef CAS.
- M. A. Coelho, D. E. Resasco, E. C. Sikabwe and R. L. White, Catal. Lett., 1995, 32, 253–262 CrossRef CAS.
- J. Wang and C. Mou, Appl. Catal., A, 2005, 286, 128–136 CrossRef CAS.
- C. Chen, S. Cheng, H. Lin, S. Wong and C. Mou, Appl. Catal., A, 2001, 215, 21–30 CrossRef CAS.
- J. Wang and C. Mou, Catal. Today, 2008, 131, 162–172 CrossRef CAS.
- Y. Yang and H. Weng, Appl. Catal., A, 2010, 384, 94–100 CrossRef CAS.
- I. Ullah, T. Taha, A. M. Alenad, I. Uddin, A. Hayat, A. Hayat, M. Sohail, A. Irfan, J. Khan and A. Palamanit, Interfaces, Surf. Interfaces, 2021, 25, 101227 CrossRef CAS.
- D. J. Zalewski, S. Alerasool and P. K. Doolin, Catal. Today, 1999, 53, 419–432 CrossRef CAS.
- P. D. L. Mercera, J. G. V. Ommen, E. B. M. Doesburg, A. J. Burggraaf and J. R. H. Ross, Appl. Catal., 1990, 57, 127–148 CrossRef CAS.
- C. Morterra, C. G. F. Pinna and M. Signoretto, J. Catal., 1995, 157, 109–123 CrossRef CAS.
- T. Y. Toshio Ishida and K. Tanabe, Chem. Lett., 1988, 1869–1872 CrossRef.
- X. Zhang, A. I. Rabee, M. Isaacs, A. F. Lee and K. Wilson, Engineering, ACS Sustainable Chem. Eng., 2018, 6, 14704–14712 CrossRef CAS.
- P. Wang, S. Wang, C. Yang, C. Li and X. Bao, Ind. Eng. Chem. Res., 2019, 58, 14638–14645 CrossRef CAS.
- W. Hua, Y. Xia, Y. Yue and Z. Gao, J. Catal., 2000, 196, 104–114 CrossRef CAS.
- Z. Ma, X. Meng, C. Yang, N. Liu, Y. Zhang and L. Shi, Ind. Eng. Chem. Res., 2017, 56, 5598–5606 CrossRef CAS.
- R. Iwamoto, C. Fernandez, J. P. Amoureux and J. Grimblot, J. Phys. Chem. B, 1998, 102, 4342–4349 CrossRef CAS.
- S. C. Shen, Q. Chen, P. S. Chow, G. H. Tan, X. T. Zeng, Z. Wang and R. B. H. Tan, J. Phys. Chem. C, 2007, 111, 700–707 CrossRef CAS.
- R. O. Patrizia Canton, F. Pinna, G. Strukul, P. Riello, M. Meneghetti, G. Cerrato, C. Morterra and A. Benedetti, Chem. Mater., 2001, 13, 1634–1641 CrossRef.
- R. Beerthuis, L. Huang, N. R. Shiju, G. Rothenberg, W. Shen and H. Xu, ChemCatChem, 2018, 10, 211–221 CrossRef CAS.
- H. Tüysüz, Y. J. Hwang, S. B. Khan, A. M. Asiri and P. Yang, Nano Res., 2012, 6, 47–54 CrossRef.
- S. Ardizzone, C. L. Bianchi, G. Cappelletti and F. Porta, J. Catal., 2004, 227, 470–478 CrossRef CAS.
- T. Witoon, T. Permsirivanich, N. Kanjanasoontorn, C. Akkaraphataworn, A. Seubsai, K. Faungnawakij, C. Warakulwit, M. Chareonpanich and J. Limtrakul, Catal. Sci. Technol., 2015, 5, 2347–2357 RSC.
- J. Ryczkowski, Catal. Today, 2001, 68, 263–381 CrossRef CAS.
- E. Vlasov, S. Myakin, M. Sychov, A. Aho, A. Y. Postnov, N. Mal'Tseva, A. Dolgashev, S. O. Omarov and D. Y. Murzin, Catal. Lett., 2015, 145, 1651–1659 CrossRef CAS.
- S. Zhou, Y. Song, J. Zhao, X. Zhou and L. Chen, Fuels, Energy Fuels, 2021, 35, 14860–14867 CrossRef CAS.
- M. Abdollahi-Alibeik and E. Shabani, J. Iran. Chem. Soc., 2013, 11, 351–359 CrossRef.
- B. Tyagi, M. K. Mishra and R. V. Jasra, J. Mol. Catal. A: Chem., 2007, 276, 47–56 CrossRef CAS.
- B. T. Manish, K. Mishra and R. V. Jasra, Ind. Eng. Chem. Res., 2003, 42, 5727–5736 CrossRef.
- J. L. Ropero-Vega, A. Aldana-Pérez, R. Gómez and M. E. Niño-Gómez, Appl. Catal., A, 2010, 379, 24–29 CrossRef CAS.
- V. Vishwanathan, G. Balakrishna, B. Rajesh, V. Jayasri, L. M. Sikhwivhilu and N. J. Coville, Catal. Commun., 2008, 9, 2422–2427 CrossRef CAS.
- T. Yamaguchi, T. Jin and K. Tanabe, J. Phys. Chem., 1986, 90, 3148–3152 CrossRef CAS.
- M. Bensitel, O. Saur, J.-C. Lavalley and B. A. Morrow, Mater. Chem. Phys., 1988, 19, 147–156 CrossRef CAS.
- X. Li, K. Nagaoka, R. Olindo and J. Lercher, J. Catal., 2006, 238, 39–45 CrossRef CAS.
- V. K. Booramurthy, R. Kasimani, S. Pandian, B. J. E. S. Ragunathan and P. Research, Environ. Sci. Pollut. Res., 2020, 1–8 Search PubMed.
- S. Ardizzone, C. L. Bianchi, V. Ragaini and B. Vercelli, Catal. Lett., 1999, 62, 59–65 CrossRef CAS.
- H. Wang, Y. Li, F. Yu, Q. Wang, B. Xing, D. Li and R. Li, Chem. Eng. J., 2019, 364, 111–122 CrossRef CAS.
- K. Arata and M. J. A. C. Hino, Appl. Catal., 1990, 59, 197–204 CrossRef CAS.
- T. Yamaguchi, T. Jin and K. Tanabe, J. Phys. Chem., 1986, 90, 3148–3152 CrossRef CAS.
- C. A. Emeis, J. Catal., 1993, 141, 347–354 CrossRef CAS.
- P. Kalita, N. Gupta and R. Kumar, J. Catal., 2007, 245, 338–347 CrossRef CAS.
- K. Ren, D. Kong, X. Meng, X. Wang, L. Shi and N. Liu, J. Saudi Chem. Soc., 2019, 23, 198–204 CrossRef CAS.
- M. K. Mishra, B. Tyagi and R. V. Jasra, J. Mol. Catal. A: Chem., 2004, 223, 61–65 CrossRef CAS.
- Y. Sun, S. Ma, Y. Du, L. Yuan, S. Wang, J. Yang, F. Deng and F.-S. Xiao, J. Phys. Chem. B, 2005, 109, 2567–2572 CrossRef CAS PubMed.
- K. Föttinger, K. Zorn and H. Vinek, Appl. Catal., A, 2005, 284, 69–75 CrossRef.
- Q. Zhao, J. Yao, L. Shi and X. Wang, RSC Adv., 2016, 6, 84553–84561 RSC.
- J. Liu, N. Liu, K. Ren, L. Shi and X. Meng, Ind. Eng. Chem. Res., 2017, 56, 7693–7699 CrossRef CAS.
- N. Liu, X. Pu, X. Wang and L. Shi, J. Ind. Eng. Chem., 2014, 20, 2848–2857 CrossRef CAS.
- S. Narayanan and K. Deshpande, J. Mol. Catal. A: Chem., 1995, 104, 109–113 CrossRef CAS.
- S. Narayanan and K. Deshpande, Appl. Catal., A, 2000, 199, 1–31 CrossRef CAS.
- H. Song, N. Wang, H. Song, F. Li and Z. Jin, Chin. J. Chem. Eng., 2014, 22, 1226–1231 CrossRef CAS.
Footnote |
| † Electronic supplementary information (ESI) available. See DOI: 10.1039/d1cy01443a |
| This journal is © The Royal Society of Chemistry 2022 |


