Single atom catalysis for electrocatalytic ammonia synthesis
Jieying
Wan
,
Jiageng
Zheng
,
Hao
Zhang
,
Angjian
Wu
 * and
Xiaodong
Li
*
State Key Laboratory of Clean Energy Utilization, Zhejiang University, Hangzhou 310027, P. R. China. E-mail: wuaj@zju.edu.cn; lixd@zju.edu.cn
First published on 26th October 2021
Abstract
Ammonia is a vital base molecule for modern agriculture and industry. As the commercially-mature approach for NH3 production, the traditional Haber–Bosch process has achieved great success; however, it also suffers from drawbacks such as massive energy consumption and huge CO2 emissions. The electrocatalytic nitrogen reduction reaction (eNRR) process, powered by intermittent renewable energy, can realize the carbon-neutral and on-site generation of NH3 under mild conditions directly from air/N2 and water, and has gradually emerged as a multidisciplinary research hotspot. Owing to their advantages such as maximum atom utilization as well as special coordination environment and electronic structure, single atom catalysts (SACs) exhibit great potential in enhancing the faradaic efficiency and ammonia yield rate of the eNRR process. This review analyzes recent theoretical and experimental advances in the development of SACs used for the eNRR, including their synthesis and in situ characterization, as well as the classification and activity of noble metal-, non-noble metal- and nonmetal-based SACs. In addition, we summarize the unique structure and electronic properties of SACs and their enhanced activity in electrochemical reactions, to guide the rational design of efficient catalysts. Finally, we discuss major challenges related to the synthesis of NH3via SACs, and outline future prospects in their development.
1. Introduction
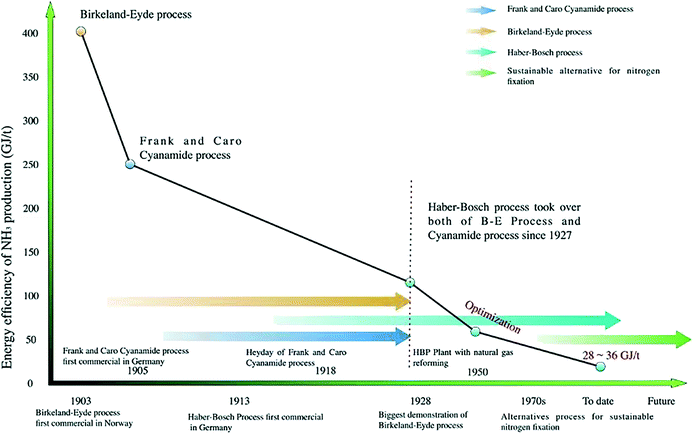
Ammonia (NH3) is one of the most important and widely applied base chemicals. Its global production is 235.34 Mt and is expected to reach 290 Mt in 2030.1 In addition, the global ammonia market is expected to reach 76.64 billion US dollars by 2025.2 An 88% proportion of the synthesized NH3 is used to produce agricultural fertilizers.3,4 NH3 production accounts for >40% of the overall industrial revenue and contributes to global population growth.5 In addition, NH3 is used as a raw material for manufacturing medicines, synthetic fibers, explosives, plastics, rubber, etc.6,7 Following the rapid development of renewable energy technologies, NH3 plays a promising role as a H2 energy carrier, owing to its advantages such as high energy density (17.6% hydrogen content) and relatively low-cost transportation.8,9 As a carbon-free molecule, renewable NH3 holds promise for replacing the current fossil fuel-based energy industry with a zero-emission approach.Although the atmosphere is rich in nitrogen, the inert nature of N2 makes the synthesis of NH3 undisputedly challenging. The breakage of the N![[triple bond, length as m-dash]](https://www.rsc.org/images/entities/char_e002.gif) N bond requires an extremely high energy (∼941 kJ mol−1).10 The first-generation artificial nitrogen fixation method was the Birkeland–Eyde process, which directly combines nitrogen and oxygen on an electric arc to produce NO. The development of this process was hindered by the low energy efficiency and immature electricity market in the early 20th century.11 Similarly, the modern Frank–Caro process, based on the reaction between nitrogen and calcium carbide, was also limited by its poor productivity and energy efficiency.
N bond requires an extremely high energy (∼941 kJ mol−1).10 The first-generation artificial nitrogen fixation method was the Birkeland–Eyde process, which directly combines nitrogen and oxygen on an electric arc to produce NO. The development of this process was hindered by the low energy efficiency and immature electricity market in the early 20th century.11 Similarly, the modern Frank–Caro process, based on the reaction between nitrogen and calcium carbide, was also limited by its poor productivity and energy efficiency.
Today, ammonia production heavily relies on the Haber–Bosch process (HBP), one of the most important reactions in the 20th century, invented by Fritz Haber and Carl Bosch over one century ago. In practice, the HBP uses Fe-based catalysts and is performed at a pressure of 250–350 bar and a temperature of 450–550 °C. The main H2 source for the HBP is steam reforming of CH4 from natural gas, which results in ∼400 Mt CO2 emitted for NH3 production every year (∼1.2% of the global emissions per year). The HBP also consumes 1–3% of the annual global energy production.12–15 Highly centralized HBP infrastructures require huge capital costs, and in most developing countries and remote areas their creation is hampered by insufficient financial resources and poor transportation.16 Hence, developing decentralized, eco-friendly, and sustainable alternatives for NH3 production using renewable resources is a task of great significance (Fig. 1).
The electrochemical nitrogen reduction reaction (eNRR) process produces NH3 from using water and N2 (eqn (1)). This process has attracted considerable interest for many years in light of its great potential for distributed NH3 production when powered by renewable energy (solar, wind, etc.).17
| N2 + 3H2O → NH3 + 3/2O2 | (1) |
| Electrocatalyst | Electrolyte | Reactant | Potential (V versus RHE) | Production rate (μg cm−2 h−1) | Production rate (μg mgcat.−1 h−1) | FE (%) | Ref. |
|---|---|---|---|---|---|---|---|
| Au1/C3N4 | H2SO4 | N2 | −0.1 | — | 1.9 | 11.1 | 24 |
| AuSAs-NDPC | HCl | N2 | −0.2 | 2.3 | — | 12.3 | 25 |
| Boron@graphene | H2SO4 | N2 | −0.5 | 9.8 | — | 10.8 | 26 |
| CSA/NPC | Na2SO4 | N2 | −0.2 | 14.6 | — | 10.5 | 27 |
| NC–Cu SA | KOH | N2 | −0.35 | — | 53.3 | 13.8 | 28 |
| HCl | N2 | −0.3 | — | 49.3 | 11.7 | ||
| FeMo@NG | LiClO4 | N2 | −0.4 | — | 14.9 | ∼10 | 29 |
| −0.2 | — | 3.4 | 41.7 | ||||
| ISAS-Fe/NC | Phosphate buffer solution | N2 | −0.4 | 62.9 ± 2.7 | 62.9 ± 2.7 | 18.6 ± 0.8 | 23 |
| FeSA–N–C | KOH | N2 | 0 | — | 7.48 | 56.55 | 30 |
| Fe–N/C–CNTs | KOH | N2 | −0.2 | — | 34.8 | 9.28 | 31 |
| Fe–N–C | NH4Cl | N2 | −0.05 | 0.9 | — | 4.51 | 32 |
| SA-Mo/NPC | KOH | N2 | −0.3 | — | 34.0 ± 3.6 | 14.6 ± 1.6 | 33 |
| P-CNTs | LiClO4 | N2 | −1.1 | — | 24.4 | ∼0.9 | 34 |
| Ru SAs/N–C | H2SO4 | N2 | −0.2 | — | 120.9 | 29.6 | 35 |
| Ru@ZrO2/NC | HCl | N2 | −0.11 | — | 1 | 21 | 36 |
| Ru/NC | HCl | N2 | −0.21 | — | 10.995 | ∼8.87 | |
| Ru SAs/g-C3N4 | NaOH | N2 | 0.05 | — | 23 | 8.3 | 37 |
| Y1/NC | HCl | N2 | −0.1 | 23.2 | — | 12.1 | 38 |
| Sc1/NC | HCl | N2 | −0.1 | 20.4 | — | 11.2 | |
| Au1Co1@GO | K2SO4 | N2 | −0.2 | — | 36.82 | 22.03 | 39 |
| CNS | LiClO4 | N2 | −1.19 | 97.18 | — | 11.56 | 40 |
| MoS2/CC | Na2SO4 | N2 | −0.5 | 4.94496 | — | 1.17 | 41 |
| MoN NA/CC | HCl | N2 | −0.3 | 18.4212 | — | 1.15 | 42 |
| VN NPs | Nafion | N2 | −0.1 | 20.196 | — | 6 | 43 |
| o-Fe2O3–Ar/CNT | KOH | N2 | −0.9 V vs. Ag/AgCl | 0.46 | — | 6.04 | 44 |
| Fe/Fe3O4 | Phosphate buffer solution | N2 | −0.3 | 0.19 | — | 8.29 | 45 |
| Au nanoparticle@N-doped porous carbon | HCl | N2 | −0.2 | 36 | — | 22 | 46 |
| AuHNCs | LiClO4 | N2 | −0.5 | 3.98 | — | 14.8 | 47 |
| −0.4 | 2.35 | — | 30.22 | ||||
| NiCoS/C | LiSO4 | N2 | 0 | 2.6 | — | 12.9 | 48 |
| Ag/CPE | HCl | N2 | −0.6 | 2.82744 | — | 4.8 | 49 |
| Au1Cu1/GCE | H2SO4 | N2 | −0.2 | — | 154.91 | 54.96 | 50 |
| Ru@MXene | KOH | N2 | −0.4 | 39.1 | — | 13.13 | 51 |
| Ru2P–rGO | HCl | N2 | −0.05 | — | 32.8 | 13.04 | 52 |
| Nb2O5 nanofiber | HCl | N2 | −0.55 | — | 43.6 | 9.26 | 53 |
| B4C/CPE | HCl | N2 | −0.75 | — | 26.57 | 15.95 | 54 |
| Bi NS | Na2SO4 | N2 | −0.8 | 2.54 ± 0.16 | — | 10.46 ± 1.45 | 55 |
| BNS/CP | Na2SO4 | N2 | −0.8 | — | 13.22 | 4.04 | 56 |
| MnO/TM | Na2SO4 | N2 | −0.39 | 6.72 | — | 8.02 | 57 |
| FL-BP NSs/CF | HCl | N2 | −0.7 | — | 31.37 | 3.09 | 58 |
| −0.6 | — | 20.87 | 5.07 | ||||
| O-CNT/CP | LiClO4 | N2 | −0.4 | — | 32.33 | 12.5 | 59 |
| BP/CP | HCl | N2 | −0.6 | — | 26.42 | 12.7 | 60 |
| OVs-MoO2 | HCl | N2 | −0.15 | — | 12.2 | 8.2 | 61 |
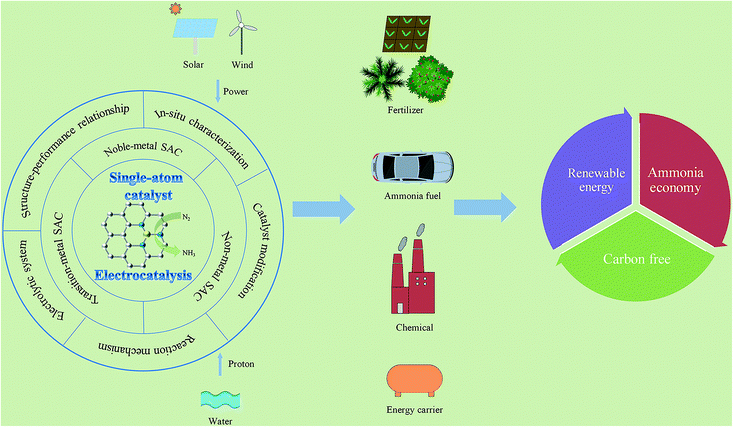
Shi et al. observed that Au sub-nanoparticles (sub-NPs) embedded in a Ti substrate showed the best eNRR performance at a size scale of 0.5 nm. In contrast, the yield and FE corresponding to nanoparticle sizes of 37 and 4 nm were very low, which highlighted the advantages associated with sub-nano-scale sizes and high dispersion of nanoparticles.22 Reducing the size of metal materials can increase the number of unsaturated active sites, broaden the distribution of electronic energy levels, and enhance the interaction between the metal and substrate, thus improving the catalytic activity of the metal atoms for specific reactions. It is reasonable to speculate that a more substantial improvement in electrocatalytic performance can be achieved by further reducing the size of the material, even reaching the atomic dispersion level. Downsizing electrocatalysts typically provides a means to enhance their activity toward sluggish processes, and the simpler structure is also helpful to understand the corresponding reaction mechanisms. Hence, single-atom catalysts (SACs) have emerged as promising candidates for overcoming the inert nature of N2. SACs provide uncoordinated active sites and unique electronic structures that may facilitate the breakage of N![[triple bond, length as m-dash]](https://www.rsc.org/images/entities/char_e002.gif) N bonds. A record NH3 productivity of 0.062 mgNH3 cm−2 h−1and a faradaic efficiency of 18% at −0.4 VRHE were achieved using a Fe SAC.23 Moreover, owing to their simple and tunable structures and active sites, SACs can also enable a better understanding of the eNRR mechanism, as shown in Fig. 2.
N bonds. A record NH3 productivity of 0.062 mgNH3 cm−2 h−1and a faradaic efficiency of 18% at −0.4 VRHE were achieved using a Fe SAC.23 Moreover, owing to their simple and tunable structures and active sites, SACs can also enable a better understanding of the eNRR mechanism, as shown in Fig. 2.
In this paper, we reviewed recent progress on SACs for electrocatalytic NH3 synthesis, focusing on the following aspects: (1) synthetic strategies for single-atom eNRR catalysts; (2) latest advances in eNRR performance using SACs; (3) reaction mechanism of the SAC-catalyzed eNRR to NH3. Finally, we discuss key challenges and future perspectives for developing more active and selective SACs toward NH3 production from the eNRR.
2. Synthesis methods and characterization of SACs
2.1 SACs synthesis methods
The most critical challenge in the synthesis of SACs is their tendency to aggregate. Owing to the high surface free energy of isolated single atoms, their migration and aggregation into nanoclusters or nanoparticles are thermodynamically favorable in the absence of stable chemical coordination.62 In addition, the scale-up synthesis of SACs is also an essential aspect for their practical applications. Many synthetic strategies have been developed to date, including atomic layer and electrochemical depositions, as well as wet chemical and pyrolysis methods.63For example, Sun and co-workers used a Pt precursor and O2 to synthesize a Pt single-atom catalyst using ALD (Fig. 3a).66 The oxygen-based functional groups on the surface of graphene nanosheets reacted with the MeCpPtMe3 ligand to form a Pt monolayer. Then oxygen was exposed to the Pt surface to form a new layer of surface O− species that reacted with MeCpPtMe3 in the next cycle. Therefore, Pt deposition could be controlled precisely by adjusting the number of ALD cycles.
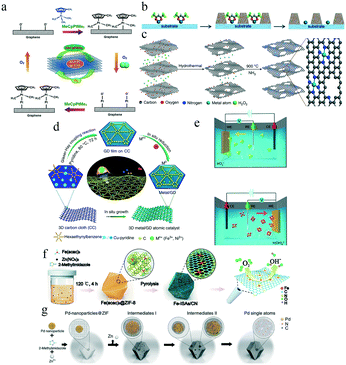 | ||
| Fig. 3 (a) Schematic illustrations of the Pt ALD mechanism on graphene nanosheets. This figure has been adapted from ref. 66 with permission from Springer Nature, copyright 2013. (b) Schematics of thermally stable Pd1 catalysts synthesized using ALD. This figure has been adapted from ref. 67 with permission from Royal Society of Chemistry, copyright 2016. (c) The graphene oxide solution in the presence of H2O2 and metal precursors was hydrothermally treated to form a 3D graphene hydrogel. This figure has been adapted from ref. 68 with permission from Springer Nature, copyright 2018. (d) Protocols for the synthesis of Ni/graphdiyne and Fe/graphdiyne. This figure has been adapted from ref. 70 with permission from Springer Nature, copyright 2018. (e) Electrochemical deposition mechanism. a and b Schematic of cathodic and anodic deposition of Ir species. This figure has been adapted from ref. 71 with permission from Springer Nature, copyright 2020. (f) Schematic illustration of the formation of Fe-ISAs/CN. This figure has been adapted from ref. 73 with permission from Wiley-VCH, copyright 2017. (g) Scheme of the transformation of nanoparticles to single atoms and structural characterization of Pd single atoms. This figure has been adapted from ref. 74 with permission from Springer Nature, copyright 2018. | ||
Similarly, Lei and co-workers demonstrated an approach to stabilize single-atom Pd catalysts using ultrathin metal oxide protective coatings prepared by ALD (Fig. 3b).67 Palladium hexafluoroacetylacetonate (Pd(hfac)2) was first chemisorbed on the surface of Al2O3 using ALD. Then, ultrathin TiO2 coatings were deposited onto the substrate by ALD. The TiO2 layer selectively grew on the surface without Pd(hfac)2 to form nanocavities. Finally, the Pd SACs were formed in the TiO2 nanocavities after removing the hfac ligands using formalin (HCHO). High-precision instruments are required to precisely achieve ALD.
For instance, Fei and co-workers hydrothermally treated a mixture of graphene oxide, metal precursor, and H2O2 to obtain metal-doped graphene hydrogels as the precursors for SACs (Fig. 3c).68 After being freeze-dried, the gel was annealed at 900 °C in an NH3 atmosphere. Then, metal atoms were uniformly anchored on the nitrogen-doped graphene surface in an MN4C4 coordination configuration.
Similarly, Choi and co-workers prepared an atomically dispersed Pt catalyst on zeolite-templated carbon (ZTC), with a high Pt loading of ∼5 wt%.69 S-doped ZTCs were synthesized by acetylene/H2S chemical vapor deposition in a NaX zeolite template at 823 K. Subsequently, the Pt catalysts were impregnated in the ZTCs using H2PtCl6. The results revealed a positive correlation between the Pt loading and the S content of the ZTCs.
In most cases, the number of anchoring sites and the agglomeration tendency of a metal atom limit the metal loadings of SACs processed via wet chemical approaches to less than 1 wt%.65 Therefore, low-concentration metal precursors and high-surface area supports are desirable for the application of wet chemical methods.
For example, Xue and co-workers prepared Ni/graphdiyne and Fe/graphdiyne SACs through a two-step strategy (Fig. 3d). In the first step, a three-dimensional (3D) graphdiyne foam (GDF) was fabricated on carbon cloth (CC) surfaces via an acetylenic cross-coupling reaction using hexaethynylbenzene (HEB) as the precursor. Then, Ni/Fe atoms were anchored on the GDF by a facile electrochemical reduction method.70
Moreover, Zhang and co-workers proposed a general electrochemical deposition method to synthesize more than 30 different kinds of single-atom catalysts (Fig. 3e). They varied the types of metal precursors and supports as well as the electrodeposition reactions that occurred at the anode or cathode to obtain different single-atom structures.71 For example, the authors mixed IrCl4 with a KOH aqueous solution to obtain the metal precursor. Ir SACs could then be synthesized through both cathodic and anodic deposition. At the cathode, the Ir SACs were formed via the deposition of IrCl3+; at the anode, Ir(OH)62− was the precursor of the Ir SACs formed on Co(OH)2 nanosheets. In brief, the deposition rate of the metal precursor can be adjusted by regulating the electrochemical current.
For example, Chen and co-workers impregnated iron acetylacetone (Fe(acac)3) in the zeolitic imidazolate framework ZIF-8 (Fig. 3f).73 High-temperature pyrolysis transformed this composite into a Fe SAC supported by porous N-doped carbon (Fe-ISAs/NC). The Fe loading reached 2.16 wt%.
Similarly, Wei and co-workers reported the conversion of noble metal nanoparticles into thermally stable and highly active SACs based on Pd (Fig. 3g).74 They grew ZIF-8 nanocrystals on Pd NPs by mixing the Pd NPs, a Zn(NO3)2 solution, and a 2-methylimidazole solution. The Pd-NPs@ZIF-8 nanocomposites were then annealed at 900 °C under an inert atmosphere for 3 h. The Pd SACs were formed on the nitrogen-doped carbon support after annealing, as confirmed by high-resolution high-angle annular dark field-scanning transmission electron microscopy (HAADF-STEM), extended X-ray absorption fine structure (EXAFS), and X-ray absorption near-edge structure (XANES) measurement.
In addition, taking advantage of the pore confinement effect of MOFs, Zhong et al. proposed a MOF precursor-based co-pyrolysis approach for the synthesis of SACs.75,76 After mixing the precursors for fabricating Co-MOF, different amounts of prepared Co-MOF and urea were employed for co-pyrolysis. Finally, a series of metal atomically dispersed Co–C3N4 SACs with different metal contents were obtained. Benefiting from the confinement function of the MOF structure and the close interaction between the MOF and graphitic C3N4 (g-C3N4), Co single atoms could be uniformly dispersed on the substrate during g-C3N4 formation. Therefore, the introduction of porous framework materials as precursors promotes the subsequent atomic dispersion.
The general characteristics of the different SAC synthesis methods are summarized in Table 2. ALD can achieve precise control through accurate and expensive equipment. Wet chemical methods involve simple procedures and equipment, but usually require repeated operation. Electrochemical deposition can control the deposition rate by changing the current. Pyrolysis can achieve high structural stability and metal loadings at the expense of a higher-temperature atmosphere. Therefore, improving the different synthetic methods according to their respective characteristics is a task of great importance to avoid atom aggregation and increase the yield of SACs.
| Synthesis methods | Advantages |
|---|---|
| Atomic layer deposition | Precise control of the SACs synthesis process |
| Wet chemical method | Simple operation; potential for large-scale SACs synthesis |
| Electrochemical deposition | The deposition rate can be controlled by the current; simple and flexible equipment |
| Pyrolysis | High structural stability and metal loading |
2.2 Characterization techniques for SACs
Accurate and suitable characterization techniques are crucial for developing SACs, owing to their unique structure and specific coordination environment. Based on an efficient characterization, the geometric, electronic and coordination structures of SACs can be correlated with their catalytic performance, providing an in-depth understanding of the relevant electrochemical reactions.Scanning electron microscopy (SEM) and transmission electron microscopy (TEM) are used to reveal the morphology of the catalyst, i.e., its geometric structure (Fig. 4a). HAADF-STEM with atomic resolution (Fig. 4a) can further qualitatively distinguish single-atom catalysts and nanoparticles.35,77 The HAADF-STEM images and the corresponding energy-dispersive X-ray spectroscopy (EDS) elemental mappings can be used to examine the homogeneity of the element distribution in a selected area of a SAC. For instance, Geng Z. et al. used HAADF-STEM and EDS to reveal the uniform distribution of Ru on a carbon substrate.35 Using the same techniques, both Wang et al. and Zhang et al. confirmed the presence of isolated Fe sites anchored on an N-doped carbon support for a single-atom Fe catalyst (Fig. 4a).30,32
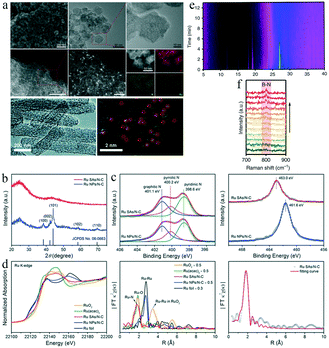 | ||
| Fig. 4 (a) Typical SEM, TEM, and HAADF-STEM images, and corresponding EDS elemental mapping results. This figure has been adapted from ref. 35 with permission from Wiley-VCH, copyright 2018. This figure has been adapted from ref. 77 with permission from the Royal Society of Chemistry, copyright 2019. (b) XRD patterns of Ru SAs/N–C and Ru NPs/N–C. This figure has been adapted from ref. 35 with permission from Wiley-VCH, copyright 2018. (c) XPS spectra of the N 1s and Ru 3p3/2 for Ru SAs/N–C and Ru NPs/N–C. This figure has been adapted from ref. 35 with permission from Wiley-VCH, copyright 2018. (d) Ru K-edge XANES spectra and EXAFS spectra of Ru SAs/N–C, Ru NPs/N–C, RuO2, Ru(acac)3, and Ru foil. This figure has been adapted from ref. 35 with permission from Wiley-VCH, copyright 2018. (e) In situ XRD intensity map, and (f) in situ Raman spectra of the transformation from COF/NC to Eex-COF/NC. This figure has been adapted from ref. 79 with permission from Springer Nature, copyright 2019. | ||
X-ray diffraction (XRD) allows analysis of the crystal structure of a catalyst. In a typical SAC, the diffraction peaks of the corresponding bulk metal, metal oxides, and other crystalline compositions are generally absent. Fig. 4b shows the (002) and (101) facets of graphitic carbon in N-doped-carbon-supported Ru SACs (Ru SAs/N–C) and Ru nanoparticles (Ru NPs/N–C).35 The absence of the XRD peaks of Ru crystals' for Ru SAs/N–C indicates that the Ru atoms in the catalysts are likely to be single sites.35
X-ray photoelectron spectroscopy (XPS) can reveal the chemical composition and valence states of SACs. For example, the XPS profiles of the N 1s and Ru 3p3/2 levels for Ru SAs/N–C and Ru NPs/N–C confirmed that the derivative of ZIF-8 was transformed into N-doped carbon, and the oxidation state of Ru in Ru SAs/N–C was approximately +3 (Fig. 4c).35
X-ray absorption spectroscopy (XAS) is used to examine structures whose X-ray absorption coefficients vary with the energy of X-ray. Upon absorbing X-ray energy, the core electrons of the samples are excited into vacant orbitals, providing information about the XANES. When core electrons are excited into a continuous bond and form superposition of waves with the surrounding atoms, the corresponding spectra are labeled EXAFS. XANES spectra can be used to analyze chemical valence states. Fourier-transform EXAFS spectroscopy is a powerful tool to inspect the coordination structures of atoms in a catalyst.78Fig. 4d shows the Ru K-edge XANES profile of Ru SAs/N–C, whose energy absorption edge matched well with that of Ru(acac)3.35 The valence state of Ru in Ru SAs/N–C was approximately +3, whereas the Ru species in Ru NPs/N–C had an oxidation state of 0. The EXAFS spectrum of Ru SAs/N–C contained only one peak corresponding to Ru–N bonds. The absence of Ru–Ru metallic bonds in the spectrum confirmed that Ru atoms in the Ru SAs/N–C structure were fully isolated.
The above techniques have been widely used to characterize the morphology and structure of SACs. Under electrochemical reaction conditions, the catalysts may undergo a series of complex dynamic evolutions and reconstructions. Hence, in situ/operando techniques are of great importance for investigating dynamic changes and understanding mechanisms in relevant catalytic processes. Given that SACs have well-defined active site structures, they are ideal platforms for mechanistic studies, particularly of the eNRR, which involves a complex reaction pathway with multiple electrons and protons transferred. In situ/operando characterization techniques can provide insight into the active centers and critical intermediates under working conditions. This information is crucial for devising highly selective and active SACs. For instance, Liu and co-workers studied a N-doped-carbon-supported COF (COF/NC) catalyst for the eNRR using in situ XRD and Raman spectroscopy (Fig. 4e and f).79 The in situ XRD results revealed the amorphization of the COF structure during the eNRR process (Fig. 4e). In contrast, under Ar-saturated conditions, the crystallinity of the COF/NC catalyst was almost unchanged. These results indicated that the transition of COF/NC from its crystalline to the amorphous state was induced by the eNRR process. The authors also performed in situ Raman tests to observe the structural changes taking place in the COF/NC catalyst under eNRR conditions (Fig. 4f). They observed the gradual appearance of the stretching vibrational band at approximately 800 cm−1, while no such change occurred in an Ar atmosphere. These results indicated that the lattice distortion of COF/NC originated from the chemical adsorption of nitrogen or nitrogen-containing intermediates on the catalyst surface.
3. Classification of various SACs for the eNRR
SACs consist of isolated single atoms and have unique electronic structures, which improve their electrocatalytic activity toward various reactions. The use of SACs as eNRR catalysts could inhibit the HER, enhance the adsorption of nitrogen and intermediate reactants, and change the rate-limiting step, thus improving the selectivity and activity in the eNRR. The existing SACs for the eNRR can be classified into noble metal, non-noble metal and non-metal SACs.3.1 Noble metal SACs
To date, Ru-, Au-, and Pt-based SACs have been utilized as electrocatalysts for the eNRR. Ru SACs are intriguing because of their high activity as Ru-based counterparts in the Haber–Bosch process.80,81 Geng and co-workers synthesized Ru SAs/NC (Ru mass loading 0.18%) by pyrolyzing a Ru-containing derivative of ZIF-8 (Fig. 5a). The Ru SAs/N–C exhibited a FE of 29.6% for NH3 production by the eNRR, and the yield rate reached 120.9 μgNH3 h−1 mgcat−1 at −0.2 V vs. reversible hydrogen electrode (RHE).35 (Fig. 5b). The HAADF-STEM images, Ru K-edge XANES, and EXAFS spectra of Ru SAs/N–C of Ru SAs/N–C revealed that the Ru atoms in Ru SAs/N–C were completely isolated and coordinated by N atoms with a coordination number of approximately 3.4. Compared to Ru NPs/N–C, the Ru SAs/N–C catalyst exhibited a stronger N2 chemisorption. The authors concluded that the enhanced N2 adsorption on the surface of Ru SAs/N–C led to a lower Gibbs free energy (ΔG) for the rate-determining step (RDS) of the eNRR than that of Ru(101) (Fig. 5c). As a result, Ru SAs/N–C exhibited excellent electrocatalytic performance for the eNRR.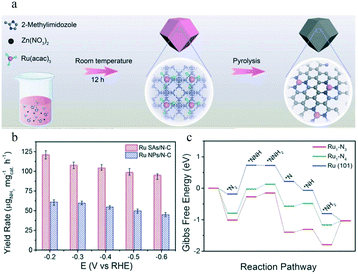 | ||
| Fig. 5 (a) Scheme of the synthetic procedure for Ru SAs/N–C. This figure has been adapted from ref. 35 with permission from Wiley-VCH, copyright 2018. (b) Yield rate of NH3 production at different applied potentials on Ru SAs/N–C and Ru NPs/N–C. (c) Free energy diagram of the N2 electrochemical reduction with a distal pathway on Ru1–N3, Ru1–N4, and Ru (101). * represents an adsorption site. This figure has been adapted from ref. 35 with permission from Wiley-VCH, copyright 2018. | ||
Suppressing the H2 evolution to reduce the fraction of electrons participating in this competing reaction is regarded as an effective approach to enhance the selectivity toward NH3. For this purpose, Sun and co-workers annealed Ru-incorporated UiO-66 to produce Ru@ZrO2/NC, which achieved a remarkable NH3 FE of 21% at an overpotential of 0.17 V (ref. 36) (Fig. 6a). The authors claimed that ZrO2 can suppress the HER and enhance the eNRR selectivity toward NH3. Density functional theory (DFT) calculations showed that Ru@Zr32O63 with an O vacancy and Ru/NC2 had a lower energy barrier for the potential-determining step than the Ru (0001) metal substrate (Fig. 6b). The authors concluded that adding the unsaturated –NH2 groups during pyrolysis avoided atomic aggregation and improved the catalytic activity of Ru and the NH3 yield rate, and suggested that the presence of ZrO2 reduced the activity for the HER.
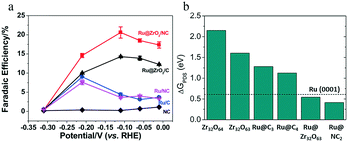 | ||
| Fig. 6 (a) The FEs of NH3 over Ru@NC, Ru@C, Ru@ZrO2/NC, and Ru@ZrO2/C at various applied potentials. (b) ΔGPDS for the eNRR on various reaction sites. These figures have been adapted from ref. 36 with permission from Elsevier, copyright 2018. | ||
Au-Based SACs have also been widely studied because of their low theoretical affinity for H, which is expected to reduce the HER activity and increase the NH3 faradaic efficiency.22,46,82 Wang and co-workers prepared Au atoms on carbon nitride(Au1/C3N4) and Au nanoparticles supported on C3N4 (Au NPs/C3N4) for the eNRR24 (Fig. 7a). According to DFT calculations, the electrons of the Au atoms migrated to g-C3N4 and shifted its d-orbital position toward the Fermi level, leading to a lower ΔG for the rate-determining step (N2 to *NNH) of Au1/C3N4 than Au(211) (Fig. 7b). As a result, Au1/C3N4 had an NH3 FE of 11.1% and a NH4+ yield rate of 1305 μg h−1 mgAu−1 at −0.1 V vs. RHE; the yield was 22.5 times as high as that of Au nanoparticles (Fig. 7c). Thus, Au1/C3N4 had a better eNRR electrocatalytic activity and selectivity than Au NPs/C3N4 and Au(211).
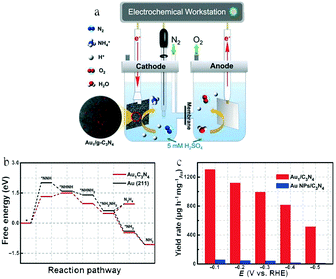 | ||
| Fig. 7 (a) Schematic of an electrolyzer for the N2 electroreduction test. (b) Free energy profile of the eNRR on Au1/C3N4 and Au (211) at zero potential following the alternating mechanism. (c) NH4+ yield rates normalized by Au mass. These figures have been adapted from ref. 24 with permission from Elsevier, copyright 2018. | ||
Achieving the optimal coordination between the substrate and single atoms also has a great impact on the performance of SACs. Qin and co-workers reported an electrocatalyst consisting of Au single sites supported on N-doped carbons (AuSAs-NDPCs), with outstanding activity and stability for the eNRR.25 Compared with AuSAs-NDPCs, the Au atoms showed obvious agglomeration in nitrogen-free salt-templated carbons (STCs), which resulted in a weaker eNRR performance (Fig. 8a). The AuSAs-NDPCs catalyst showed an excellent NH3 yield of 2.32 μg h−1 cm−2, with a maximum FE of 12.3% at −0.2 V vs. RHE, which was attributed to the interaction of Au with N and C atoms that stabilized the single sites, and to the highly open porous structure of the NDPCs, which facilitated the access to active sites and mass transport (Fig. 8b).
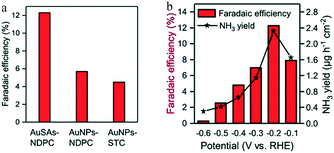 | ||
| Fig. 8 (a) Faradaic efficiency of NH3 with different catalysts at −0.2 V versuss RHE. (b) Faradaic efficiency and yield rate of NH3 at different potentials. These figures have been adapted from ref. 25 with permission from Wiley-VCH, copyright 2018. | ||
Although Pt is a highly effective catalytic component in many reactions, it also shows a higher affinity for H than N in the electrolyte; hence, its surface tends to be covered by H, resulting in poor electrocatalytic activity for ammonia synthesis in an aqueous environment.83 However, the first-principles calculation of Yin and co-workers revealed that Pt-embedded monolayer graphitic carbon nitride (Pt/g-C3N4) showed significant deviations from the scaling relationship between the energetics of the *N2H and *NH2 intermediates84 (Fig. 9a). In particular, Pt/g-C3N4 exhibited stronger and weaker interactions with *N2H and *NH2 species, respectively, compared with TM1/g-C3N4 materials (TM1 = Sc ∼ Cu, Mo, Ru, Rh, Pd, Re, Ir, and Pt); this identified Pt/g-C3N4 as the most suitable electrocatalyst for the eNRR. The tight anchoring of Pt atoms on g-C3N4 prevented diffusion and aggregation, resulting in an outstanding stability. Compared with pristine g-C3N4, the Pt–N orbital hybridization of Pt/g-C3N4 reduced the band gap, thus enhancing the electronic conductivity (Fig. 9b). Moreover, the strong hydrophobicity of Pt/g-C3N4 balanced the fact that Pt tends to adsorb H instead of N, effectively suppressing the HER. Hence, Pt/g-C3N4 showed remarkable activity with a low limiting potential of −0.24 V (Fig. 9c). Therefore, Pt/g-C3N4 was selected as the most suitable electrocatalyst for ammonia synthesis in the TM1/g-C3N4 series.
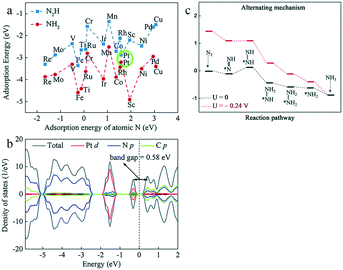 | ||
| Fig. 9 (a) Adsorption energies of N2H and NH2 as a function of atomic N adsorption strength on TM/g-C3N4. (b) Density of states for Pt/g-C3N4. (c) Free energy profiles for the eNRR on Pt/g-C3N4 at 0 V (black) and UL (red) via the alternating mechanism. These figures have been adapted from ref. 84 with permission from the Royal Society of Chemistry, copyright 2019. | ||
3.2 Non-noble metal SACs
The high cost and scarcity of noble metal-based catalysts limit their wide application. In addition to their cost-effectiveness, non-noble metal-based SACs also have great potential as efficient catalysts for the eNRR. Transition metal (TM)-based SACs exhibit outstanding ability as eNRR electrocatalysts, because the TM contributes electrons to the antibonding π* orbital of N2, while N2 transfers σ electrons to the vacant d orbital of the TM, enhancing the N2 adsorption onto the TM active sites. Therefore, transition metals with both vacant and occupied d orbitals are promising electrocatalysts for the synthesis of ammonia. Mo and Fe are important components of biological nitrogen fixation reactions, and Fe also plays an important role in the Haber–Bosch process. Moreover, Co-based catalysts are very active in the electrocatalytic reduction of O2 and CO2. These ideas, combined with DFT calculations, highlight the promising potential of non-noble metal-based SACs as eNRR electrocatalysts.In most biological nitrogenase systems, the Mo-based structure is the active center; this provides a possible route for the design of single-atom catalysts for ammonia synthesis. Luo and co-workers manufactured a catalyst based on single Mo atoms anchored on N-doped porous carbon (SA-Mo/NPC).33 XPS measurements showed that the valence state of Mo in SA-Mo/NPC consisted of 74% Mo6+ and 26% Mo4+. The catalyst showed a high NH3 yield rate of 34.0 mgNH3 h−1mgcat.−1 and a large FE of 14.6%, because the 3D porous structure of NPC can facilitate access to active sites and improve mass transport (Fig. 10a). Inductively coupled plasma-atomic emission spectroscopy (ICP-AES) measurements showed that a Mo loading of 9.54 wt% in SA-Mo/NPC achieved the maximum ammonia production (Fig. 10b). A too low Mo content would lead to limited improvements, while an excessively high content would generate nanoclusters and reduce the number of Mo–N bonds, with a similar weakening effect on the ammonia production rate. Interestingly, Mo–N bonds were considered to be active for the eNRR process.
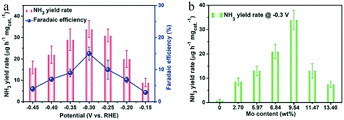 | ||
| Fig. 10 eNRR electrochemical performances of SA-Mo/NPC in 0.1m KOH. (a) NH3 yield rate (red) and FE (blue) at each given potential. (b) NH3 yield rates of SA-Mo/NPC samples with different Mo loadings. These figures have been adapted from ref. 33 with permission from Wiley-VCH, copyright 2019. | ||
Similarly, because Fe is the active center of the Haber process and biological nitrogenase, Fe-based electrocatalysts are likely to achieve efficient synthesis of ammonia. However, as the theoretical potential of the hydrogen evolution reaction is close to zero, controlling the reaction potential of nitrogen reduction in a reasonable range can effectively inhibit the HER and improve the FE. Wang and co-workers investigated a catalyst consisting of single iron atoms dispersed on N-doped carbon (FeSA–N–C).30 Molecular dynamics simulations revealed that the energy barrier for N2 to access the single iron atom was only 2.38 kJ mol−1, and DFT calculations showed that the binding Gibbs free energy of *N2 (−0.28 eV) was much lower than that of *H (2.91 eV), suggesting that the inhibition of the HER by FeSA–N–C was significantly stronger than that achieved by common transition and noble metals (Fig. 11a). The released energy could be supplied to the first hydrogenation step, successfully overcoming the eNRR reaction bottleneck. Thus, the FeSA–N–C catalyst achieved a substantial FE of 56.55% and a desirable yield rate (7.48 μg h−1 mg−1) at 0 V vs. RHE, with an ultralow onset potential of 0.193 V (Fig. 11b).
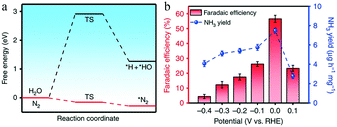 | ||
| Fig. 11 (a) Calculated energy barriers of the adsorption of hydrogen and nitrogen. (b) NH3 faradaic efficiencies and mass-normalized yield rates at each given potential of FeSA–N–C. Copyright 2019, Springer Nature. These figures have been adapted from ref. 30 with permission from Springer Nature, copyright 2019. | ||
Generally, Co-based catalysts show good activity in the O2 and CO2 reduction reactions,85,86 in which the Co–N coordination increases the magnetic moment of the Co atom. This structure plays an important role in activating the reactants and leads to Co-based catalysts having a higher catalytic activity than traditional noble metal catalysts. Sardroodi and co-workers performed first-principles DFT calculations to explore the stability and eNRR mechanism of single Co atoms supported on defective N-doped graphene (Co/N3–Gr).87 By analyzing the adsorption energy and the formation energy of Co/N3–Gr, they concluded that the Co atom was strongly bound to the neighboring N atoms. N2 molecules were most likely to attach to the Co sites in the end-on configuration, owing to its stronger adsorption energy and electron transfer (Fig. 12a). The Co/N3–Gr system is expected to catalyze the eNRR by an enzymatic rather than a distal or alternating mechanism in the water phase, owing to the lower overpotential (Fig. 12b). Compared to the eNRR, Co/N3–Gr required a higher overpotential for the HER (Fig. 12c). Therefore, owing to the high-spin polarization of the Co atom, the non-noble metal Co/N3–Gr catalyst may be an excellent candidate for the eNRR.
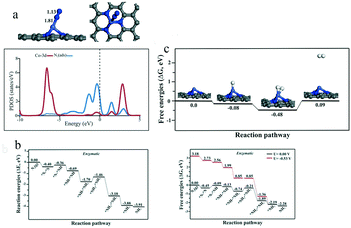 | ||
| Fig. 12 (a) Optimized structure (above) and PDOS plots (below) of N2 adsorption on Co/N3–Gr for end-on configurations. (b) Reaction energy (left) and Gibbs free energy (right) diagrams for the N2 reduction reaction on Co/N3–Gr through enzymatic mechanisms at zero and applied potential (limiting potential). (c) The energy diagram and relaxed geometries of species involved in the hydrogen evaluation reaction over Co/N3–Gr. These figures have been adapted from ref. 87 with permission from Wiley-VCH, copyright 2019. | ||
3.3 Non-metal SACs
Non-metal SACs exhibit weak adsorption of H+, because the non-metal atoms coordinate carbon atoms and show a high positive charge, forming Lewis acid sites, while the carbon atoms possess a negative charge density. Hence, the non-metal atoms tend to bind the weak Lewis base N2 and promote the eNRR. Moreover, non-metal atoms and the surrounding coordinated species can act as electron acceptors and donors upon tuning the eNRR activity through structural distortion. For instance, Wen et al. achieved a considerable eNRR performance based on boron and sulphur co-doped carbon nanofibers.88 Therefore, exploring the catalytic performance of non-metal SACs is an important task.The boron-doped graphene skeleton can retain the original sp2 hybridization and conjugated plane structure; the lower electronegativity of the B (2.04) than the C (2.55) atoms results in a change in the electron density of the carbon ring structure. Hence, the electron-deficient B site enhances the capture of N2 and inhibits the adsorption of H+. Yu and co-workers experimentally found that the ammonia yield of B-doped graphene at −0.5 V vs. RHE was 9.8 μg h−1 cm−2, with a FE of 10.8%.26 Moreover, DFT calculations showed that, among different B-doped carbon structures, BC3 had the lowest energy barrier for electrocatalytic ammonia synthesis. Liu and co-workers constructed 21 models with a single boron atom decorated on eight popular two-dimensional (2D) materials, involving different boron states89 (Fig. 13a). Unlike the d orbitals of transition metals, the boron atom could accept the lone-pair electrons of N2 in the sp3 hybrid orbital, forming B-to-N π-back bonding. To identify promising eNRR catalysts, the authors calculated the binding energy of a single N in each state and the maximum energy required for the HER and eNRR. Single boron atoms supported on graphene and substituted into h-MoS2 exhibited high selectivity and energy efficiency with relatively low energy barriers of 0.31 and 0.46 eV in the distal pathway (Fig. 13b).
 | ||
| Fig. 13 (a) Proposed 2D materials and potential B-sites. The numbers indicate different bonding environments described in the text. Black, blue, rose, yellow, purple, and cyan spheres represent C, N. B, S, P, and Mo, respectively. (b) Computational screening of 14 catalyst combinations: ΔGHERmaxvs. ΔGNRRmax. These figures have been adapted from ref. 89 with permission from American Chemical Society, copyright 2019. | ||
Likewise, when a high electropositive P single atom is loaded on a carbon substrate, it coordinates electronegative C atoms. As a result, the P atom becomes a Lewis acid site and the active center for N2 adsorption. Hu and co-workers developed an efficient metal-free electrocatalyst for the eNRR consisting of phosphorus-doped carbon nanotubes (P-CNTs).34 The Raman spectrum showed that the P-CNTs had more defects on their surface than the pristine CNTs. Moreover, the pristine CNTs and a bare carbon cloth exhibited a negligible NH3 yield compared to that of the P-CNTs, which was up to 24.4 μg h−1 mg−1cat. (Fig. 14a). The P-dopant loading and the NH3 yield showed an almost linear relationship, which revealed that the phosphorus centers were the real active sites for the eNRR. The Mulliken charge density distribution showed that the phosphorus atoms of P-CNTs formed Lewis acid sites to combine with N2 (Fig. 14b). Compared to P-doped porous carbon nanosheets, the highly conjugated π network of P-CNTs also enhanced the activity for the eNRR. According to in situ FTIR spectroscopy measurements and DFT calculations, the eNRR in P-CNTs proceeded by the distal mechanism rather than direct N2 dissociation, reflecting the reaction pathway of metal-free catalysts (Fig. 14c).
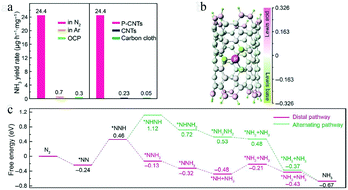 | ||
| Fig. 14 (a) NH3 yields of P-CNTs in N2/Ar-saturated electrolyte at −1.1 V and in N2-saturated electrolyte at open circuit potential (OCP), and NH3 yields of P-CNTs, CNTs, and carbon cloth in N2-saturated electrolyte at −1.1 V. (b) Mulliken charge distribution of the P-CNTs model. (c) Free energy profiles for distal and alternating pathways on the phosphorus site in P-CNTs. These figures have been adapted from ref. 34 with permission from Springer Nature, copyright 2020. | ||
3.4 Effect of metal content of SACs
It is well known that the full exposure of active sites is crucial for the performance of catalysts. Compared with metal nanoparticles, SACs can maximize the exposure of the active atomic sites, which indicated the increase of active sites. Therefore, the metal content plays a very significant role in these systems. Jiao et al. obtained iron SAC-implanted N-doped porous carbon (FeSA–N–C) with 1.76 wt% metal content, which exhibited an excellent kinetic current density (Jk) at 0.85 V (23.27 mA cm−2), exceeding that of the commonly used Pt/C catalyst for the oxygen reduction reaction.90 For further improvement, they introduced SiO2 in the synthesis process of the MOF, synergistically inhibiting the agglomeration of metal species.91 As a result, FeSA–N–C achieved a high Fe loading of 3.46 wt%. The optimized SACs exhibited an even more higher Jk of 37.19 mA cm−2, indicating an apparent performance promotion. Therefore, increasing the metal content can significantly improve the activity of SACs. However, Li and co-workers proposed a Co-based SAC on nitrogen-doped graphene (SACo@NG) with a high Co content of 4.1 wt%, which showed >90% conversion of benzyl alcohol (BzOH); this catalyst was much more efficient than Co NPs loaded on nitrogen-doped graphene (6.7 wt%).92 It can be inferred that, despite the increased metal loading, the number of atoms actually participating in the reaction may be lower, because the metal atoms in the nanoparticles are not fully exposed. Similarly, Gong et al. observed that the photocatalytic activity of CO2 reduction exhibited a volcano-type trend.75 When the amount of Co-MOF used for preparing Co SACs was 25 mg, the yield of CO reached the peak value of 394.4 μmol h−1 g−1, which was notably higher than that obtained with 10 and 35 mg Co-MOF; this might be ascribed to the aggregation of Co active sites. Consequently, increasing and controlling the metal loading of SACs within a reasonable range can significantly contribute to improving the activity of the catalysts. Although only a few studies have focused on the influence of the metal content in the eNRR, we envisage that these considerations will inspire further investigation of this subject.4. Mechanisms of the eNRR
The mechanisms of the eNRR typically involve (i) N2 adsorption, (ii) multiple electron and proton transfer steps to the intermediates, and (iii) NH3 desorption. According to detailed mechanistic analyses, the eNRR mechanisms can be classified into two pathways, i.e., dissociative or associative (Fig. 15).93 The Haber–Bosch process follows the dissociative pathway, in which the complete cleavage of the N![[triple bond, length as m-dash]](https://www.rsc.org/images/entities/char_e002.gif) N bond occurs before the hydrogenation of N and an extremely high energy input is required.15
N bond occurs before the hydrogenation of N and an extremely high energy input is required.15
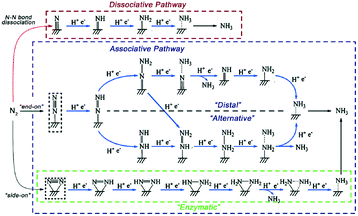 | ||
| Fig. 15 Reaction pathways for the eNRR by proton-coupled electron transfer, including the dissociative pathway, distal and alternative associative pathway, and enzymatic pathway. Copyright 2019, the Royal Society of Chemistry. This figure has been adapted from ref. 93 with permission from the Royal Society of Chemistry, copyright 2019. | ||
Under ambient conditions, the eNRR is more likely to proceed via the associative pathway, which includes “distal”, “alternating”, and “enzymatic” mechanisms. Along this pathway, the breaking of the N![[triple bond, length as m-dash]](https://www.rsc.org/images/entities/char_e002.gif) N bond and the hydrogenation occur simultaneously, and the N
N bond and the hydrogenation occur simultaneously, and the N![[triple bond, length as m-dash]](https://www.rsc.org/images/entities/char_e002.gif) N bond is not completely broken until the first NH3 molecule is released. N2 can bind to the catalyst surface in two possible configurations: end-on and side-on. In the alternating and distal pathways, the N2 molecule is adsorbed on the surface in the end-on configuration, which is a linear structure with only one N atom bound to the surface. The main difference between the distal and alternative pathways concerns the NH3 release mechanism. In the distal path, the N atom not bound to the surface is preferentially hydrogenated to NH3. In contrast, both nitrogen atoms of N2 have the same probability to undergo hydrogenation in the enzymatic pathway. In the enzymatic pathway, N2 is adsorbed in side-on mode, namely, with the two sides of the molecules simultaneously binding the catalyst, and the hydrogenation of the two N atoms takes place in sequence.94,95
N bond is not completely broken until the first NH3 molecule is released. N2 can bind to the catalyst surface in two possible configurations: end-on and side-on. In the alternating and distal pathways, the N2 molecule is adsorbed on the surface in the end-on configuration, which is a linear structure with only one N atom bound to the surface. The main difference between the distal and alternative pathways concerns the NH3 release mechanism. In the distal path, the N atom not bound to the surface is preferentially hydrogenated to NH3. In contrast, both nitrogen atoms of N2 have the same probability to undergo hydrogenation in the enzymatic pathway. In the enzymatic pathway, N2 is adsorbed in side-on mode, namely, with the two sides of the molecules simultaneously binding the catalyst, and the hydrogenation of the two N atoms takes place in sequence.94,95
For different SACs, the N2 adsorption configurations, potential-limiting steps, and corresponding reaction and activation energies for the eNRR are typically determined by examining the active site structures. For example, Wang and co-workers explored the catalytic behavior of the single-atom catalyst M1–N1C2 (M = Cu, Pd, Pt, and Mo) via first-principles calculations.96 Compared to other metals, Mo single atoms coordinated with N1C2 possessed a stronger N2 adsorption in both end-on (−1.18 eV) and side-on (−1.19 eV) modes. Mo1–N1C2 tended to adopt the enzymatic pathway; the overpotential was as low as 0.24 V, and the potential-limiting step was the *N2 reduction to *N2H. Compared to the enzymatic mechanism, the potential-limiting steps of the alternating and distal pathways were found to be the *NH–NH2 to *NH2–NH2 and *NH2–NH2 to *N2 reduction, with corresponding the overpotentials of 0.62 and 0.57 V, respectively. These results suggested that the eNRR performance of Mo1–N1C2 was superior to that of other M1–N1C2 structures. Moreover, the ΔG for NH3 desorption from Mo1–N1C2 was 0.47 eV, indicating that in this case, NH3 can be rapidly released from the surface, which is also beneficial to the overall eNRR.
5. Rational design of SACs for the eNRR based on the reaction mechanism
The N2 activation on the catalyst surface is the most crucial step of the eNRR. To activate N2, the catalyst must provide an empty d orbital to receive the lone-pair electrons from N2. The unique structure of the SACs may create more empty d orbitals in the metal centers, owing to the strong electronegativity of the ligands and support in the catalysts. In addition, the densely-decorated structure of the substrate can substantially enhance the electrical performances. For example, Li et al. achieved a well-designed single crystal ReS2 device with prominent electrical and photoelectrical performances.97 Therefore, this provides significant guidance for rational design of catalysts.For instance, the electronic structure of the Mo atom is 4d55s1, whose sp3d2 hybridization leads to the absence of empty orbitals. Ou and co-workers established a model of single Mo atoms on the N-doped black phosphorus substrate Mo1NiP3−i (i = 0, 1, 2, 3) by DFT calculations98 (Fig. 16a). They found that a higher number of N atoms led to a lower overpotential for the eNRR; thus, Mo1N3 required the lowest overpotential (0.02 V). This is due to the strong electronegativity of the coordinated N atoms, whose role is to receive electrons from the Mo atomic orbitals and accept lone-pair electrons from N2 in an empty d orbital. The authors also explored the charge transfer through the distal mechanism based on Bader charge analysis. In the first three steps, the electron transfer only occurred between Mo1N3 and the intermediate reactant NxHy, while black phosphorus actively participated in the electron transfer in the last four steps to promote the formation and desorption of the second NH3 molecule (Fig. 16b).
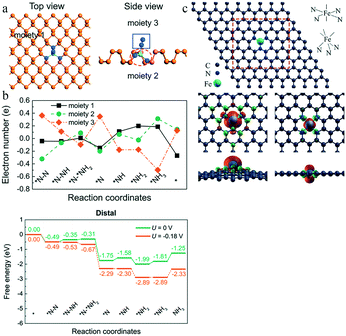 | ||
| Fig. 16 (a) Top and side views of BP without Mo1N3, the Mo1N3 center, and the adsorbed *NxHy species, of the *N–N intermediate. This figure has been adapted from ref. 98 with permission from the Royal Society of Chemistry, copyright 2019. (b) Charge variation of the three moieties and distal mechanisms on Mo1N3 at zero and applied potentials. This figure has been adapted from ref. 98 with permission from the Royal Society of Chemistry, copyright 2019. (c) Optimized structure of FeN3-graphene and FeN4-graphene, and their isosurface of the spin-resolved density pictures. This figure has been adapted from ref. 94 with permission from American Chemical Society, copyright 2016. | ||
Li and co-workers further compared and explored the eNRR performance of FeN4- and FeN3-embedded graphene94 (Fig. 16c). The dipole moment of the FeN4 center was found to be split into upper and lower components by the interaction with graphene; the smaller dipole moment of this center makes it difficult for it to polarize N2. In FeN3-graphene, N doping in a single vacancy resulted in the Fe dipole moment increasing from 0 to 3.16 μB. The larger dipole moment resulted in an electron cloud distribution more concentrated near the Fe atom, which was exposed in an apical position on top of the graphene layer, explaining the superiority of FeN3-graphene for N2 adsorption. Moreover, after the N2 adsorption, the electron cloud was uniformly distributed on N2 and FeN3, confirming the activation of N2.
The Sabatier principle, first proposed in 1920, states that the interaction between the catalyst and the reactive species in catalytic reactions should be neither too strong nor too weak: if the interaction is too strong, the reaction product is difficult to desorb, whereas an overly weak interaction prevents the reactants from combining with the catalyst, as illustrated by the volcano plot in Fig. 17a.99 On the left side of the plot, when the bond strength is too high, the catalytic reactivity is limited by the product desorption. As the bond strength slowly decreases, the product becomes prone to desorption, and the rate gradually increases. On the right side of the plot, when the bond strength is too weak, the activation of the reactants is difficult, and this process limits the catalytic reaction rate. As the bond strength slowly increases, the reactants become easier to activate, and the rate will gradually increase. Accordingly, the maximum of the volcano plot corresponds to the highest bond strength and optimum activity. However, the Sabatier principle does not clarify which descriptor should be used for the bond strength between intermediate reactants and catalysts, or the bond strength value associated with the optimum catalyst; hence, it cannot be used as a quantitative method to identify the optimum catalyst.99
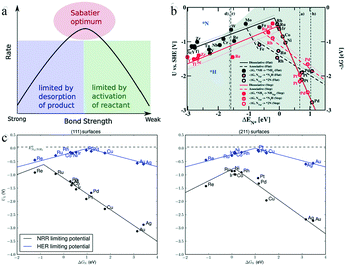 | ||
| Fig. 17 (a) Schematic representation of the qualitative Sabatier principle. This figure has been adapted from ref. 99 with permission from Elsevier Inc, copyright 2015. (b) Combined volcano diagrams (lines) for the flat (black) and stepped (red) transition metal surfaces for reduction of nitrogen with a Heyrovsky type reaction, without (solid lines) and with (dotted lines) the H-bond effect. The data points are the DFT values of DG for a given reaction step. This figure has been adapted from ref. 95 with permission from the Royal Society of Chemistry, copyright 2012. (c) Comparison of HER and eNRR limiting-potential volcanoes. This figure has been adapted from ref. 103 with permission from Wiley VCH, copyright 2015. | ||
In electrochemical nitrogen fixation, the adsorption energies of the hydrogen-containing species NHx (x = 1, 2) and N2Hx (x = 0, 1, 2), as well as of H atoms, exhibit a linear scaling relationship with the chemisorption energy of N on selected transition metals.100,101 In addition, the free energy of each elementary step, which is a combined function of the applied bias U and the adsorption energies, scales as the adatom binding energy.102 Thus, based on this scaling relationship, the reaction free energy can be considered as the descriptor of the electrocatalytic activity, and a volcano plot can be used to predict the most efficient electrocatalyst for ammonia synthesis. Skúlason et al. assessed the scaling of the activation energy toward the eNRR with the binding energy of N-adatoms on flat and stepped surfaces of transition metals. The volcano plot in Fig. 17b shows the scaling relationship between the onset potential and binding energy of N species.95 It is clear that the transition metals Mo, Fe, Rh, and Ru at the top of the volcano plot, which preferentially attach to *H rather than *N species, have the highest catalytic activity. Moreover, the metals on the right side of the volcano plot such as Rh, Ru, Ir, Co, Ni, and Pt are consistently covered by H atoms, leading to the HER taking place instead of the eNRR. Only some of the flat surfaces of early transition metals such as Sc, Y, Ti, or Zr would bind N atoms more strongly than H atoms, and required a bias of only 1 to 1.5 V vs. standard hydrogen electrode (SHE) for the reduction of N2 to NH3 through dissociative mechanisms.
Montoya and co-workers introduced a new perspective on the role of nitrogen scaling relationships, suggesting that the electrochemical synthesis of NH3 is limited by the linear scaling relationship between the energetics of two intermediates, *N2H and *NH2, as shown in Fig. 17c.103 Most of the metal surface facets suffered from the reduction of *N2 to form *N2H, but the (111) terraces on the left side of the volcano plot were limited by the protonation of *NH to form *NH2, while the reductive desorption of *NH2 affected the (211) steps on reactive surfaces. Fig. 17c shows that the limiting potentials required by the eNRR were larger than those corresponding to the HER, with the minimum difference being as high as 0.5 V for Re(111), suggesting that the selectivity of the considered transition metals was biased toward the HER. The authors considered it challenging to design a catalyst that can selectively stabilize *N2H or destabilize *NH2.
Although metal alloys can significantly improve the performances of gas-phase and electrochemical catalysts,104 the binding configurations of the key *N2H, *NH, and *NH2 adsorbates, in which adsorption takes place through a single N atom, are too similar to be distinguished; hence, alloys are unlikely to break the scaling relationships for the eNRR. To achieve an efficient heterogeneous catalyst for the electrochemical synthesis of ammonia, the use of bifunctional surfaces that simultaneously bind *N2H and *NH2 onto different active sites or multiple sites would make it feasible to break the scaling relationships.
6. Optimization of the catalytic system
The electrochemical nitrogen reduction reaction is commonly performed using water as a protic solvent. Many effective metal catalysts preferentially adsorb protons rather than N2; thus, their active sites are covered by H+ species.105,106 Unfortunately, because the limiting potential for the eNRR is negative enough to preferentially drive the HER, the latter usually dominates on the catalyst surface.10 Therefore, the aqueous eNRR suffers from low selectivity relative to the HER.12 Because the rate-limiting step of the eNRR exhibits a zeroth-order dependence on the proton density, while that of the HER shows a first-order correlation,10 limiting the accessibility of protons from the electrolyte to the electrocatalyst surface can be considered an effective approach to suppress the HER; this would favor the preferential adsorption of nitrogen molecules on the electrocatalyst, facilitating the subsequent hydrogenation.The conventional aqueous electrolyte can also be replaced with an ionic liquid (IL) or another water-free donor, only adding a small amount of water molecules to provide protons, and greatly reducing the probability of the hydrogen evolution reaction. MacFarlane and co-workers proposed the application of an aprotic, highly fluorinated IL to suppress the availability of H+, achieving an excellent FE for the eNRR of 60%.107 The IL also had excellent N2 solubility, but its viscosity led to poor mobility, which limited N2 transport, resulting in an NH3 yield rate of only 10−12 mol s−1 cm−2. Given the liquidity, the authors chose highly fluorinated 1H,1H,5H-octafluoropentyl 1,1,2,2-tetrafluoroethyl ether (FPEE) as a solvent, with the highly soluble 1-butyl-1-methypyrrolidinium tris(pentafluoroethyl) trifluorophosphate ([C4mpyr][eFAP]) as an IL.108 At a moisture concentration of 114.3 ppm, the highest FE of 32% for the eNRR and an NH3 yield rate of 2.35 × 10⁻¹¹ mol s−1 cm−2 were obtained when the mole fraction of IL(XIL) was 0.23; however, the eNRR performance apparently decreased when XIL was 0.46, reflecting the significant importance of FPEE for mass transport, as shown in Fig. 18a. The rational design of aprotic solvents to regulate H+ adsorption greatly improves the selectivity and FE parameters. Nørskov and co-workers compared the effect of the non-aqueous proton donor 2,6-lutidinium (LutH+) and hydronium on the selectivity, as shown in Fig. 18b.109 Hindered by the metal surface puckering, LutH+ required more energy than H3O+ to complete the Volmer reaction (LutH+ + e− ⇌ Lut + *H, H3O+ + e− ⇌ H2O + *H), which further increased the difficulty for H species to reach the catalyst surface. Thus a non-aqueous proton donor is appropriate to suppress the HER and enhance the eNRR performance.
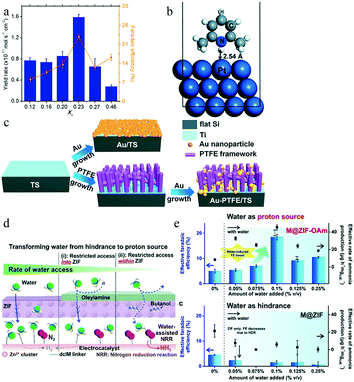 | ||
| Fig. 18 (a) XIL dependence of the NH3 yield and FE (%) at −0.65 V vs. NHE. This figure has been adapted from ref. 108 with permission from American Chemical Society, copyright 2018. (b) 2,6-Lutidinium adsorption configurations on Pt(111). This figure has been adapted from ref. 109 with permission from the Royal Society of Chemistry, copyright 2018. (c) Schematic illustration of the fabrication procedure of Au/TS and Au-PTFE/TS. This figure has been adapted from ref. 110 with permission from Elsevier Inc, copyright 2018. (d) Scheme depicting the strategy to transform water into an efficient eNRR proton source by regulating access of water to the electrocatalytic surface. This figure has been adapted from ref. 111 with permission from American Chemical Society, copyright 2020. (e) Effective rate of ammonia production and effective faradaic efficiency when using the M@ZIF-OAm working electrode as the amount of water in the electrolyte is regulated. This figure has been adapted from ref. 111 with permission from American Chemical Society, copyright 2020. | ||
Modification of the surface structure of the catalyst, such as coating with a hydrophobic layer, increases the kinetic barrier for water molecules to reach the catalyst, and also effectively improves the selectivity toward NH3. Zheng and co-workers deposited a porous poly(tetrafluoroethylene) (PTFE) layer on a p-type Si wafer with magnetron sputtered Au nanoparticles, as shown in Fig. 18c.110 The presence of the hydrophobic PTFE player resulted in an excellent FE of 37.8% and an ammonia yield rate of 18.9 μg cm−2 h−1, whereas the photoelectrochemical performance in the ammonia synthesis was significantly reduced without PTFE, which highlighted the role of PTFE as a HER inhibitor. However, the corresponding current density was only 0.1 mA cm−2, far lower than that of the pure Si photoanodes. Ling and co-workers modified the surface of a zeolitic-imidazolate framework-71 (ZIF-71) layer with hydrophobic oleylamine (OAm) and filled the pores of ZIF-71 with butanol, which was more preferentially adsorbed in ZIF-71 over water modules, as shown in Fig. 18d.111 The use of both OAm and ZIF-71 prevents water from smoothly entering the pores of ZIF-71. The decorated ZIF-71 coating encapsulated a bimetallic electrocatalyst (metal@ZIF-OAm) to concentrate the reactants on the surface. For metal@ZIF-OAm, the maximum FE in the presence of 0.1% v/v water was 18%, nearly four times as high as that in the absence of water. This suggested that the increased water content effectively promoted the eNRR performance. For metal@ZIF without the oleylamine layer, the FE and ammonia yield with 0.075% v/v water were close to zero, which highlighted the effect of hydrophobicity in thermodynamically excluding moisture and suppressing the HER, as shown in Fig. 18e. This effect transforms water from an unavoidable hindrance to a superior proton source for the eNRR, possibly combined with the direct use of atmospheric air as a raw N2 and proton source for a sustainable eNRR.
Therefore, the optimization of the electrolytic system, especially in terms of limiting the competing hydrogen evolution reaction, involves two aspects, namely, the rational design of (1) electrolyte composition and (2) surface structure of the electrodes. Tuning the mass transfer and gas diffusion can hinder the direct contact of protons with the surface of the catalyst. In addition, the conductivity of the catalysts and the synergy between the electrolyte and catalytic active sites can also be optimized to improve the electrocatalytic selectivity toward the synthesis of ammonia.
7. Ammonia detection
The ubiquitous presence of ammonia in the laboratory environment may interfere with the experimental results, because the NH3 yield rate in the eNRR is usually very low. The analysis must verify that the ammonia detected in the eNRR experiment is electrochemically reduced by nitrogen rather than other exogenous sources. At present, the main colorimetric methods for ammonia detection are ion chromatography and spectrophotometry. Ion chromatography is highly selective, reproducible and efficient, but requires complex and expensive equipment. Spectrophotometry measurements are relatively cheap, and include the indophenol blue and Nessler's reagent methods. The principle of the former spectrophotometric approach is that ammonia absorbed in dilute sulfuric acid, in the presence of sodium nitroprusside and sodium hypochlorite, reacts with salicylic acid to form a blue-green indophenol blue dye; the final quantification of the NH3 concentration is based on the depth of the reagent color. In the Nessler's reagent method, the iodide and mercury ions in Nessler's reagent react with ammonia under alkaline conditions to produce a reddish-brown mixture. The absorbance of the above complex is directly proportional to the ammonia nitrogen content of the solution. Therefore, the ammonia content can be determined by measuring the absorption intensity of the reacted solution. However, considering that the reagent is highly toxic and the detection is prone to interferences, sample pretreatment is needed. The three methods mentioned above are accurate when the ammonia concentration is lower than 500 μg L−1, whereas the indophenol blue method is less accurate at high ammonia concentrations (acidic medium). In terms of accuracy of the results, the ion chromatography method is suitable for acidic media, whereas the indophenol blue approach is suitable for alkaline media, and the Nessler's reagent method is suitable for both.112 Apart from colorimetric methods, the main electrode methods for NH3 detection are based on ammonia gas-sensing and ammonium ion-selective electrodes. Generally, these methods do not require pretreatment of samples. The principle of the ammonia gas-sensing electrode is the addition of a concentrated alkali solution to the target solution to convert ammonium ions to free ammonia. The latter enters the internal buffer of the electrode through a hydrophobic membrane, which alters its pH value. The instrument can measure the ammonia concentration in the solution by monitoring the pH change, which is directly proportional to the NH3 concentration. The ammonia gas-sensing electrode has the advantages of simple operation, short test time, large measurement range and high accuracy. However, care should be taken to avoid contamination on the surface of the membrane electrode, which would otherwise block the pores, resulting in the need for expensive electrode replacement.113 On the other hand, the selective membrane of the ammonium ion-selective electrode is in contact with the ammonium ion solution, creating a potential difference between the interior and exterior of the membrane, which depends on the activity of free ammonium ions in the solution. The ammonium ion concentration can thus be calculated from the potential difference. This method has the advantages of simple operation, wide linear range, small relative error and high accuracy.114 However, its anti-interference performance needs to be improved.Before the experiment, the ammonia content in the feed gas should be quantified. Similarly, it is necessary to measure the ammonia content of each part of the experimental system, improving the gas purity in the experimental procedure. Moreover, the repeatability of the experiment should be confirmed to improve the reliability of the results, as shown in Fig. 19.115 In summary, before ammonia detection, the interferences from the external environment should be eliminated to ensure the purity of the ammonia source; multiple detection methods can be used at the same time to improve the accuracy and precision of the results.
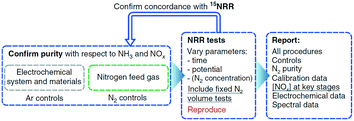 | ||
| Fig. 19 Updated and simplified eNRR experimental protocol. This figure has been adapted from ref. 115 with permission from Springer Nature, copyright 2020. | ||
Conclusions
Ammonia is a crucial chemical in modern society. The development of new sustainable and economical methods for ammonia synthesis has become an urgent task to support the growing global demand associated with the increasing population and carbon emissions. The electrocatalytic synthesis of ammonia at ambient temperature is one of the most promising approaches, with potentially zero carbon emission, reduced energy consumption, and easy implementation in many underdeveloped regions. Furthermore, SACs have abundant active sites, unsaturated coordination environment, and unique electronic structure superior to normal catalysts, which have the potential to achieve sustainable ammonia green production. In addition, because of their simple structure, these catalysts can be used as a model for fundamental studies aimed to further understand the mechanism of the eNRR process.116 However, the low affinity for N2 of the catalysts and the competition of the hydrogen evolution reaction for active sites, electrons, and protons, along with the large overpotential and high energy barrier of the ammonia synthesis reaction, result in low faradaic efficiency, poor ammonia yield, and limited selectivity of most catalysts. Therefore, several key challenges remain to be resolved for designing and producing suitable single-atom catalysts for electrocatalytic ammonia synthesis:1) Even though each atom of SACs shows efficiency, the practical application of SACs is limited by the low atomic loading, and an excessive increase of metal content will lead to the formation of nanoparticles. Thus, it is vital to explore more rational synthesis methods based on atomic-level designs to increase anchor sites and active sites, improving electronic structure and adapting to industrial application, such as the defect engineering strategy, spatial confinement strategy and coordination design strategy. Besides, exploring coupled SACs would allow taking full advantage of the synergetic effect between adjacent single atoms, removing the constraints of linear relationships, efficiently adsorbing reactants while rapidly releasing products, and improving the performance of electrocatalysts for ammonia synthesis. For the industrial development of the eNRR, further efforts should be made to strengthen economic analysis and evaluate the compatibility with renewable energy. Further work should be expanded to modulate porous substrates and metal catalysts.
2) In situ characterization techniques need to be further developed and applied at the atomic level, to reveal the detailed structure of the catalyst, and offer a variety of visualizations of the real-time and real-space progress of the electrochemical process. Although computational DFT can limitedly verify the reaction mechanism, experimental verification of which still has challenges. Consequently, it is essential to visualize the coordination environment of isolated single atoms based on advanced in situ characterization, and then determine the structure–performance relationships in SACs as well as the evolution of the actual processes taking place at catalytically active sites, providing the guidance for the rational design of eNRR catalysts.
3) Considering that transition metal surfaces tend to adsorb H rather than N2, the competitive reaction HER occupies the active sites and inhibits the further development of the eNRR. In order to enhance selectivity, on the one hand, it's necessary to reduce the accessibility of protons to avoid H+ ions from occupying the active sites and favoring the hydrogen evolution reaction, on the other hand, providing H+ for the subsequent reaction of the eNRR is also critical. This requires regulating the ion type, concentration, pH and temperature of the electrolytes. For example, using ionic liquids instead of water is a valuable option to raise selectivity, which can also improve the solubility of N2 and increase the concentration of gaseous reactants. More research is needed to explore similar electrolytes.
4) More intuitive approaches for the quantitative determination of ammonia/ammonium ion yields also require efficient and accurate detection methods. However, owing to the low ammonia yield rate, the decomposition of ammonia, and the interference of trace ammonia gas in the environment, the accuracy and reliability of the results need to be assessed. Reliable data that can be compared to the actual catalytic performance can only be obtained by strictly following the experimental protocols, excluding all sources of ammonia contamination, and minimizing the possibility of false positive results. Further work should be implemented for more advanced and accurate real-time ammonia detection and more rigorous detection processes.
In conclusion, many challenges still need to be addressed to achieve the large-scale and simple synthesis of SACs, including the study of the catalytic mechanism of the eNRR, the development of in situ characterization techniques, and the accurate determination of NH3. Fundamental progress in these areas will support future studies, aimed to develop green catalytic processes, and eventually achieve the sustainable production of NH3.
Conflicts of interest
There are no conflicts to declare.Acknowledgements
This work was supported by the National Natural Science Foundation of China (51976191, 51806193) and Academy of Ecological Civilization, Zhejiang University.Notes and references
- Ammonia annual production capacity globally 2030, https://www.statista.com/statistics/1065865/ammonia-production-capacity-globally/, (accessed July 6, 2021) Search PubMed.
- Ammonia Market Size Worth $76.64 Billion By 2025 | CAGR 5.3%, https://www.grandviewresearch.com/press-release/global-ammonia-market, (accessed July 6, 2021) Search PubMed.
- S. Giddey, S. P. S. Badwal and A. Kulkarni, Int. J. Hydrogen Energy, 2013, 38, 14576–14594 CrossRef CAS.
- L. Lassaletta, G. Billen, B. Grizzetti, J. Anglade and J. Garnier, Environ. Res. Lett., 2014, 9, 105011 CrossRef.
- Ammonia Market Size Worth $76.64 Billion By 2025 | CAGR 5.3%, https://www.grandviewresearch.com/press-release/global-ammonia-market, (accessed July 7, 2021) Search PubMed.
- Q. Hao, C. Liu, G. Jia, Y. Wang, H. Arandiyan, W. Wei and B.-J. Ni, Mater. Horiz., 2020, 7, 1014–1029 RSC.
- R. Schlögl, Angew. Chem., Int. Ed., 2003, 42, 2004–2008 CrossRef.
- J. H. Park, H. C. Yoon, J.-N. Kim, C.-H. Jeong, E.-Y. Jeong, D. S. Yun, H. Yoon, S. H. Park, M.-H. Han and C.-Y. Yoo, Korean J. Chem. Eng., 2018, 35, 1620–1625 CrossRef CAS.
- G.-F. Chen, S. Ren, L. Zhang, H. Cheng, Y. Luo, K. Zhu, L.-X. Ding and H. Wang, Small Methods, 2019, 3, 1800337 CrossRef.
- A. R. Singh, B. A. Rohr, J. A. Schwalbe, M. Cargnello, K. Chan, T. F. Jaramillo, I. Chorkendorff and J. K. Nørskov, ACS Catal., 2017, 7, 706–709 CrossRef CAS.
- J. A. Bakken, Pure Appl. Chem., 1994, 66, 1239–1246 CAS.
- S. Wang, F. Ichihara, H. Pang, H. Chen and J. Ye, Adv. Funct. Mater., 2018, 28, 1803309 CrossRef.
- J. Guo and P. Chen, Chem, 2017, 3, 709–712 CAS.
- H. Xu, K. Ithisuphalap, Y. Li, S. Mukherjee, J. Lattimer, G. Soloveichik and G. Wu, Nano Energy, 2020, 69, 104469 CrossRef CAS.
- X. Yan, D. Liu, H. Cao, F. Hou, J. Liang and S. X. Dou, Small Methods, 2019, 3, 1800501 CrossRef.
- J. N. Galloway and E. B. Cowling, Ambio, 2002, 31, 64–71 CrossRef PubMed.
- M. Li, H. Huang, J. Low, C. Gao, R. Long and Y. Xiong, Small Methods, 2019, 3, 1800388 CrossRef.
- Y. Yao, J. Wang, U. B. Shahid, M. Gu, H. Wang, H. Li and M. Shao, Electrochem. Energy Rev., 2020, 3, 239–270 CrossRef CAS.
- Y. Hao, X. Dong, S. Zhai, H. Ma, X. Wang and X. Zhang, Chem. – Eur. J., 2016, 22, 18722–18728 CrossRef CAS.
- C. Tang and S.-Z. Qiao, Chem. Soc. Rev., 2019, 48, 3166–3180 RSC.
- N. Lazouski, M. Chung, K. Williams, M. L. Gala and K. Manthiram, Nat. Catal., 2020, 3, 463–469 CrossRef CAS.
- M.-M. Shi, D. Bao, B.-R. Wulan, Y.-H. Li, Y.-F. Zhang, J.-M. Yan and Q. Jiang, Adv. Mater., 2017, 29, 1606550 CrossRef.
- F. Lü, S. Zhao, R. Guo, J. He, X. Peng, H. Bao, J. Fu, L. Han, G. Qi, J. Luo, X. Tang and X. Liu, Nano Energy, 2019, 61, 420–427 CrossRef.
- X. Wang, W. Wang, M. Qiao, G. Wu, W. Chen, T. Yuan, Q. Xu, M. Chen, Y. Zhang, X. Wang, J. Wang, J. Ge, X. Hong, Y. Li, Y. Wu and Y. Li, Sci. Bull., 2018, 63, 1246–1253 CrossRef CAS.
- Q. Qin, T. Heil, M. Antonietti and M. Oschatz, Small Methods, 2018, 2, 1800202 CrossRef.
- X. Yu, P. Han, Z. Wei, L. Huang, Z. Gu, S. Peng, J. Ma and G. Zheng, Joule, 2018, 2, 1610–1622 CrossRef CAS.
- Y. Liu, Q. Xu, X. Fan, X. Quan, Y. Su, S. Chen, H. Yu and Z. Cai, J. Mater. Chem. A, 2019, 7, 26358–26363 RSC.
- W. Zang, T. Yang, H. Zou, S. Xi, H. Zhang, X. Liu, Z. Kou, Y. Du, Y. P. Feng, L. Shen, L. Duan, J. Wang and S. J. Pennycook, ACS Catal., 2019, 9, 10166–10173 CrossRef CAS.
- Y. Li, Q. Zhang, C. Li, H.-N. Fan, W.-B. Luo, H.-K. Liu and S.-X. Dou, J. Mater. Chem. A, 2019, 7, 22242–22247 RSC.
- M. Wang, S. Liu, T. Qian, J. Liu, J. Zhou, H. Ji, J. Xiong, J. Zhong and C. Yan, Nat. Commun., 2019, 10, 341 CrossRef CAS PubMed.
- Y. Wang, X. Cui, J. Zhao, G. Jia, L. Gu, Q. Zhang, L. Meng, Z. Shi, L. Zheng, C. Wang, Z. Zhang and W. Zheng, ACS Catal., 2019, 9, 336–344 CrossRef CAS.
- R. Zhang, L. Jiao, W. Yang, G. Wan and H.-L. Jiang, J. Mater. Chem. A, 2019, 7, 26371–26377 RSC.
- L. Han, X. Liu, J. Chen, R. Lin, H. Liu, F. Lü, S. Bak, Z. Liang, S. Zhao, E. Stavitski, J. Luo, R. R. Adzic and H. L. Xin, Angew. Chem., Int. Ed., 2019, 58, 2321–2325 CrossRef CAS PubMed.
- L.-P. Yuan, Z.-Y. Wu, W.-J. Jiang, T. Tang, S. Niu and J.-S. Hu, Nano Res., 2020, 13, 1376–1382 CrossRef CAS.
- Z. Geng, Y. Liu, X. Kong, P. Li, K. Li, Z. Liu, J. Du, M. Shu, R. Si and J. Zeng, Adv. Mater., 2018, 30, 1803498 CrossRef PubMed.
- H. Tao, C. Choi, L.-X. Ding, Z. Jiang, Z. Han, M. Jia, Q. Fan, Y. Gao, H. Wang, A. W. Robertson, S. Hong, Y. Jung, S. Liu and Z. Sun, Chem, 2019, 5, 204–214 CAS.
- B. Yu, H. Li, J. White, S. Donne, J. Yi, S. Xi, Y. Fu, G. Henkelman, H. Yu, Z. Chen and T. Ma, Adv. Funct. Mater., 2020, 30, 1905665 CrossRef CAS.
- J. Liu, X. Kong, L. Zheng, X. Guo, X. Liu and J. Shui, ACS Nano, 2020, 14, 1093–1101 CrossRef CAS PubMed.
- Q. Wang, G. Zheng, S. Hao, X. Liu, J. Zheng, Y. Wang, Z. Su, N. Xu, Y. He, L. Lei and X. Zhang, ACS Sustainable Chem. Eng., 2020, 8, 44–49 CrossRef CAS.
- Y. Song, D. Johnson, R. Peng, D. K. Hensley, P. V. Bonnesen, L. Liang, J. Huang, F. Yang, F. Zhang, R. Qiao, A. P. Baddorf, T. J. Tschaplinski, N. L. Engle, M. C. Hatzell, Z. Wu, D. A. Cullen, H. M. Meyer, B. G. Sumpter and A. J. Rondinone, Sci. Adv., 2018, 4, e1700336 CrossRef PubMed.
- L. Zhang, X. Ji, X. Ren, Y. Ma, X. Shi, Z. Tian, A. M. Asiri, L. Chen, B. Tang and X. Sun, Adv. Mater., 2018, 30, 1800191 CrossRef.
- L. Zhang, X. Ji, X. Ren, Y. Luo, X. Shi, A. M. Asiri, B. Zheng and X. Sun, ACS Sustainable Chem. Eng., 2019, 7, 1807–1807 CrossRef CAS.
- X. Yang, J. Nash, J. Anibal, M. Dunwell, S. Kattel, E. Stavitski, K. Attenkofer, J. G. Chen, Y. Yan and B. Xu, J. Am. Chem. Soc., 2018, 140, 13387–13391 CrossRef CAS PubMed.
- X. Cui, C. Tang, X.-M. Liu, C. Wang, W. Ma and Q. Zhang, Chem. – Eur. J., 2018, 24, 18494–18501 CrossRef CAS.
- L. Hu, A. Khaniya, J. Wang, G. Chen, W. E. Kaden and X. Feng, ACS Catal., 2018, 8, 9312–9319 CrossRef CAS.
- H. Wang, L. Wang, Q. Wang, S. Ye, W. Sun, Y. Shao, Z. Jiang, Q. Qiao, Y. Zhu, P. Song, D. Li, L. He, X. Zhang, J. Yuan, T. Wu and G. A. Ozin, Angew. Chem., Int. Ed., 2018, 57, 12360–12364 CrossRef CAS PubMed.
- M. Nazemi, S. R. Panikkanvalappil and M. A. El-Sayed, Nano Energy, 2018, 49, 316–323 CrossRef CAS.
- X. Wu, Z. Wang, Y. Han, D. Zhang, M. Wang, H. Li, H. Zhao, Y. Pan, J. Lai and L. Wang, J. Mater. Chem. A, 2020, 8, 543–547 RSC.
- H. Huang, L. Xia, X. Shi, A. M. Asiri and X. Sun, Chem. Commun., 2018, 54, 11427–11430 RSC.
- Y. Liu, L. Huang, X. Zhu, Y. Fang and S. Dong, Nanoscale, 2020, 12, 1811–1816 RSC.
- A. Liu, M. Gao, X. Ren, F. Meng, Y. Yang, Q. Yang, W. Guan, L. Gao, X. Liang and T. Ma, Nanoscale, 2020, 12, 10933–10938 RSC.
- R. Zhao, C. Liu, X. Zhang, X. Zhu, P. Wei, L. Ji, Y. Guo, S. Gao, Y. Luo, Z. Wang and X. Sun, J. Mater. Chem. A, 2020, 8, 77–81 RSC.
- J. Han, Z. Liu, Y. Ma, G. Cui, F. Xie, F. Wang, Y. Wu, S. Gao, Y. Xu and X. Sun, Nano Energy, 2018, 52, 264–270 CrossRef CAS.
- W. Qiu, X.-Y. Xie, J. Qiu, W.-H. Fang, R. Liang, X. Ren, X. Ji, G. Cui, A. M. Asiri, G. Cui, B. Tang and X. Sun, Nat. Commun., 2018, 9, 3485 CrossRef.
- L. Li, C. Tang, B. Xia, H. Jin, Y. Zheng and S.-Z. Qiao, ACS Catal., 2019, 9, 2902–2908 CrossRef CAS.
- X. Zhang, T. Wu, H. Wang, R. Zhao, H. Chen, T. Wang, P. Wei, Y. Luo, Y. Zhang and X. Sun, ACS Catal., 2019, 9, 4609–4615 CrossRef CAS.
- Z. Wang, F. Gong, L. Zhang, R. Wang, L. Ji, Q. Liu, Y. Luo, H. Guo, Y. Li, P. Gao, X. Shi, B. Li, B. Tang and X. Sun, Adv. Sci., 2019, 6, 1801182 CrossRef.
- L. Zhang, L.-X. Ding, G.-F. Chen, X. Yang and H. Wang, Angew. Chem., Int. Ed., 2019, 58, 2612–2616 CrossRef CAS.
- J. Zhao, B. Wang, Q. Zhou, H. Wang, X. Li, H. Chen, Q. Wei, D. Wu, Y. Luo, J. You, F. Gong and X. Sun, Chem. Commun., 2019, 55, 4997–5000 RSC.
- X. Zhu, T. Wu, L. Ji, C. Li, T. Wang, S. Wen, S. Gao, X. Shi, Y. Luo, Q. Peng and X. Sun, J. Mater. Chem. A, 2019, 7, 16117–16121 RSC.
- G. Zhang, Q. Ji, K. Zhang, Y. Chen, Z. Li, H. Liu, J. Li and J. Qu, Nano Energy, 2019, 59, 10–16 CrossRef CAS.
- R. Qin, P. Liu, G. Fu and N. Zheng, Small Methods, 2018, 2, 1700286 CrossRef.
- X. Li, X. Yang, Y. Huang, T. Zhang and B. Liu, Adv. Mater., 2019, 31, 1902031 CrossRef CAS.
- B. J. O'Neill, D. H. K. Jackson, J. Lee, C. Canlas, P. C. Stair, C. L. Marshall, J. W. Elam, T. F. Kuech, J. A. Dumesic and G. W. Huber, ACS Catal., 2015, 5, 1804–1825 CrossRef.
- B. Mohanty, B. K. Jena and S. Basu, ACS Omega, 2020, 5, 1287–1295 CrossRef CAS.
- S. Sun, G. Zhang, N. Gauquelin, N. Chen, J. Zhou, S. Yang, W. Chen, X. Meng, D. Geng, M. N. Banis, R. Li, S. Ye, S. Knights, G. A. Botton, T.-K. Sham and X. Sun, Sci. Rep., 2013, 3, 1775 CrossRef.
- M. Piernavieja-Hermida, Z. Lu, A. White, K.-B. Low, T. Wu, J. W. Elam, Z. Wu and Y. Lei, Nanoscale, 2016, 8, 15348–15356 RSC.
- H. Fei, J. Dong, Y. Feng, C. S. Allen, C. Wan, B. Volosskiy, M. Li, Z. Zhao, Y. Wang, H. Sun, P. An, W. Chen, Z. Guo, C. Lee, D. Chen, I. Shakir, M. Liu, T. Hu, Y. Li, A. I. Kirkland, X. Duan and Y. Huang, Nat. Catal., 2018, 1, 63–72 CrossRef CAS.
- C. H. Choi, M. Kim, H. C. Kwon, S. J. Cho, S. Yun, H.-T. Kim, K. J. J. Mayrhofer, H. Kim and M. Choi, Nat. Commun., 2016, 7, 10922 CrossRef CAS PubMed.
- Y. Xue, B. Huang, Y. Yi, Y. Guo, Z. Zuo, Y. Li, Z. Jia, H. Liu and Y. Li, Nat. Commun., 2018, 9, 1460 CrossRef.
- Z. Zhang, C. Feng, C. Liu, M. Zuo, L. Qin, X. Yan, Y. Xing, H. Li, R. Si, S. Zhou and J. Zeng, Nat. Commun., 2020, 11, 1215 CrossRef CAS PubMed.
- L. Zhao, Y. Zhang, L.-B. Huang, X.-Z. Liu, Q.-H. Zhang, C. He, Z.-Y. Wu, L.-J. Zhang, J. Wu, W. Yang, L. Gu, J.-S. Hu and L.-J. Wan, Nat. Commun., 2019, 10, 1278 CrossRef PubMed.
- Y. Chen, S. Ji, Y. Wang, J. Dong, W. Chen, Z. Li, R. Shen, L. Zheng, Z. Zhuang, D. Wang and Y. Li, Angew. Chem., Int. Ed., 2017, 56, 6937–6941 CrossRef CAS.
- S. Wei, A. Li, J.-C. Liu, Z. Li, W. Chen, Y. Gong, Q. Zhang, W.-C. Cheong, Y. Wang, L. Zheng, H. Xiao, C. Chen, D. Wang, Q. Peng, L. Gu, X. Han, J. Li and Y. Li, Nat. Nanotechnol., 2018, 13, 856–861 CrossRef CAS.
- Y.-N. Gong, B.-Z. Shao, J.-H. Mei, W. Yang, D.-C. Zhong and T.-B. Lu, Nano Res., 2022, 15, 551–556 CrossRef CAS.
- J.-H. Zhang, W. Yang, M. Zhang, H.-J. Wang, R. Si, D.-C. Zhong and T.-B. Lu, Nano Energy, 2021, 80, 105542 CrossRef CAS.
- J. Liu, Chin. J. Catal., 2017, 38, 1460–1472 CrossRef CAS.
- M. Wang, L. Árnadóttir, Z. J. Xu and Z. Feng, Nano-Micro Lett., 2019, 11, 47 CrossRef CAS.
- S. Liu, M. Wang, T. Qian, H. Ji, J. Liu and C. Yan, Nat. Commun., 2019, 10, 3898 CrossRef.
- S. Back and Y. Jung, Phys. Chem. Chem. Phys., 2016, 18, 9161–9166 RSC.
- V. Kordali, G. Kyriacou and Ch. Lambrou, Chem. Commun., 2000, 1673–1674 RSC.
- D. Bao, Q. Zhang, F.-L. Meng, H.-X. Zhong, M.-M. Shi, Y. Zhang, J.-M. Yan, Q. Jiang and X.-B. Zhang, Adv. Mater., 2017, 29, 1604799 CrossRef.
- Y. Yao, S. Zhu, H. Wang, H. Li and M. Shao, J. Am. Chem. Soc., 2018, 140, 1496–1501 CrossRef CAS.
- H. Yin, S.-L. Li, L.-Y. Gan and P. Wang, J. Mater. Chem. A, 2019, 7, 11908–11914 RSC.
- S. Gao, Y. Lin, X. Jiao, Y. Sun, Q. Luo, W. Zhang, D. Li, J. Yang and Y. Xie, Nature, 2016, 529, 68–71 CrossRef CAS PubMed.
- X. Sun, K. Li, C. Yin, Y. Wang, F. He, H. Tang and Z. Wu, Phys. Chem. Chem. Phys., 2017, 19, 17670–17676 RSC.
- N. Saeidi, M. D. Esrafili and J. J. Sardroodi, ChemistrySelect, 2019, 4, 12216–12226 CrossRef CAS.
- Y. Wen, H. Zhu, J. Hao, S. Lu, W. Zong, F. Lai, P. Ma, W. Dong, T. Liu and M. Du, Appl. Catal., B, 2021, 292, 120144 CrossRef CAS.
- C. Liu, Q. Li, C. Wu, J. Zhang, Y. Jin, D. R. MacFarlane and C. Sun, J. Am. Chem. Soc., 2019, 141, 2884–2888 CrossRef CAS.
- L. Jiao, G. Wan, R. Zhang, H. Zhou, S.-H. Yu and H.-L. Jiang, Angew. Chem., Int. Ed., 2018, 57, 8525–8529 CrossRef CAS.
- L. Jiao, R. Zhang, G. Wan, W. Yang, X. Wan, H. Zhou, J. Shui, S.-H. Yu and H.-L. Jiang, Nat. Commun., 2020, 11, 2831 CrossRef CAS.
- J. Li, S. Zhao, L. Zhang, S. P. Jiang, S.-Z. Yang, S. Wang, H. Sun, B. Johannessen and S. Liu, Small, 2021, 17, 2004579 CrossRef CAS.
- W. Guo, K. Zhang, Z. Liang, R. Zou and Q. Xu, Chem. Soc. Rev., 2019, 48, 5658–5716 RSC.
- X.-F. Li, Q.-K. Li, J. Cheng, L. Liu, Q. Yan, Y. Wu, X.-H. Zhang, Z.-Y. Wang, Q. Qiu and Y. Luo, J. Am. Chem. Soc., 2016, 138, 8706–8709 CrossRef CAS.
- E. Skúlason, T. Bligaard, S. Gudmundsdóttir, F. Studt, J. Rossmeisl, F. Abild-Pedersen, T. Vegge, H. Jónsson and J. K. Nørskov, Phys. Chem. Chem. Phys., 2012, 14, 1235–1245 RSC.
- C. Ling, X. Bai, Y. Ouyang, A. Du and J. Wang, J. Phys. Chem. C, 2018, 122, 16842–16847 CrossRef CAS.
- X. Li, X. Dai, D. Tang, X. Wang, J. Hong, C. Chen, Y. Yang, J. Lu, J. Zhu, Z. Lei, K. Suenaga, F. Ding and H. Xu, Adv. Funct. Mater., 2021, 31, 2102138 CrossRef CAS.
- P. Ou, X. Zhou, F. Meng, C. Chen, Y. Chen and J. Song, Nanoscale, 2019, 11, 13600–13611 RSC.
- A. J. Medford, A. Vojvodic, J. S. Hummelshøj, J. Voss, F. Abild-Pedersen, F. Studt, T. Bligaard, A. Nilsson and J. K. Nørskov, J. Catal., 2015, 328, 36–42 CrossRef CAS.
- F. Abild-Pedersen, J. Greeley, F. Studt, J. Rossmeisl, T. R. Munter, P. G. Moses, E. Skúlason, T. Bligaard and J. K. Nørskov, Phys. Rev. Lett., 2007, 99, 016105 CrossRef CAS PubMed.
- F. Calle-Vallejo, D. Loffreda, M. T. M. Koper and P. Sautet, Nat. Chem., 2015, 7, 403–410 CrossRef CAS PubMed.
- J. G. Howalt, T. Bligaard, J. Rossmeisl and T. Vegge, Phys. Chem. Chem. Phys., 2013, 15, 7785 RSC.
- J. H. Montoya, C. Tsai, A. Vojvodic and J. K. Nørskov, ChemSusChem, 2015, 8, 2180–2186 CrossRef CAS PubMed.
- V. R. Stamenkovic, B. S. Mun, M. Arenz, K. J. J. Mayrhofer, C. A. Lucas, G. Wang, P. N. Ross and N. M. Markovic, Nat. Mater., 2007, 6, 241–247 CrossRef CAS.
- C. J. M. van der Ham, M. T. M. Koper and D. G. H. Hetterscheid, Chem. Soc. Rev., 2014, 43, 5183–5191 RSC.
- Y. Nishibayashi, Inorg. Chem., 2015, 54, 9234–9247 CrossRef CAS PubMed.
- F. Zhou, L. M. Azofra, M. Ali, M. Kar, A. N. Simonov, C. McDonnell-Worth, C. Sun, X. Zhang and D. R. MacFarlane, Energy Environ. Sci., 2017, 10, 2516–2520 RSC.
- B. H. R. Suryanto, C. S. M. Kang, D. Wang, C. Xiao, F. Zhou, L. M. Azofra, L. Cavallo, X. Zhang and D. R. MacFarlane, ACS Energy Lett., 2018, 3, 1219–1224 CrossRef CAS.
- L. Zhang, S. Mallikarjun Sharada, A. R. Singh, B. A. Rohr, Y. Su, L. Qiao and J. K. Nørskov, Phys. Chem. Chem. Phys., 2018, 20, 4982–4989 RSC.
- J. Zheng, Y. Lyu, M. Qiao, R. Wang, Y. Zhou, H. Li, C. Chen, Y. Li, H. Zhou, S. P. Jiang and S. Wang, Chem, 2019, 5, 617–633 CAS.
- C. S. L. Koh, H. K. Lee, H. Y. Fan Sim, X. Han, G. C. Phan-Quang and X. Y. Ling, Chem. Mater., 2020, 32, 1674–1683 CrossRef CAS.
- Y. Zhao, R. Shi, X. Bian, C. Zhou, Y. Zhao, S. Zhang, F. Wu, G. I. N. Waterhouse, L.-Z. Wu, C.-H. Tung and T. Zhang, Adv. Sci., 2019, 6, 1802109 CrossRef PubMed.
- G. Zhao, J. Xuan, Q. Gong, L. Wang, J. Ren, M. Sun, F. Jia, G. Yin and B. Liu, ACS Appl. Mater. Interfaces, 2020, 12, 8573–8582 CrossRef CAS PubMed.
- C. F. B. Coutinho, A. A. Muxel, C. G. Rocha, D. A. de Jesus, R. V. S. Alfaya, F. A. S. Almeida, Y. Gushikem and A. A. S. Alfaya, J. Braz. Chem. Soc., 2007, 18, 6 CrossRef.
- J. Choi, B. H. R. Suryanto, D. Wang, H.-L. Du, R. Y. Hodgetts, F. M. Ferrero Vallana, D. R. MacFarlane and A. N. Simonov, Nat. Commun., 2020, 11, 5546 CrossRef CAS.
- A. Wu, J. Yang, B. Xu, X.-Y. Wu, Y. Wang, X. Lv, Y. Ma, A. Xu, J. Zheng, Q. Tan, Y. Peng, Z. Qi, H. Qi, J. Li, Y. Wang, J. Harding, X. Tu, A. Wang, J. Yan and X. Li, Appl. Catal., B, 2021, 299, 120667 CrossRef CAS.
| This journal is © The Royal Society of Chemistry 2022 |

