
Conversion of methane to acetonitrile over GaN catalysts derived from gallium nitrate hydrate co-pyrolyzed with melamine, melem, or g-C3N4: the influence of nitrogen precursors†
Korawich
Trangwachirachai
 a,
Chin-Han
Chen
a,
Ai-Lin
Huang
a,
Jyh-Fu
Lee
b,
Chi-Liang
Chen
b and
Yu-Chuan
Lin
*a
a,
Chin-Han
Chen
a,
Ai-Lin
Huang
a,
Jyh-Fu
Lee
b,
Chi-Liang
Chen
b and
Yu-Chuan
Lin
*a
aDepartment of Chemical Engineering, National Cheng Kung University, Tainan 70101, Taiwan. E-mail: yclin768@mail.ncku.edu.tw
bNational Synchrotron Radiation Research Center, Hsinchu 30076, Taiwan
First published on 11th November 2021
Abstract
Co-pyrolyzing gallium nitrate hydrate and melamine, melem, or g-C3N4 generates gallium nitride (GaN) for the conversion of methane to acetonitrile (AcCN). The solid-state-pyrolysis-made GaN catalysts exhibited better activity than commercial GaN. Among the as-prepared catalysts, GaN made by using g-C3N4 with a N/Ga ratio of 2 (i.e., GaN-(C3N4)-(2)) was the most attractive: a high initial methane conversion (28.2%), a high initial AcCN productivity (151 μmol gcat−1 min−1), and a 6 h accumulated AcCN yield (5816 μmol gcat−1) were obtained at 700 °C with a space time of 3000 mLCH4 gcat−1 h−1. GaN-(C3N4)-(2) had finely dispersed GaN crystals and enriched amorphous CN species (e.g., sp2 N and C![[triple bond, length as m-dash]](https://www.rsc.org/images/entities/char_e002.gif) N groups), and both are important in promoting the methane conversion rate. GaN agglomeration, coke deposition, and depleted CN species contributed to the deactivation of the catalyst, and a nitridation–activation process could rejuvenate the activity partially. The analysis of the structure–activity correlation revealed that the accumulated AcCN yield had an inverse trend with respect to the crystallite size of GaN and the sp3/sp2 ratio of the N environment.
N groups), and both are important in promoting the methane conversion rate. GaN agglomeration, coke deposition, and depleted CN species contributed to the deactivation of the catalyst, and a nitridation–activation process could rejuvenate the activity partially. The analysis of the structure–activity correlation revealed that the accumulated AcCN yield had an inverse trend with respect to the crystallite size of GaN and the sp3/sp2 ratio of the N environment.
1. Introduction
Methane is a greenhouse gas with a global warming potential approximately 30 times higher than that of CO2. Approximately 60% of methane emissions are related to anthropogenic behavior,1 and a 5% growth rate of annual emissions is forecasted.2 Methane is mainly used as fuel, with about 15% used as a chemical feedstock, mostly in steam reforming to produce syngas.3 Owing to the increasing economically feasible methane reserves after the shale gas revolution4 and the growing concern over methane emission/leakage from industry, methane utilization in chemical synthesis has been refocused on.Direct conversion of methane to chemicals is usually categorized into non-oxidative (e.g., methane dehydroaromatization) and oxidative routes (e.g., methane oxidative coupling), which transform methane into olefins and aromatics.5 Other methods such as halogenation of methane (e.g., methane bromination into methyl bromide6–8) and sulfonation to methanesulfonic acid have been reported.9 However, most of these approaches are uneconomical due to low methane conversions, high activation temperatures, and demanding separation steps.10 This has stimulated recent studies on methane activation through photo-,11 electro-,12 electro-thermal,13 and novel heterogeneous catalysis (e.g., tandem14 and single-atom catalysts15).
Acetonitrile (AcCN) is an important chemical mostly used as a solvent in organic synthesis and in separation/purification. The major use of AcCN in the petrochemical industry is to extract butadiene from crude C4 streams in extractive distillation.16 Currently, AcCN is a byproduct obtained from the ammoxidation of propylene to acrylonitrile (Sohio process).17 Transforming light alkanes to AcCN has gained considerable attention because of the low cost and abundance of alkanes. Conversion of ethane and ethylene to AcCN by ammoxidation has been reported.18–21 Still, the growing demand for AcCN stimulates researchers to develop an alternative route for AcCN production from light alkanes. Our group recently discovered that methane conversion to AcCN can be achieved through gallium nitride (GaN)-based catalysts.22
GaN has been applied in the catalysis of alkane conversion, such as methane conversion to ethylene23 and aromatics,24 oxidative dehydrogenation of n-butane,25 and dehydrogenation of propane.26 GaN is more active than its oxide form (β-Ga2O3). Moreover, the effects of the particle size and purity of GaN had a strong correlation with the alkane conversion activity. Li et al.24 tested GaN and β-Ga2O3 in methane conversion, and found that the former showed an approximately five-fold higher activity and a two-fold higher benzene selectivity than the latter. Xing et al.25 investigated the particle size effect of GaN in the oxidative dehydrogenation of n-butane, and revealed that small GaN particles performed better than their counterparts with large sizes. Dutta et al.23 used anhydrous ammonia for nitridation of β-Ga2O3 to GaN. The higher the degree of nitridation (the conversion of β-Ga2O3 to GaN), the better the C2H4 yield of methane conversion.
Numerous methods have been reported for the preparation of nanostructured GaN particles, such as solvothermal decomposition of Ga–urea complexes,27 the molecular-beam-epitaxy growth method,28 and ammonia nitridation of Ga precursors.23,29 However, small-scale production, tedious preparation steps, severe synthesis conditions, and corrosion of nitridation systems caused by anhydrous ammonia are challenges that remain to be overcome. A promising method for synthesizing GaN is solid-state pyrolysis.26 Co-pyrolyzing the precursors of Ga (e.g., gallium nitrate hydrate) and N (e.g., melamine) in a one-pot process can be used to prepare supported and unsupported GaN nanoparticles. However, the influence of Ga and N precursors on the derived GaN nanoparticles and the structure–activity correlation of the solid-state-pyrolysis-made GaN in alkane conversion remain to be clarified.
This study investigated the mixtures of gallium nitrate hydrate and the N precursor (including melamine (C3H6N6), melem (C6H6N10), or graphitic carbon nitride (g-C3N4)) in solid-state pyrolysis and applied their derived GaN catalysts in the anaerobic conversion of methane to AcCN. The use of g-C3N4 with a N/Ga ratio of 2 is preferred because the derived GaN catalyst has a higher methane conversion and AcCN productivity. The better activity was attributed to the coexistence of well dispersed GaN nano-crystals and amorphous CN species containing sp2 N and CN groups. The advantage of using g-C3N4 in GaN synthesis was thereby proposed.
2. Experiments
2.1. Materials
Gallium(III) nitrate hydrate (Ga(NO3)3·xH2O, 99.9998%) was purchased from Acros. Commercially available gallium nitride (denoted as c-GaN, 99.99%), beta-gallium oxide (β-Ga2O3, 99.99%), and melamine (99%) were purchased from Alfa Aesar. Methane (99.999%) and nitrogen (99.999%) were obtained from Air Products.2.2. Preparation of nitrogen precursors (melem and g-C3N4)
Melem and g-C3N4 were prepared by pyrolyzing melamine in N2 atmosphere.30 Approximately 20 g of melamine was placed in a crucible and sealed with aluminum foil, and then linearly heated (2.5 °C min−1) in the furnace to 450 °C and the isotherm was maintained for 4 h to synthesize melem; on heating to 550 °C for 4 h, g-C3N4 was obtained. The obtained samples were ground into powder form.2.3. Preparation of GaN
The GaN catalysts were prepared by using a modified solid-state pyrolysis method.26 The mixture of the nitrogen precursor and gallium nitrate hydrate was ultrasonicated in methanol (25 mL) for 15 min, and then dried in an oven at 90 °C overnight. The dried powder was transferred into a horizontal quartz tube, pyrolyzed at 800 °C (ramping rate of 1 °C min−1) and kept isothermal for 1 h in a N2 stream (20 mL min−1). The as-synthesized GaN catalyst was named as GaN-(N precursor)-(X), where X indicates the weight ratio of the N-source to the gallium precursor, namely N/Ga ratios, including 0.5, 1, and 2. For example, GaN-(C3N4)-(2) was prepared by using a mixture of g-C3N4 and gallium nitrate hydrate with an N-to-Ga weight ratio of 2. Moreover, to reveal the cavity effect of g-C3N4, Ga supported on g-C3N4 (Ga/C3N4) was prepared by pyrolyzing the mixture of g-C3N4 and gallium nitrate hydrate (N/Ga = 2) at 550 °C for 1 h.2.4. Activity test
A horizontal quartz tube (i.d. = 1.3 cm) was used as a fixed-bed reactor for methane conversion. Approximately 0.2 g of catalyst (40–80 mesh) was placed in the center of the tube and sandwiched with quartz wool. Before each test, the catalyst was treated in a N2 stream (25 mL min−1) at 700 °C with a ramping rate of 10 °C min−1. After pre-activating the catalyst for 0.5 h, the N2 stream was switched to a methane flow (10 mL min−1) with a gas hourly space velocity (GHSV) of 3000 mLCH4 gcat−1 h−1. All tubing and connections were wrapped with heating tape and heated at 150 °C to avoid condensation of the products. The downstream exhaust was split into two lines for on-stream analysis using a quadrupole mass spectrometer (MS, Thermostar GSD 320, Pfeiffer Vacuum) and a gas chromatograph (GC, SRI 8610C, PoraPLOT Q-HT (25 m × 0.53 mm × 20 μm) GC column) with a flame ionization detector and a thermal conductivity detector. The data was recorded immediately after admitting methane to the system by the MS, and was recorded by the GC at a steady-state operation (40 min after admitting methane). Methane conversion and productivity were calculated using the following equations: | (1) |
 | (2) |
The effect of reaction temperature (675, 700, and 725 °C) was studied at a GHSV of 3000 mLCH4 gcat−1 h−1 using GaN-(melamine, melem, or C3N4)-(1). The effect of GHSV (1500 and 4500 mLCH4 gcat−1 h−1) was evaluated at 700 °C. Catalyst regeneration was tested by using a calcination–nitridation or a nitridation–activation process. For the calcination–nitridation process, the temperature was cooled to 600 °C (30 min) after a 6 h test under a N2 stream (20 mL min−1) and maintained for 1 h under a flow of air (25 mL min−1) to remove deposited coke. After calcination, the temperature was increased to 800 °C (30 min) in a N2 stream (20 mL min−1). The flow was switched to 99.99% NH3 (20 mL min−1) and kept isothermal for 9 h for nitridation. For the nitridation–activation process, after a 6 h test, the temperature was directly increased to 800 °C (30 min) in a N2 stream (20 mL min−1). The flow was then switched to 99.99% NH3 (20 mL min−1) and kept isothermal for 9 h for nitridation. After nitridation, the temperature was cooled under an NH3 stream to room temperature. The regenerated catalyst was purged with N2 at room temperature for 1 h, then was activated and tested using the same conditions as its fresh form.
To examine whether or not N2 can be used to replenish the consumed N species of the spent catalyst, an alternating feeding test of CH4–N2–CH4 was conducted.
2.5. Characterization
X-ray diffraction (XRD) patterns were recorded on a diffractometer (Rigaku D/Max-IIB) using Cu Kα radiation. Elemental analysis of Ga was quantified using an inductively coupled plasma mass spectrometer (ICP-MS, THERMO-ELEMENT XR), and the concentration of N was measured using an elemental analyzer (EA, German Elementar, UNICUBE). The porosity was obtained from N2-physisorption at 77 K using a Micromeritics ASAP 2020 instrument. The shape and d-space of the GaN crystals were observed using a transmission electron microscope-energy dispersive spectrometer (TEM-EDS, JEOL 3010).X-ray absorption spectra (XAS) at the Ga K-edge were recorded in transmission mode at the beamline TLS-17C1 of the National Synchrotron Radiation Research Center (NSRRC), Taiwan. The incident X-ray was monochromatized with a Si(111) double crystal monochromator. The Ga K-edge XAS spectra of β-Ga2O3 were collected as a reference. The Athena and Artemis software ver. 0.9.26 included in the Demeter package31 was used to analyze the spectra. The X-ray absorption near edge structure (XANES) N K-edge was recorded at the high-energy spherical grating monochromator (HSGM) TLS20A (NSRRC) beamline using the total electron yield (TEY) mode, with a base pressure of 5 × 10⁻⁹ Torr and a resolving power of approximately E/ΔE = 8000. c-GaN was used for energy calibration. X-ray photoelectron spectroscopy (XPS) was carried out using a Kratos Axis Ultra DLD instrument with a focused monochromatic Al Kα X-ray source (1486.7 eV). The C 1s signal at 285.0 eV was used to correct binding energy shifts.
Fourier transform infrared spectroscopy (FTIR) was performed using a Thermo Scientific Nicolet iS50 spectrometer. The spectral resolution was 4 cm−1 and 20 scans. The background spectrum was measured at room temperature and was subtracted from each spectrum. In situ diffuse reflectance infrared Fourier transform spectroscopy (DRIFTS) analysis was conducted by using a DRIFT cell (Praying Mantis, Harrick Scientific Products) and an MCT detector in the range of 650–4000 cm−1 with 32 scans at a resolution of 4 cm−1 using a ZnSe window. An approximately 20 mg of GaN-(C3N4)-(2) was placed in a holder and was then purged with N2 (25 mL min−1) for 30 min for each run. The in situ DRIFT analyses of GaN-(C3N4)-(2) included temperature-resolved spectra in a N2 stream (20 mL min−1), in an air stream (20 mL min−1), and in a sealed chamber filled with 50% CH4 in N2.
3. Results
3.1. Activity evaluation
Table 1 presents the activity results of the initial run and after a 6 h operation of each GaN catalyst and Fig. S1–S7† show the time on-stream (TOS) profiles. The effect of reaction temperatures (675, 700, and 725 °C) was studied over GaN-(melamine)-(1), GaN-(melem)-(1), and GaN-(C3N4)-(1), as shown in entries 1 to 9 of Table 1. The initial methane conversion increased with increasing temperature for each catalyst. Among the tested catalysts, GaN-(C3N4)-(1) had higher initial methane conversions (20.0–29.9%) and AcCN productivities (3631–4100 μmol gcat−1) at 675–725 °C. The accumulated AcCN in the 6 h operation was higher at 700 °C for each catalyst. Accordingly, 700 °C was selected as the operating temperature for further investigation.| Entry | Sample | T (°C) | GHSV (mLCH4 gcat−1 h−1) | CH4 conversion (%) | AcCN productivity (μmol gcat−1 min−1) | 6 h accumulated AcCN productivity (μmol gcat−1) | ||
|---|---|---|---|---|---|---|---|---|
| Initiala | Final | Initiala | Final | |||||
| a Initial methane conversion and AcCN productivity were estimated by using the MS signals. | ||||||||
| 1 | GaN-(melamine)-(1) | 675 | 3000 | 13.8 | 1.0 | 33 | 1.8 | 1795 |
| 2 | 700 | 14.6 | 1.0 | 34 | 1.6 | 2031 | ||
| 3 | 725 | 16.2 | 0.9 | 36 | 1.0 | 1995 | ||
| 4 | GaN-(melem)-(1) | 675 | 3000 | 18.9 | 1.4 | 45 | 2.8 | 2736 |
| 5 | 700 | 27.3 | 1.2 | 68 | 2.0 | 2993 | ||
| 6 | 725 | 28.9 | 0.8 | 71 | 0.9 | 2665 | ||
| 7 | GaN-(C3N4)-(1) | 675 | 3000 | 20.0 | 2.1 | 50 | 4.7 | 3917 |
| 8 | 700 | 26.6 | 0.9 | 123 | 1.4 | 4100 | ||
| 9 | 725 | 29.9 | 1.1 | 74 | 1.5 | 3631 | ||
| 10 | GaN-(melamine)-(1) | 700 | 1500 | 28.1 | 2.6 | 72 | 6.4 | 4890 |
| 11 | 4500 | 10.0 | 0.6 | 24 | 0.5 | 1168 | ||
| 12 | GaN-(melem)-(1) | 700 | 1500 | 29.7 | 2.6 | 71 | 6.4 | 4880 |
| 13 | 4500 | 21.0 | 0.8 | 67 | 1.1 | 2387 | ||
| 14 | GaN-(C3N4)-(1) | 700 | 1500 | 37.7 | 1.9 | 186 | 8.1 | 9239 |
| 15 | 4500 | 16.8 | 0.6 | 83 | 1.0 | 3097 | ||
| 16 | GaN-(C3N4)-(0.5) | 700 | 3000 | 21.3 | 1.1 | 102 | 0.4 | 3486 |
| 17 | GaN-(C3N4)-(2) | 28.2 | 1.7 | 151 | 3.3 | 5816 | ||
The effect of GHSV was studied over GaN-(melamine)-(1), GaN-(melem)-(1), and GaN-(C3N4)-(1), as shown in entries 2, 5, 8, and 10–15 of Table 1 and Fig. S4–S6.† The onset methane conversion and AcCN productivity increased with respect to the decreased GHSV. GaN-(C3N4)-(1) showed a better activity in most of these trials. At 700 °C with a GHSV = 1500 mLCH4 gcat−1 h−1, GaN-(C3N4)-(1) had its initial conversion at 37.7%; initial AcCN productivity, 186 μmol gcat−1 min−1; accumulated AcCN, 9239 μmol gcat−1. All these results indicated the potential of GaN-(C3N4)-(1) in the conversion of methane to AcCN.
Since GaN derived from g-C3N4 showed the best performance, the effect of the N/Ga ratio was investigated using GaN-(C3N4)-(0.5, 1, and 2), as shown in entries 8, 16, and 17 of Table 1 and Fig. S7.† All of them exhibited a gradual decrease of methane conversion and AcCN productivity in the 6 h testing from approximately 21.3% to 1.1% and from 102 to 0.4 μmol gcat−1 min−1 for GaN-(C3N4)-(0.5), from 26.6% to 0.9% and from 123 to 1.4 μmol gcat−1 min−1 for GaN-(C3N4)-(1), and from 28.2% to 1.7% and from 151 to 3.3 μmol gcat−1 min−1 for GaN-(C3N4)-(2). Among them, GaN-(C3N4)-(2) displayed the highest activity and accumulated AcCN yield (5816 μmol gcat−1).
The productivities of minor products, including HCN (<14 μmol gcat−1 min−1), C2 hydrocarbons (<12 μmol gcat−1 min−1), and aromatics (<2 μmol gcat−1 min−1) are shown in Fig. S1–S7.† Declining trends of these products were observed. For comparison, Fig. S8† shows the activity test of c-GaN, which displayed negligible methane conversion (<0.6%) and AcCN productivity (<0.2 μmol gcat−1 min−1).
The reproducibility test was done over three different batches of GaN-(C3N4)-(2), see Fig. S9.† The 95% confidence interval of each data point was less than 5%, indicating that the reproducibility of our catalytic system is acceptable.
The regeneration tests of GaN-(C3N4)-(2) through the calcination–nitridation and nitridation–activation processes are shown in Fig. S10† and Fig. 1, respectively. By using the calcination–nitridation method in catalyst regeneration, the activity of the spent GaN-(C3N4)-(2) can hardly be rejuvenated: the methane conversion and productivities of all species were less than their respective values at the end of the 1st on-stream test. In contrast, the activity of the spent GaN-(C3N4)-(2) regenerated by using the nitridation–activation process was partially rejuvenated. The initial conversion (5.6%) and productivities of AcCN (9.8%), HCN (1.7%), and aromatics (2.7%) of the regenerated GaN-(C3N4)-(2) were all higher than their respective values at the end of the 1st on-stream test. Interestingly, C2 productivities were nearly identical before and after regeneration in the range of 6.6% to 8.4%.
 | ||
| Fig. 1 (a) Methane conversion and (b) productivities of AcCN, C2, HCN, and aromatics from the regeneration test of GaN-(C3N4)-(2) using the nitridation–activation process. | ||
Fig. S11† shows the alternating feeding test of CH4–N2–CH4. When introducing methane, AcCN is produced concurrently and declined gradually. After the reaction for 40 min, the flow was switched to the N2 flow. In the meantime, AcCN declined sharply to an undetectable level. After flowing N2 for 80 min, the stream was switched back to CH4, and the AcCN signal was regained to a similar level to that of its regular test.
In brief, g-C3N4 is deemed to be the most favorable N precursor. Moreover, the high N/Ga ratio (2) used in co-pyrolyzing Ga(NO3)3·xH2O and g-C3N4 improves the activity in methane conversion to AcCN. Accordingly, further analyses of GaN-(C3N4)-(0.5, 1, and 2) in comparison with GaN-(melamine)-(1) and GaN-(melem)-(1) were carried out. Moreover, explanation of catalyst deactivation was obtained by the characterization of the post-reaction catalysts.
3.2. Bulk structure of GaN catalysts
Table 2 presents the results of elemental analysis of the tested samples. The measured Ga contents, ranging from 76.9 to 86.2 wt%, were close to the theoretical value (83.3 wt%; less than 8% variation). The N concentrations varied from 10.6 to 17.9 wt% while the theoretical value is 16.7 wt%. The values of the N/Ga ratio ranged from 0.62 to 1.14. The compositions of Ga and N of post-reaction catalysts were also analyzed, as presented in Table S1.† Slightly lower Ga and N concentrations, compensating for carbon deposition, of the post-reaction catalysts than their fresh forms were found. Nevertheless, the N/Ga ratios of the catalysts before and after reaction were close.| Catalyst | Gaa (wt%) | Nb (wt%) | N/Ga molar ratio | S BET (m2 g−1) | V P (cm3 g−1) | D P (nm) |
|---|---|---|---|---|---|---|
| a Estimated by ICP-MS. b Estimated by EA. c Surface area estimated by using the BET method. d Pore volume and pore diameter estimated by using the BJH method. | ||||||
| c-GaN | 86.2 | 10.7 | 0.62 | 4.4 | 0.025 | N.D. |
| GaN-(melamine)-(1) | 79.2 | 17.2 | 1.08 | 30.9 | 0.088 | 11.6 |
| GaN-(melem)-(1) | 80.9 | 10.6 | 0.65 | 42.3 | 0.062 | 6.2 |
| GaN-(C3N4)-(0.5) | 81.9 | 15.6 | 0.95 | 31.4 | 0.086 | 11.8 |
| GaN-(C3N4)-(1) | 78.2 | 17.9 | 1.14 | 23.2 | 0.061 | 12.0 |
| GaN-(C3N4)-(2) | 79.5 | 15.5 | 0.97 | 21.1 | 0.046 | 8.2 |
Fig. S12† shows the N2 adsorption–desorption isotherms and the pore size distributions, and Table 2 presents the porosities of the tested catalysts. A type V-like isotherm with a type H3 hysteresis loop was observed for each sample, suggesting that disordered mesopores were dominant. The surface areas and pore volumes of the as-prepared catalysts were close, in the range of 16.2 to 42.3 m2 g−1 and 0.042 to 0.097 cm3 g−1, respectively. c-GaN had an order of magnitude lower surface area (4.4 m2 g−1) and approximately half of the pore volume (0.025 cm3 g−1) compared to those of as-prepared GaN.
Fig. 2a shows the structural analysis of GaN-based catalysts. The XRD patterns of the tested catalysts exhibited the wurtzite GaN phase, similar to that of c-GaN. The crystallite sizes were obtained from the Scherrer equation using the (101) diffraction plane. All the as-synthesized GaN catalysts showed smaller crystallites, as compared to that of c-GaN. The GaN crystallites of g-C3N4 made samples (5.8 nm) were smaller than those of GaN-(melamine)-(1) (8.1 nm) and GaN-(melem)-(1) (7.0 nm). Moreover, the crystallinity of GaN-(C3N4)-(X) was changed with respect to the N/Ga ratio: the crystallite size of GaN was reduced with the increased N/Ga ratio.
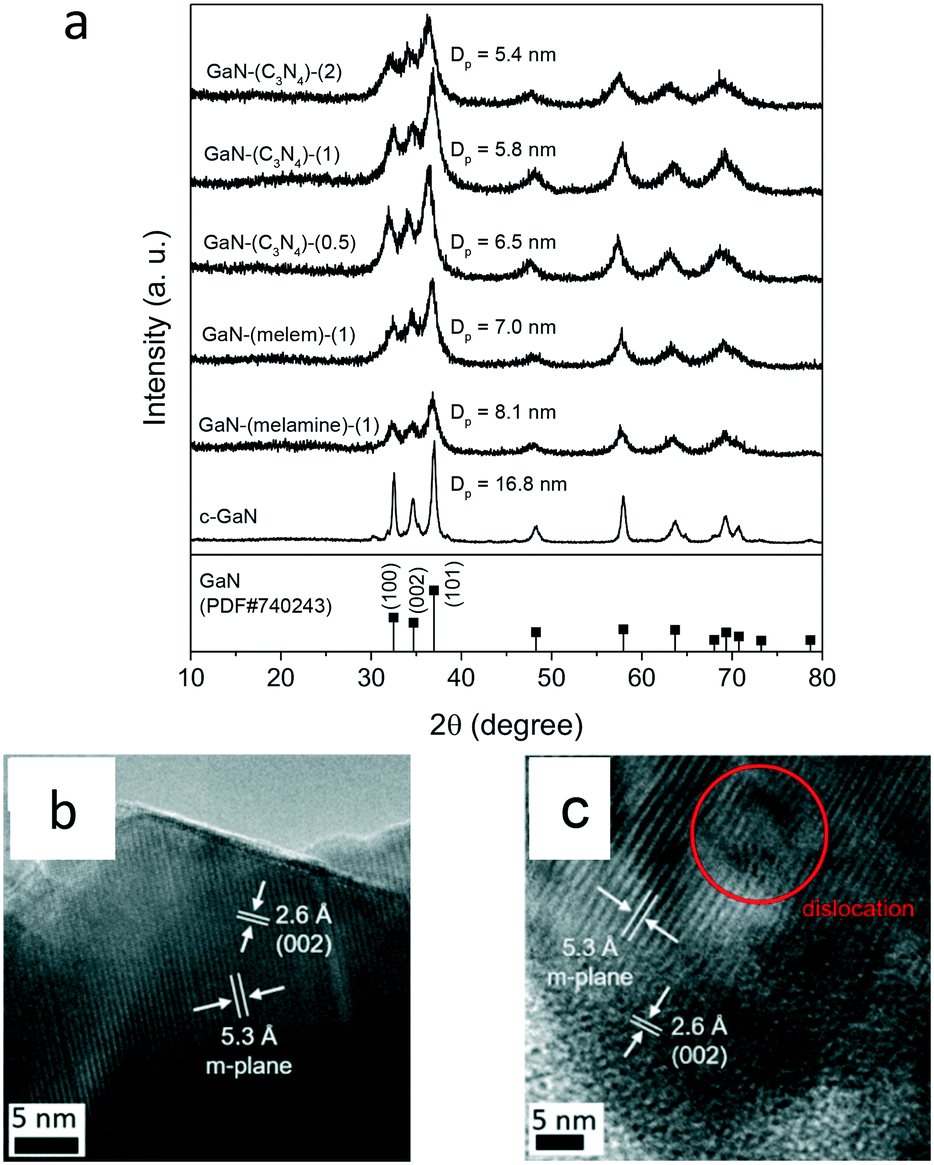 | ||
| Fig. 2 (a) XRD patterns of solid-state-pyrolysis-made GaN catalysts by using the mixtures of gallium nitride hydrate and different N sources (i.e., melamine, melem, and g-C3N4). The patterns of c-GaN and β-Ga2O3 were included for reference. The TEM images of (b) c-GaN and (c) GaN-(C3N4)-(2). | ||
The crystal structure of the post-reaction catalyst was also analyzed by using XRD. Fig. S13† shows that all the post-reaction catalysts retained their wurtzite GaN structure. The diffraction intensities of the post-reaction catalyst were slightly stronger than those of its fresh form. Thus, the estimated crystallite sizes of the post-reaction catalysts were a little higher than their fresh forms.
Fig. 2b and c exhibit the TEM images of c-GaN and GaN-(C3N4)-(2). Regular lattice fringes, including the m-plane (5.3 Å) and the (002) lattice spacing (2.6 Å) of wurtzite GaN,23,32 were observed for both samples. A clear edge was observed for c-GaN, whereas dislocations were identified for GaN-(C3N4)-(2). Accordingly, the crystallinity of wurtzite GaN of c-GaN was higher than that of GaN-(C3N4)-(2).
Fig. 3a shows the XANES spectra of the tested catalysts and standards including β-Ga2O3 and c-GaN. Each catalyst had its white-line peak amplitude weaker than that of β-Ga2O3. Moreover, a weaker signal in the range of 10![[thin space (1/6-em)]](https://www.rsc.org/images/entities/char_2009.gif) 378–10390 eV, where the characteristic oscillations of GaN located, was discovered for each GaN catalyst. In the range of approximately 300 eV higher than the edge (10367 eV), eight oscillations belonging to GaN were identified for each as-synthesized catalyst with weaker amplitudes than those of c-GaN (see Fig. 3b).
378–10390 eV, where the characteristic oscillations of GaN located, was discovered for each GaN catalyst. In the range of approximately 300 eV higher than the edge (10367 eV), eight oscillations belonging to GaN were identified for each as-synthesized catalyst with weaker amplitudes than those of c-GaN (see Fig. 3b).
 | ||
| Fig. 3 (a) Ga K-edge XANES of GaN-based catalysts and (b) the eight oscillation peaks (marked with asterisks) in the first 300 eV above the absorption edge. (c) Ga–N phase corrected RDFs of the Ga K-edge of tested catalysts. The solid line represents the experimental data, and the dashed line represents the computer fit. | ||
Fig. 3c shows the phase corrected radial distribution functions (RDFs) acquired from the Fourier transformation (phase corrected) of the k3-weighted EXAFS data and Table 3 presents the parameters obtained from the curve fitting results. The values of the coordination number (CN) of the 1st Ga–N shell (1.92 Å) and the 2nd Ga–Ga shell (3.19 Å) of c-GaN were 4 and 12, respectively, in line with the hexagonal wurtzite structure of GaN. GaN-(melamine)-(1) and GaN-(melem)-(1) had similar RDFs with slightly lower CN values of the 1st (2.9 and 3.3) and 2nd (8.4 and 8.2) shells than those of c-GaN. In contrast, the RDFs of GaN-(C3N4)-(0.5, 1, and 2) showed mainly the 1st shell response with a weak/negligible signal of the 2nd shell. The 1st shell CN values of GaN-(C3N4)-(0.5, 1, and 2) were all greater than 4, while the parameter uncertainties were large for the fitted values of the 2nd shell.
| Sample | Scattering path | CN | R (Å) | σ 2 (Å2) | R-Factor |
|---|---|---|---|---|---|
| a CN = coordination number; R = interatomic distance; σ2 = Debye–Waller factor. | |||||
| c-GaN | Ga–N | 4.0 ± 0.0 | 1.92 ± 0.01 | 0.0037 | 0.0098 |
| Ga–Ga | 12.0 ± 0.0 | 3.19 ± 0.01 | 0.0081 | ||
| GaN-(melamine)-(1) | Ga–N | 2.9 ± 0.5 | 1.92 ± 0.01 | 0.0048 | 0.0126 |
| Ga–Ga | 8.4 ± 1.9 | 3.20 ± 0.01 | 0.0093 | ||
| GaN-(melem)-(1) | Ga–N | 3.3 ± 0.4 | 1.93 ± 0.01 | 0.0039 | 0.0112 |
| Ga–Ga | 8.2 ± 1.7 | 3.20 ± 0.01 | 0.0087 | ||
| GaN-(C3N4)-(1) | Ga–N | 4.9 ± 0.6 | 1.93 ± 0.01 | 0.0070 | 0.0097 |
| Ga–Ga | 10.8 ± 9.5 | 3.19 ± 0.03 | 0.0336 | ||
| GaN-(C3N4)-(0.5) | Ga–N | 5.4 ± 0.7 | 1.93 ± 0.01 | 0.0064 | 0.0110 |
| Ga–Ga | 7.2 ± 4.0 | 3.19 ± 0.02 | 0.0170 | ||
| GaN-(C3N4)-(2) | Ga–N | 7.0 ± 0.7 | 1.96 ± 0.01 | 0.0088 | 0.0086 |
To reveal the unique chemistry of GaN derived from g-C3N4, an X-ray absorption intensity analysis of the sp2 and sp3 environments of the N K-edge XANES spectrum was performed (see Fig. 4). The four characteristic responses (A B, C, and D) corresponding to the s and p hybridized orbitals33 were deconvoluted into six Gaussian peaks (G1 to G6) to simulate the transitions to the bound state. The peaks of G1, G3, and G6 are attributed to the sp2 environment; G2, G4, and G5, sp3 environment.34 Accordingly, the peak area ratio of (G2 + G4 + G5)/(G1 + G3 + G6) can be used to estimate the relative composition of the sp3 (interstitial N in wurtzite GaN)-to-sp2 (amorphous N) environment.35
 | ||
| Fig. 4 N K-edge XANES of GaN-based catalysts. The fitted peaks of G1 (red), G2 (green), G3 (blue), G4 (cyan), G5 (magenta), and G6 (yellow) were included. | ||
The N K-edge XANES spectra of c-GaN, GaN-(melamine)-(1), and GaN-(melem)-(1) were similar, showing a strong B response between the A and C responses with similar intensities. In comparison, the spectrum of GaN-(C3N4)-(0.5, 1, or 2) shows a relatively weak B response compared to those of the A and C responses. Moreover, the relative composition of sp3/sp2 decreased in the following order: c-GaN (1.28) > GaN-(melamine)-(1) (1.06) > GaN-(melem)-(1) (1.00) > GaN-(C3N4)-(0.5) (0.99) > GaN-(C3N4)-(1) (0.96) > GaN-(C3N4)-(2) (0.91). That is, relatively high amounts of amorphous N were formed on g-C3N4 derived GaN catalysts, and GaN-(C3N4)-(2) had the highest relative composition of amorphous N species.
Fig. S14† shows the Ga XANES spectrum, the RDF profile, and the N XANES spectrum of the post-reaction GaN-(C3N4)-(2). The post-reaction GaN-(C3N4)-(2) had similar profiles to those of c-GaN. The fitted parameters of the 1st and 2nd shells of spent GaN-(C3N4)-(2) were 3.1 and 11.6 and were close to the 1st and 2nd CN values of c-GaN. The ratio of the sp3/sp2 N environment of spent GaN-(C3N4)-(2) was 1.06, lower than that of its fresh counterpart (0.91).
3.3. Surface analysis of GaN catalysts
Fig. 5 shows the XPS spectra of Ga 3d, N 1s, C 1s, and O 1s core levels of the as-prepared GaN catalysts. The Ga 3d spectrum (Fig. 5a) can be deconvoluted into 3 peaks at 17.9 eV (N 1s), 19.5 eV (Ga–N), and 20.3 eV (Ga–O).36 The Ga 3d spectrum of c-GaN is also presented in Fig. S15a.† Each sample showed a relative composition of Ga–N response of >60%; that of Ga–O was <35%; and that of N 1s was <10%.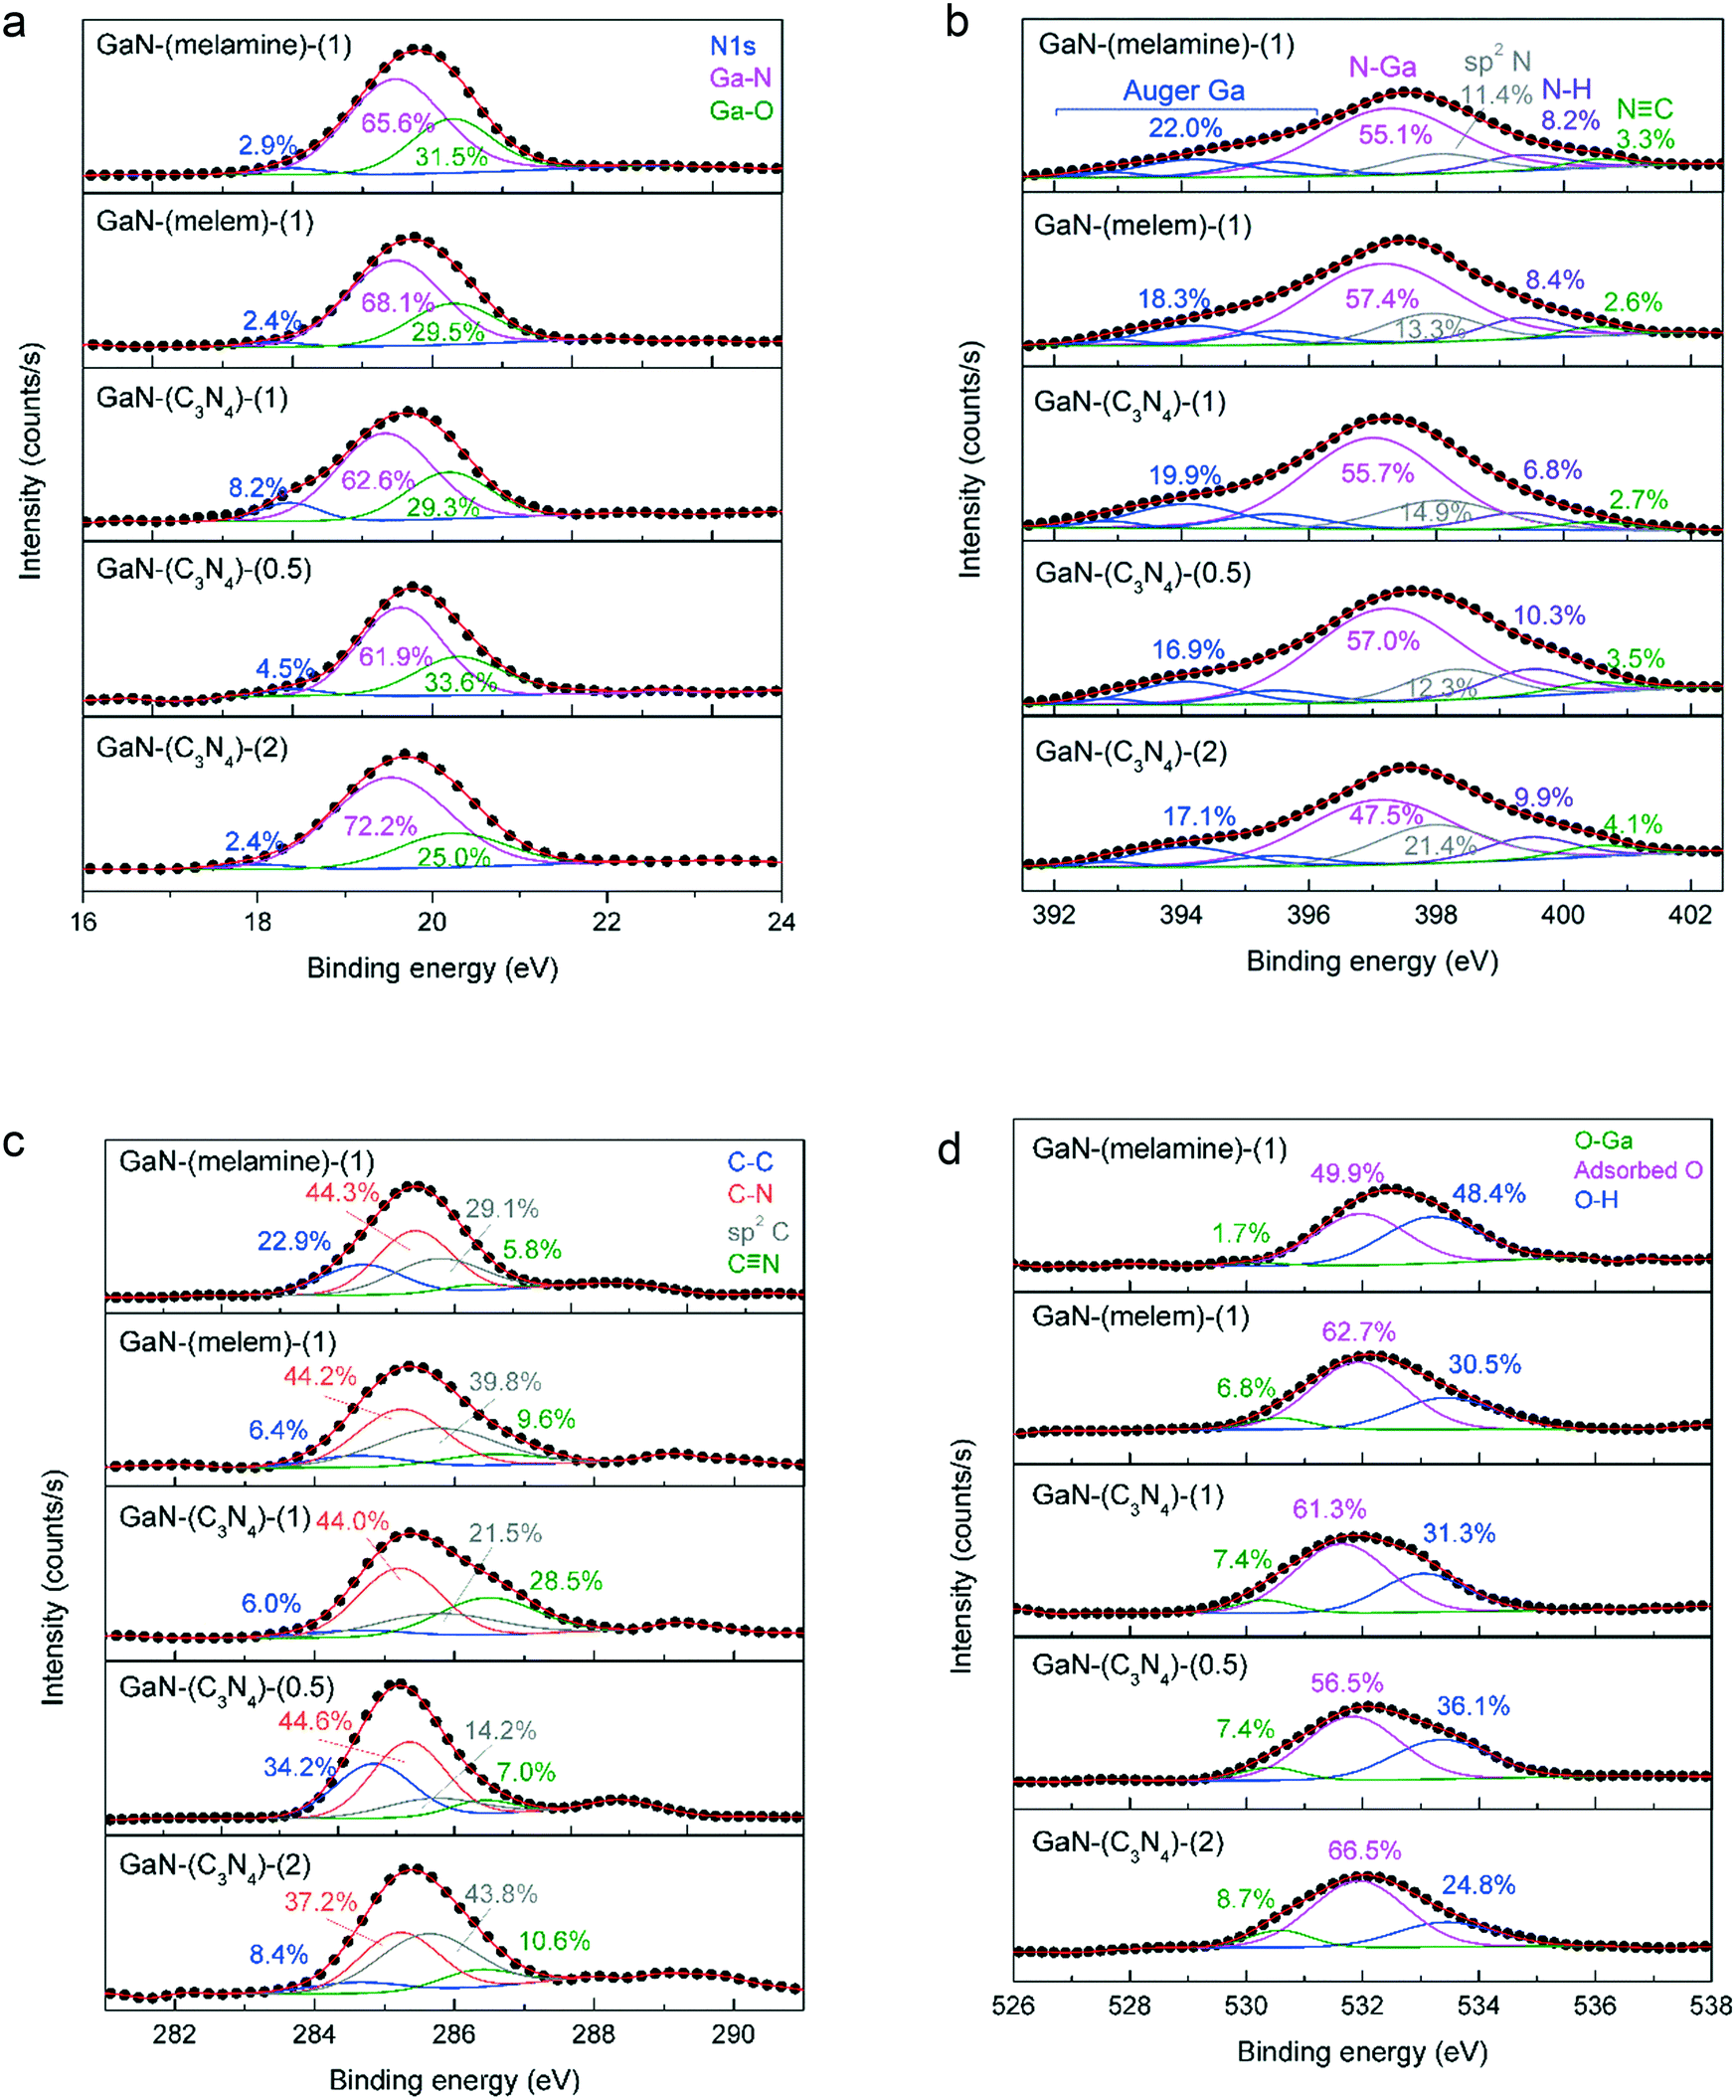 | ||
| Fig. 5 The XPS spectra of (a) Ga 3d, (b) N 1s, (c) C 1s, and (d) O 1s photolines of as-synthesized GaN catalysts. | ||
The N 1s spectrum of c-GaN (Fig. S15b†) was fitted by five responses: Auger Ga (392.9, 394.2, and 395.6 eV), N–Ga (397.4 eV), and N–H (399.5 eV).37 Two additional responses of sp2 N (e.g., C–N![[double bond, length as m-dash]](https://www.rsc.org/images/entities/char_e001.gif) C at 398.1 eV) and CN (400.6 eV) were resolved for the as-synthesized GaN catalysts (Fig. 5b). The sum of the relative compositions of sp2 N and CN in GaN-(C3N4)-(1) (17.6%) was greater than those of GaN-(melamine)-(1) (14.7%) and GaN-(melem)-(1) (15.9%). In addition, by using more g-C3N4 as the precursor, more sp2 N and CN groups were produced: GaN-(C3N4)-(2) (25.5%) > GaN-(C3N4)-(1) (17.6%) > GaN-(C3N4)-(0.5) (15.8%).
C at 398.1 eV) and CN (400.6 eV) were resolved for the as-synthesized GaN catalysts (Fig. 5b). The sum of the relative compositions of sp2 N and CN in GaN-(C3N4)-(1) (17.6%) was greater than those of GaN-(melamine)-(1) (14.7%) and GaN-(melem)-(1) (15.9%). In addition, by using more g-C3N4 as the precursor, more sp2 N and CN groups were produced: GaN-(C3N4)-(2) (25.5%) > GaN-(C3N4)-(1) (17.6%) > GaN-(C3N4)-(0.5) (15.8%).
Fig. 5c displays the C 1s spectra of as-prepared GaN. The C 1s photoline of c-GaN (Fig. S15c†) shows a sharp signal at 284.6 eV (FWHM = ca. 1.8 eV) and a shoulder at 286.3 eV, corresponding to the C–C bond of adventitious carbon and the C–NHx bond.38,39 A broad C 1s signal was found for the as-synthesized GaN catalysts (FWHM > 2.0 eV), and the responses of sp2 C (i.e., C–NC) and CN were used for peak deconvolution. Nevertheless, no clear trend was observed for the relative composition of each C species. The O 1s spectrum (Fig. 5d) of each sample displayed mainly the responses of physisorbed O and hydroxyls40 with a trivial portion of the Ga–O signal.
Fig. 6 shows the FTIR spectra of the as-synthesized GaN catalysts and c-GaN. The bands of C–N and CN stretching modes at 1100–1750 cm−1, CN stretching mode at 2000–2350 cm−1, and –NHx (x = 1 and 2)/–OH vibrations at 2500–3750 cm−1 were identified for all the as-synthesized catalysts. The C–N and CN stretching modes originated from the sp2 N species (e.g., triazine units41,42); the CN stretching, cyanogen-like structure;43 and the –NHx vibrations, primary and secondary amines.44 In contrast, these signals are negligible for c-GaN. The FTIR spectra of post-reaction catalysts were also recorded, as shown in Fig. S16.† The intensities of surface CN species declined significantly for the post-reaction catalysts.
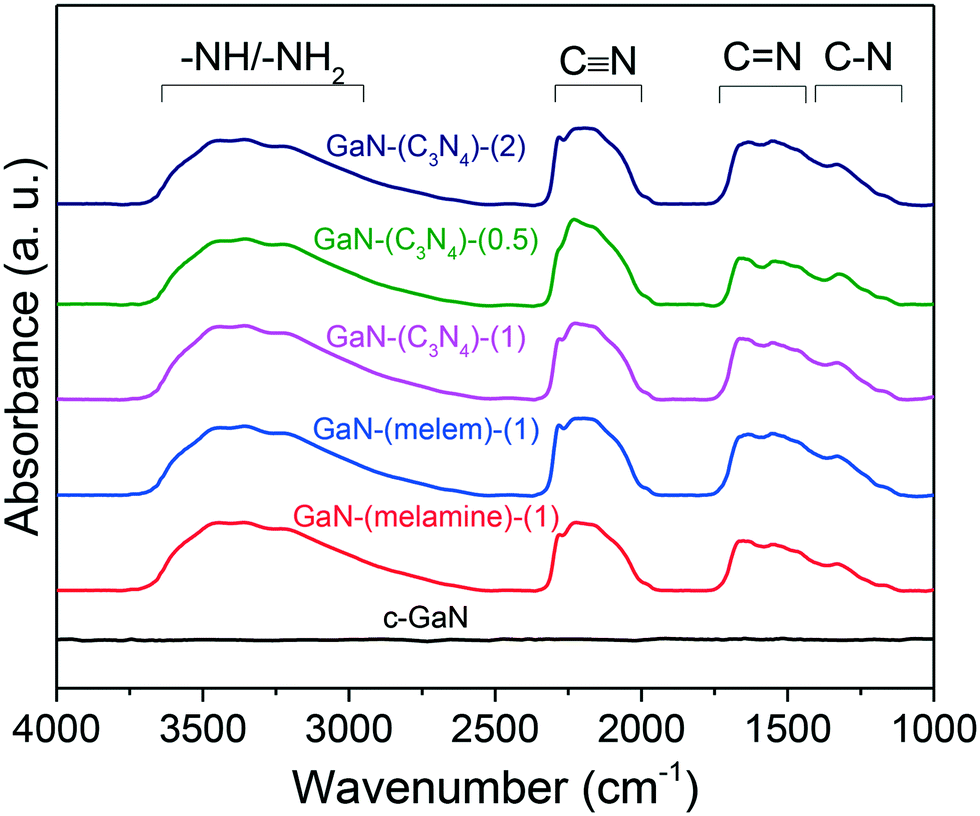 | ||
| Fig. 6 FTIR spectra of as-synthesized GaN and c-GaN. | ||
3.4. In situ IR analysis
To reveal the role of amorphous C and N species in the production of AcCN, in situ IR analysis was conducted. Fig. 7a shows the IR spectra of GaN-(C3N4)-(2) recorded from 30 to 700 °C in a N2 stream (25 mL min−1). With increasing temperature, the amplitude of the –NHx/–OH vibrations decreased gradually and diminished at 700 °C. That is, the –NHx groups were thermally unstable and shall be bystanders in methane conversion. In contrast, the amplitudes of C–N, CN, and CN stretching modes were mainly preserved even at 700 °C.
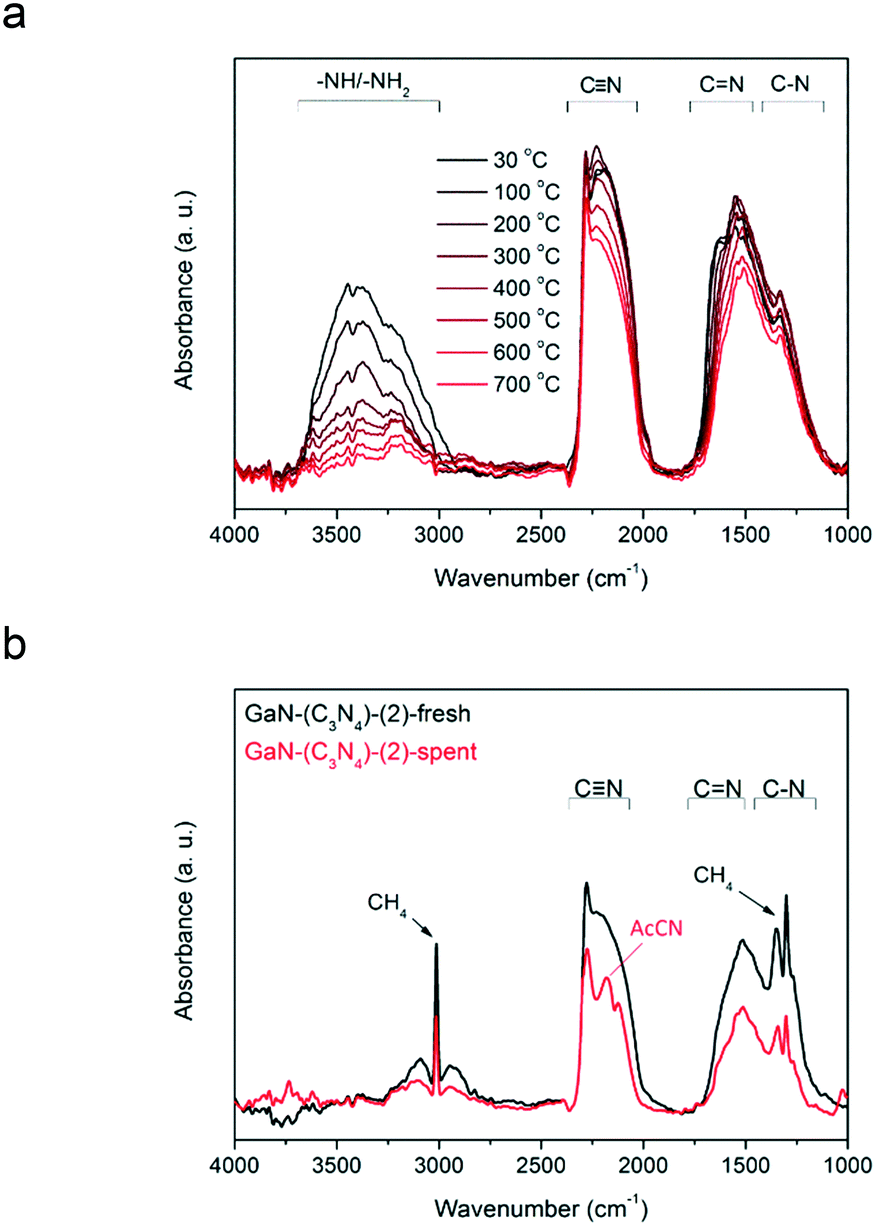 | ||
| Fig. 7 (a) The temperature-resolved IR spectra of GaN-(C3N4)-(2) from 30 to 700 °C in a N2 stream (20 mL min−1). (b) The IR spectra of GaN-(C3N4)-(2) before and after exposure to 50% CH4 in N2 at 700 °C for 6 h. | ||
Fig. 7b shows the in situ IR spectra of GaN-(C3N4)-(2) before and after being used in methane conversion. The amplitudes of the C–N, CN, and CN bands of spent GaN-(C3N4)-(2) decreased compared to those of its fresh form. Moreover, a sharp peak at ∼2260 cm−1 of the spectrum of spent GaN-(C3N4)-(2) was observed.
3.5. Synergy of surface CN species and GaN in methane conversion
N, and CN bands were gradually decreased from 30 to 600 °C (see Fig. S17c†). Accordingly, 600 °C was selected as the temperature for the oxidative abatement of GaN-(C3N4)-(2). The XRD pattern of the oxidation-treated GaN-(C3N4)-(2) (see Fig. S17d†) also shows the diffractions of GaN. These results revealed that amorphous CN species could be removed without deep oxidation of GaN through the oxidative abatement.
Fig. S17e† shows the activity test of GaN-(C3N4)-(2) subjected to the oxidative abatement. Compared to its un-treated counterpart, the conversion and AcCN yield dropped significantly to less than 1%. Fig. S17f† shows the test of Ga2O3-(C3N4)-(2) (coexisting amorphous CN species and Ga2O3). A low methane conversion (<1%) and a small amount of AcCN (1 μmol gcat−1 min−1) were observed.
For both cases, CH4 showed a downward trend, while H2 showed an upward trend with nearly identical compositions. C2H4 and C2H6 were negligible, and C6H6 was gradually increased with increasing temperature. The major difference between these two cases is the trends of HCN and AcCN. Trivial HCN (selectivity <2%) with AcCN slightly increased from 500 °C (selectivity = 0.1%) to 1000 °C (selectivity = 32.8%) was found by using CH4 and N2 as the reactants (Fig. S18a†). In contrast, the selectivity to HCN decreased from 11.1% to 1.2% and considerable AcCN selectivity, particularly at temperatures below 800 °C (selectivity >65%), was found by using CH4 and CN as the feeds (Fig. S18b†). Moreover, limited N2 was converted (N2 conversion was found to be <47%), while CN was fully consumed in the temperature range.
4. Discussion
4.1. Physicochemical properties of GaN-(C3N4)-(X) and their activity in methane conversion
The solid-state-pyrolysis-made GaN by using g-C3N4 as the nitrogen precursor has shown its potential for methane conversion to AcCN compared with those made by using melamine and melem. Since similar bulk and surface compositions, porosities, and the same wurtzite GaN structure were found for the as-synthesized catalysts, the promising activity of GaN-(C3N4)-(2) can be correlated with its unique GaN geometry and enriched amorphous CN species.Based on the XRD and Ga K-edge XAFS analyses, GaN-(C3N4)-(2) had the smallest GaN crystals. Moreover, the high CN value of the 1st Ga–N shell (7.0) with the absence of the 2nd Ga–Ga shell of the RDF profile underlined that highly dispersed GaN crystallites were formed.45 The small GaN crystals have been reported to be more active than the large GaN particles in methane conversion to hydrocarbons.23 Accordingly, a similar hypothesis of the particle size effect of GaN in methane conversion to AcCN was proposed.
The amorphous CN species is also important in enhancing the activity. The results of N XANES and N 1s XPS both revealed that GaN-(C3N4)-(2) had the highest relative composition of amorphous CN species. These species were consumed after the reaction together with the formation of AcCN as observed by the in situ IR study. Moreover, the study of oxidative abatement and the thermodynamic analysis underlined that methane cannot be converted to AcCN without the presence of amorphous CN species.
The study of oxidative abatement of GaN-(C3N4)-(2) and the test of Ga2O3-(C3N4)-(2) indicated that neither GaN nor amorphous CN species can promote the formation of AcCN solely. That is, the interplay of coexisting GaN and amorphous CN species in methane conversion to AcCN was suggested.
4.2. Structure–activity correlation
To emphasize the cooperation of highly dispersed GaN phases and amorphous CN species in improving the AcCN generation, Fig. 8 shows the accumulated AcCN yield in a 6 h reaction time of the as-synthesized catalyst with respect to the GaN crystallite size and the sp3/sp2 N ratio.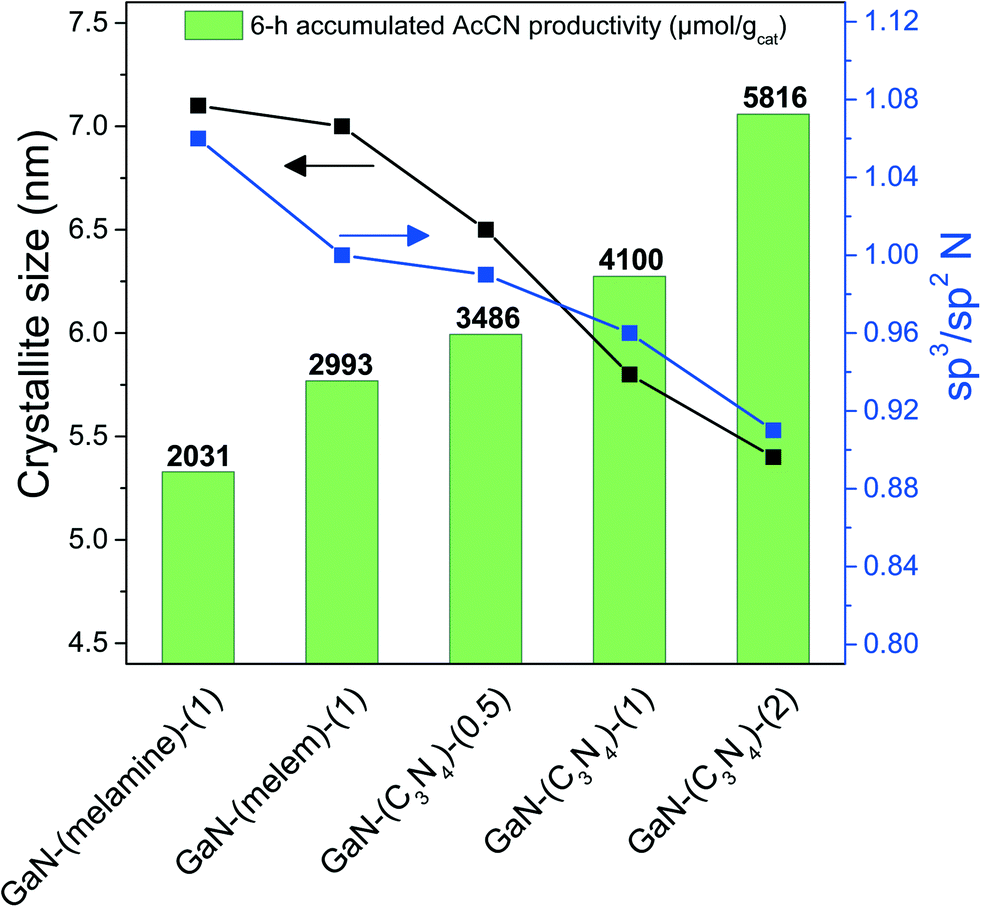 | ||
| Fig. 8 The accumulated AcCN yield with respect to the crystallite size of GaN and the sp3/sp2 N ratio of as-synthesized catalysts. | ||
An opposite trend was found: the accumulated AcCN yield increased, while both the crystallite size and sp3/sp2 N ratio of the as-synthesized GaN catalysts decreased. This highlights that AcCN production can be increased by reducing the GaN crystallite size and by increasing the amounts of amorphous CN species. GaN-(C3N4)-(2) had the smallest crystallite sizes and the most abundant amorphous CN species among the tested catalysts, and therefore generated the highest amounts of accumulated AcCN (5816 μmol gcat−1).
4.3. Mechanism of GaN made by using g-C3N4
The well dispersed GaN phase and amorphous CN species may be related to the effect of six-fold cavities of g-C3N4. The six-fold cavities of g-C3N4 are the most energetically favorable sites for anchoring metal mono-atoms (e.g., Mn, Fe, Co, and Pd) according to DFT computations.46,47 In addition, g-C3N4 supported single metal atoms such as Fe,48 Pd,49 and Pt50 have been successfully fabricated. Accordingly, the mechanism of the well dispersed GaN phase derived from g-C3N4 was proposed, as shown in Fig. 9. The cavities of g-C3N4 were likely to be the docking ports of Ga3+ cations51 before solid-state pyrolysis (step i). The nanohole-coordinated Ga3+ (step ii) allows the suppression of thermal agglomeration in the solid-state pyrolysis, resulting in highly dispersed GaN crystals with a high dispersion (step iii). | ||
| Fig. 9 Proposed mechanism of the nanoholes of g-C3N4 as the docking ports of Ga3+ in GaN synthesis through the solid-state pyrolysis. Red circles mean Ga3+ in the solution; blue circles, N of g-C3N4; orange circles, Ga3+ bonded in the nanoholes. | ||
To support the aforementioned claim, Ga/C3N4 was prepared and analyzed by XRD, as shown in Fig. S19.† Relative to g-C3N4, the (002) peak of Ga/C3N4 was shifted from 27.5° to 27.7° while the (100) peak was unchanged. The (002) peak shift suggests that the Ga cations of Ga/C3N4 mainly existed in the six-fold cavity of heptazine units (step ii of Fig. 9), which merely affects the diffraction of the (002) plane belonging to the accumulated heptazine units.52 Accordingly, we proposed that before GaN was formed, at least below 550 °C, Ga cations were mainly coordinated in the six-fold cavities of g-C3N4.
4.4. Catalyst deactivation and regeneration
The characterization results of the post-reaction catalysts indicated that deactivation was caused by GaN agglomeration, coke deposition, and depletion of amorphous CN species. Advanced catalyst design to allow methane activation under milder conditions shall limit the extent of GaN agglomeration. Coke removal and supplement of surface N content was conducted in the calcination–nitridation treatment. Regretfully, the activity could hardly be regained. A possible explanation is that in the calcination step, deposited coke and remaining CN species were burnt out. That is, amorphous CN species could not be replenished by NH3 nitridation on a carbon-eliminated surface, resulting in an invalid regeneration treatment.Stöhr et al.53 reported that N-doped graphene, containing nitrile and/or pyridinic-like nitrogen species, could be formed through NH3 nitridation over activated carbon. This method was used to directly nitridize the spent catalyst without the calcination treatment. The nitridation–activation process by using NH3 as the N source could partially rejuvenate the activity. As evidenced by the FTIR spectra (Fig. S20†), the vibrational bands of C![[quadruple bond, length as m-dash]](https://www.rsc.org/images/entities/char_e003.gif) N and CN species were intensified after direct NH3 nitridation. This confirmed that the CN species could be replenished, resulting in recovering a certain extent of the initial activity for the regenerated catalyst. The replenished CN species were further consumed after the 2nd on-stream test, since the IR bands of CN and CN species nearly disappeared.
N and CN species were intensified after direct NH3 nitridation. This confirmed that the CN species could be replenished, resulting in recovering a certain extent of the initial activity for the regenerated catalyst. The replenished CN species were further consumed after the 2nd on-stream test, since the IR bands of CN and CN species nearly disappeared.
The XRD patterns (Fig. S21†) of the regenerated GaN-(C3N4)-(2) before and after the 2nd on-stream test showed that GaN diffractions were enhanced. This suggested that GaN was persistent. The persistent GaN was reflected by the consistent productivity of C2, which was formed through C–C coupling catalyzed by GaN.54 The alternating feeding test of CH4–N2–CH4 underlined that N2 cannot be activated for AcCN synthesis under the operating conditions. This result is also in line with the thermodynamic analysis, showing negligible N2 conversion (2.2%) at 700 °C in the methane stream. To sum up, the schematic diagram of methane conversion to AcCN over the solid-state-pyrolysis-made GaN catalyst, and the CN replenishment of the spent catalyst through direct NH3 nitridation is shown in Fig. 10. The regeneration process may be improved by using other nitridation agents, e.g., HCN or cyanogen gas, to replenish amorphous CN species of the post-reaction GaN. However, special reactor design should be implemented to handle highly toxic cyanides.
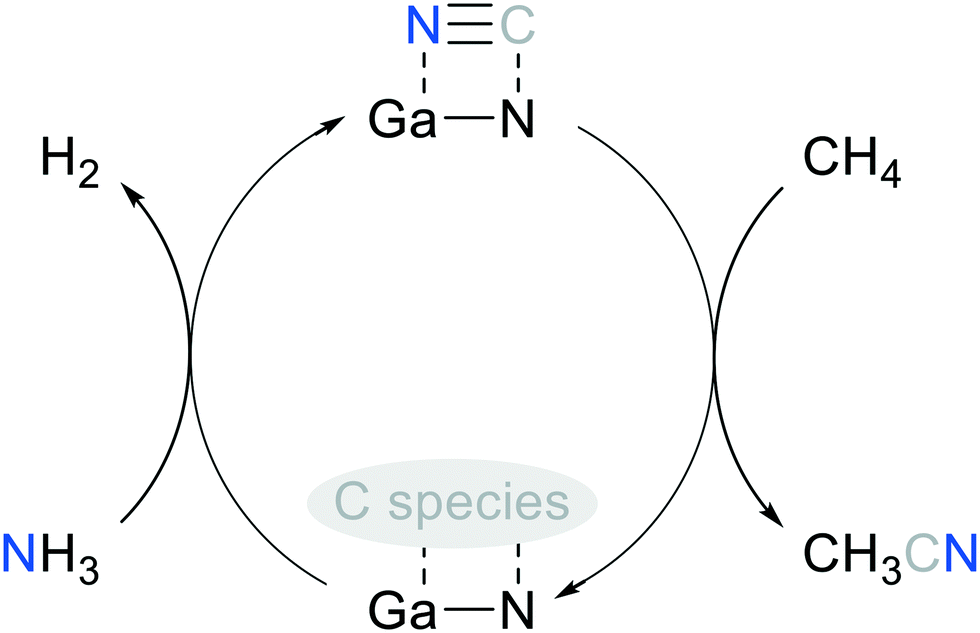 | ||
| Fig. 10 Proposed catalytic cycle of methane conversion to AcCN over the solid-state-pyrolysis-made GaN catalyst. | ||
5. Conclusion
Co-pyrolyzing gallium nitrate hydrate and melamine, melem, or g-C3N4 produced GaN catalysts that can be used for methane conversion to AcCN. g-C3N4 is preferred among the N precursors: well dispersed GaN crystals and enriched amorphous CN species can be generated. These two factors are responsible for enhancing methane conversion and AcCN productivity. The six-fold cavities of g-C3N4 were proposed to be the docking ports of Ga3+, confining Ga3+ cations to circumvent agglomeration during solid-state pyrolysis. The activity of the post-reaction catalyst could be partially regained by using a NH3 nitridation–activation process. This study aims to reveal a novel GaN catalyst design for methane upgrading.Author contributions
Korawich Trangwachirachai: investigation, formal analysis, validation, writing – original draft. Chin-Han Chen: investigation, formal analysis, validation. Ai-Lin Huang: investigation, formal analysis. Jyh-Fu Lee: XAS data analysis, resources. Chi-Liang Chen: XAS data analysis, resources. Yu-Chuan Lin: supervision, project administration, resources.Conflicts of interest
The authors declare that they have no competing financial interests.Acknowledgements
This study was supported by the Ministry of Science and Technology (Projects 109-2628-E-006-011-MY3, 110-2221-E-006-165-MY3, 110-2923-E-006-005-MY3, and 110-2927-I-006-506) and the Higher Education Sprout Project, Ministry of Education to the Headquarters of University Advancement at National Cheng Kung University (NCKU). The authors also appreciate the use of an elemental analyzer (EA000600, MOST 110-2731-M-006-001) belonging to the Core Facility Center of National Cheng Kung University.Notes and references
- E. Dlugokencky and S. Houweling, in Encyclopedia of Atmospheric Sciences, ed. J. R. Holton, Academic Press, Oxford, 2003, pp. 1286–1294, DOI:10.1016/B0-12-227090-8/00223-2.
- J. Johnson, C&EN Global Enterprise, 2016, 94, 16 Search PubMed.
- Y. Li and G. Veser, Energy Technol., 2020, 8, 2000460 CrossRef.
- M. E. Casco, F. Rey, J. L. Jorda, S. Rudic, F. Fauth, M. Martinez-Escandell, F. Rodriguez-Reinoso, E. V. Ramos-Fernandez and J. Silvestre-Albero, Chem. Sci., 2016, 7, 3658–3666 RSC.
- P. Schwach, X. Pan and X. Bao, Chem. Rev., 2017, 117, 8497–8520 CrossRef CAS.
- R. Lin, Y. Ding, L. Gong, W. Dong, J. Wang and T. Zhang, J. Catal., 2010, 272, 65–73 CrossRef CAS.
- K. Ding, H. Metiu and G. D. Stucky, ACS Catal., 2013, 3, 474–477 CrossRef CAS.
- V. Paunović and J. Pérez-Ramírez, Catal. Sci. Technol., 2019, 9, 4515–4530 RSC.
- C. Díaz-Urrutia and T. Ott, Science, 2019, 363, 1326–1329 CrossRef.
- L. Sun, Y. Wang, N. Guan and L. Li, Energy Technol., 2020, 8, 1900826 CrossRef CAS.
- S. Huo, R. Wu, M. Li, H. Chen and W. Zuo, Ind. Eng. Chem. Res., 2020, 59, 22690–22695 CrossRef CAS.
- J. Jang, K. Shen and C. G. Morales-Guio, Joule, 2019, 3, 2589–2593 CrossRef.
- S. Yuan, Y. Li, J. Peng, Y. M. Questell-Santiago, K. Akkiraju, L. Giordano, D. J. Zheng, S. Bagi, Y. Román-Leshkov and Y. Shao-Horn, Adv. Energy Mater., 2020, 10, 2002154 CrossRef CAS.
- T. Yu, Z. Li, L. Lin, S. Chu, Y. Su, W. Song, A. Wang, B. M. Weckhuysen and W. Luo, ACS Catal., 2021, 11, 6684–6691 CrossRef CAS.
- S.-Y. He, T.-H. Li, Z.-Q. Huang, Y. Liu, J. Li and C.-R. Chang, J. Chem. Phys., 2021, 154, 174706 CrossRef CAS.
- P. Pollak, G. Romeder, F. Hagedorn and H.-P. Gelbke, in Ullmann's Encyclopedia of Industrial Chemistry, 2000, DOI:10.1002/14356007.a17_363.
- T. A. Hanna, Coord. Chem. Rev., 2004, 248, 429–440 CrossRef CAS.
- Y. Li and J. N. Armor, J. Catal., 1997, 173, 511–518 CrossRef.
- Y. Li and J. N. Armor, Appl. Catal., A, 1999, 188, 211–217 CrossRef CAS.
- E. Rojas, M. O. Guerrero-Pérez and M. A. Bañares, Catal. Commun., 2009, 10, 1555–1557 CrossRef CAS.
- B. Rhimi, M. Mhamdi, A. Ghorbel, V. N. Kalevaru, A. Martin, M. Perez-Cadenas and A. Guerrero-Ruiz, J. Mol. Catal. A: Chem., 2016, 416, 127–139 CrossRef CAS.
- K. Trangwachirachai, C.-H. Chen and Y.-C. Lin, Mol. Catal., 2021, 516, 111961 CrossRef CAS.
- K. Dutta, V. Chaudhari, C.-J. Li and J. Kopyscinski, Appl. Catal., A, 2020, 595, 117430 CrossRef.
- L. Li, X. Mu, W. Liu, X. Kong, S. Fan, Z. Mi and C.-J. Li, Angew. Chem., Int. Ed., 2014, 53, 14106–14109 CrossRef CAS PubMed.
- T. Xing, Y. Lang, J.-G. Chen, Q.-X. Luo, C. Liu, J. Song, Z.-W. Liu and Z.-T. Liu, Can. J. Chem. Eng., 2019, 97, 3115–3124 CrossRef CAS.
- L. Zhang, Z.-Y. Wang, J. Song, Y. Lang, J.-G. Chen, Q.-X. Luo, Z.-H. He, K. Wang, Z.-W. Liu and Z.-T. Liu, J. CO2 Util., 2020, 38, 306–313 CrossRef CAS.
- K. Sardar, M. Dan, B. Schwenzer and C. N. R. Rao, J. Mater. Chem., 2005, 15, 2175–2177 RSC.
- H. P. T. Nguyen, S. Zhang, K. Cui, X. Han, S. Fathololoumi, M. Couillard, G. A. Botton and Z. Mi, Nano Lett., 2011, 11, 1919–1924 CrossRef CAS.
- C. Sun, M. Yang, T. Wang, Y. Shao, Y. Wu and X. Hao, ACS Appl. Mater. Interfaces, 2017, 9, 26631–26636 CrossRef CAS.
- H. Zheng, Z. Zhao, J. B. Phan, H. Ning, Q. Huang, R. Wang, J. Zhang and W. Chen, ACS Appl. Mater. Interfaces, 2020, 12, 2145–2151 CrossRef CAS.
- B. Ravel and M. Newville, J. Synchrotron Radiat., 2005, 12, 537–541 CrossRef CAS.
- P. V. Chandrasekar, H. Jung, C. G. Kim and D. Kim, CrystEngComm, 2012, 14, 2166–2171 RSC.
- W. R. L. Lambrecht, S. N. Rashkeev, B. Segall, K. Lawniczak-Jablonska, T. Suski, E. M. Gullikson, J. H. Underwood, R. C. C. Perera, J. C. Rife, I. Grzegory, S. Porowski and D. K. Wickenden, Phys. Rev. B: Condens. Matter Mater. Phys., 1997, 55, 2612–2622 CrossRef CAS.
- K. Lawniczak-Jablonska, T. Suski, I. Gorczyca, N. E. Christensen, K. E. Attenkofer, R. C. C. Perera, E. M. Gullikson, J. H. Underwood, D. L. Ederer and Z. Liliental Weber, Phys. Rev. B: Condens. Matter Mater. Phys., 2000, 61, 16623–16632 CrossRef CAS.
- K.-H. Lee, J.-W. Chiou, J.-M. Chen, J.-F. Lee, A. Braud, K. Lorenz, E. Alves and I.-G. Chen, J. Am. Ceram. Soc., 2010, 93, 3531–3534 CrossRef CAS.
- L. Ravi, K. Boopathi, P. Panigrahi and B. Krishnan, Appl. Surf. Sci., 2018, 449, 213–220 CrossRef CAS.
- P. Li, T. Xiong, L. Wang, S. Sun and C. Chen, RSC Adv., 2020, 10, 2096–2103 RSC.
- O. Elbanna, M. Fujitsuka and T. Majima, ACS Appl. Mater. Interfaces, 2017, 9, 34844–34854 CrossRef CAS.
- D. Zhang, X. Han, T. Dong, X. Guo, C. Song and Z. Zhao, J. Catal., 2018, 366, 237–244 CrossRef CAS.
- S. Chen, M. E. A. Warwick and R. Binions, Sol. Energy Mater. Sol. Cells, 2015, 137, 202–209 CrossRef CAS.
- X. Yuan, K. Luo, K. Zhang, J. He, Y. Zhao and D. Yu, J. Phys. Chem. A, 2016, 120, 7427–7433 CrossRef CAS.
- Z. Huang, Y. Zhang, H. Dai, Y. Wang, C. Qin, W. Chen, Y. Zhou and S. Yuan, J. Catal., 2019, 378, 331–340 CrossRef CAS.
- J. Hu, P. Yang and C. M. Lieber, Phys. Rev. B: Condens. Matter Mater. Phys., 1998, 57, R3185–R3188 CrossRef CAS.
- P. Praus, L. Svoboda, M. Ritz, I. Troppová, M. Šihor and K. Kočí, Mater. Chem. Phys., 2017, 193, 438–446 CrossRef CAS.
- K. Feng, H. Zhang, J. Gao, J. Xu, Y. Dong, Z. Kang and J. Zhong, Appl. Phys. Lett., 2020, 116, 191903 CrossRef CAS.
- Z. Chen, J. Zhao, C. R. Cabrera and Z. Chen, Small Methods, 2019, 3, 1800368 CrossRef.
- M. Chen, W. Chang, Y. Shi, W. Liu and C. Li, Phys. Chem. Chem. Phys., 2021, 23, 11472–11478 RSC.
- S. An, G. Zhang, T. Wang, W. Zhang, K. Li, C. Song, J. T. Miller, S. Miao, J. Wang and X. Guo, ACS Nano, 2018, 12, 9441–9450 CrossRef CAS PubMed.
- F. Hu, L. Leng, M. Zhang, W. Chen, Y. Yu, J. Wang, J. H. Horton and Z. Li, ACS Appl. Mater. Interfaces, 2020, 12, 54146–54154 CrossRef CAS.
- G. Gao, Y. Jiao, E. R. Waclawik and A. Du, J. Am. Chem. Soc., 2016, 138, 6292–6297 CrossRef CAS.
- W. Yan, L. Yan and C. Jing, Appl. Catal., B, 2019, 244, 475–485 CrossRef CAS.
- Y. Li, B. Li, D. Zhang, L. Cheng and Q. Xiang, ACS Nano, 2020, 14, 10552–10561 CrossRef CAS.
- B. Stöhr, H. P. Boehm and R. Schlögl, Carbon, 1991, 29, 707–720 CrossRef.
- K. Dutta, M. Shahryari and J. Kopyscinski, Ind. Eng. Chem. Res., 2020, 59, 4245–4256 CrossRef CAS.
Footnote |
| † Electronic supplementary information (ESI) available: XRD patterns of N sources, product productivity, N2 adsorption/desorption isotherm, XANES spectra, XPS photolines, and TPO profiles. See DOI: 10.1039/d1cy01362a |
| This journal is © The Royal Society of Chemistry 2022 |