Defect-rich boron doped carbon nanotubes as an electrocatalyst for hybrid Li–air batteries†
Yuyang
Wang
 a,
Mingfu
Yu
 a,
Tianyu
Zhang
a,
Zhichao
Xue
b,
Ying
Ma
c and
Hong
Sun
*a
a,
Tianyu
Zhang
a,
Zhichao
Xue
b,
Ying
Ma
c and
Hong
Sun
*a
aSchool of Mechanical Engineering, Shenyang Jianzhu University, 110168 Shenyang, China. E-mail: sunhongwxh@sina.com
bSchool of Science, Shenyang Jianzhu University, 110168 Shenyang, China
cSchool of Material Science and Engineering, Shenyang Jianzhu University, 110168 Shenyang, China
First published on 19th November 2021
Abstract
Carbon nanotubes (CNTs) have been used as a cathode material for hybrid Li–air batteries (HLABs); however, their catalytic abilities for the oxygen reduction reaction (ORR) and oxygen evolution reaction (OER) are relatively limited. Herein, to improve their catalytic performance, we have synthesized a boron-doped CNT (BC3NT) with varying boron contents. The Raman spectrum proves that the more defects are due to the higher boron content. And HLABs based on BC3NT show great cyclability and catalytic performance in air, with an overpotential value of 0.3 V for 200 hours at a current density of 0.05 mA cm−2. Furthermore, theoretical calculations with density functional theory (DFT) confirm the effects of topological defects of BC3NT on the ORR and OER. Since boron is doped into the CNT, BC3NT containing a large amount of defect rings is obtained. And the generation of defects was conducive to the battery reaction. Accordingly, as a positive electrode material for HLABs, BC3NT is more conducive to the ORR and OER, and the topological defect ring generated by it improved the ORR and OER performance.
Introduction
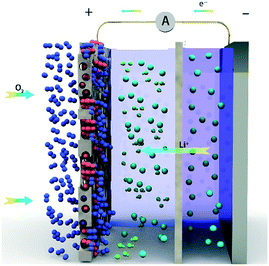
Lithium-ion batteries have brought a significant contribution to our daily lives, but the energy density of Li-ion batteries is close to the theoretical limit. With the development of industrial technology, the demand for energy utilization increases, and therefore it is imperative to develop new energy storage devices with high energy density.1–6 Littauer et al.7 proposed the concept of Li–air batteries (LABs) in 1976. LABs have attracted widespread attention due to their high theoretical energy density, which can reach 11![[thin space (1/6-em)]](https://www.rsc.org/images/entities/char_2009.gif) 140 Wh kg−1, almost 10 times that of lithium-ion batteries.8–12 As the reactant, O2 is taken directly from the environment in this system, entering from the positive electrode.13 It reacts with Li+ in the electrolyte, and the cell reaction is: 2Li + O2 ↔ Li2O2. Although the theoretical energy density of LABs is extremely high, many serious problems still have to be solved:14 for example, lithium dendrites, poor cycling performance, products blocking the porous positive electrode, low actual energy density, low catalytic efficiency, etc.15–18 The problem of lithium dendrite is common to all lithium batteries; the porous cathode with insoluble material blockage is unique to LABs.19 To solve the problem, Zhou et al.20 proposed HLABs based on LISICON in 2010, and their cell reaction is: 4Li + O2 + 2H2O ↔ 4LiOH. The system comprises a lithium anode, organic-electrolyte, LISICON membrane, water-electrolyte, and porous cathode. Li+ can pass through the LISICON membrane preventing the mixing of organic-electrolyte and water-electrolyte.21 Compared with LiTFSI-TEGDME organic-electrolyte, LiOH aqueous solutions used in HLABs have higher diffusion coefficients of Li+ and O2. The product LiOH has high solubility. For every 100 g water, 12.8 g LiOH can be dissolved. LiOH is not easy to plug the porous positive electrode, convenient for continuous discharge.22,23 The electrolytes used in the cathode chamber and anode chamber are LiOH and LITFSI-TEGDME, respectively. The battery is considered a vital candidate to replace Li-ion batteries because of a series of advantages (Scheme 1).
140 Wh kg−1, almost 10 times that of lithium-ion batteries.8–12 As the reactant, O2 is taken directly from the environment in this system, entering from the positive electrode.13 It reacts with Li+ in the electrolyte, and the cell reaction is: 2Li + O2 ↔ Li2O2. Although the theoretical energy density of LABs is extremely high, many serious problems still have to be solved:14 for example, lithium dendrites, poor cycling performance, products blocking the porous positive electrode, low actual energy density, low catalytic efficiency, etc.15–18 The problem of lithium dendrite is common to all lithium batteries; the porous cathode with insoluble material blockage is unique to LABs.19 To solve the problem, Zhou et al.20 proposed HLABs based on LISICON in 2010, and their cell reaction is: 4Li + O2 + 2H2O ↔ 4LiOH. The system comprises a lithium anode, organic-electrolyte, LISICON membrane, water-electrolyte, and porous cathode. Li+ can pass through the LISICON membrane preventing the mixing of organic-electrolyte and water-electrolyte.21 Compared with LiTFSI-TEGDME organic-electrolyte, LiOH aqueous solutions used in HLABs have higher diffusion coefficients of Li+ and O2. The product LiOH has high solubility. For every 100 g water, 12.8 g LiOH can be dissolved. LiOH is not easy to plug the porous positive electrode, convenient for continuous discharge.22,23 The electrolytes used in the cathode chamber and anode chamber are LiOH and LITFSI-TEGDME, respectively. The battery is considered a vital candidate to replace Li-ion batteries because of a series of advantages (Scheme 1).
Porous cathode materials and catalysts play an essential part in LABs. Reasonable porous structure and good catalytic performance are indispensable. CNTs have been extensively used as cathode materials for LABs due to their large specific surface area and porous structure.24–27 Yi et al.28 studied and compared the ORR, OER, and adsorption mechanism of the discharge product of LABs on CNT electrodes. The results show that the distance between the CNT layers should be at least 3.4 Å to avoid an interaction. Moreover, multi-walled carbon nanotubes (MWCNTs) perform better than single-walled carbon nanotubes (SWCNTs) in inhibiting the initial nucleation of lithium oxide and promoting the initial nucleation of Li2O2. A comprehensive analysis of adsorption energy and electronic structure shows that the inner structure of Li2O2 is composed of small clusters in addition to the coverage area. Li et al.29 used the sol–gel method to uniformly coat RuO2 on the surface of CNTs as the positive electrode of the LABs, which showed excellent cycling performance. Lim et al.30 prepared an independent mesh cathode composed of CNT-loaded polymer nanofibers to develop practical LABs with a specific energy of 814 Wh kg−1. Chen et al.31 reported the inhibition of side reactions by preparing a MnO2 composite CNT material as the positive electrode and using salicylic acid as the electrolyte, making the battery cycle up to 300 cycles. Using a metal or metal oxide as the catalyst can improve battery performance. However, it is expensive and difficult to prepare, so it is necessary to find a cathode catalyst material that is cheap and easy to prepare.32–36 Researchers begin to pay attention to nonmetals as catalysts. Boron atoms and carbon atoms are in the same period, their atomic numbers are adjacent, and their radii are similar. It is straightforward to dope them into CNTs, which attracts widespread attention from researchers.37–39 Li et al.40 applied BC3 nanosheets to LABs, and their calculations showed that the BC3 structure helps adsorb oxygen molecules and effectively reduces the overpotential. Boron doping can form BC3 with a one-dimensional nanotube structure in carbon nanotubes.41–43 BC3NTs have the advantages of large specific surface area and good catalytic performance, so they are suitable as cathode materials for LABs.44–46 BC3NTs contain C–C and B–C bonds but have no unstable B–B bonds, so these structures are stable.47–49 Defects are one of the characteristics of BC3NTs, and these defect structures will have a favorable effect on the mass transfer and electrode reaction of LABs.50 Therefore, BC3NTs comply with the requirements of the positive electrode of LABs with mixed electrolytes and are worthy of further study.
In this paper, BC3NTs with different B proportions were prepared as the positive electrode materials of HLABs. According to Raman spectrum analysis, increasing the boron doping ratio would increase the number of defects, conducive to the electrode reaction. Tests show that BC3NTs with defects as a positive electrode can make the HLABs cycle up to 165 cycles and maintain an ultra-low overpotential of 0.3 V in the first 200 hours. DFT was used to further study the effect of topological defect rings of different sizes on the electrode reactions.
Experimental
Synthesis of materials
BC3NTs were fabricated with B2O3 powder (purity 99.9%) and CNTs in an argon glove box. The mass ratio of B2O3 powder (purity 99.9%) and CNTs are 2![[thin space (1/6-em)]](https://www.rsc.org/images/entities/char_2009.gif) :
:![[thin space (1/6-em)]](https://www.rsc.org/images/entities/char_2009.gif) 1, 5
1, 5![[thin space (1/6-em)]](https://www.rsc.org/images/entities/char_2009.gif) :
:![[thin space (1/6-em)]](https://www.rsc.org/images/entities/char_2009.gif) 1, and 8
1, and 8![[thin space (1/6-em)]](https://www.rsc.org/images/entities/char_2009.gif) :
:![[thin space (1/6-em)]](https://www.rsc.org/images/entities/char_2009.gif) 1, respectively. Then, they were placed into a vacuum-sealed quartz tube heating to 1050 °C at a rate of 10 °C min−1, and the products were kept for 10 h at 1050 °C. They were taken out after the resistance furnace was cooled to room temperature as shown in Fig. S1 in the ESI.† The experimental drugs used in this study are shown in Table S1 in the ESI.†
1, respectively. Then, they were placed into a vacuum-sealed quartz tube heating to 1050 °C at a rate of 10 °C min−1, and the products were kept for 10 h at 1050 °C. They were taken out after the resistance furnace was cooled to room temperature as shown in Fig. S1 in the ESI.† The experimental drugs used in this study are shown in Table S1 in the ESI.†
Characterization
A scanning electron microscope (SEM, JEM-7800F.) was used to investigate the morphologies of the samples. The valence states of the samples were analyzed by using X-ray photoelectron spectroscopy (XPS, ESCALAB 250). Raman spectra were collected on a HORIBA XploRA PLUS.Electrochemical characterization
BC3NT and PTFE solutions were stirred to form a uniform mixture with a mass ratio of 9![[thin space (1/6-em)]](https://www.rsc.org/images/entities/char_2009.gif) :
:![[thin space (1/6-em)]](https://www.rsc.org/images/entities/char_2009.gif) 1, and an appropriate amount of N-methyl-2-pyrrolidone (NMP) dispersant was added to the mixture and stirred to form a uniform and thick black paste. The black paste was coated on carbon paper, and a positive plate with a diameter of 16 mm was obtained by slicing after vacuum drying at 80 °C for 8 h. HLABs adopt the shape of the mold designed by the research group, as shown in Fig. S2 in the ESI,† which is composed of a die holder, negative current collector, lithium foil, LISICON film (Li1+X+Y(Al, Y)x(Ti, Ge)2−XSiYP3−YO12), punch set, positive electrode, and positive current collector. The anode chamber electrolyte shall be 1 mol L−1 LITFSI-TGEDME, and the cathode chamber electrolyte shall be 0.1 mol L−1 LiOH. The roundtrip performance measurement shall be carried out at a current density of 0.05 mA cm−2 and a limited capacity of 50 mAh g−1, and the initial discharge capacity measurement shall be carried out at a current density of 0.05 mA cm−2.
1, and an appropriate amount of N-methyl-2-pyrrolidone (NMP) dispersant was added to the mixture and stirred to form a uniform and thick black paste. The black paste was coated on carbon paper, and a positive plate with a diameter of 16 mm was obtained by slicing after vacuum drying at 80 °C for 8 h. HLABs adopt the shape of the mold designed by the research group, as shown in Fig. S2 in the ESI,† which is composed of a die holder, negative current collector, lithium foil, LISICON film (Li1+X+Y(Al, Y)x(Ti, Ge)2−XSiYP3−YO12), punch set, positive electrode, and positive current collector. The anode chamber electrolyte shall be 1 mol L−1 LITFSI-TGEDME, and the cathode chamber electrolyte shall be 0.1 mol L−1 LiOH. The roundtrip performance measurement shall be carried out at a current density of 0.05 mA cm−2 and a limited capacity of 50 mAh g−1, and the initial discharge capacity measurement shall be carried out at a current density of 0.05 mA cm−2.
DFT calculation
Firstly, a CNT model of (8,0) was established, and then some of the C atoms was replaced by B atoms to obtain BC3NT, as shown in Fig. 1(a). There were 128 atoms in total, including 32 B atoms, with C atoms represented in gray and B atoms in purple. A seven-membered ring topology defect (7MR) was created by rotating one of the bonds in the nanotube by 90°, forming two heptagons with common bonds and two pentagons separated by bonds as shown in Fig. 1(b). Similarly, an eight-membered ring topology defect (8MR) was created and is shown in Fig. 1(c). A density functional theory calculation was performed using the Dmol3 module of Materials Studio 2019 software. The nanotube was placed in the crystal cell of 20 Å × 20 Å × 17.08 Å, and the model was established as shown in Fig. S3 in the ESI.† The bond lengths of B–C and C–C were 1.55 Å and 1.41 Å, respectively.The energy convergence of the optimization process is shown in Fig. S4 in the ESI.† The spin was not restricted in the calculation. The PBE functional under the Generalized Gradient Approximation (GGA) was used in the electron exchange-correlation function. The Grimme method was used for dispersion correction to accurately describe the van der Waals forces between the reactants and the substrate. The basis set we used was DNP, double numeric quality basis set with polarization function that is implemented by default in the DMol3 package. The total orbital cutoff was 4.9 Å so that the introduced basis group error is small enough to deal with the relativistic effect of metal atoms using the all-electron relativistic theory. Brillouin region integration was optimized by using a special K point method in Bronkhorst-pack form, and the structure was optimized by using K points of 1 × 1 × 7. The criterion of energy convergence in atomic structure optimization was 1.0 × 10⁻⁵ Ha, and the criterion of Hellmann–Feynman atomic force convergence was that the force of each atom was not more than 0.002 Ha Å−1, and the maximum displacement was 0.005 Å.
Under alkaline conditions, the ORR and OER four-electron reaction path is given in eqn S1–S8 in the ESI.† For each basic ORR and OER step, the Gibbs reaction free energy ΔG was defined as the difference between the final state and the initial state free energies, given by the following expression:
| ΔG = ΔE + ΔZPE − TΔS + ΔGU + ΔGPH | (1) |
| ΔGPH = − kBTln[H+] = PH × kBTln10 | (2) |
The overpotential value is obtained by the difference between the maximum free energy and the equilibrium potential:
| η = max [ΔG]/e − 1.23 | (3) |
| ηtotal = ηORR + ηOER | (4) |
Results and discussion
Characterization of the material
SEM diagrams before and after the material doping are shown in Fig. 2 and clearly show the surface morphology changes of CNTs before and after the boron doping. As can be observed, the surface of CNTs is relatively smooth, and there is no substance adsorbed on it. Therefore, CNTs are not conducive to the adsorption of oxygen molecules and have fewer catalytic active sites, limiting the ORR and OER on its surface. Fig. 2(b)–(d) show the SEM images of the samples with doping ratios of 2![[thin space (1/6-em)]](https://www.rsc.org/images/entities/char_2009.gif) :
:![[thin space (1/6-em)]](https://www.rsc.org/images/entities/char_2009.gif) 1, 5
1, 5![[thin space (1/6-em)]](https://www.rsc.org/images/entities/char_2009.gif) :
:![[thin space (1/6-em)]](https://www.rsc.org/images/entities/char_2009.gif) 1, and 8
1, and 8![[thin space (1/6-em)]](https://www.rsc.org/images/entities/char_2009.gif) :
:![[thin space (1/6-em)]](https://www.rsc.org/images/entities/char_2009.gif) 1, respectively. It can be seen that some substances are attached to their surfaces, which become rough. Fig. 2(e) and (f) show the EDS images when the doping ratios is 8
1, respectively. It can be seen that some substances are attached to their surfaces, which become rough. Fig. 2(e) and (f) show the EDS images when the doping ratios is 8![[thin space (1/6-em)]](https://www.rsc.org/images/entities/char_2009.gif) :
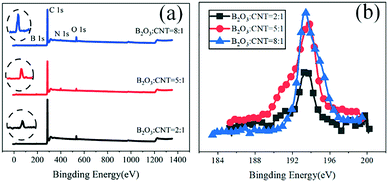
:![[thin space (1/6-em)]](https://www.rsc.org/images/entities/char_2009.gif) 1, and the green color represents the doping element B. The adhesion of these active substances on the surface of carbon nanotubes is very uniform, indicating a good doping effect. To better explore the elementary composition and content of the prepared boron-doped carbon nanotube material, X-ray photoelectron spectroscopy (XPS) was used to test BC3NT within the binding energy range of 0–1350.0 eV to conduct qualitative and semi-quantitative analysis of the material. The full XPS spectrum of BC3NT is shown in Fig. 3(a). The spectrum of B 1s is shown in Fig. 3(b). Table S2 in the ESI† shows the element content measured by XPS. It can be observed that the three doped materials all show characteristic peaks near 193.4 eV, indicating that the boron element has been successfully doped into the carbon nanotube material. With the increase of the doping ratios of B2O3, the peak value becomes larger and larger. The atomic content of B elements is 2.84%, 4.68%, and 5.15%, respectively, and the content of the boron atom doped into the carbon nanotubes increases.
1, and the green color represents the doping element B. The adhesion of these active substances on the surface of carbon nanotubes is very uniform, indicating a good doping effect. To better explore the elementary composition and content of the prepared boron-doped carbon nanotube material, X-ray photoelectron spectroscopy (XPS) was used to test BC3NT within the binding energy range of 0–1350.0 eV to conduct qualitative and semi-quantitative analysis of the material. The full XPS spectrum of BC3NT is shown in Fig. 3(a). The spectrum of B 1s is shown in Fig. 3(b). Table S2 in the ESI† shows the element content measured by XPS. It can be observed that the three doped materials all show characteristic peaks near 193.4 eV, indicating that the boron element has been successfully doped into the carbon nanotube material. With the increase of the doping ratios of B2O3, the peak value becomes larger and larger. The atomic content of B elements is 2.84%, 4.68%, and 5.15%, respectively, and the content of the boron atom doped into the carbon nanotubes increases.
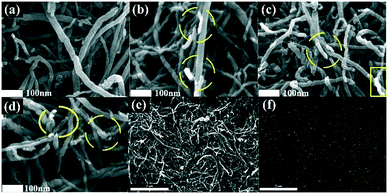 | ||
Fig. 2 SEM diagrams: (a) CNT, (b) mB2O3![[thin space (1/6-em)]](https://www.rsc.org/images/entities/char_2009.gif) : :![[thin space (1/6-em)]](https://www.rsc.org/images/entities/char_2009.gif) mCNT = 2 mCNT = 2![[thin space (1/6-em)]](https://www.rsc.org/images/entities/char_2009.gif) : :![[thin space (1/6-em)]](https://www.rsc.org/images/entities/char_2009.gif) 1, (c) mB2O3 1, (c) mB2O3![[thin space (1/6-em)]](https://www.rsc.org/images/entities/char_2009.gif) : :![[thin space (1/6-em)]](https://www.rsc.org/images/entities/char_2009.gif) mCNT = 5 mCNT = 5![[thin space (1/6-em)]](https://www.rsc.org/images/entities/char_2009.gif) : :![[thin space (1/6-em)]](https://www.rsc.org/images/entities/char_2009.gif) 1, and (d) mB2O3 1, and (d) mB2O3![[thin space (1/6-em)]](https://www.rsc.org/images/entities/char_2009.gif) : :![[thin space (1/6-em)]](https://www.rsc.org/images/entities/char_2009.gif) mCNT = 8 mCNT = 8![[thin space (1/6-em)]](https://www.rsc.org/images/entities/char_2009.gif) : :![[thin space (1/6-em)]](https://www.rsc.org/images/entities/char_2009.gif) 1; ((e) and (f)) EDS images. 1; ((e) and (f)) EDS images. | ||
Fig. 4(a)–(c) represent the B 1s peak fitting diagrams of the samples when B2O3![[thin space (1/6-em)]](https://www.rsc.org/images/entities/char_2009.gif) :
:![[thin space (1/6-em)]](https://www.rsc.org/images/entities/char_2009.gif) CNT = 2
CNT = 2![[thin space (1/6-em)]](https://www.rsc.org/images/entities/char_2009.gif) :
:![[thin space (1/6-em)]](https://www.rsc.org/images/entities/char_2009.gif) 1, B2O3
1, B2O3![[thin space (1/6-em)]](https://www.rsc.org/images/entities/char_2009.gif) :
:![[thin space (1/6-em)]](https://www.rsc.org/images/entities/char_2009.gif) CNT = 5
CNT = 5![[thin space (1/6-em)]](https://www.rsc.org/images/entities/char_2009.gif) :
:![[thin space (1/6-em)]](https://www.rsc.org/images/entities/char_2009.gif) 1, and B2O3
1, and B2O3![[thin space (1/6-em)]](https://www.rsc.org/images/entities/char_2009.gif) :
:![[thin space (1/6-em)]](https://www.rsc.org/images/entities/char_2009.gif) CNT = 8
CNT = 8![[thin space (1/6-em)]](https://www.rsc.org/images/entities/char_2009.gif) :
:![[thin space (1/6-em)]](https://www.rsc.org/images/entities/char_2009.gif) 1. When B2O3
1. When B2O3![[thin space (1/6-em)]](https://www.rsc.org/images/entities/char_2009.gif) :
:![[thin space (1/6-em)]](https://www.rsc.org/images/entities/char_2009.gif) CNT = 2
CNT = 2![[thin space (1/6-em)]](https://www.rsc.org/images/entities/char_2009.gif) :
:![[thin space (1/6-em)]](https://www.rsc.org/images/entities/char_2009.gif) 1, five peaks are fitted, located at 188.5 eV, 190.0 eV, 191.3 eV, 193.0 eV, and 193.7 eV, corresponding to B8C, BC3, BC2O, BCO2, and B2O3. When B2O3
1, five peaks are fitted, located at 188.5 eV, 190.0 eV, 191.3 eV, 193.0 eV, and 193.7 eV, corresponding to B8C, BC3, BC2O, BCO2, and B2O3. When B2O3![[thin space (1/6-em)]](https://www.rsc.org/images/entities/char_2009.gif) :
:![[thin space (1/6-em)]](https://www.rsc.org/images/entities/char_2009.gif) CNT = 5
CNT = 5![[thin space (1/6-em)]](https://www.rsc.org/images/entities/char_2009.gif) :
:![[thin space (1/6-em)]](https://www.rsc.org/images/entities/char_2009.gif) 1, three peaks are fitted, located at 189.8 eV, 191.3 eV, and 193.7 eV, corresponding to BC3, BC2O, and B2O3. When B2O3
1, three peaks are fitted, located at 189.8 eV, 191.3 eV, and 193.7 eV, corresponding to BC3, BC2O, and B2O3. When B2O3![[thin space (1/6-em)]](https://www.rsc.org/images/entities/char_2009.gif) :
:![[thin space (1/6-em)]](https://www.rsc.org/images/entities/char_2009.gif) CNT = 8
CNT = 8![[thin space (1/6-em)]](https://www.rsc.org/images/entities/char_2009.gif) :
:![[thin space (1/6-em)]](https://www.rsc.org/images/entities/char_2009.gif) 1, three peaks are fitted, located at 190.0 eV, 191.3 eV, and 193.7 eV, corresponding to BC3, BC2O, and B2O3, respectively. From the above analysis, it can be seen that there are more impurities generated at 2
1, three peaks are fitted, located at 190.0 eV, 191.3 eV, and 193.7 eV, corresponding to BC3, BC2O, and B2O3, respectively. From the above analysis, it can be seen that there are more impurities generated at 2![[thin space (1/6-em)]](https://www.rsc.org/images/entities/char_2009.gif) :
:![[thin space (1/6-em)]](https://www.rsc.org/images/entities/char_2009.gif) 1, and various carbon oxides are generated, which may be caused by the insufficient quality of B2O3 and the inadequate reaction. When the mass of B2O3 increases, there exist two kinds of carbon oxides in addition to BC3 we need at 5
1, and various carbon oxides are generated, which may be caused by the insufficient quality of B2O3 and the inadequate reaction. When the mass of B2O3 increases, there exist two kinds of carbon oxides in addition to BC3 we need at 5![[thin space (1/6-em)]](https://www.rsc.org/images/entities/char_2009.gif) :
:![[thin space (1/6-em)]](https://www.rsc.org/images/entities/char_2009.gif) 1. When the mass of B2O3 increases (8
1. When the mass of B2O3 increases (8![[thin space (1/6-em)]](https://www.rsc.org/images/entities/char_2009.gif) :
:![[thin space (1/6-em)]](https://www.rsc.org/images/entities/char_2009.gif) 1), there is a certain amount of excess B2O3. Fig. 4(d)–(f) show the Raman spectra of the samples with different doping ratios to analyze the structural changes of boron-doped carbon nanotubes. The mechanism of defect-rich boron doped carbon nanotubes is that boron doping into CNTs will lead to the graphite's broken hexagonal symmetry, thus inducing an increased D band in the Raman spectrum. As can be seen, the D peak and G peak are obvious at 1360 cm−1 and 1600 cm−1 under different doping ratios. The D peak represents the disordered graphite lattice, and the G peak represents the ordered crystalline graphite carbon. The number of defects of the electrode materials can be evaluated by the numerical ratio (ID/IG) between the D peak and G peak. The calculation results show that the ID/IG value increases gradually with the increase in content of boron doped into the carbon nanotubes, indicating that the number of surface defects on the carbon nanotubes increases gradually with the increase of boron content.
1), there is a certain amount of excess B2O3. Fig. 4(d)–(f) show the Raman spectra of the samples with different doping ratios to analyze the structural changes of boron-doped carbon nanotubes. The mechanism of defect-rich boron doped carbon nanotubes is that boron doping into CNTs will lead to the graphite's broken hexagonal symmetry, thus inducing an increased D band in the Raman spectrum. As can be seen, the D peak and G peak are obvious at 1360 cm−1 and 1600 cm−1 under different doping ratios. The D peak represents the disordered graphite lattice, and the G peak represents the ordered crystalline graphite carbon. The number of defects of the electrode materials can be evaluated by the numerical ratio (ID/IG) between the D peak and G peak. The calculation results show that the ID/IG value increases gradually with the increase in content of boron doped into the carbon nanotubes, indicating that the number of surface defects on the carbon nanotubes increases gradually with the increase of boron content.
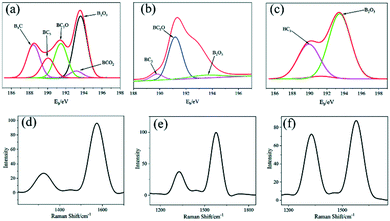 | ||
Fig. 4 B 1s XPS: (a) mB2O3![[thin space (1/6-em)]](https://www.rsc.org/images/entities/char_2009.gif) : :![[thin space (1/6-em)]](https://www.rsc.org/images/entities/char_2009.gif) mCNT = 2 mCNT = 2![[thin space (1/6-em)]](https://www.rsc.org/images/entities/char_2009.gif) : :![[thin space (1/6-em)]](https://www.rsc.org/images/entities/char_2009.gif) 1, (b) mB2O3 1, (b) mB2O3![[thin space (1/6-em)]](https://www.rsc.org/images/entities/char_2009.gif) : :![[thin space (1/6-em)]](https://www.rsc.org/images/entities/char_2009.gif) mCNT = 5 mCNT = 5![[thin space (1/6-em)]](https://www.rsc.org/images/entities/char_2009.gif) : :![[thin space (1/6-em)]](https://www.rsc.org/images/entities/char_2009.gif) 1, and (c) mB2O3 1, and (c) mB2O3![[thin space (1/6-em)]](https://www.rsc.org/images/entities/char_2009.gif) : :![[thin space (1/6-em)]](https://www.rsc.org/images/entities/char_2009.gif) mCNT = 8 mCNT = 8![[thin space (1/6-em)]](https://www.rsc.org/images/entities/char_2009.gif) : :![[thin space (1/6-em)]](https://www.rsc.org/images/entities/char_2009.gif) 1. Raman spectra: (d) mB2O3 1. Raman spectra: (d) mB2O3![[thin space (1/6-em)]](https://www.rsc.org/images/entities/char_2009.gif) : :![[thin space (1/6-em)]](https://www.rsc.org/images/entities/char_2009.gif) mCNT = 2 mCNT = 2![[thin space (1/6-em)]](https://www.rsc.org/images/entities/char_2009.gif) : :![[thin space (1/6-em)]](https://www.rsc.org/images/entities/char_2009.gif) 1, (e) mB2O3 1, (e) mB2O3![[thin space (1/6-em)]](https://www.rsc.org/images/entities/char_2009.gif) : :![[thin space (1/6-em)]](https://www.rsc.org/images/entities/char_2009.gif) mCNT = 5 mCNT = 5![[thin space (1/6-em)]](https://www.rsc.org/images/entities/char_2009.gif) : :![[thin space (1/6-em)]](https://www.rsc.org/images/entities/char_2009.gif) 1, and (f) mB2O3 1, and (f) mB2O3![[thin space (1/6-em)]](https://www.rsc.org/images/entities/char_2009.gif) : :![[thin space (1/6-em)]](https://www.rsc.org/images/entities/char_2009.gif) mCNT = 8 mCNT = 8![[thin space (1/6-em)]](https://www.rsc.org/images/entities/char_2009.gif) : :![[thin space (1/6-em)]](https://www.rsc.org/images/entities/char_2009.gif) 1. 1. | ||
Electrochemical performance of the HLABs
The roundtrip performance was measured with a limited capacity of 50 mAh g−1, as shown in Fig. 5. 52 cycles were performed for CNTs as a positive electrode, and 75 cycles were performed for the B-doped CNT at B2O3![[thin space (1/6-em)]](https://www.rsc.org/images/entities/char_2009.gif) :
:![[thin space (1/6-em)]](https://www.rsc.org/images/entities/char_2009.gif) CNT = 2
CNT = 2![[thin space (1/6-em)]](https://www.rsc.org/images/entities/char_2009.gif) :
:![[thin space (1/6-em)]](https://www.rsc.org/images/entities/char_2009.gif) 1. As the mass ratio of B2O3 and CNT is 5
1. As the mass ratio of B2O3 and CNT is 5![[thin space (1/6-em)]](https://www.rsc.org/images/entities/char_2009.gif) :
:![[thin space (1/6-em)]](https://www.rsc.org/images/entities/char_2009.gif) 1, the battery with BC3NT cycles 140 times. As the mass ratio of B2O3 and CNT is 8
1, the battery with BC3NT cycles 140 times. As the mass ratio of B2O3 and CNT is 8![[thin space (1/6-em)]](https://www.rsc.org/images/entities/char_2009.gif) :
:![[thin space (1/6-em)]](https://www.rsc.org/images/entities/char_2009.gif) 1, the battery with BC3NT cycles 165 times. It can be seen that the number of cycles increases after using the B-doped CNT as a positive material, and the larger the doping ratio, the greater the number of cycles. The number of cycles reached the maximum when the doping ratio was 8
1, the battery with BC3NT cycles 165 times. It can be seen that the number of cycles increases after using the B-doped CNT as a positive material, and the larger the doping ratio, the greater the number of cycles. The number of cycles reached the maximum when the doping ratio was 8![[thin space (1/6-em)]](https://www.rsc.org/images/entities/char_2009.gif) :
:![[thin space (1/6-em)]](https://www.rsc.org/images/entities/char_2009.gif) 1, indicating that the higher the doping ratio of B, the higher the catalytic activity of the material. When pure CNT is used as the positive electrode, the initial overpotential can only maintain 20 cycles. Then, the battery appears to decay due to the poor reversibility. When the doping ratio is 2
1, indicating that the higher the doping ratio of B, the higher the catalytic activity of the material. When pure CNT is used as the positive electrode, the initial overpotential can only maintain 20 cycles. Then, the battery appears to decay due to the poor reversibility. When the doping ratio is 2![[thin space (1/6-em)]](https://www.rsc.org/images/entities/char_2009.gif) :
:![[thin space (1/6-em)]](https://www.rsc.org/images/entities/char_2009.gif) 1, an overpotential of 0.5 V can be maintained for 100 hours; when the doping ratio is 5
1, an overpotential of 0.5 V can be maintained for 100 hours; when the doping ratio is 5![[thin space (1/6-em)]](https://www.rsc.org/images/entities/char_2009.gif) :
:![[thin space (1/6-em)]](https://www.rsc.org/images/entities/char_2009.gif) 1, an overpotential of 1 V can be maintained for 260 hours; when the doping ratio is 8
1, an overpotential of 1 V can be maintained for 260 hours; when the doping ratio is 8![[thin space (1/6-em)]](https://www.rsc.org/images/entities/char_2009.gif) :
:![[thin space (1/6-em)]](https://www.rsc.org/images/entities/char_2009.gif) 1, an ultra-small overpotential of 0.3 V can be maintained for 200 hours. The battery shows excellent reversibility. Therefore, when the doping ratio is 8
1, an ultra-small overpotential of 0.3 V can be maintained for 200 hours. The battery shows excellent reversibility. Therefore, when the doping ratio is 8![[thin space (1/6-em)]](https://www.rsc.org/images/entities/char_2009.gif) :
:![[thin space (1/6-em)]](https://www.rsc.org/images/entities/char_2009.gif) 1, the cycle times of the battery can be improved, reversibility can be improved, the overpotential can be reduced, and the battery runs more smoothly.
1, the cycle times of the battery can be improved, reversibility can be improved, the overpotential can be reduced, and the battery runs more smoothly.
In order to further explore the cause of battery failure, the battery was disassembled and it is found that white substances cover the negative lithium electrode. The white substances pierced LISICON film, resulting in film breakage, and the battery stopped discharging, as shown in Fig. S5 in the ESI.† To further explore the reasons for the breakage of the LISICON film, the products on the surface of the negative lithium film were characterized. Fig. S6 in the ESI† shows the SEM results. As can be seen, a large number of lithium dendrites are generated on its surface, and a large number of lithium dendrites grow through the LISICON film, making the battery fail. The surface of some lithium dendrites is covered with a layer of other substances, and XPS is carried out to study the elemental composition. The full XPS diagram is shown in Fig. S7(a) in the ESI.† The material covering the surface of lithium dendrite contains a large number of O elements and a small amount of Li and C elements. Peak fitting was performed for the O 1s and Li 1s spectra, and the results were obtained as shown in Fig. S7(b) and (c).† It contains LiOH, Li2CO3, and Li2O2. In conclusion, lithium dendrites grew from the negative electrode and pierced the LAGP film, resulting in the leakage of electrolyte LiOH into the positive electrode chamber, and a small amount of Li2CO3 was generated by a reaction with CO2.
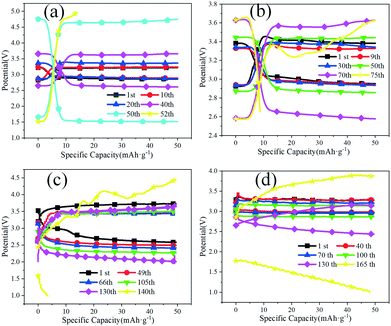
Fig. 6 shows the results of initial discharge capacity with the CNT; the mass proportions of B2O3 and CNT are 2![[thin space (1/6-em)]](https://www.rsc.org/images/entities/char_2009.gif) :
:![[thin space (1/6-em)]](https://www.rsc.org/images/entities/char_2009.gif) 1, 5
1, 5![[thin space (1/6-em)]](https://www.rsc.org/images/entities/char_2009.gif) :
:![[thin space (1/6-em)]](https://www.rsc.org/images/entities/char_2009.gif) 1, and 8
1, and 8![[thin space (1/6-em)]](https://www.rsc.org/images/entities/char_2009.gif) :
:![[thin space (1/6-em)]](https://www.rsc.org/images/entities/char_2009.gif) 1 as positive electrodes, respectively, at a current density of 0.05 mA cm−2 and an electrolyte concentration of 0.1 mol L−1. The maximum specific capacities are 5000 mAh g−1, 5650 mAh g−1, 7200 mAh g−1 and 8900 mAh g−1. BC3NT can increase the specific capacity, and with the increase of the doping ratio, the specific capacity also increases because the decomposition rate of LiOH precipitation increases after doping B into the CNT. From the point of view of the discharge voltage platform, when the CNT is used as the positive electrode, the discharge voltage platform is relatively low, which is 2.4 V; when the B-doped CNT is used as the positive electrode, the discharge voltage platform is about 3 V. The reason for the increase in initial discharge capacity is that with the increase of the doping ratio, the material has more and more defects. Compared with common CNTs, the defect position can be used as the active site of the reaction to significantly improve the electrochemical reaction efficiency, which positively affects the battery discharge. The fundamental parameters we obtained through electrochemical measurements, such as the number of cycles, initial discharge capacity, and overpotentials, have significant advantages compared with previous results (Table S3 in the ESI†).
1 as positive electrodes, respectively, at a current density of 0.05 mA cm−2 and an electrolyte concentration of 0.1 mol L−1. The maximum specific capacities are 5000 mAh g−1, 5650 mAh g−1, 7200 mAh g−1 and 8900 mAh g−1. BC3NT can increase the specific capacity, and with the increase of the doping ratio, the specific capacity also increases because the decomposition rate of LiOH precipitation increases after doping B into the CNT. From the point of view of the discharge voltage platform, when the CNT is used as the positive electrode, the discharge voltage platform is relatively low, which is 2.4 V; when the B-doped CNT is used as the positive electrode, the discharge voltage platform is about 3 V. The reason for the increase in initial discharge capacity is that with the increase of the doping ratio, the material has more and more defects. Compared with common CNTs, the defect position can be used as the active site of the reaction to significantly improve the electrochemical reaction efficiency, which positively affects the battery discharge. The fundamental parameters we obtained through electrochemical measurements, such as the number of cycles, initial discharge capacity, and overpotentials, have significant advantages compared with previous results (Table S3 in the ESI†).
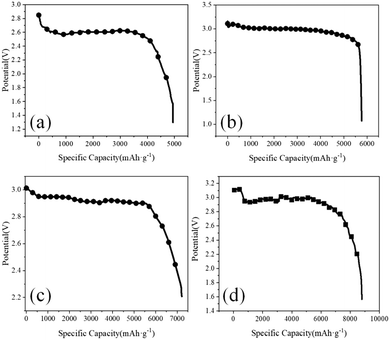 | ||
Fig. 6 Diagram of the discharge capacity: (a) CNT, (b) B2O3![[thin space (1/6-em)]](https://www.rsc.org/images/entities/char_2009.gif) : :![[thin space (1/6-em)]](https://www.rsc.org/images/entities/char_2009.gif) CNT = 2 CNT = 2![[thin space (1/6-em)]](https://www.rsc.org/images/entities/char_2009.gif) : :![[thin space (1/6-em)]](https://www.rsc.org/images/entities/char_2009.gif) 1, (c) B2O3 1, (c) B2O3![[thin space (1/6-em)]](https://www.rsc.org/images/entities/char_2009.gif) : :![[thin space (1/6-em)]](https://www.rsc.org/images/entities/char_2009.gif) CNT = 5 CNT = 5![[thin space (1/6-em)]](https://www.rsc.org/images/entities/char_2009.gif) : :![[thin space (1/6-em)]](https://www.rsc.org/images/entities/char_2009.gif) 1, and (d) B2O3 1, and (d) B2O3![[thin space (1/6-em)]](https://www.rsc.org/images/entities/char_2009.gif) : :![[thin space (1/6-em)]](https://www.rsc.org/images/entities/char_2009.gif) CNT = 8 CNT = 8![[thin space (1/6-em)]](https://www.rsc.org/images/entities/char_2009.gif) : :![[thin space (1/6-em)]](https://www.rsc.org/images/entities/char_2009.gif) 1. 1. | ||
DFT calculation
For HLABs, the key to the battery reaction under alkaline conditions is the adsorption of O2 molecules. At the same time, a perfect CNT is not conducive to O2 adsorption, so this paper does not calculate its free energy. Fig. 7 shows the calculated state density of O2 molecules at the adsorption site and the 2p orbital of the B atom and the established four-electron reaction path through *O2, *OOH, *O, and *OH. The O2 molecule is adsorbed on the B atom. For perfect BC3NT and 7MR, the O2 molecule is completely adsorbed on the B atom, while for 8MR, the O2 molecule is desorbed, which is more conducive to subsequent reactions. It can be seen from Fig. 7(d) that in the perfect BC3NT, fewer parts correspond to the density peaks of the B atom and O2 molecular state, and the coincidence area is small, indicating that it produces relatively weak hybridization. As shown in Fig. 7(e) and (f), the degree of hybridization becomes stronger and stronger with the increase of the defect ring. The B atom in 8MR corresponds well to the state density peak of the adsorbed O2 molecule, and the coincidence area is large, indicating that it has the strongest hybridization.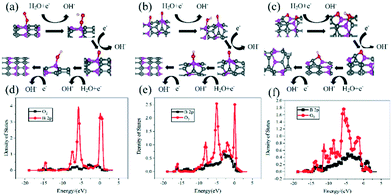 | ||
| Fig. 7 Reaction path after optimization: (a) BC3NT, (b) 7MR, and (c) 8MR. B atom and O2 molecular state density: (d) BC3NT, (e) 7MR, and (f) 8MR. | ||
Fig. 8(a)–(f) show the free energy of the ORR and OER processes. Fig. 8(g) and (h) show, respectively, the calculated ORR overpotential and the OER overpotential. An important parameter for evaluating catalytic activity is the limiting reaction barrier, which is determined by the free energy of the rate-determining step (RDS). For the ORR process, when BC3NT acts as a catalyst, the RDS of the ORR is the reduction of *OOH to *O, and its overpotential is 0.33 V. When 7MR is used as a catalyst, the RDS of the ORR is the reduction of *O to *OH, and its overpotential is 0.15 V. When 8MR is used as a catalyst, the O2 molecule is dissociated and adsorbed, and its RDS is the reduction of *O2 to *OOH. This two-site mechanism has an overpotential of 0.17 V. *OH desorption is relatively easy for the three cathode materials, which is convenient for the adsorption of the next O2 molecule, thereby continuing the reaction. When the BC3NT catalyst is used for the OER process, the RDS of the OER is the oxidation of *OOH to *O2. The overpotential value of the battery is 0.6 V. When 7MR is used as a catalyst, its RDS is the oxidation of *O to *OOH, and the overpotential is 0.2 V. When 8MR is used as a catalyst, the RDS of the OER is the oxidation of OH− to *OOH, and the overpotential of the OER is 0.17 V.
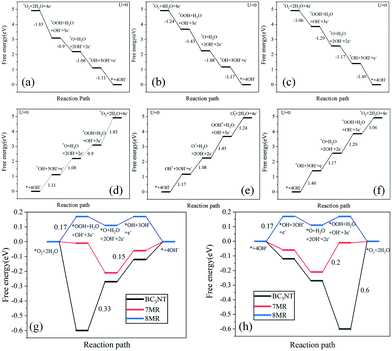 | ||
| Fig. 8 Free energy of the ORR: (a) BC3NT, (b) 7MR, and (c) 8MR. OER free energy: (d) BC3NT, (e) 7MR, and (f) 8MR. (g) Overpotential of the ORR. (h) Overpotential of the OER. | ||
When BC3NT is used as the positive electrode, the free energy value of the intermediate is the most negative, indicating that the chemisorption is relatively strong and the activation energy barrier of the following reaction is relatively high. When BC3NT, 7MR, and 8MR are used as the positive electrodes, the total overpotential is 0.93 V, 0.35 V, and 0.34 V, respectively. The ORR overpotential and OER overpotential are both increasing. The generation of defects will reduce the overpotential of the battery. The larger the topological defect ring, the smaller the overpotential. The calculated minimum overpotential of 0.34 V is close to the experimental value of 0.30 V, indicating that the calculated results are reliable.
Conclusions
In summary, CNTs doped with different proportions of B were prepared by a high-temperature doping method and were used as a cathode for hybrid Li–air batteries, taking advantage of its catalytic performance. The results of roundtrip performance show that the higher the boron doping ratio is, the more cycles the battery cycle is, and the battery can keep the ultra-low overpotential operation for 200 hours in air. The discharge capacity shows that the larger the B doping ratio is, the larger the battery initial discharge capacity is. In addition, DFT calculation results show that the larger the topological defect ring, the stronger the ability of adsorption towards O2 molecules and the B atom hybridization. The overpotential of BC3NT with 7-membered ring and 8-membered ring topological defects is lower than that of pure BC3NT. The larger the topological defect ring, the smaller the overpotential.Author contributions
The manuscript was written through the contributions of all authors. All authors have given approval to the final version of the manuscript. Yuyang Wang, Mingfu Yu and Hong Sun contributed equally to the publication. Zhichao Xue and Ying Ma contributed to the writing of data analysis and interpretation. With the help of Ying Ma, Yuyang Wang synthesised and characterised the materials and performed electrocatalytic tests. With the help of Tianyu Zhang, Yuyang Wang performed the DFT calculations. The research was carried out in close collaboration between the research groups.Conflicts of interest
The authors declare that they have no known competing financial interests or personal relationships that could have appeared to influence the work reported in this paper.Acknowledgements
The authors acknowledge financial support from the National Natural Science Foundation of China (51776131), the Liaoning Revitalization Talents Program (XLYC1802045), and Liaoning province Department of Education fund item (lnqn202007).Notes and references
- J. M. Cameron, C. Holc, A. J. Kibler, C. L. Peake, D. A. Walsh, G. N. Newton and L. R. Johnson, Chem. Soc. Rev., 2021, 50, 5863–5883 RSC.
- J.-H. Kang, J. Lee, J.-W. Jung, J. Park, T. Jang, H.-S. Kim, J.-S. Nam, H. Lim, K. R. Yoon, W.-H. Ryu, I.-D. Kim and H. R. Byon, ACS Nano, 2020, 14, 14549–14578 CrossRef PubMed.
- T. Liu, X.-Y. Yang and X.-B. Zhang, Adv. Mater. Technol., 2020, 5, 2000476 CrossRef CAS.
- L. Ye, Y. Hong, M. Liao, B. Wang, D. Wei, H. Peng, L. Ye, Y. Hong, M. Liao, B. Wang, D. Wei and H. Peng, Energy Storage Mater., 2020, 28, 364–374 CrossRef.
- J. Lai, Y. Xing, N. Chen, L. Li, F. Wu and R. Chen, Angew. Chem., Int. Ed., 2020, 59, 2974–2997 CrossRef CAS.
- Y. Zhou, C.-H. Wang, W. Lu and L. Dai, Adv. Mater., 2020, 32, 1902779 CrossRef CAS PubMed.
- E. L. Littauer and K. C. Tsai, J. Electrochem. Soc., 1976, 123, 771–776 CrossRef CAS.
- Y. Xing, N. Chen, M. Luo, Y. Sun, Y. Yang, J. Qian, L. Li, S. Guo, R. Chen and F. Wu, Energy Storage Mater., 2020, 24, 707–713 CrossRef.
- M. Asadi, B. Sayahpour, P. Abbasi, A. T. Ngo, K. Karis, J. R. Jokisaari, C. Liu, B. Narayanan, M. Gerard, P. Yasaei, X. Hu, A. Mukherjee, K. C. Lau, R. S. Assary, F. Khalili-Araghi, R. F. Klie, L. A. Curtiss and A. Salehi-Khojin, Nature, 2018, 555, 502–506 CrossRef CAS PubMed.
- C.-S. Yang, K.-N. Gao, X.-P. Zhang, Z. Sun and T. Zhang, Rare Met., 2018, 37, 459–472 CrossRef CAS.
- Q. Liu, Z. Chang, Z. Li and X. Zhang, Small Methods, 2018, 2, 1700231 CrossRef.
- Y. Jiang, J. Cheng, L. Zou, X. Li, Y. Huang, L. Jia, B. Chi, J. Pu and J. Li, ChemCatChem, 2017, 9, 4231–4237 CrossRef CAS.
- Q. Lv, Z. Zhu, S. Zhao, L. Wang, Q. Zhao, F. Li, L. A. Archer and J. Chen, J. Am. Chem. Soc., 2021, 143, 1941–1947 CrossRef CAS PubMed.
- K. Chen, D.-Y. Yang, G. Huang and X.-B. Zhang, Acc. Chem. Res., 2021, 54, 632–641 CrossRef CAS.
- L. Li, Z. Chang and X.-B. Zhang, Adv. Sustainable Syst., 2017, 1, 1700036 CrossRef.
- P. Tan, B. Chen, H. Xu, H. Zhang, W. Cai, M. Ni, M. Liu and Z. Shao, Energy Environ. Sci., 2017, 10, 2056–2080 RSC.
- D. Aurbach, B. D. McCloskey, L. F. Nazar and P. G. Bruce, Nat. Energy, 2016, 1, 16128 CrossRef CAS.
- J. B. Goodenough and Y. Kim, J. Power Sources, 2011, 196, 6688–6694 CrossRef CAS.
- X. Zhu, Y. Yan, W. Wan, Y. Wang, Y. Wu, X. He and Z. Lu, Mater. Lett., 2018, 215, 71–74 CrossRef CAS.
- P. He, Y. Wang and H. Zhou, Electrochem. Commun., 2010, 12, 1686–1689 CrossRef CAS.
- M. M. Thackeray, M. K. Y. Chan, L. Trahey, S. Kirklin and C. Wolverton, J. Phys. Chem. Lett., 2013, 4, 3607–3611 CrossRef CAS.
- N. Ahmad, L. Zhou, M. Faheem, M. K. Tufail, L. Yang, R. Chen, Y. Zhou and W. Yang, ACS Appl. Mater. Interfaces, 2020, 12, 21548–21558 CrossRef CAS.
- F. Bai, K. Kakimoto, X. Shang, D. Mori, S. Taminato, M. Matsumoto, Y. Takeda, O. Yamamoto, H. Izumi, H. Minami and N. Imanishi, Front. Energy Res., 2020, 8, 187 CrossRef.
- X. Liu, C. Culhane, W. Li and S. Zou, ACS Omega, 2020, 5, 24367–24378 CrossRef CAS PubMed.
- K.-X. Wang, Q.-C. Zhu and J.-S. Chen, Small, 2018, 14, 1800078 CrossRef.
- Z. Chang, J. Xu and X. Zhang, Adv. Energy Mater., 2017, 7, 1700875 CrossRef.
- A. Nomura, K. Ito and Y. Kubo, Sci. Rep., 2017, 7, 45596 CrossRef CAS PubMed.
- X. Yi, X. Liu, R. Dou, Z. Wen and W. Zhou, ACS Appl. Energy Mater., 2021, 4, 2148–2157 CrossRef CAS.
- Z. Jian, P. Liu, F. Li, P. He, X. Guo, M. Chen and H. Zhou, Angew. Chem., Int. Ed., 2014, 53, 442–446 CrossRef CAS PubMed.
- A. C. Lim, H. J. Kwon, H. C. Lee, D. J. Lee, H. Lee, H. J. Kim, D. Im and J. G. Seo, Chem. Eng. J., 2020, 385, 123841 CrossRef CAS.
- X. Hu, J. Wang, T. Li, J. Wang, D. H. Gregory and J. Chen, Nano Lett., 2017, 17, 2073–2078 CrossRef CAS PubMed.
- A. O. Boev, S. S. Fedotov, K. J. Stevenson and D. A. Aksyonov, Comput. Mater. Sci., 2021, 197, 110592 CrossRef CAS.
- X. Cao, Z. Chen, N. Wang, Z. Han, X. Zheng and R. Yang, Electrochim. Acta, 2021, 383, 138369 CrossRef CAS.
- L. Zou, S. Guo, Z. Wang, M. Sun, F. Yu, B. Chi and J. Pu, Electrochim. Acta, 2021, 381, 138219 CrossRef CAS.
- H. Xia, Q. Xie, Y. Tian, Q. Chen, M. Wen, J. Zhang, Y. Wang, Y. Tang and S. Zhang, Nano Energy, 2021, 84, 105877 CrossRef CAS.
- High-Index Faceted Porous Co3O4 Nanosheets with Oxygen Vacancies for Highly Efficient Water Oxidation | ACS Applied Materials & Interfaces, https://pubs.acs.org/doi/abs/10.1021/acsami.7b18208, (accessed 4 September 2021).
- I. Mukhopadhyay, N. Hoshino, S. Kawasaki, F. Okino, W. K. Hsu and H. Touhara, J. Electrochem. Soc., 2002, 149, A39 CrossRef CAS.
- N. E. Benti, G. A. Tiruye and Y. S. Mekonnen, RSC Adv., 2020, 10, 21387–21398 RSC.
- Z. Feng, Y. Ma, Y. Li, R. Li, Y. Tang and X. Dai, Phys. Chem. Chem. Phys., 2020, 22, 1493–1501 RSC.
- F. Zheng, H. Dong, Y. Ji and Y. Li, J. Power Sources, 2019, 436, 226845 CrossRef CAS.
- B. He, J. Shen, Z. Lu and D. Ma, Appl. Surf. Sci., 2020, 527, 146828 CrossRef CAS.
- W. He, P. Xue, H. Du, L. Xu, M. Pang, X. Gao, J. Yu, Z. Zhang and T. Huang, Int. J. Hydrogen Energy, 2017, 42, 4123–4132 CrossRef CAS.
- H. R. Jiang, T. S. Zhao, L. Shi, P. Tan and L. An, J. Phys. Chem. C, 2016, 120, 6612–6618 CrossRef CAS.
- L. Gao, M. Zhu, Z. Zhang and G. Cui, Electrochim. Acta, 2019, 327, 134980 CrossRef CAS.
- F.-Q. Li, Y. Zhang and S.-L. Zhang, Nanomaterials, 2021, 11(6), 1395 CrossRef CAS PubMed.
- B. C. Lourencao, R. A. Pinheiro, T. A. Silva, E. J. Corat and O. Fatibello-Filho, Diamond Relat. Mater., 2017, 74, 182–190 CrossRef CAS.
- C. Shu, R. Huang, J. Wang and D. Su, RSC Adv., 2015, 5, 103019–103022 RSC.
- F. Wu, Y. Xing, L. Li, J. Qian, W. Qu, J. Wen, D. Miller, Y. Ye, R. Chen, K. Amine and J. Lu, ACS Appl. Mater. Interfaces, 2016, 8, 23635–23645 CrossRef CAS.
- K.-X. Zhang, H. Su, H.-H. Wang, J.-J. Zhang, S.-Y. Zhao, W. Lei, X. Wei, X.-H. Li and J.-S. Chen, Adv. Sci., 2018, 5, 1800062 CrossRef PubMed.
- L. Yang, S. Jiang, Y. Zhao, L. Zhu and Z. Hu, Angew. Chem., Int. Ed., 2011, 50, 7132–7135 CrossRef CAS.
Footnote |
| † Electronic supplementary information (ESI) available. See DOI: 10.1039/d1cy01832a |
| This journal is © The Royal Society of Chemistry 2022 |

