
 Open Access Article
 This Open Access Article is licensed under a
 Creative Commons Attribution 3.0 Unported Licence
5D total scattering computed tomography reveals the full reaction mechanism of a bismuth vanadate lithium ion battery anode†
Jonas
Sottmann‡
 a,
Amund
Ruud§
a,
Øystein S.
Fjellvåg¶
a,
Gavin B. M.
Vaughan
b,
Marco
Di Michel
b,
Helmer
Fjellvåg
a,
Oleg I.
Lebedev
c,
Ponniah
Vajeeston||
a and
David S.
Wragg¶
*a
a,
Amund
Ruud§
a,
Øystein S.
Fjellvåg¶
a,
Gavin B. M.
Vaughan
b,
Marco
Di Michel
b,
Helmer
Fjellvåg
a,
Oleg I.
Lebedev
c,
Ponniah
Vajeeston||
a and
David S.
Wragg¶
*a
aCenter for Materials and Nanotechnology, University of Oslo, PO Box 1033, 0315 Oslo, Norway. E-mail: david.wragg@ife.no
bESRF, The European Synchrotron, 71 Avenue des Martyrs, 38000 Grenoble, France
cLaboratoire CRISMAT, ENSICAEN, CNRS UMR 6508, 14050 Caen, France
First published on 3rd November 2022
Abstract
We have used operando 5D synchrotron total scattering computed tomography (TSCT) to understand the cycling and possible long term deactivation mechanisms of the lithium-ion battery anode bismuth vanadate. This anode material functions via a combined conversion/alloying mechanism in which nanocrystals of lithium–bismuth alloy are protected by an amorphous matrix of lithium vanadate. This composite is formed in situ during the first lithiation of the anode. The operando TSCT data were analyzed and mapped using both pair distribution function and Rietveld methods. We can follow the lithium–bismuth alloying reaction at all stages, gaining real structural insight including variations in nanoparticle sizes, lattice parameters and bond lengths, even when the material is completely amorphous. We also observe for the first time structural changes related to the cycling of lithium ions in the lithium vanadate matrix, which displays no interactions beyond the first shell of V–O bonds. The first 3D operando mapping of the distribution of different materials in an amorphous anode reveals a decline in coverage caused by either agglomeration or partial dissolution of the active material, hinting at the mechanism of long term deactivation. The observations from the operando experiment are backed up by post mortem transmission electron microscope (TEM) studies and theoretical calculations to provide a complete picture of an exceptionally complex cycling mechanism across a range of length scales.
Introduction
Lithium-ion batteries (LIBs) are the most successful portable and reusable energy storage devices since the petrol tank.1 They are a vital part of the ongoing transition from a fossil fuel based economy to one based on renewable energy sources, but they remain far from perfect: improvements in capacity, charge/discharge speed, cycle lifetime and cost are all demanded by users and manufacturers. Finding the best materials to provide this combination of properties requires a detailed understanding of the chemistry and physics of the components, especially the anode and cathode, which store and release energy as lithium ions shuttle between them. Operando methods-structural studies of batteries during charge and discharge – provide one of the best sources of information to help us explore this. They capture chemical reactions and structures as they occur in real time and avoid damage and structure degradation/relaxation which can occur while dismantling cells and preparing samples for ex situ experiments, even in a glovebox.2Several of the most interesting new battery materials lack long range order in some states of charge and discharge, making the otherwise powerful structural tools of diffraction useless.3–5 In the last decade total scattering methods (often using the atomic pair distribution function, PDF) have become popular for studying disordered materials thanks to the increasing availability of high energy X-ray and neutron sources and rapid development of data treatment tools.6,7 We previously reported operando total scattering computed tomography (TSCT) as a method for obtaining high quality PDF data on specific battery components, avoiding the problem of removing signals from battery components in which we are not interested (e.g. cell casing, current collectors, separator, electrolyte). The experiment revealed the full cycling mechanism of a phosphorus anode in a sodium ion battery, despite the anode being weakly scattering and amorphous during most of the cycling process.8 This method, initially termed pair distribution function computed tomography (PDFCT) and developed for studying catalysts,9 is derived from X-ray diffraction computed tomography (XRDCT),10 which has been applied to batteries in several studies.11 TSCT on the phosphorus anode gave us high quality area averaged PDFs for a difficult system, but not spatially resolved PDF mapping. Throughout this manuscript we will refer to the experiment in general as TSCT, the data extracted from Bragg diffraction as XRDCT and that obtained from the pair distribution function as PDFCT.
Bismuth vanadate (BiVO4) is a promising LIB and sodium ion battery (NIB) anode material whose high and stable capacity (up to 1000 cycles) make up for a rather high voltage plateau.4,12 Its cycling mechanism combines conversion and alloying reactions. The long cycle life is believed to be due to the lithium bismuth alloy (LixBi) particles (which give high capacity) being protected by a matrix of lithium vanadate (LiyVO4) formed on decomposition of the initial bismuth vanadate. The LixBi/LiyVO4 composite that appears in the first lithiation is amorphous, and its structure is still not fully understood despite XAS, diffraction and theoretical studies. After the initial cycles the LixBi formed from BiVO4 becomes more crystalline and its cycling can be tracked with operando XRD, but the structure and behavior of the amorphous and weakly scattering LiyVO4 remain unclear and vanadium XAS data have proved practically impossible to collect in an operating battery due to strong absorption. The combination of amorphous structure, good X-ray scattering power and an intriguing, poorly understood cycling mechanism involving multiple phases make this system a tempting target for operando TSCT studies.
We can now present data collected at the upgraded ESRF beamline ID15A,13 that use the full power of TSCT to reveal comprehensive chemical and microscopic information on a working BiVO4 lithium ion battery (LIB) anode in 5 dimensions: time, space and chemical structure information. XRD and PDF based maps for individual chemical components observed during cycling confirm and add detail to our understanding of BiVO4 anode cycling. Furthermore, they show changes in the microscopic distribution and crystallinity of the active material that hint at the longer-term deactivation mechanism. In addition, using the area summed TSCT data, we can follow the cycling behavior of the amorphous LiyVO4, as well as tracking the mechanism and crystallite growth in the LixBi throughout the entire cycling process. This information can be obtained either by fitting the PDF and XRD data or directly from the radial extent of the PDF. Finally, we support our observations with TEM studies on a lithiated anode material and DFT calculations. The former show the distribution of LixBi and LiyVO4 in the composite created by the initial conversion of BiVO4, while the latter help to explain some of the fine details observed in the cycling mechanism using TSCT.
Results
Coin cell tests at a cycling rate of C/6.6 on the BiVO4/super P carbon/PAA binder composition used for the operando experiments showed that it performs as expected from our earlier studies.12 The cells showed stable retained capacity of around 350 mA h g−1 between 250 and 500 cycles (Fig. S3, ESI†). The dQ/dV plot (Fig. S4, ESI†) derived from the electrochemical data collected in the operando experiment also matches with earlier reports.1 TSCT mapping and the LixBi cycling mechanism
An initial inspection of the TSCT maps produced from XRD and PDF data for the pristine BiVO4 at the start of cycling shows that they are slightly different (Fig. 1), revealing that the distributions of crystalline and amorphous material are slightly different (see also Fig. S8, ESI†). The maps show the poor coverage obtained by painting the active material onto the carbon piston, with significantly less material present as we move away from the piston surface from slice 0 to slice 2. | ||
| Fig. 1 A sketch of the electrochemical TSCT cell with examples of tomographic slices for the three different axial positions (0, 1, 2) in the BiVO4 electrode measured at the start of the operando TSCT experiment reconstructed in XRDCT (total diffracted intensity) and PDFCT (BiVO4 distribution) modes. | ||
Examination of PDFs obtained by summing the active area in each slice gives us a quick picture of the initial BiVO4 and Li/Bi phases that appear and disappear during cycling (ESI,† Fig. S9, ESI†), confirming the progression observed with XAS/XRD and theoretical calculations:12
| 3Li + BiVO4 → Bi + Li3VO4 (initial amorphisation of BiVO4) |
| 3Li + Bi → Li3Bi (1st lithiation) |
| Li3Bi → 3Li + Bi (1st delithiation) |
| Bi + Li → LiBi (2nd lithiation, stage 1) |
| 2Li + LiBi → Li3Bi (2nd lithiation, stage 2) |
Fig. 2 shows the PDFs vs. specific capacity in a contour plot. The radial distance (r) to which peaks are observed in the PDF gives a simple indication of the varying particle size and crystallinity of the phases formed during cycling. The maximum r observed corresponds to the longest atom–atom distance in the sample. After the initial crystalline BiVO4 (r > 60 Å) breaks down, bismuth clusters with r < 15 Å form. The Li3Bi formed after the first lithiation has a maximum r of around 20 Å and breaks down on delithiation into Bi clusters (r < 15 Å) before crystalline Bi (r > 40 Å) appears as the first delithiation is completed. The second lithiation goes via crystalline LiBi (r > 30 Å) to crystalline Li3Bi (r > 45 Å). The appearance of the crystalline structures also leads to the appearance of Bragg peaks in the area averaged XRD data from the first delithiation onwards (ESI,† Fig. S9). By zooming in to the low r region for the first lithiation (Fig. 2, bottom) we can see a slight increase in the r-position of the peak for the direct Bi–Bi bond in the initial Bi metal clusters (shown by an arrow in the figure), indicating extension of this bond. The change could be explained by one or more of: lithiation around the Bi clusters, increasing amounts of surface Bi with a relaxed bonding environment as the clusters grow, or the beginning of interactions between the nano-sized clusters.
 | ||
| Fig. 2 Contour plot view of the G(r) data averaged from all voxels in the tomograms containing active material in slice 0, with cycling data plotted alongside to indicate the progress of the electrochemistry. The radial distance to which peaks are observed in the PDF indicates the size of the particles. A zoomed view of the low r region for the first lithiation is shown below. Phases are labelled to indicate where they appear in the cycling and an arrow indicates the slight shift of the Bi–Bi cluster peak to longer radial distance in the first lithiation. | ||
We were also able to fit the area-summed operando PDF and XRD data against structural models using TOPAS V6.14 This further clarifies the progress of the reactions involving BiVO4 and LixBi (Fig. 3) and shows some more subtle structural variations. Details of the fits and structural models are given in the (ESI,† Fig. S5–S7, section: PDF and Rietveld fitting). From the disappearance of BiVO4 to the end of the first lithiation the Bragg peaks in the XRD data are too broad to give a meaningful fit. The PDF data, by contrast, can be fitted throughout. After the crystalline BiVO4 breaks down the first Bi phase to appear can be fitted with a single cluster model consisting of 7 Bi atoms with no long range interactions (achieved by placing the clusters in the centre of a much larger unit cell in the structure model). The fits do not reveal any further evidence of extension of the Bi–Bi bond observed in Fig. 2, probably because the model is not a completely accurate description of the various XRD amorphous Bi clusters present in the material. When Li3Bi appears it is also in the form of a nano-sized clusters, this time fitted using the crystal structure (ICSD 58797)15 with a refined spherical damping parameter to describe cluster size. The fit used two Li3Bi phases with different damping values, “bulk” (r = ∼10 Å) and Li3Bi “nano” (r = ∼5 Å). The delithiation begins with Li3Bi disappearing and being replaced by the Bi-metal in the nanocluster form only, but at around 350 mA h g−1 we see a new Bi metal phase appearing. This phase is fitted in the PDF with the crystal structure (ICSD 64703)16 with a refined radial damping parameter (r = ∼45 Å). The crystal structure can also be used to fit the sharp Bragg peaks which appear in the XRD data at this stage (note that the Rietveld fit treats the nanosized phases as background). A crystalline LiBi phase (r = ∼20 Å) appears in the second lithiation and can be fitted in the same way, both to the PDF and XRD data (ICSD 58796).15 This phase coexists with Bi metal, suggesting that the mechanism is split between direct lithiation of nano Bi to Li3Bi and lithiation of bulk Bi via LiBi to Li3Bi (the thermodynamic equilibrium pathway, see supporting figure [DFT], ESI†). The Li3Bi which appears in the second lithiation is very clearly split into bulk (r = ∼30 Å) and nano size (r = ∼3 Å) regimes in the PDF fit. The bulk crystal structure fits the XRD data, in which we see the Li3Bi appearing in a very similar pattern to nano Li3Bi in the PDF fit. Radial damping variations throughout the PDF fit are shown in Fig. S10 (ESI†).
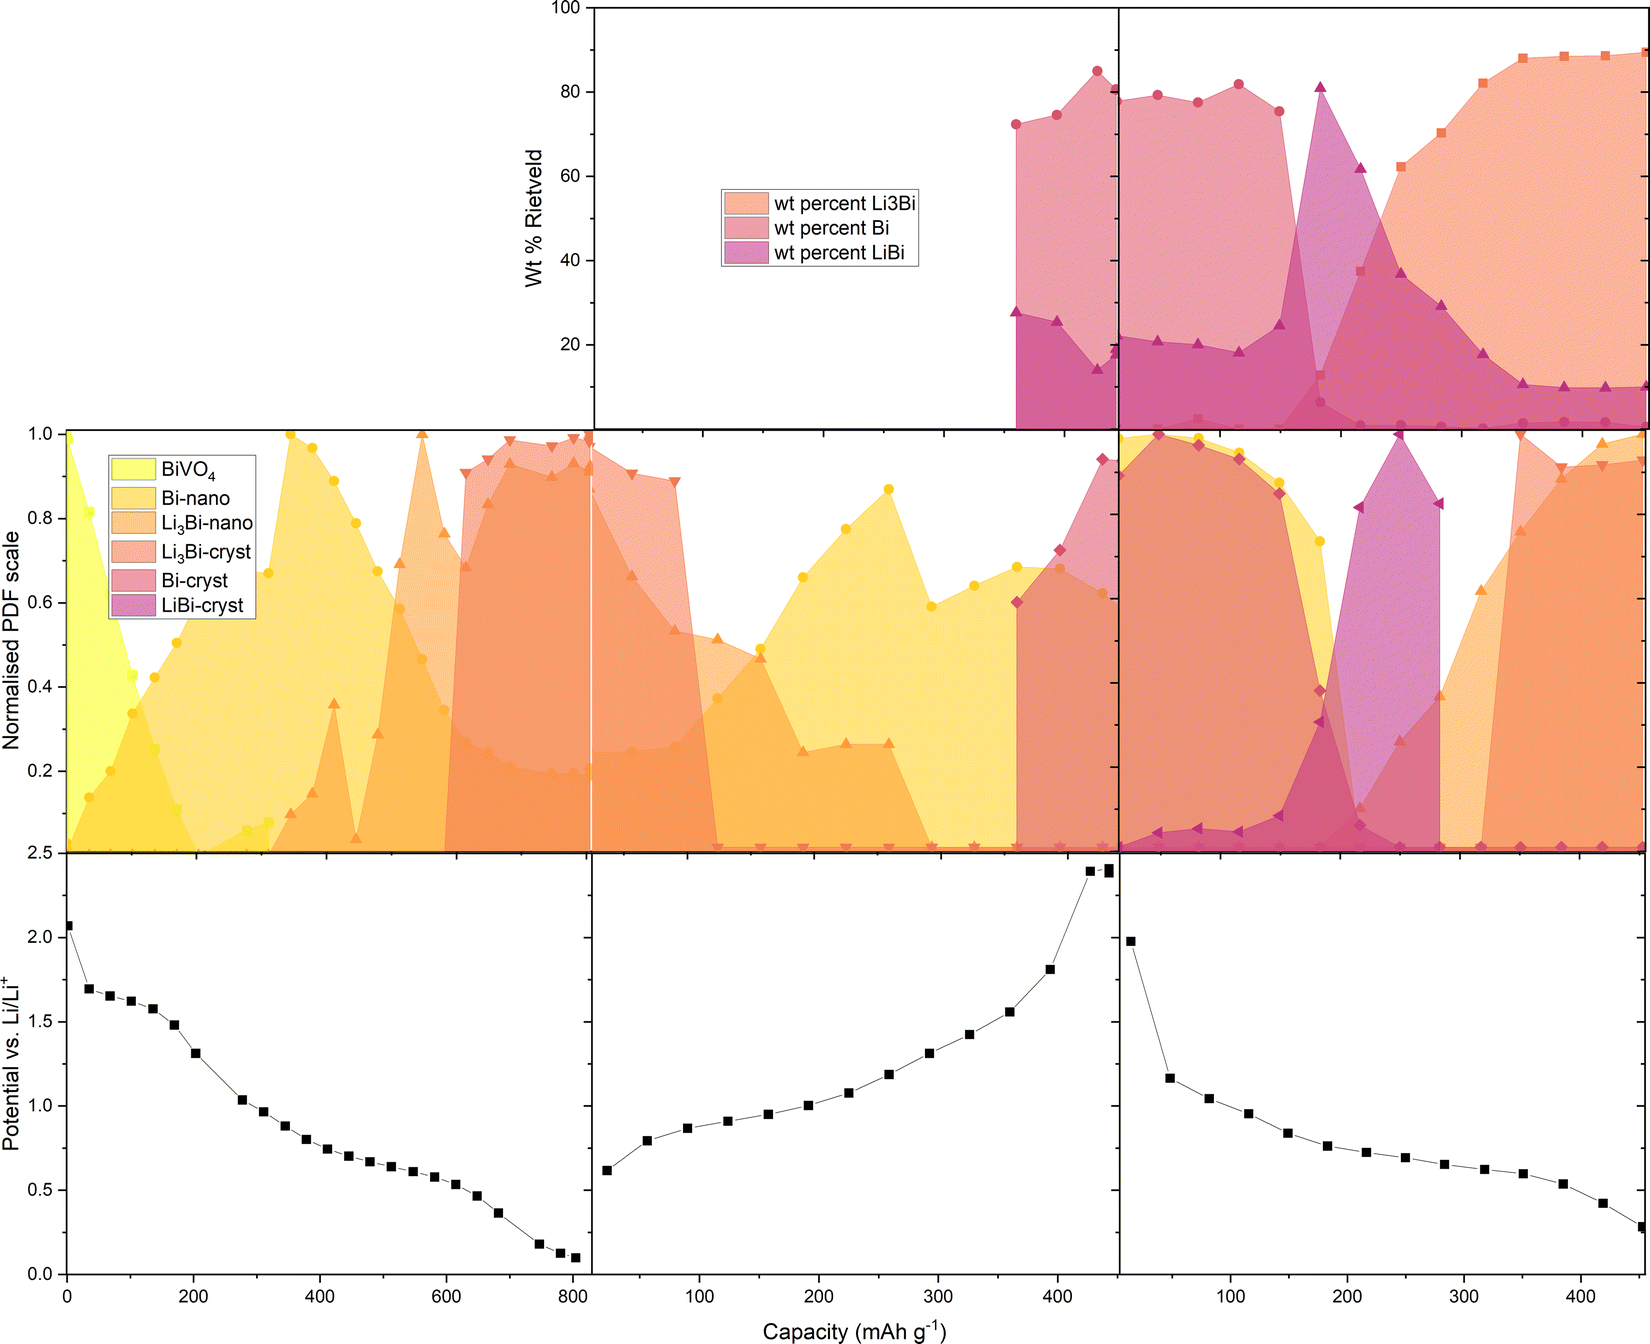 | ||
| Fig. 3 Phase changes in BiVO4 and LixBi during half-cell cycling in the operando TSCT experiment from fitting of PDF (normalised PDF scale) and XRD data (weight % Rietveld). | ||
We also see variations in the refined lattice parameters for the bulk Li3Bi (ESI,† Fig. S11). A decrease in the lattice parameters as Li3Bi forms during the first lithiation is followed by a slight increase in the cubic lattice parameter after the phase has become the dominant component of the electrode (above 600 mA h g−1). The reverse occurs in the delithiation (Li3Bi is dominant below 100 mA h g−1). Before the Li3Bi becomes the dominant phase in the second lithiation (above approx. 200 mA h g−1), we see large estimated standard deviations (ESDs) in the a-axis values, meaning the results are less reliable at this stage, while the Li3Bi phase fraction is small. The lattice parameter is slightly larger in the second lithiation than in the first and once the phase is established as the dominant electrode component there is an excellent agreement between the PDF and XRD lattice parameters, with very small ESDs. DFT calculations suggest that as the Li content in non-stoichiometric Li3-δBi is reduced, the unit cell volume contracts (see ESI† Table ST1). Sub-stoichiometric Li3−δBi is probably responsible for the changes in Li3Bi lattice parameter during cycling and it may also be that the small clusters of Li3Bi which dominate in the first lithiation are actually Li3−δBi with a reduced lattice parameter. The other phases show essentially constant lattice parameters in both PDF and XRD fitting.
2 Spatial distribution of the active material
From the area summed TSCT data we selected characteristic peaks that allowed us to map the main LixBi phases in PDF and XRD. The lack of Bragg peaks in the initial stages of LixBi cycling means that the XRDCT does not provide a clear picture of the phase changes (ESI,† Fig. S12), but in PDFCT the appearance and disappearance of the phases is easy to follow (Fig. 4), this progression can also be seen in Movie S1 (ESI†). A small amount of intensity in the maps of LiBi during the first lithiation agrees with the evidence of lithiation from Bi–Bi bond extension from the area-summed PDFs (Fig. 2).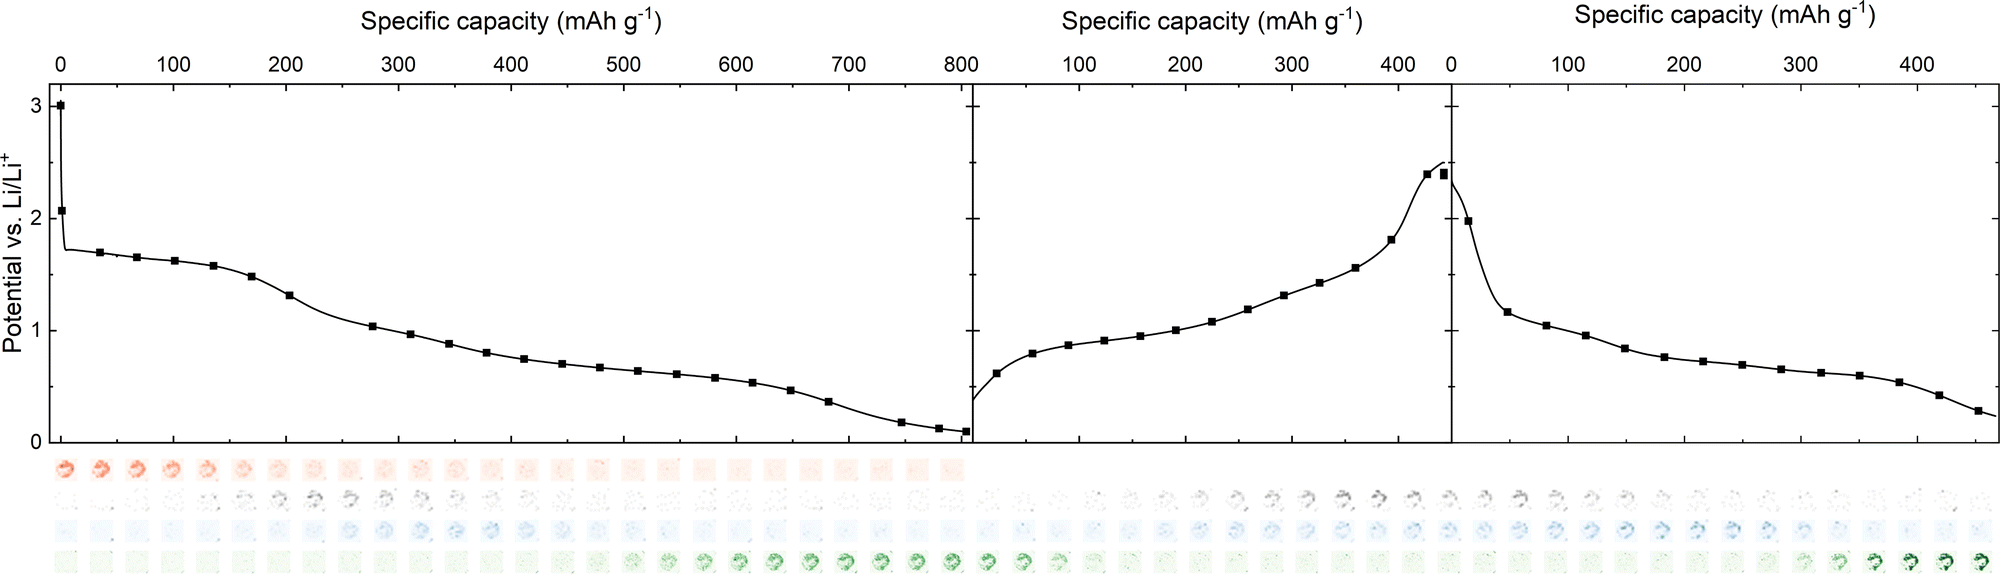 | ||
| Fig. 4 PDFCT tomograms (bottom) from anode slice 0 showing the progression of the phases during operando cycling (capacity plot, top). Red = BiVO4, grey = Bi, blue = LiBi, green = Li3Bi. | ||
From the maps we see no clear differences between the charge states at which different phases appear and disappear in the 3 TSCT slices through the thickness of the electrode (i.e. along the axis of the cell, ESI,† Fig. S13) at the rate of cycling used. Increases in the intensity of the PDFCT signals in the maps also fits with increasing crystallinity as the cycling process proceeds.
Comparing the PDFCT maps of Li3Bi after the first and second lithiations, or the total intensity XRDCT maps at the same stages, we see an apparent reduction of the area covered by the active material (Fig. 5). Difference maps of the changes in total XRDCT intensity compared to the start point show this even more clearly. We believe this indicates that as the LixBi material becomes more crystalline after the first lithiation (see above) it is confined to smaller areas, either due to agglomeration of the nanoparticles into larger crystallites or dissolution of some of the nanoparticle material into the electrolyte.
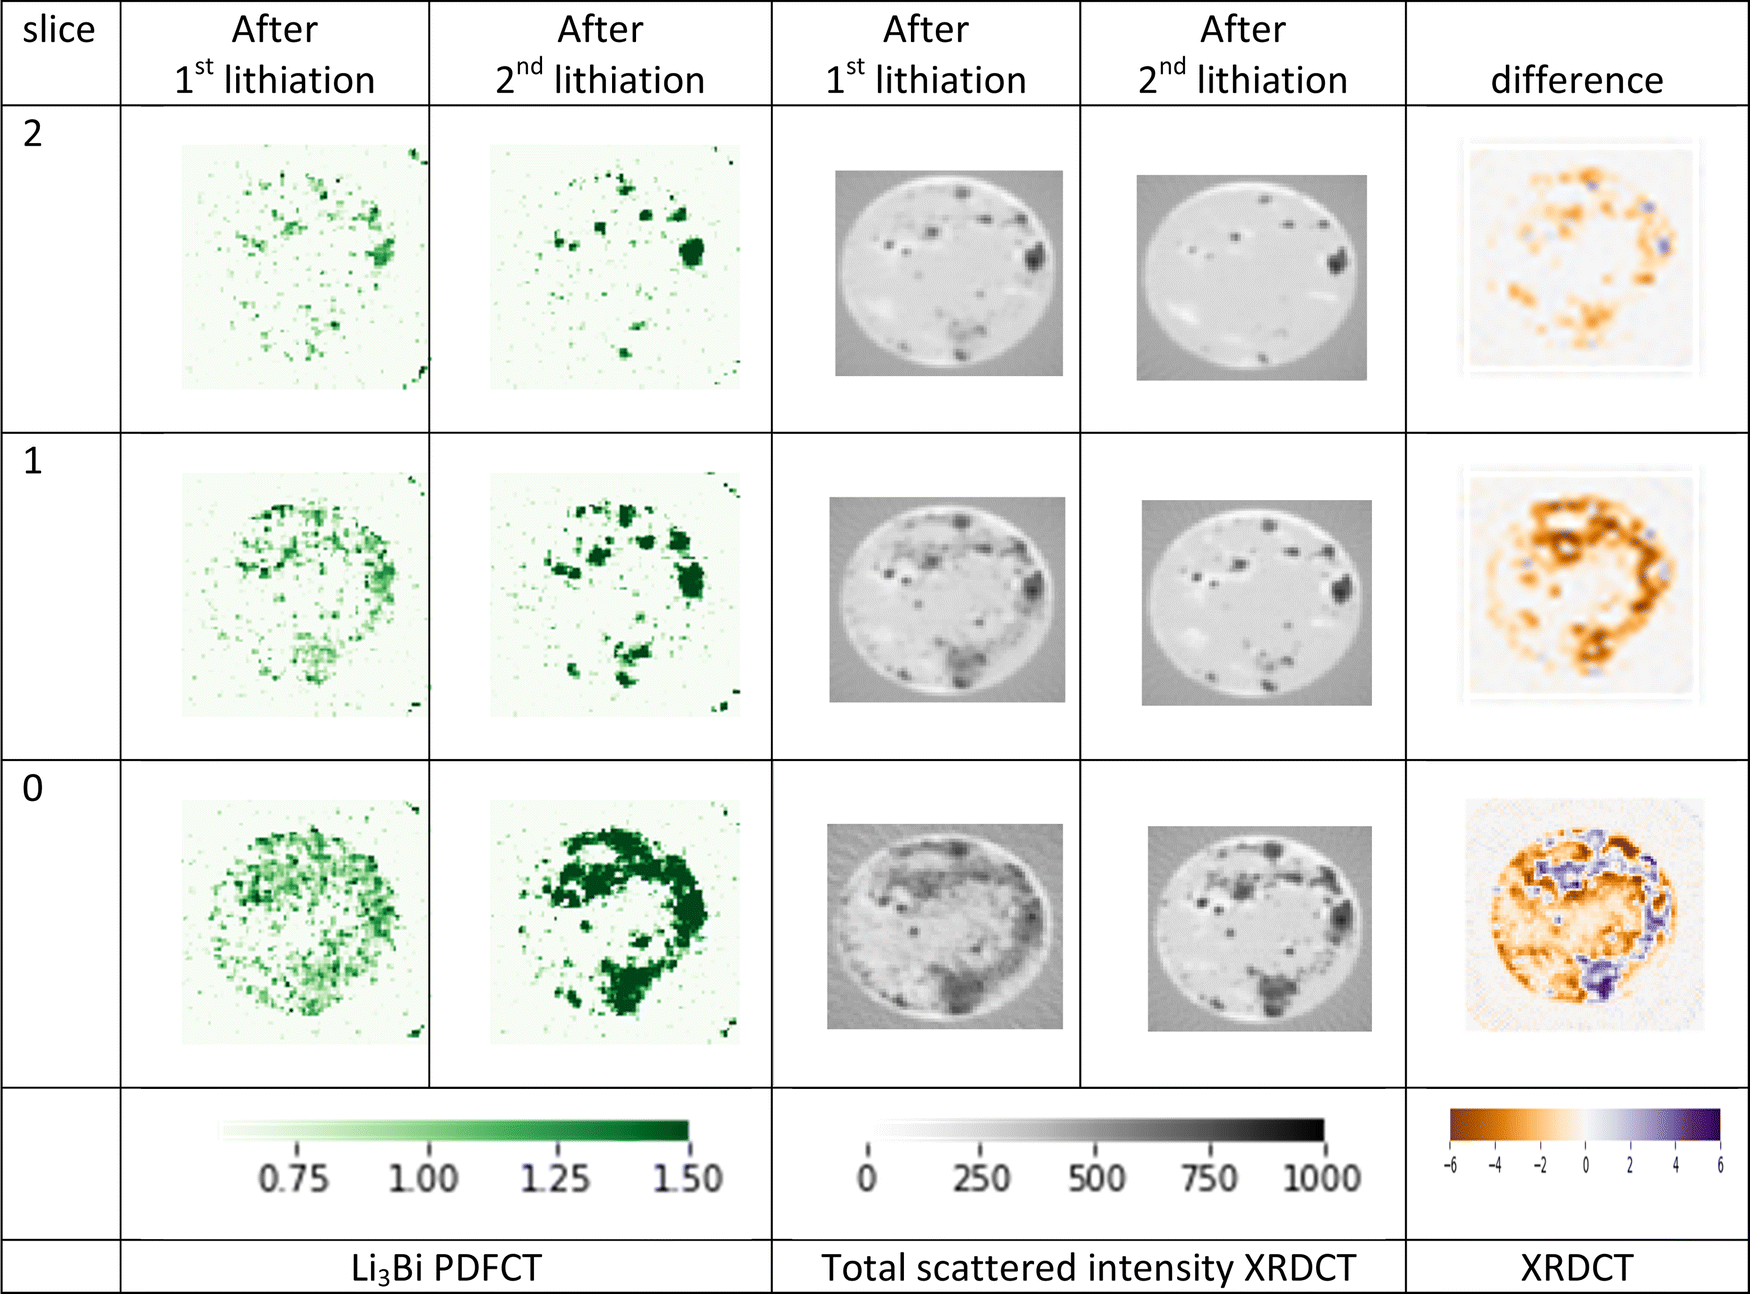 | ||
| Fig. 5 Differences between the coverage of Li3Bi (PDFCT) and total anode material (XRDCT for the total scattered intensity) at the end of the first and second lithiations. In the difference plot orange represents areas in which intensity decreases (material lost) and blue/purple areas where it increases (material gained). | ||
By counting pixels above a set threshold in the phase specific PDFCT and total scattering XRDCT maps we can quantify the coverage of each phase and of all the scattering material. This gives us firstly, another measure of the progress of the LixBi cycling processes and secondly, a numerical quantification of how the coverage of the piston with active material decreases with cycling (Fig. 6). The progress of the BiVO4/LixBi cycling reactions observed with this method is very similar to that indicated by looking at and/or fitting the area-summed operando PDF data or looking at the series of phase-specific PDFCT maps, but the contribution for LiBi appears to be much more significant. This is probably due to significant overlap between the characteristic Bi and LiBi peaks in the radially rebinned PDFs used to make the PDFCT maps (see Methods section). The stronger signal from LiBi in the second lithiation is reproduced as in the other analyses. We can also see that the coverage of Li3Bi is reduced in the second lithiation compared to the first. This follows the general trend of decline visible in the total coverage in the XRDCT tomograms for all three slices (dotted lines in Fig. 6).
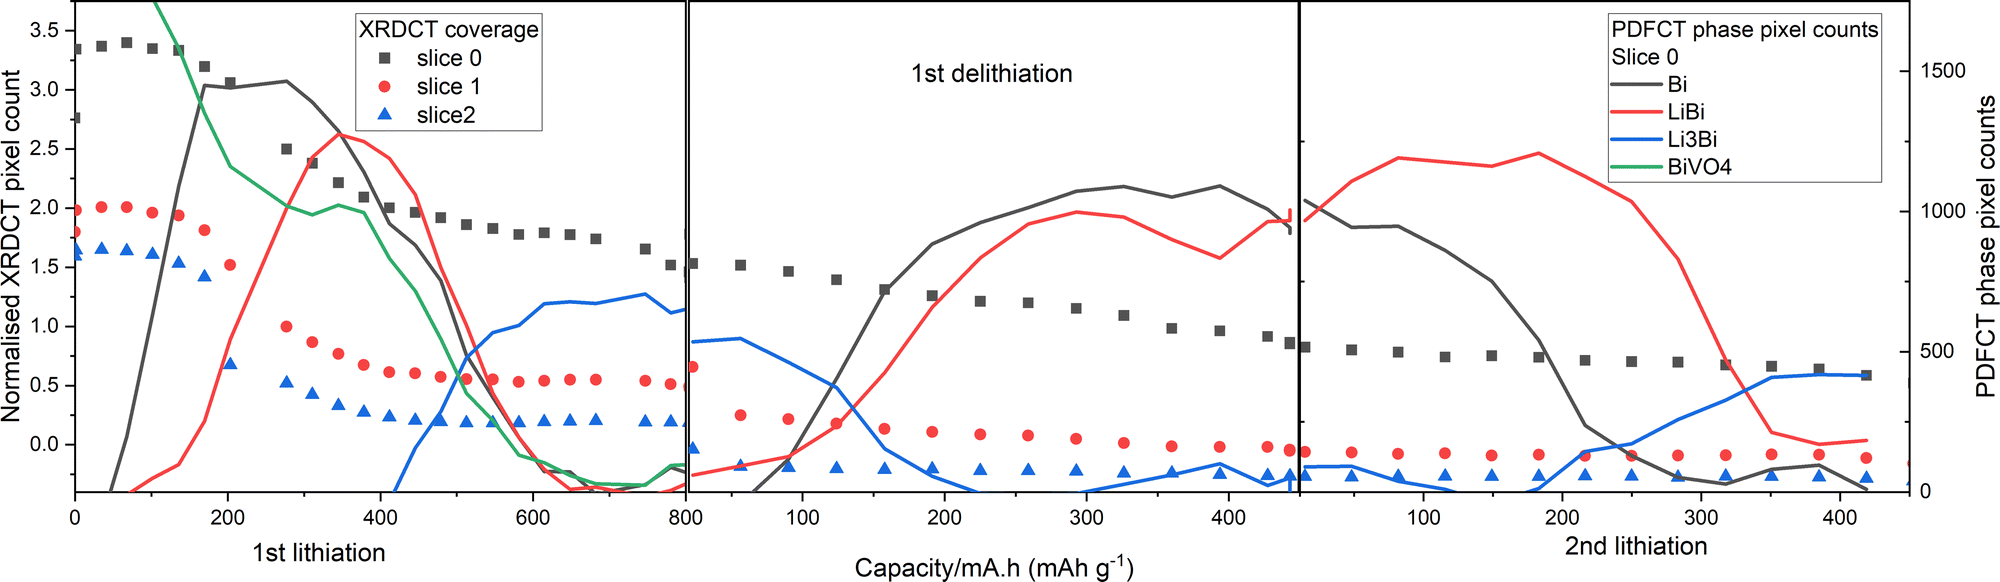 | ||
| Fig. 6 Progression of the BiVO4 and LixBi phases in slice 0 during cycling in the operando TSCT experiment (solid lines), from pixel counting in the phase specific PDFCT images; and total coverage of active material from pixel counting in the total scattering XRDCT images (dotted lines). The PDFCT pixel count for BiVO4 was not measured after the 1st lithiation as the phase was no longer present. | ||
3 LiyVO4 and carbon
The only sign of the LiyVO4 phase(s) in the area summed PDFCT data is a sharp peak at around 1.8 Å from the V–O bond. No significant features beyond this can be fitted with any of the LiyVO4 phases which are stable according to DFT calculations (ESI,† Table ST2), or with lithium/bismuth oxides. By fitting the 1.8 Å peak position vs. charge state we can see a pattern that follows small features in the potential vs. capacity curve at the start of lithiation and the end of delithiation (Fig. 7). This probably corresponds to cycling of Li in the LiyVO4 matrix, with oxidation and reduction of vanadate, occurring before lithiation of Bi and after delithiation of LixBi. A study of chemically lithiated LizV2O5 (z = 0, 0.33, 0.66, 1.2, 0.48, and 0.1) shows that the average V–O bond length increases up to about z = 0.8,17 but since we do not know the initial composition of the LiyVO4 phase (for possible candidates, see ESI† table ST2) it is difficult to speculate on the value of y from the V–O bond length. We can also see the peaks for 2 C–C interactions at 1.45 and 2.35 Å, as observed previously for amorphous carbon.3,18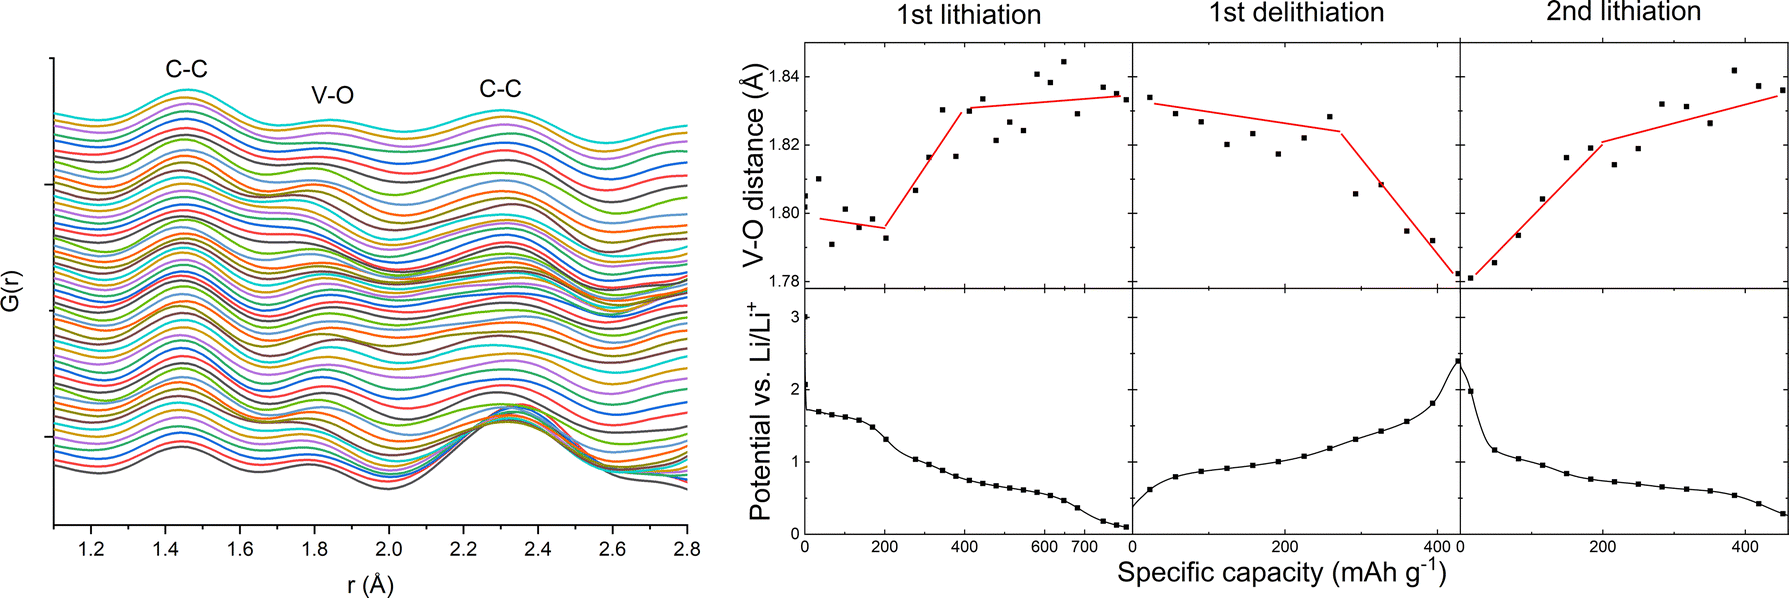 | ||
| Fig. 7 Left, low-r region of the area summed PDF series for the entire operando experiment with V–O and C–C bond peaks labelled. Right, fitting of the V–O peak position plotted alongside the cycling data for the operando study. The red lines drawn over the data points are a guide (not linear regression) to indicate the steps in the peak position fits. | ||
Results 4 TEM/EDXS
To help us understand the TSCT results and how the structures observed fit together, we used a high-resolution transmission electron microscope (HRTEM) to collect images, electron diffraction (ED) and a high-angle annular dark-field scanning transmission electron microscopy (HAADF-STEM) image of the sample. We also did energy-dispersive X-ray spectroscopy mapping in STEM mode (STEM-EDX) of material from a fully lithiated BiVO4 anode (Fig. 8). In the low magnification TEM (Fig. 8a) and HAADF-STEM images (Fig. 8b) we can see 5–20 nm particles. The ring ED patterns allow us to identify these as Li3Bi. The size range is rather larger than the average size of around 4.5 nm (45 Å) from the PDF fits, due to the wide distribution of particle sizes in the anode samples. They are distributed over a less organized matrix. The ED data (Fig. S14, ESI†) also show Li3Bi diffraction patterns from different areas containing a mixture of single crystal and powder type diffraction data, supporting our use of different crystallite sizes to fit the area summed PDFCT data. Some of the particles appear to be covered by a layer of less dense material (Fig. 8c), presumably LiyVO4, but possibly carbon or some kind of SEI as observed for Bi2MoO6.19 In the lower magnification EDXS-STEM maps (Fig. 8b), the vanadium and oxygen signals cover the whole sample area uniformly, supporting the theory that LiyVO4 forms an amorphous mass without long range order, while the Bi map is more mottled, showing a mixture of LixBi cluster sizes spread over the area. The overlaid image makes the clustering of Bi very clear. Fig. 8d shows a HRTEM image of single Li3Bi nanoparticle imaged along the [101] zone axis, along with the Fourier transform of the image, showing sharp spots. These confirm the Li3Bi structure and good crystallinity of the nanoparticles.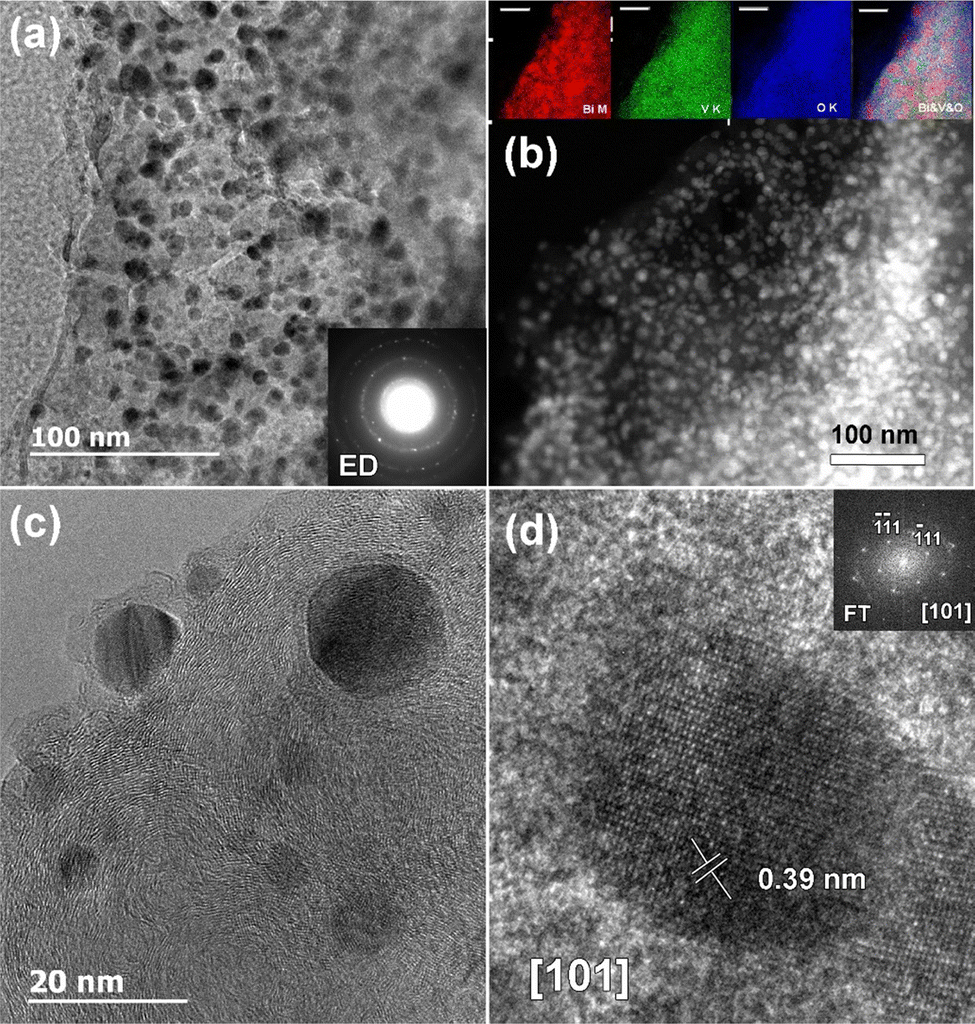 | ||
| Fig. 8 (a) Bright field low magnification TEM image of material from a fully lithiated BiVO4 anode and corresponding ring ED pattern, showing dark clusters of nanoparticles in a matrix of less dense material. (b) Low magnification HAADF-STEM image and corresponding EDX-STEM elemental maps of the same sample showing the different distributions of Bi (M-edge, red), V (K-edge, green), O (K-edge, blue) and overlaid color image. The scale bar is 50 nm. Note that the bright contrast regions in this image correspond to Li3Bi nanoparticles. (c) Bright field overview HRTEM image and (d) selected Li3Bi nanoparticle bright field HRTEM image along the [101] zone axis. The corresponding Fourier transform pattern is shown in the insert. | ||
Discussion
The basic mechanism of lithium cycling in the BiVO4 based anode is confirmed.12 BiVO4 converts irreversibly into Bi metal and LiyVO4. The nano Bi formed is lithiated directly to Li3Bi in the first lithiation, but there is a suggestion of the presence of LiBi (small intensity mapping signal: Fig. 5 and 6, slight extension of Bi–Bi bonds in the Bi cluster: Fig. 2). Delithiation proceeds directly from Li3Bi to Bi metal. The second lithiation clearly includes crystalline intermediate LiBi. This is consistent with the dQ/dV cycling data (Fig. S4, ESI†) which show a single, broad anodic peak in the first lithiation which clearly splits into two sharper peaks in the second lithiation. There may be two parallel mechanisms: Li–Li3Bi and Li–LiBi–Li3Bi. Mechanisms with and without intermediates, occurring in parallel and depending on the rate of charge/discharge, have been reported for phosphorus sodium ion battery anodes.8,20Both area-summed data (increasing maximum r in the PDFs and appearance of Bragg peaks in conventional XRD) and maps from TSCT show that crystallite size increases with cycling. This has been observed in other bismuth metallate anodes (in both LIBs and NIBs),12,19,21 as well as for other conversion/alloying anode materials e.g. bismuth sulphide.22 TSCT maps also show that the area covered with active material decreases during this process. This could be caused by crystal growth fed by the amorphous material (which is used up and shifted to the crystalline areas) or dissolution of the smaller particles of active material into the electrolyte (leaving only the crystalline areas). Reactions with the electrolyte have been suggested as reasons for longer term degradation of electrode materials including Prussian blue analogues23 and Bi2MoO6.19
Post-mortem TEM shows that 5–20 nm LixBi particles sit in a LiyVO4 matrix. TSCT shows that this has no observable or fit-able order beyond the first V–O bond. Despite this lack of order, variations in the V–O bond length linked to specific features in the charge/discharge curves are visible in the area summed operando PDFCT data. Two PDF peaks are attributed to the carbon additive.
Based on the above, we propose the following mechanism:
1. BiVO4 breaks down on lithiation to nano-clusters of Bi metal in a LiyVO4 matrix. This process cannot be reversed.
2. The Bi-nano-clusters are lithiated, possibly via small amounts of LiBi-like intermediates, before fully lithiated Li3Bi is formed, now with particles in two size regimes.
3. Delithiation goes directly from Li3Bi to Bi metal followed by (partial) delithiation of LiyVO4. Crystalline Bi metal is observed alongside nanosized amorphous Bi.
4. The second lithiation begins with lithiation of LiyVO4 and proceeds from Bi (nanoclusters and crystalline) via LiBi (crystalline) to Li3Bi (crystalline + amorphous). It seems likely that some of the amorphous component is directly lithiated to Li3Bi.
5. As crystalline LixBi appears and the crystallites grow, the active area of the anode reduces. This may be a factor in longer-term loss of capacity and activity.
A convex energy hull diagram plotted from DFT minimized structures in the LixBi system (ESI,† Fig. S15) shows a very straight line from Li3Bi (the lowest point of the hull) to Bi metal passing through LiBi and a theoretically stable Li2Bi structure (not experimentally known). This means that there is very little difference in energy between the route that has the LiBi structure as an intermediate and the direct conversion of Bi to Li3Bi. The hull thus helps to explain how steps 2 and 4 of the mechanism above can bypass LiBi (partly or completely) and go directly from Bi to Li3Bi in the same way that the delithiation in step 3 goes directly from Li3Bi to Bi. This appears to be dependent on the level of crystallinity, with crystalline LixBi more likely to follow the route via LiBi during lithiation, perhaps due to slower kinetics in the larger crystallites. The mechanism seems to fit somewhere between those observed in operando studies of NIBs with bismuth metal24 and Bi2MoO619 anodes, in which NaBi is formed as an intermediate during sodiation and desodiation; and phosphorus8 anodes, where NaP is formed during sodiation but not during desodiation and (dis)charge rate may also influence the route followed.
By collecting three TSCT slices through the anode during the operando experiment we obtained information in the axial dimension of the battery, which shows that within the timescale of the experiment (at a cycling rate of approximately C/8) there is no observable difference in the extent of lithiation between adjacent slices along the axis of the cell collected within 15 minutes of one another. This suggests that despite the low electronic conductivity of all the theoretically possible phases that could exist in the LiyVO4 matrix (calculated by DFT to be either semimetals or indirect bandgap semiconductors, see Table ST2, ESI†), the overall anode composition (including the conductive super-P carbon additive) remains capable of conducting both Li ions and electrons during the operando experiment.
Conclusion
The mechanism of BiVO4 LIB anodes is extremely complex and the behavior of the various amorphous components has proved very difficult to track. Using a single TSCT dataset analyzed with multiple methods, backed up with ex situ TEM on a lithiated anode, we have obtained a very detailed, time resolved picture of how the metallate anode functions at a range of length scales. We have confirmed the basic mechanism of bismuth (de)lithiation, which explains the majority of the capacity, and furthermore, reveal previously hidden complexity in this mechanism. For the first time the atomic structure and activity of the LiyVO4 matrix are clearly visible in the area averaged operando PDFCT data, which also contain information on the Super-P carbon additive, helping us to understand sources of anode capacity beyond LixBi. The operando TSCT mapping and TEM data reveal larger scale changes in the distribution and structure of the active material and hint at how the longer-term deactivation of the anodes might be triggered by the growth of large crystallites within the amorphous LiyVO4 matrix and/or dissolution of the active material into the electrolyte.The richness of information obtained from the operando TSCT is beyond anything we have previously encountered for a single operando experiment. Not only does this dataset prove once again that this method is superior to typical transmission operando total scattering cells for measuring high quality PDF data on complex materials, it also shows that PDFCT imaging can be a highly effective tool for studying the microstructural changes in a working electrode. Never before has an amorphous electrode been imaged in real time with chemical selectivity. Alongside the post-mortem TEM, TSCT provides a tremendous insight into the entire cycling process at both nano and micro scales. Although the experimental methods and data processing are complex and a limited number of experimental facilities are currently available, we believe that the effort is worthwhile: our success in unravelling a very complex cycling process in a multi-phase, non-crystalline system points to tremendous possibilities for understanding materials and improving battery performance. The detail we have obtained on the amorphous and weakly scattering components of the anode (LiyVO4, super-P carbon) suggests a bright future for TSCT when applied to difficult systems like silicon7 that have so far proved very difficult to study with operando total scattering.
Conflicts of interest
There are no conflicts to declare.Methods
Sample preparation
The oxide–carbon composite BiVO4:C was prepared by milling commercial BiVO4 (99.9%, Alfa Aesar) powder and conductive carbon black (C, Timcal Super P) in a 7![[thin space (1/6-em)]](https://www.rsc.org/images/entities/char_2009.gif) :3 mass ratio under argon atmosphere (99.999% purity). A Fritsch Pulverisette 23 was used with a 10:1 ball-to-powder ratio at 50 Hz for 20 min. The grinding balls and bowls were made of steel.
:3 mass ratio under argon atmosphere (99.999% purity). A Fritsch Pulverisette 23 was used with a 10:1 ball-to-powder ratio at 50 Hz for 20 min. The grinding balls and bowls were made of steel.
Electrode preparation
The working electrode was prepared by spreading a slurry composed of 70 wt% of BiVO4:C, 10 wt% of conductive carbon black (Super P, Timcal) and 20 wt% poly(acrylic acid) (PAA, Sigma Aldrich) as binder, dissolved in ethanol, directly on the current collector (copper foil or glassy carbon for operando TSCT measurements) with a paint brush. The electrodes were dried under vacuum at 60 °C overnight.Battery assembly
Half cells were assembled in coin cells (type CR2032) or in specially constructed electrochemical cells for the operando TSCT measurements. For coin cell measurements the electrodes deposited on Cu current collector foil were then punched into discs with a mass loading of active material of about 1 mg cm−2. For operando measurement slightly thicker electrodes with an active material mass loading of about 2.5 mg cm−2 were prepared (the accuracy of the mass loading calculation was limited by the balance available when the samples were prepared at the ESRF, which was only accurate to ± 1 mg, this in turn leads to problems calculating the charge rate (C), potentially leading to reduced observed capacity due to higher than calculated C-rate. The working electrode was separated from the lithium metal disk as counter electrode by electrolyte soaked glass fibres (GF/C, Whatman). The electrolyte was a 1 M solution of LiPF6 in ethylene carbonate/diethyl carbonate (EC/DEC, 1:1 by volume) solution (Sigma Aldrich). The battery was galvanostatically cycled in a voltage range of 0.01 V to 2.5 V vs. Li/Li+ at 100 mA g−1 using a Biologic SP150 battery cycler. The specific capacity/current values are expressed based on the mass of BiVO4. The approximate C-rate for the operando experiment was C/8.
Operando TSCT
The operando electrochemical cell design is based on our previous design.8 In the new version (Fig. S[cell], ESI†) the sample container consists of a fully X-ray amorphous sealed quartz tube containing two glassy carbon pistons (3 mm in diameter) on which the working electrode and Li metal counter electrode are directly deposited. The pistons are pressed together by a spring to create electric and ionic contact within the electrochemical cell. The sample container is aligned such that the approximately 30 μm thick working electrode layer is oriented in plane with the X-ray beam and can be rotated by up to 360° around its vertical axis during the measurement.TSCT data were collected at beamline ID15A of the European Synchrotron (ESRF). The cell was mounted on a fast translation/rotation stage capable of movement in the x,y and z planes of the diffractometer. Powder diffractograms were collected at an energy of 87 keV using a 40 μm wide and 13 μm high beam. The beam was focused using X-ray lenses. A Pilatus 3X 2M CdTe area detector was used to collect the diffractograms. Detector distance (28.1 cm) and other detector constants were calibrated from diffractograms of a capillary sample of NIST SRM674b CeO2 using PyFAI.25 The TSCT cell was rotated through 180° and the beam was scanned across the 5 mm wide cell with the 40 μm beam width as the step size. A line scan of 110 diffractograms across the sample was collected for every 3° rotation from 0 to 180°, giving 61 projections to reconstruct for each TSCT slice. Three slices (slice 0, 1 and 2) were collected in the anode at heights of 10, 25 and 40 μm above the piston surface. Each slice took approximately 7 minutes to collect. This resulted in a voxel (3D pixel) size of 40 × 40 × 13 μm3.
In-house ID15A software was used to remove air scattering contributions to the raw diffraction data based on diffractograms collected outside the sample. The data were integrated using PyFAI and reconstruction was carried out using the ID15A Matlab scripts. A trimmed mean filter was applied to remove artefacts due to larger single crystals. Integrated powder patterns for each voxel were converted to G(r) using PDFGetX3 in batch mode. TSCT processing was carried out in two different modes:
1. For analysis of the reaction mechanism only diffraction and total scattering data from the active material in each tomographic slice was taken into account. The initial distribution (which was rather inhomogeneous due to brush painting of the electrode slurry onto the piston) of crystalline BiVO4 was determined using standard XRDCT methods (ESI,† Fig. S1). Based on this distribution the powder patterns of all voxels containing active material (all other voxels were masked and not account for) were summed to a single high quality powder pattern for each tomographic slice and converted to G(r) and I(2Θ). The slice closest to the current collector (slice 0 in Fig. 1), contained the most active material and was used for analysis of the mechanism.
2. For TSCT mapping a further set of G(r) data were produced in which the data from individual voxels were rebinned with a large radial step size (0.2 Å) to reduce the noise levels. The difference between the PDFs obtained from an average of the entire active area and a single voxel after 0.2 Å rebinning is shown in ESI† Fig. S2. XRDCT maps were produced using the untreated I(q) data. The G(r) maps were produced using a single characteristic r value for each of the phases (BiVO4 = 3.6 Å, Bi = 3.0 Å, LiBi = 3.4 Å, Li3Bi = 4.8 Å) with no background subtraction. I(q) maps were produced by integrating the area under characteristic peaks for each phase (BiVO4 = 1.29–1.42 Å−1, Bi = 2.715–2.805 Å−1, LiBi = 2.345–2.445 Å−1, Li3Bi = 1.55–1.7 Å−1) after background subtraction.
The unprocessed I(Q) data were also used to create maps equivalent to traditional X-ray adsorption tomography slices using the sum of all Q channels. These were used to study the variation in total volume of anode material during cycling.
Ex situ TEM
Samples for ex situ TEM were taken from an electrode fully lithiated in a coin cell. The cell was disassembled and the electrode particles were crushed, washed with DEC and transferred to a TEM grid in an argon filled glove box. The TEM grid was then carefully transferred to the TEM chamber to minimize contamination with atmospheric species.The transmission electron microscopy (TEM) measurements were performed using a double aberration corrected JEM ARM200F cold FEG microscope equipped with CENTURIO large angle EDX detector, ORIUS CCD camera and Quantum GIF.
Acknowledgements
We thank the ESRF for providing beam time at ID15A and gratefully acknowledge the Research Council of Norway for financial support to AMR (Grant no. Nano-MILIB, 220135) and access to supercomputing facilities (project no. NN2875k). We also thank Jonas Skåra Ringnes for building and helping to design the TSCT cells, Anthony Vamvakeros for useful discussions during the beam time and Muhammad Abdelhamid for assisting with the figures.References
- A. Manthiram, A reflection on lithium-ion battery cathode chemistry, Nat. Commun., 2020, 11(1), 1550, DOI:10.1038/s41467-020-15355-0; T. Kim, W. Song, D.-Y. Son, L. K. Ono and Y. Qi, Lithium-ion batteries: outlook on present, future, and hybridized technologies, J. Mater. Chem. A, 2019, 7(7), 2942–2964, 10.1039/C8TA10513H , .
- D. Liu, Z. Shadike, R. Lin, K. Qian, H. Li, K. Li, S. Wang, Q. Yu, M. Liu and S. Ganapathy, et al., Review of Recent Development of In Situ/Operando Characterization Techniques for Lithium Battery Research, Adv. Mater., 2019, 31(28), 1806620, DOI:10.1002/adma.201806620; A. Brennhagen, C. Cavallo, D. S. Wragg, J. Sottmann, A. Y. Koposov and H. Fjellvåg, Understanding the (De)Sodiation Mechanisms in Na-Based Batteries through Operando X-Ray Methods, Batteries Supercaps, 2021, 4(7), 1039–1063, DOI:10.1002/batt.202000294.
- F. Legrain, J. Sottmann, K. Kotsis, S. Gorantla, S. Sartori and S. Manzhos, Amorphous (Glassy) Carbon, a Promising Material for Sodium Ion Battery Anodes: a Combined First-Principles and Experimental Study, J. Phys. Chem. C, 2015, 119(24), 13496–13501, DOI:10.1021/acs.jpcc.5b03407.
- J. Sottmann, M. Herrmann, P. Vajeeston, A. Ruud, C. Drathen, H. Emerich, D. S. Wragg and H. Fjellvåg, Bismuth Vanadate and Molybdate: Stable Alloying Anodes for Sodium-Ion Batteries, Chem. Mater., 2017, 29(7), 2803–2810, DOI:10.1021/acs.chemmater.6b04699.
- K. Ogata, E. Salager, C. J. Kerr, A. E. Fraser, C. Ducati, A. J. Morris, S. Hofmann and C. P. Grey, Revealing lithium–silicide phase transformations in nano-structured silicon-based lithium ion batteries via in situ NMR spectroscopy, Nat. Commun., 2014, 5(1), 3217, DOI:10.1038/ncomms4217; P. K. Allan, N. Louvain and L. Monconduit, Negative Electrodes for Li-Ion Batteries: Beyond Carbon, Prospects for Li-ion Batteries and Emerging Energy Electrochemical Systems, 2018, pp. 1–55 CrossRef; A. Ulvestad, A. H. Reksten, H. F. Andersen, P. A. Carvalho, I. J. T. Jensen, M. U. Nagell, J. P. Mæhlen, M. Kirkengen and A. Y. Koposov, Crystallinity of Silicon Nanoparticles: Direct Influence on the Electrochemical Performance of Lithium Ion Battery Anodes, ChemElectroChem, 2020, 7(21), 4349–4353, DOI:10.1002/celc.202001108.
- X. Wang, S. Tan, X.-Q. Yang and E. Hu, Pair distribution function analysis: Fundamentals and application to battery materials, Chin. Phys. B, 2020, 29(2), 028802, DOI:10.1088/1674-1056/ab6656; P. K. Allan, J. M. Griffin, A. Darwiche, O. J. Borkiewicz, K. M. Wiaderek, K. W. Chapman, A. J. Morris, P. J. Chupas, L. Monconduit and C. P. Grey, Tracking Sodium-Antimonide Phase Transformations in Sodium-Ion Anodes: Insights from Operando Pair Distribution Function Analysis and Solid-State NMR Spectroscopy, J. Am. Chem. Soc., 2016, 138(7), 2352–2365, DOI:10.1021/jacs.5b13273; O. J. Borkiewicz, B. Shyam, K. M. Wiaderek, C. Kurtz, P. J. Chupas and K. W. Chapman, The AMPIX electrochemical cell: a versatile apparatus for in situ X-ray scattering and spectroscopic measurements, J. Appl. Crystallogr., 2012, 45(6), 1261–1269, DOI:10.1107/S0021889812042720; H. Liu, P. K. Allan, O. J. Borkiewicz, C. Kurtz, C. P. Grey, K. W. Chapman and P. J. Chupas, A radially accessible tubular in situ X-ray cell for spatially resolved operando scattering and spectroscopic studies of electrochemical energy storage devices, J. Appl. Crystallogr., 2016, 49(5), 1665–1673, DOI:10.1107/S1600576716012632; J. M. Stratford, M. Mayo, P. K. Allan, O. Pecher, O. J. Borkiewicz, K. M. Wiaderek, K. W. Chapman, C. J. Pickard, A. J. Morris and C. P. Grey, Investigating Sodium Storage Mechanisms in Tin Anodes: A Combined Pair Distribution Function Analysis, Density Functional Theory, and Solid-State NMR Approach, J. Am. Chem. Soc., 2017, 139(21), 7273–7286, DOI:10.1021/jacs.7b01398; M. Diaz-Lopez, G. L. Cutts, P. K. Allan, D. S. Keeble, A. Ross, V. Pralong, G. Spiekermann and P. A. Chater, Fast operando X-ray pair distribution function using the DRIX electrochemical cell, J. Synchrotron Radiat., 2020, 27(5), 1190–1199, DOI:10.1107/S160057752000747X; J. Stratford, M. Mayo, P. Allan, O. Pecher, O. Borkiewicz, K. Wiaderek, K. Chapman, C. Pickard, A. Morris and C. Grey, Investigating Sodium Storage Mechanisms in Tin Anodes: A Combined Pair Distribution Function Analysis, Density Functional Theory and Solid-State NMR Approach, J. Am. Chem. Soc., 2017, 139(21), 7273–7286, DOI:10.1021/jacs.7b01398; K. M. Wiaderek, O. J. Borkiewicz, E. Castillo-Martínez, R. Robert, N. Pereira, G. G. Amatucci, C. P. Grey, P. J. Chupas and K. W. Chapman, Comprehensive Insights into the Structural and Chemical Changes in Mixed-Anion FeOF Electrodes by Using Operando PDF and NMR Spectroscopy, J. Am. Chem. Soc., 2013, 135(10), 4070–4078, DOI:10.1021/ja400229v; D. Zeng, J. Cabana, J. Bréger, W.-S. Yoon and C. P. Grey, Cation Ordering in Li[NixMnxCo(1−2x)]O2-Layered Cathode Materials: A Nuclear Magnetic Resonance (NMR), Pair Distribution Function, X-ray Absorption Spectroscopy, and Electrochemical Study, Chem. Mater., 2007, 19(25), 6277–6289, DOI:10.1021/cm702241a; A. Ulvestad, M. O. Skare, C. E. Foss, H. Krogsæter, J. F. Reichstein, T. J. Preston, J. P. Mæhlen, H. F. Andersen and A. Y. Koposov, Stoichiometry-Controlled Reversible Lithiation Capacity in Nanostructured Silicon Nitrides Enabled by in Situ Conversion Reaction, ACS Nano, 2021, 15(10), 16777–16787, DOI:10.1021/acsnano.1c06927; J. K. Mathiesen, R. Väli, M. Härmas, E. Lust, J. Fold von Bülow, K. M. Ø. Jensen and P. Norby, Following the in-plane disorder of sodiated hard carbon through operando total scattering, J. Mater. Chem. A, 2019, 7(19), 11709–11717, 10.1039/C9TA02413A.
- B. Key, M. Morcrette, J.-M. Tarascon and C. P. Grey, Pair Distribution Function Analysis and Solid State NMR Studies of Silicon Electrodes for Lithium Ion Batteries: Understanding the (De)lithiation Mechanisms, J. Am. Chem. Soc., 2011, 133(3), 503–512, DOI:10.1021/ja108085d.
- J. Sottmann, M. Di Michiel, H. Fjellvåg, L. Malavasi, S. Margadonna, P. Vajeeston, G. B. M. Vaughan and D. S. Wragg, Chemical Structures of Specific Sodium Ion Battery Components Determined by Operando Pair Distribution Function and X-ray Diffraction Computed Tomography, Angew. Chem., Int. Ed., 2017, 56(38), 11385–11389, DOI:10.1002/anie.201704271.
- S. D. M. Jacques, M. Di Michiel, S. A. J. Kimber, X. Yang, R. J. Cernik, A. M. Beale and S. J. L. Billinge, Pair distribution function computed tomography, Nat. Commun., 2013, 4(1), 2536, DOI:10.1038/ncomms3536.
- G. Harding, J. Kosanetzky and U. Neitzel, X-ray diffraction computed tomography, Med. Phys., 1987, 14(4), 515–525, DOI:10.1118/1.596063.
- D. P. Finegan, A. Vamvakeros, C. Tan, T. M. M. Heenan, S. R. Daemi, N. Seitzman, M. Di Michiel, S. Jacques, A. M. Beale and D. J. L. Brett, et al., Spatial quantification of dynamic inter and intra particle crystallographic heterogeneities within lithium ion electrodes, Nat. Commun., 2020, 11(1), 631, DOI:10.1038/s41467-020-14467-x.; D. P. Finegan, A. Vamvakeros, L. Cao, C. Tan, T. M. M. Heenan, S. R. Daemi, S. D. M. Jacques, A. M. Beale, M. Di Michiel and K. Smith, et al., Spatially Resolving Lithiation in Silicon–Graphite Composite Electrodes via in Situ High-Energy X-ray Diffraction Computed Tomography, Nano Lett., 2019, 19(6), 3811–3820, DOI:10.1021/acs.nanolett.9b00955; K. M. Ø. Jensen, X. Yang, J. V. Laveda, W. G. Zeier, K. A. See, M. D. Michiel, B. C. Melot, S. A. Corr and S. J. L. Billinge, X-Ray Diffraction Computed Tomography for Structural Analysis of Electrode Materials in Batteries, J. Electrochem. Soc., 2015, 162(7), A1310–A1314, DOI:10.1149/2.0771507jes; S. R. Daemi, C. Tan, A. Vamvakeros, T. M. M. Heenan, D. P. Finegan, M. Di Michiel, A. M. Beale, J. Cookson, E. Petrucco and J. S. Weaving, et al., Exploring cycling induced crystallographic change in NMC with X-ray diffraction computed tomography, Phys. Chem. Chem. Phys., 2020, 22(32), 17814–17823, 10.1039/D0CP01851A; G. Tonin, G. B. M. Vaughan, R. Bouchet, F. Alloin, M. Di Michiel and C. Barchasz, Operando investigation of the lithium/sulfur battery system by coupled X-ray absorption tomography and X-ray diffraction computed tomography, J. Power Sources, 2020, 468, 228287, DOI:10.1016/j.jpowsour.2020.228287; H. Liu, S. Kazemiabnavi, A. Grenier, G. Vaughan, M. Di Michiel, B. J. Polzin, K. Thornton, K. W. Chapman and P. J. Chupas, Quantifying Reaction and Rate Heterogeneity in Battery Electrodes in 3D through Operando X-ray Diffraction Computed Tomography, ACS Appl. Mater. Interfaces, 2019, 11(20), 18386–18394, DOI:10.1021/acsami.9b02173; D. Matras, T. E. Ashton, H. Dong, M. Mirolo, I. Martens, J. Drnec, J. A. Darr, P. D. Quinn, S. D. M. Jacques and A. M. Beale, et al., Emerging chemical heterogeneities in a commercial 18650 NCA Li-ion battery during early cycling revealed by synchrotron X-ray diffraction tomography, J. Power Sources, 2022, 539, 231589, DOI:10.1016/j.jpowsour.2022.231589.
- A. Ruud, J. Sottmann, P. Vajeeston and H. Fjellvåg, Operando investigations of lithiation and delithiation processes in a BiVO4 anode material, Phys. Chem. Chem. Phys., 2018, 20(47), 29798–29803, 10.1039/C8CP05330H.
- G. B. M. Vaughan, R. Baker, R. Barret, J. Bonnefoy, T. Buslaps, S. Checchia, D. Duran, F. Fihman, P. Got and J. Kieffer, et al., ID15A at the ESRF - a beamline for high speed operando X-ray diffraction, diffraction tomography and total scattering, J. Synchrotron Radiat., 2020, 27(2), 515–528, DOI:10.1107/S1600577519016813.
- A. Coelho, TOPAS and TOPAS-Academic: an optimization program integrating computer algebra and crystallographic objects written in C++, J. Appl. Crystallogr., 2018, 51(1), 210–218, DOI:10.1107/S1600576718000183; A. A. Coelho, P. A. Chater and A. Kern, Fast synthesis and refinement of the atomic pair distribution function, J. Appl. Crystallogr., 2015, 48(3), 869–875, DOI:10.1107/S1600576715007487.
- E. Zintl and G. Brauer, Konstitution der Lithium-Wismut-Legierungen: 14. Mitteilung über Metalle u. Legierungen, Z. Elektrochem. Angew. Phys. Chem., 1935, 41(5), 297–303, DOI:10.1002/bbpc.19350410514.
- P. Cucka and C. S. Barrett, The crystal structure of Bi and of solid solutions of Pb, Sn, Sb and Te in Bi, Acta Crystallogr., 1962, 15(9), 865–872, DOI:10.1107/S0365110X62002297.
- J. V. Handy, Y. Luo, J. L. Andrews, N. Bhuvanesh and S. Banerjee, An Atomic View of Cation Diffusion Pathways from Single-Crystal Topochemical Transformations, Angew. Chem., Int. Ed., 2020, 59(38), 16385–16392, DOI:10.1002/anie.202005513.
- K. W. R. Gilkes, P. H. Gaskell and J. Robertson, Comparison of neutron-scattering data for tetrahedral amorphous carbon with structural models, Phys. Rev. B: Condens. Matter Mater. Phys., 1995, 51(18), 12303–12312, DOI:10.1103/PhysRevB.51.12303.
- A. Brennhagen, C. Cavallo, D. S. Wragg, P. Vajeeston, A. O. Sjåstad, A. Y. Koposov and H. Fjellvåg, Operando XRD studies on Bi2MoO6 as anode material for Na-ion batteries, Nanotechnology, 2022, 33, 185402, DOI:10.1088/1361-6528/ac4eb5.
- J. Qian, X. Wu, Y. Cao, X. Ai and H. Yang, High Capacity and Rate Capability of Amorphous Phosphorus for Sodium Ion Batteries, Angew. Chem., Int. Ed., 2013, 52(17), 4633–4636, DOI:10.1002/anie.201209689.
- A. Ruud, J. Sottmann, P. Vajeeston and H. Fjellvåg, Direct observation of reversible conversion and alloying reactions in a Bi2(MoO4)3-based lithium-ion battery anode, J. Mater. Chem. A, 2019, 7(30), 17906–17913, 10.1039/C9TA03459E.
- J. Sottmann, R. Homs-Regojo, D. S. Wragg, H. Fjellvag, S. Margadonna and H. Emerich, Versatile electrochemical cell for Li/Na-ion batteries and high-throughput setup for combined operando X-ray diffraction and absorption spectroscopy, J. Appl. Crystallogr., 2016, 49(6), 1972–1981, DOI:10.1107/S160057671601428X.
- J. Sottmann, F. L. M. Bernal, K. V. Yusenko, M. Herrmann, H. Emerich, D. S. Wragg and S. Margadonna, In operando Synchrotron XRD/XAS Investigation of Sodium Insertion into the Prussian Blue Analogue Cathode Material Na1.32Mn[Fe(CN)6]0.83·z H2O, Electrochim. Acta, 2016, 200, 305–313, DOI:10.1016/j.electacta.2016.03.131.
- J. Sottmann, M. Herrmann, P. Vajeeston, Y. Hu, A. Ruud, C. Drathen, H. Emerich, H. Fjellvåg and D. S. Wragg, How Crystallite Size Controls the Reaction Path in Nonaqueous Metal Ion Batteries: The Example of Sodium Bismuth Alloying, Chem. Mater., 2016, 28(8), 2750–2756, DOI:10.1021/acs.chemmater.6b00491.
- J. Kieffer and D. Karkoulis, PyFAI, a versatile library for azimuthal regrouping, J. Phys.: Conf. Ser., 2013, 425(20), 202012, DOI:10.1088/1742-6596/425/20/202012.
Footnotes |
| † Electronic supplementary information (ESI) available. See DOI: https://doi.org/10.1039/d2cp03892g |
| ‡ Current address: Bellona Holdings, Henrik Ibsens Gate 100, 0255 Oslo, Norway. |
| § Current address: Nordic Institute of Dental Materials, Sognsveien 70 A, 0855 OSLO, Norway. |
| ¶ Current address: Institute for Energy Technology (IFE), Instituttveien 18, 2007, Kjeller, Norway. |
| || Current address: Cenate AS, Rakkestadveien 1, 1814 Askim, Norway. |
| This journal is © the Owner Societies 2022 |