
Ionization potentials of MgN (N = 7–56) clusters formed by spontaneous collapse of magnesium foam in helium nanodroplets
Lev
Kazak†
 a,
Karl-Heinz
Meiwes-Broer
ab and
Josef
Tiggesbäumker
*ab
a,
Karl-Heinz
Meiwes-Broer
ab and
Josef
Tiggesbäumker
*ab
aInstitute of Physics, University of Rostock, 18059, Rostock, Germany. E-mail: josef.tiggesbaeumker@uni-rostock.de
bDepartment “Life, Light and Matter”, University of Rostock, 18059, Rostock, Germany
First published on 22nd September 2022
Abstract
The ionization potentials of magnesium clusters (MgN, N = 7–56) are determined by doping ultracold helium nanodroplets (HeM, M ≈ 52![[thin space (1/6-em)]](https://www.rsc.org/images/entities/char_2009.gif) 000) with Mg atoms. Inspecting the particle size distributions resulting from non-resonant, short-wavelength, single-photon ionization gives evidence that beyond a certain ensemble size, the developing foam structure undergoes a spontaneous collapse on the way to the laser interaction region. As a result, hot Mg clusters form in the relaxation process. The spontaneous collapse manifests in a substantial change in the size distributions, when recording mass spectra at wavelengths shorter than 272 nm. Tracing individual MgN signals as a function of laser photon energy allows extraction of size-specific ionization potentials, which for small clusters show a good agreement with results obtained from density functional theory simulations. The further development is compared to calculations based on the liquid drop model. However, even when quantum effects are included, the simple scaling law is not able to reproduce the development of the ionization potentials. The results suggest that small neutral magnesium clusters behave as non-metallic. The comparison to electron affinities and band gaps obtained from photoemission experiments on MgN− provides information on the charge state dependence of the non-metal-to-metal transition and properties like the Mulliken electron negativity.
000) with Mg atoms. Inspecting the particle size distributions resulting from non-resonant, short-wavelength, single-photon ionization gives evidence that beyond a certain ensemble size, the developing foam structure undergoes a spontaneous collapse on the way to the laser interaction region. As a result, hot Mg clusters form in the relaxation process. The spontaneous collapse manifests in a substantial change in the size distributions, when recording mass spectra at wavelengths shorter than 272 nm. Tracing individual MgN signals as a function of laser photon energy allows extraction of size-specific ionization potentials, which for small clusters show a good agreement with results obtained from density functional theory simulations. The further development is compared to calculations based on the liquid drop model. However, even when quantum effects are included, the simple scaling law is not able to reproduce the development of the ionization potentials. The results suggest that small neutral magnesium clusters behave as non-metallic. The comparison to electron affinities and band gaps obtained from photoemission experiments on MgN− provides information on the charge state dependence of the non-metal-to-metal transition and properties like the Mulliken electron negativity.
1 Introduction
The studies on nanoscaled systems have attracted considerable interest due to the various possibilities to modify the physical and chemical properties of matter nearly at will by simply changing size and compositions.1–6 Examples of nanoparticle-based applications are numerous, e.g., catalysis,7 magnetism,8 combustion,9 solar cells,10 and sensor technology.11 In order to steer the functionality towards predetermined directions, it is essential to reduce the complexity and first characterize the particle properties as far as possible. This bottom-up approach has been quite successful in different research areas, e.g., multiply charged anions in the condensed phase12 or plasmonic materials.13 In this context, clusters in a molecular beam represent a prominent model system to study the evolution of material properties in the size range between the atom and the bulk. In view of a versatile application range, the quantum size regime is extremely interesting since the material response may change substantially with the number of atoms.14 Hence, size selectivity may be crucial for further technological development.Helium nanodroplets15–19 provide a manifold of opportunities to study model systems built from atoms and molecules under specific conditions, i.e., at 0.37 K temperatures.20 Its ultracold and superfluid nature allows foreign particles to enter the droplets21 and effectively cool down. The number of particles that enter the droplet can be controlled with good precision. The weakly interacting environment also results in only a slight perturbation of the electronic structure of the impurity.22 Accumulation of atoms and molecules in the droplet, therefore, not only leads to cluster growth but also to the formation of ensembles far from equilibrium.23,24 The ultracold conditions also allow for ultracold chemistry25 and the targeted isolation of clusters from highly reactive species.26
A corresponding example that is also at the center of this work is magnesium, which for a small number of atoms in helium droplets, forms a foam.27 The ensemble consists of a 1 nm spaced network of Mg,28 whereas the atoms are separated by helium. Up to a certain foam size, the formation is found to be quite robust with respect to doping level and droplet size. Moreover, the spectroscopic signature obtained in the vicinity of the foam resonance λfoam = 282.5 nm, i.e., at wavelengths between 276 and 286 nm, shows that the electronic and optical properties of the ensembles are almost atom-like, as demonstrated by resonant two-photon ionization in the vicinity of the atomic 31P1 ← 31S0 transition.27 Pump–probe measurements reveal that upon optical excitation, the foam collapses on a ps time scale, resulting in the formation of regular clusters MgN+.29 The development of the photoelectron spectra as a function of doping allows to determine the foam stability limit, i.e., the maximum number of Mg impurities that can be embedded in the droplets and form a foam on the time scale of the experiment.30
The present work focuses on mass spectroscopy of Mg-doped droplets beyond the foam stability limit, i.e., at a high doping level. The characteristic mass spectrometric patterns indicate that compact magnesium clusters are formed in a process of spontaneous foam collapse. From the mass distributions collected at different wavelengths, the ionization potentials of individual magnesium clusters are extracted and compared to theory.
2 Experimental setup
Details on the experimental setup to conduct ion26 and electron31 spectroscopy on doped helium nandroplets are described elsewhere.32 Briefly, helium nanodroplets are produced by supersonic expansion of cold helium gas through a 5 μm diameter nozzle into the vacuum. The chosen temperature Ts = 9.8 K and stagnation pressure Ps = 20 bar correspond to a mean droplet size of![[M with combining macron]](https://www.rsc.org/images/entities/i_char_004d_0304.gif) = 5.2 × 10⁴ atoms. After formation and passing a differential pumping stage, the droplet beam enters the pick-up chamber, which houses a resistively heated oven filled with magnesium. The partial pressure of Mg vapor varies with temperature and allows to control the average number of atoms
= 5.2 × 10⁴ atoms. After formation and passing a differential pumping stage, the droplet beam enters the pick-up chamber, which houses a resistively heated oven filled with magnesium. The partial pressure of Mg vapor varies with temperature and allows to control the average number of atoms ![[N with combining macron]](https://www.rsc.org/images/entities/i_char_004e_0304.gif) captured by the droplets. Downstream, the molecular beam transverses the interaction region of a reflectron time-of-flight mass spectrometer, where the droplets are exposed to pulses from a tunable laser system. The tuning range allows to select wavelengths down to λL = 221 nm (photon energy EL = 5.61 eV). The system operates at a repetition rate of 1 kHz with a pulse length of 10 ns and pulse energies up to 5 μJ depending on wavelength.
captured by the droplets. Downstream, the molecular beam transverses the interaction region of a reflectron time-of-flight mass spectrometer, where the droplets are exposed to pulses from a tunable laser system. The tuning range allows to select wavelengths down to λL = 221 nm (photon energy EL = 5.61 eV). The system operates at a repetition rate of 1 kHz with a pulse length of 10 ns and pulse energies up to 5 μJ depending on wavelength.
3 Results
The foam resonance have been identified to center at a wavelength of λfoam = 282.5 nm.27 For a droplet size of = 5.2 × 10⁴, the characteristic photoelectron emission from the foam30 (not shown here) maximizes at a mean doping of30 = 26. This comes along with a corresponding characteristic ion signal, i.e., the corresponding mass spectrum (Fig. 1, top left panel) shows signals of Mg+ ions, MgN+ clusters with N up to 12, as well as a Mg+HeM snowball progression. The resulting distributions agree well with ref. 27 and represent a signature of foam being present before ionization occurs. At higher doping, the total ion yields decrease. In addition, the maximum in the MgN distribution shifts to smaller sizes. At doping levels far beyond the foam stability limit, e.g., Mg = 67 (bottom), almost no signals from clusters are detected. Only a weak monomer signal is present, which can be attributed to the presence of a small number of droplets still housing a foam. The decrease in the ion signals correlates with the absence of a characteristic signature in the electron spectrum.30
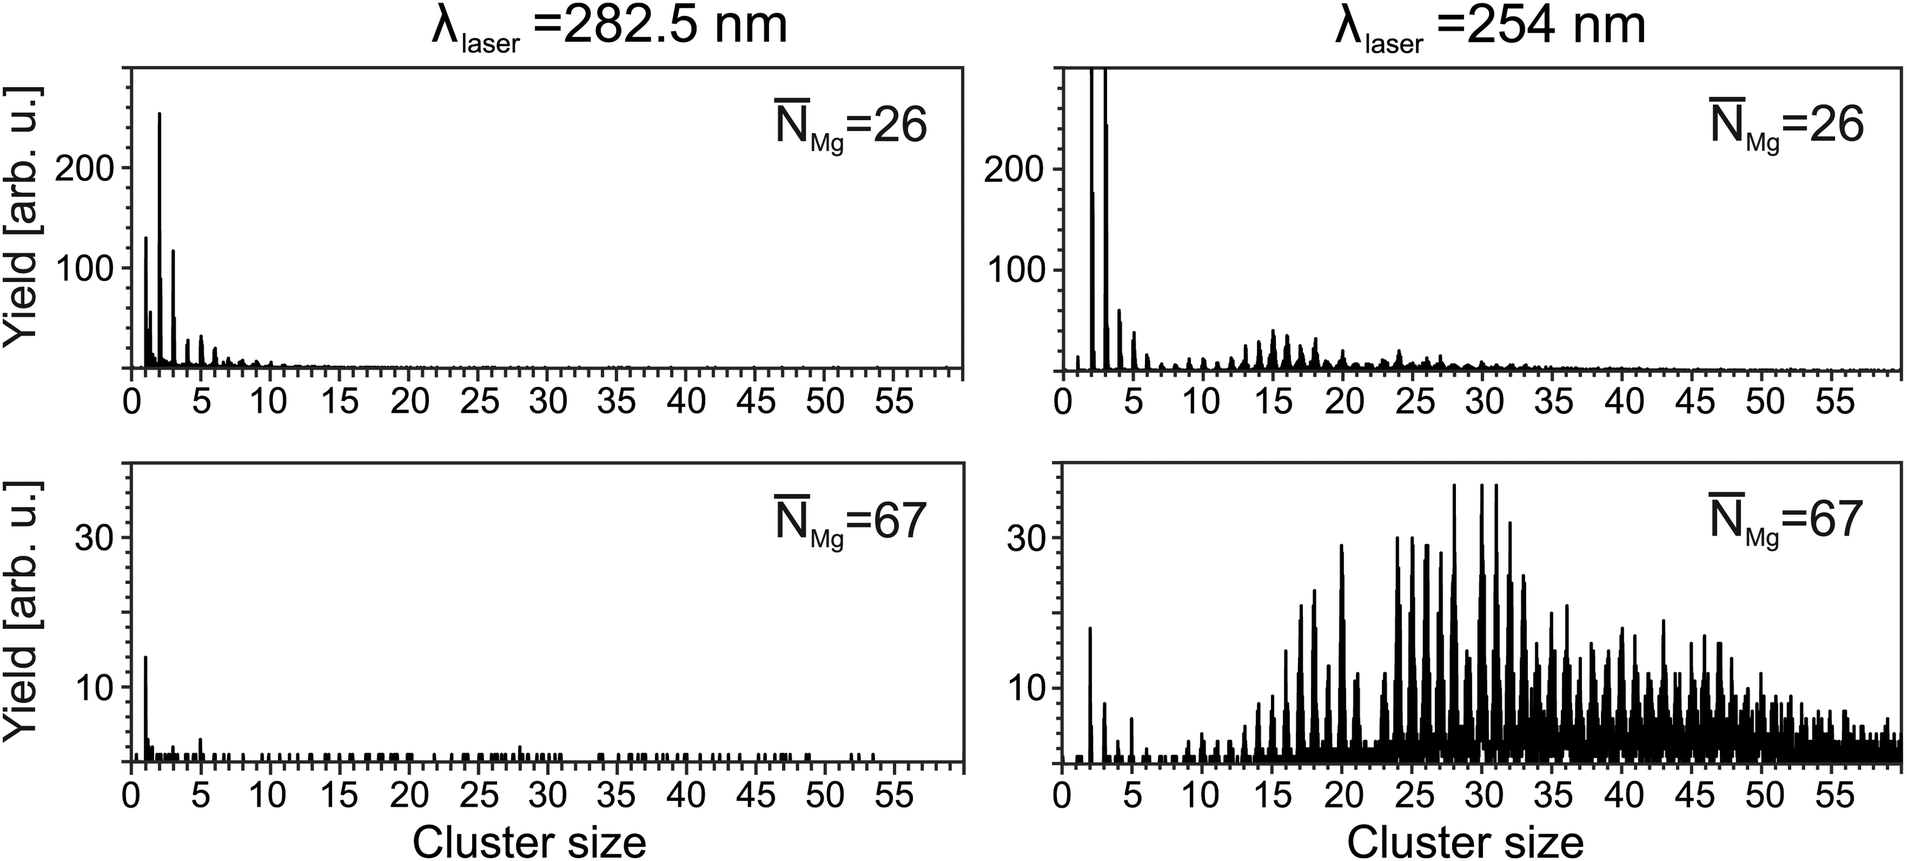 | ||
| Fig. 1 Mass spectra of magnesium doped droplets for different doping conditions and excitation wavelengths. Left: Distributions recorded using λfoam = 282.5 nm (4.39 eV) laser pulses. At low doping (top), ion snowballs and small clusters show up. For high doping conditions (bottom), almost no ionization signals are detected. Right: As left, but obtained at an excitation wavelength of λL = 254 nm (4.88 eV). Signals of small Mg clusters are obtained, whereas N = 15 shows the highest yield (top). With increasing doping, the size distribution shifts to larger clusters. At = 67, clusters as large as Mg56 are detected, (bottom). The substructure in the spectrum indicates on the fragmentation of clusters after ionization. | ||
In contrast to the distributions recorded at λfoam, the spectra obtained at shorter wavelengths show a different pattern. Fig. 1 (right) exemplarily shows results obtained at λL = 254 nm. For a doping level of Mg = 26, larger clusters with N up to 30 are detected. With further increase of the doping, the progression extends to larger sizes. For example, at = 67, clusters as large as N = 56 are present. Notably, the mass spectra show features, which have been obtained previously in laser and electron impact ionization experiments on MgNHeM (ref. 26), e.g., a considerable drop in the yield of Mg22+. At the same time, snowball complexes are no longer observed. Obviously, a different target is probed.
In order to verify whether different target systems are actually excited, the total yields of MgN+ have been extracted as a function of average doping for different laser wavelengths, see Fig. 2. The ion yield Yfoam (λfoam) increases with , maximizes at = 12 and drops beyond. In contrast, the yield at λL = 254 nm starts to rise at = 10, i.e., near Ymaxfoam and gradually increases with . At the highest doping, only signals resulting from excitation with 254 nm laser pulses are observed. This indicates that different targets are probed upon short wavelength irradiation. Hence, the recorded distributions are assigned to signals of regular magnesium clusters formed upon spontaneous foam collapse. Under these conditions, mass spectra are recorded for laser wavelengths between 221 and 272 nm (4.56 eV≤ EL ≤ 5.61 eV). This procedure allows us to extract size-specific ion yields from the corresponding spectra, i.e., ionization efficiency curves. Exemplary findings for Mg14+ and Mg29+ are presented in Fig. 3. Generally, one finds that the signals first gradually increase with photon energy and then level off at a size-dependent certain level.
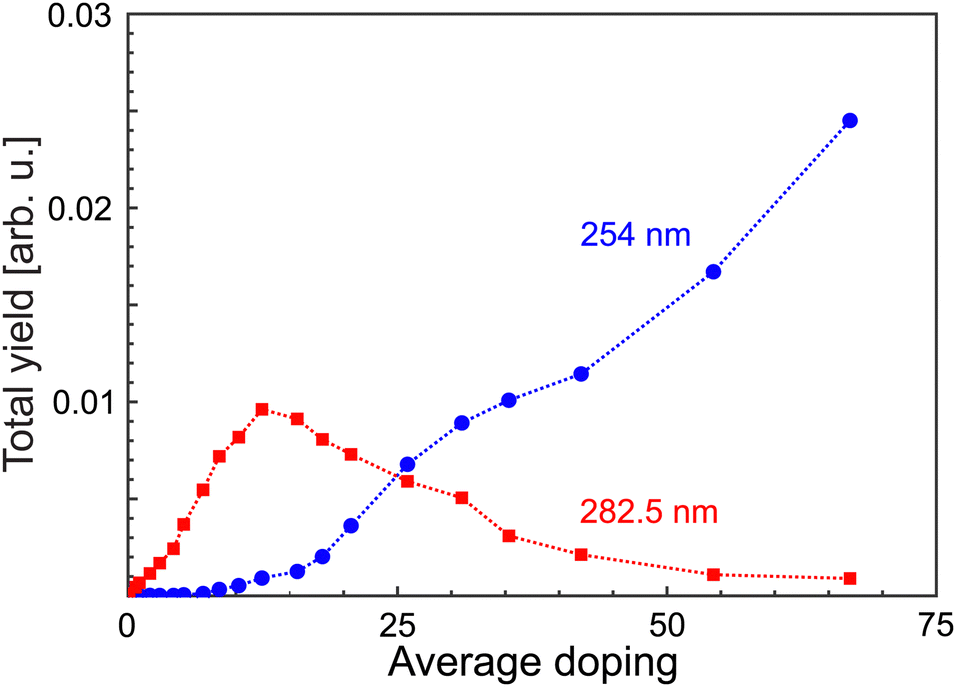 | ||
| Fig. 2 Total ion yields as function of average doping for wavelengths as indicated. The development of the signals indicates that at the different wavelengths, different targets are probed. The dotted lines are used to guide the eyes. | ||
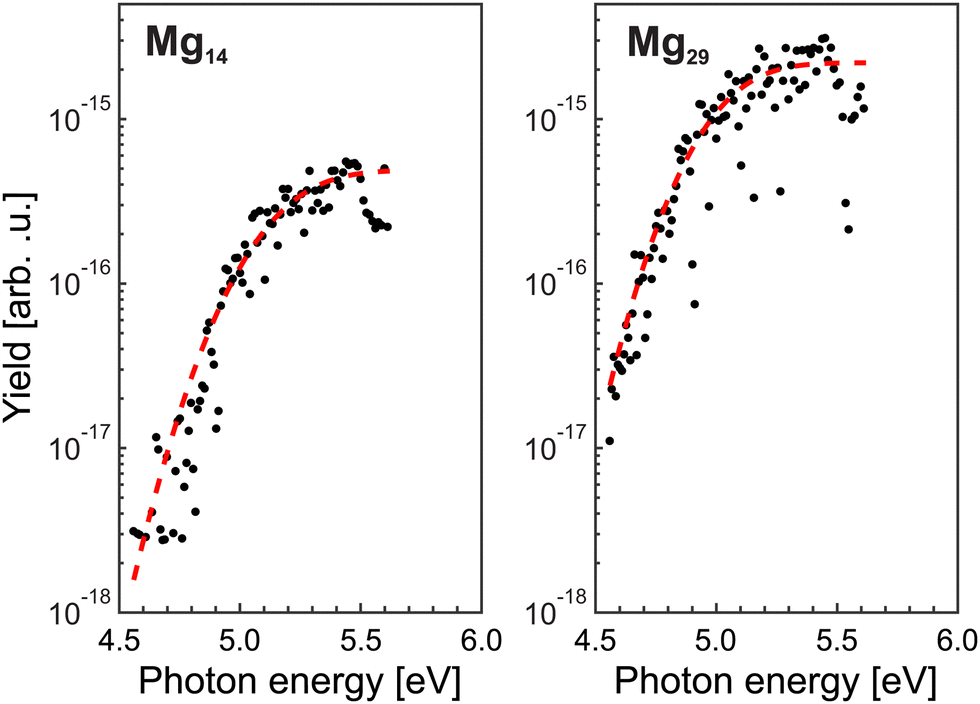 | ||
| Fig. 3 Ionization efficiency curves for selected cluster sizes (black •: experimental data; red lines: fit curve), see text for details. The ion yields are normalized with respect to the laser pulse energy. Note the logarithmic scale. | ||
4 Discussion
Assuming that cluster ions are only produced through a single-photon absorption process, the ionization efficiency dependence (Fig. 3) can be used to determine the ionization potentials IP. The corresponding values can be extracted by applying a method based on a fit procedure utilizing an error function:33–35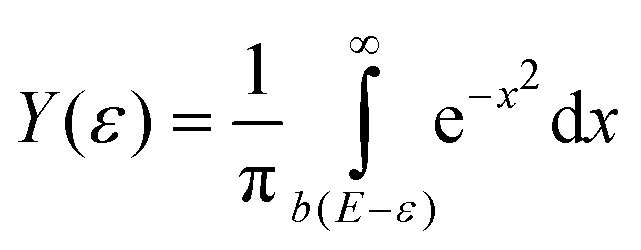 | (1) |
Limited by the maximum laser photon energy of EmaxL = 5.61 eV, ionization signals leading to convincing ionization efficiency curves can be obtained for N ≥ 7. For Mg5 and Mg6, an increase of the yields close to EmaxL is observed. However, the number of data points is not sufficient to extract the corresponding IP. We assume that these clusters have an IP of about 5.6 eV. The resulting IP values of the larger cluster up to Mg56 are shown in Fig. 4 (black circles). The values of IPN decrease with size. Between 7≤ N ≤18, IPN exhibits a marked change and drops from IP7 = 5.38 eV to IP18 = 5.00 eV. Beyond, IPN levels out and achieves a value of 4.87 eV for Mg56. We notice substantial differences in the values of the IP as a function of size, e.g., comparatively high ionization potentials for N = 16, 17.
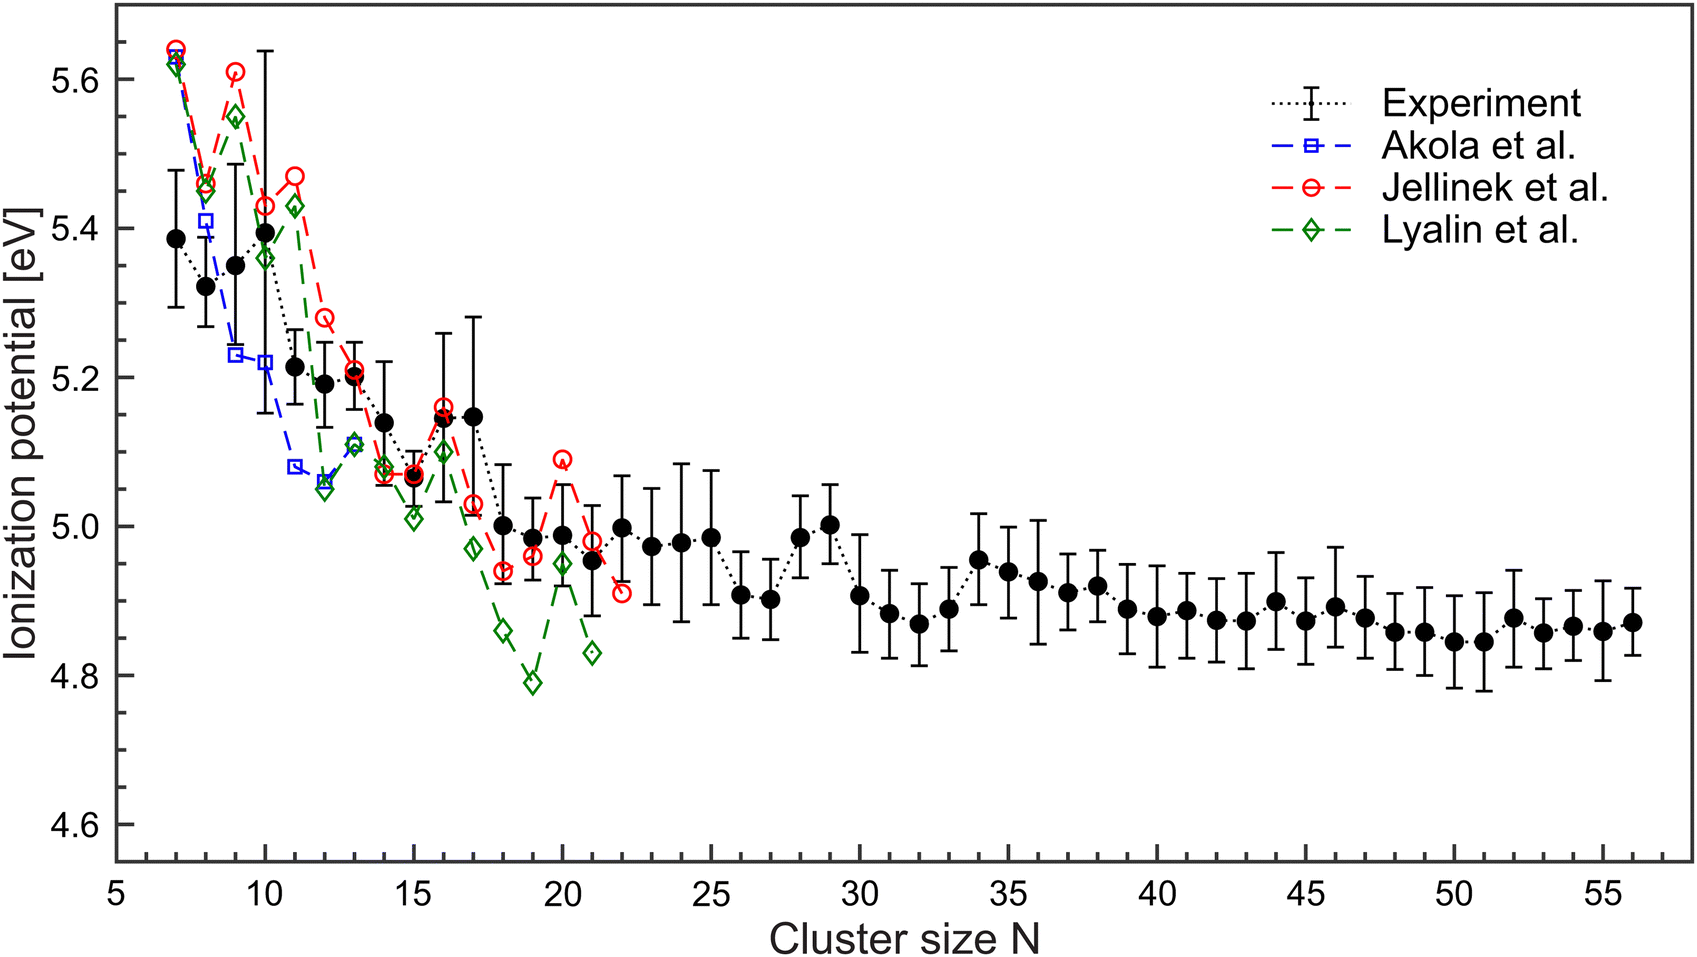 | ||
| Fig. 4 Ionization potentials of MgN in the size range N = 7–56 (black •) extracted from the ionization efficiency curves. DFT-calculations on MgN have been conducted by Akola et al.36 (blue □), Jellinek et al.37 (red °) and Lyalin et al.38 (green ◇). Lines are used to guide the eyes. | ||
The ionization potentials of magnesium clusters (N ≤ 22) have been studied by density functional theory (DFT), and a reasonably good agreement is found.36–39 Specific details, however are not reproduced, see Fig. 4. For example, the experiment provides no evidence for exceptional high IPs of N = 7, 9, and 11. Such an oscillatory behavior of IPN was assigned to the interplay between electronic and geometrical effects,38 meaning that the cluster geometry could play a significant role. For example, the calculated lowest energy geometries differ between ref. 36–38 which leads to a difference in the corresponding IP of N = 7, 9, 11. In the spontaneous collapse of the foam, a high energy release is expected. Therefore, several scenarios are feasible. Helium cooling is (i) effective and there is a high probability that the systems find their way to the ground state. (ii) ineffective and the resulting structures are different from the lowest energy geometries. Hence, different isomers contribute to the ion signals (iii) There is a smooth transition between (i) and (ii) since the energy release is size-dependent. An exceptional high IP of Mg10 has been obtained in early calculations on metallic MgN.40 It was found that due to the two valence electrons, the high IP of N = 10, 17, 20, 29, 34, and 46 result from electronic shell closings. Indeed, the corresponding values of the IPs are higher compared to neighboring clusters. However, when taking into account the error margins, the development of ionization potentials is smooth. Hence, presently one cannot draw conclusions on electronic shell closures in Mg clusters.
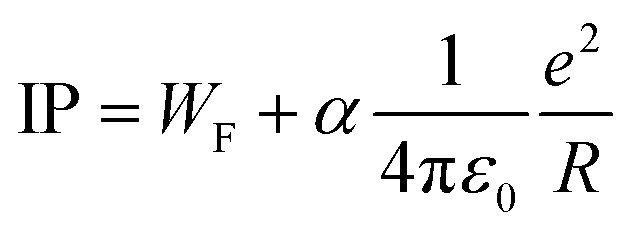
Ionization potentials have also been determined for clusters larger than treated by DFT, forcing us to study a possible nonmetal-to-metal transition as a function of size at a lower theoretical level. Experimentally, this transition takes place around N = 18–20, whereas evidence is based on cluster size distributions26 and size-specific band gaps of anionic clusters.42 Alternatively, the development of the ionization potentials can be analyzed in the context of the liquid drop model (LDM).43 The ionization potential is given by44
 | (2) |
:1/2]. The deviation from the of α from 1/2 stems from quantum effects, e.g., correlation and exchange energies.47
Fig. 5 shows a comparison of the experimental findings to ionization potentials calculated according to eqn (2). The experimental IPs follow a 1/R dependence. The values of α = 0.28 and WF = 4.28 eV, resulting from the fit procedure (magenta dashed line), deviate largely from the accepted values, i.e., α = 1/2 and WF = 3.66 eV.41 However, using these numbers (blue line) does not yield a convincing result either. Notably, already at N = 7, the IP is found to be lower than expected by the LDM. This finding suggests a substantial drop in the ionization potential from the atomic value of 7.65 eV already at small clusters. The observation that eqn (2) does not reflect the development of the IPs resembles results obtained on, e.g., transition metal clusters.49–51 In order to explain the differences to the LDM, the impact of quantum effects has been discussed on different levels of theory: (i) deviations of α within a range of [1/3:3/8].46,52,53 (ii) modifying R by including a possible electron spill-out.46,54 (iii) changes in the value of the bulk Wigner–Seitz radius.55 Considering these suggestions, e.g., α = 3/8 (red line), the agreement with the experimental data is still not satisfactory. The liquid drop approach thus fails and there is no evidence of metallic behavior MgN with N ≤ 56. One can assume that geometry plays a crucial role in this size range, which results in a substantial shift of the ionization potentials. Indeed, structure calculations56,57 reveal that MgN tends to arrange in an icosahedral geometry which differs from the bulk hcp structure.58 In fact, the actual structure as well as the temperature of the clusters, which are formed in the foam collapse, are currently unknown. It remains a challenging task to characterize the resulting structures in the experiment in order to make a direct comparison between theory and measurement.
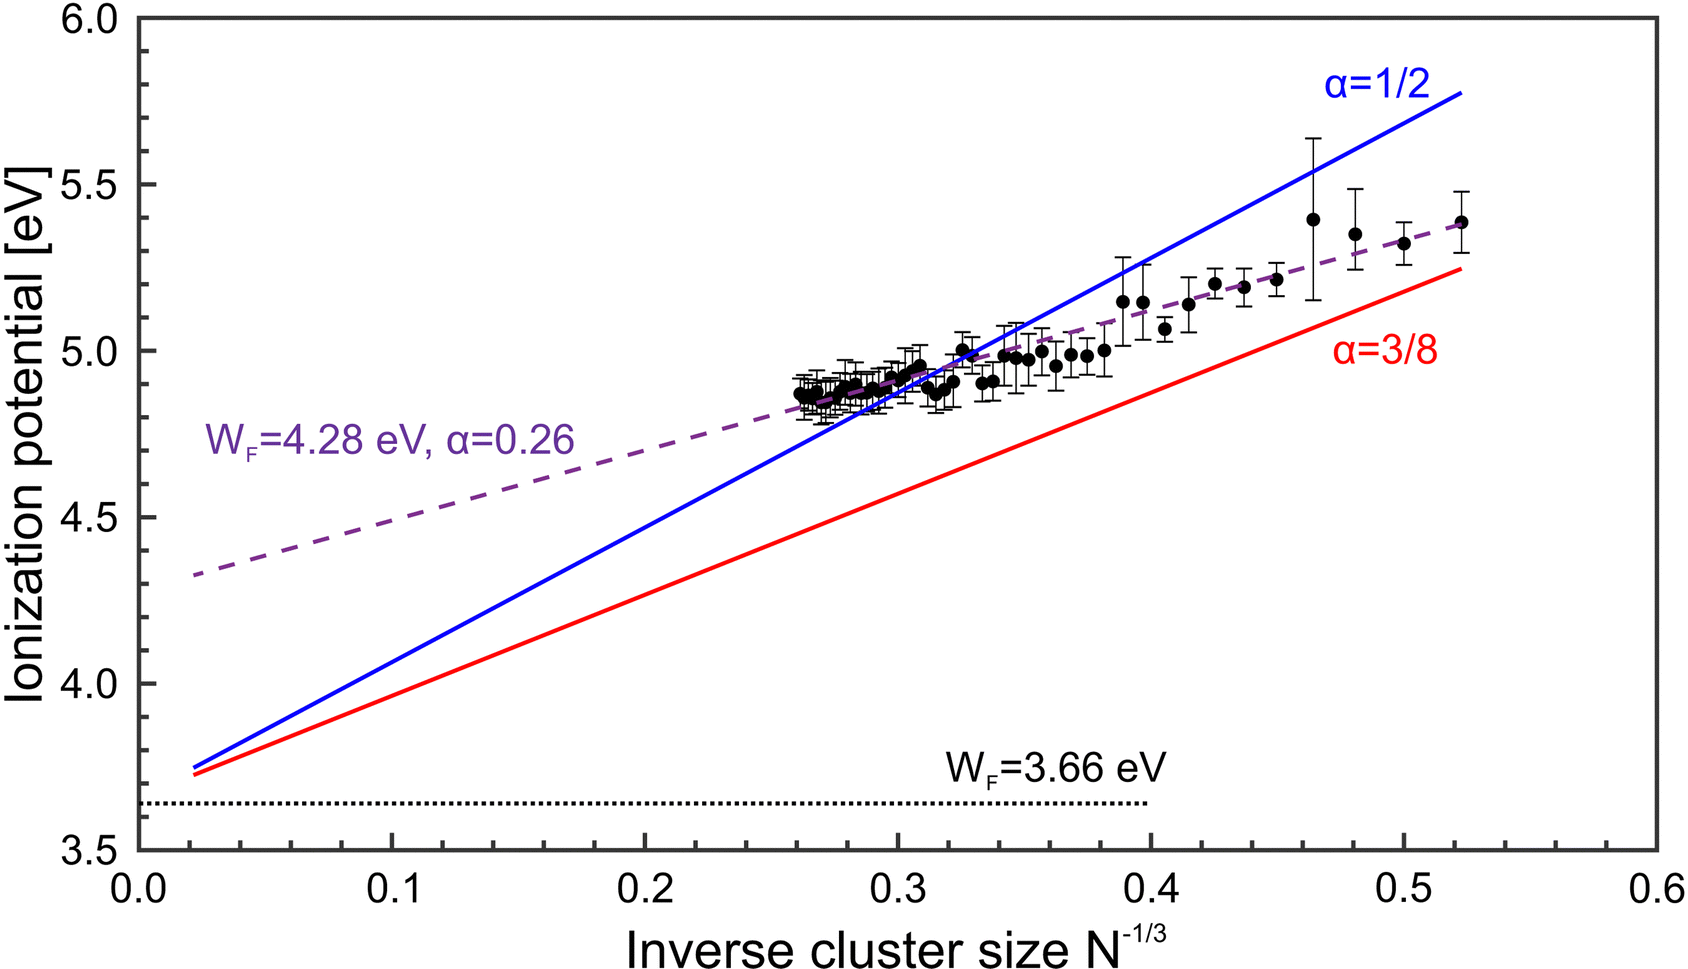 | ||
| Fig. 5 Magnesium cluster ionization potentials (IP, black •) as function of N−1/3. For comparison, results of the liquid drop model based on different fit parameter settings are included. Solid lines: Fit of the IPs by applying eqn (2), and α = 1/2 (blue) and α = 3/8 (red). Dashed line: Adjustment of eqn (2) to the data without any restrictions, giving values of WF = 4.28 eV and α = 0.26. The dotted line represents the magnesium bulk work function.41 | ||
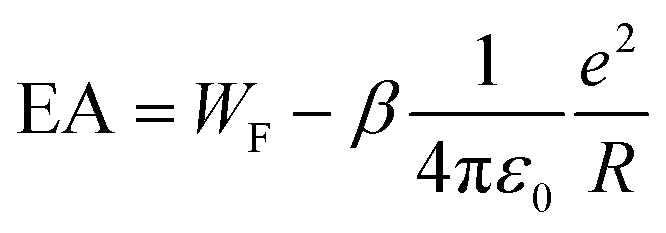
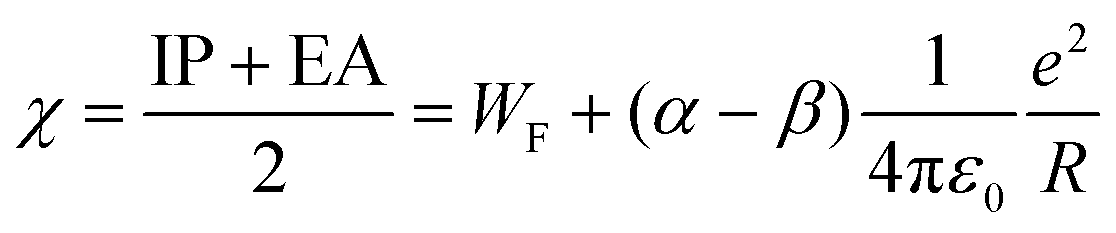
In order to clarify, we compare our results to electron affinities (EA) obtained by photoelectron spectroscopy on MgN−.42,48 Within the LDM, the EA can be calculated as
 | (3) |
:5/8],59 whereas the difference α–β is small for a given element. Fig. 6 shows a comparison of IP and EA as function of N−1/3, together with LDM calculations (α = 1/2), i.e.eqn (2) and (3). In contrast to the ionization potentials, the development of the electron affinities agrees well with the liquid drop model. This suggests that the nonmetal-to-metal transition in Mg cluster anions has already taken place. The findings on the EA are backed by an analysis of the band gap closure.42 Apparently, the charge state of the cluster plays a vital role in the development of electronic properties from the atom to the bulk.37 The trend in the development of the IPs gives a value of 4.28 eV for the bulk work function, i.e., far above the expected value of41 3.66 eV, see Fig. 5. Possibly, a clear metallic behavior only occurs in the case of significantly larger clusters.
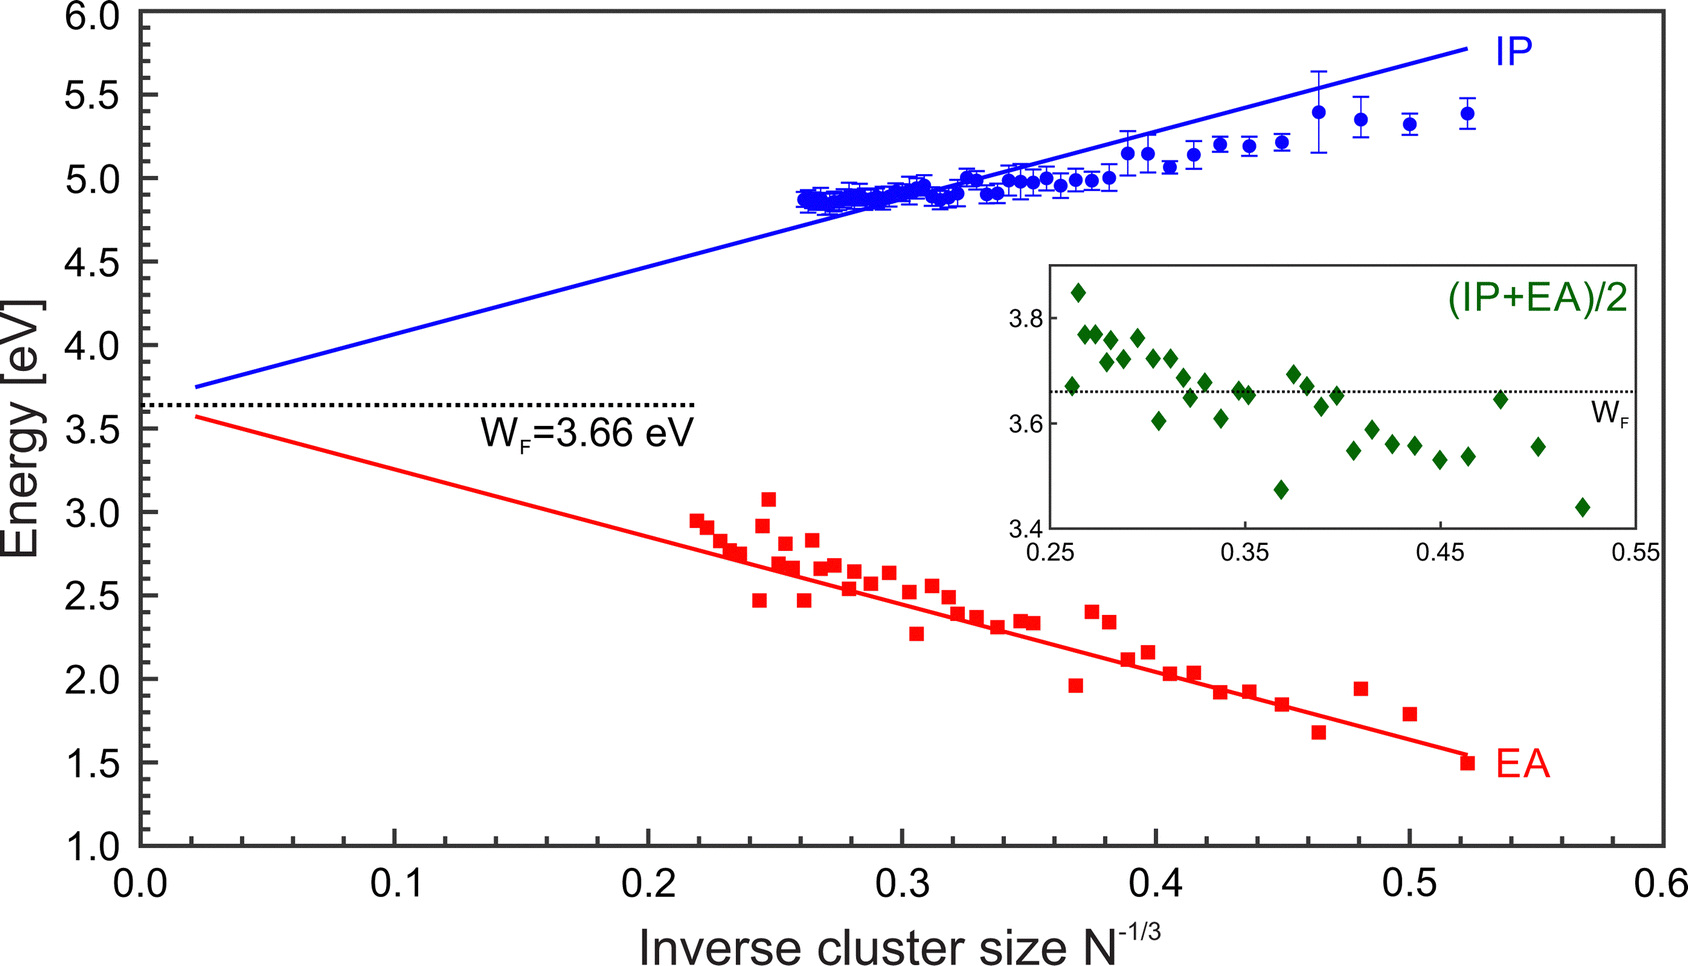 | ||
| Fig. 6 Ionization potentials (IP, blue ○), electron affinities (EA, black □), and Mulliken electronegativity (χ = (IP + EA)/2, green ◇) of MgN as a function of N−1/3. Lines corresponds to the liquid drop model (LDM) based on eqn (2) and (3) with α = β = 1/2. The black dotted line shows the bulk work function. The EAs have been taken from.42,48 | ||
In order to relate the IPs and EAs to properties being relevant for chemical purposes and applications, it is appealing to inspect parameters, which in first order can be derived from the potentials,44,54,60i.e., global hardness S, global softness η, chemical potential μ, and the Mulliken electronegativity χ = −μ.
 | (4) |
The electronegativity indicates the electron transfer direction between systems. The inset of Fig. 6 (green ◇) shows the resulting values. For small clusters, the χ values are initially low but gradually increase with size. Notably, the value of χ exceeds the WF at about N = 40. Hence, larger clusters show the enhanced ability to draw electrons toward themselves in bonding.
5 Conclusions
In conclusion, mass spectrometry studies on helium droplets, doped with magnesium atoms to ensemble sizes beyond the foam stability limit, reveal the formation of hot regular MgN clusters. Related ionization potentials of clusters have been determined by an analysis of the ionization efficiency curves. The development of the IPs as function of of N first shows a rapid drop for small clusters and then a smooth gradual decrease. The trend, however, shows deviations from predictions based on the liquid drop approach. The findings suggest that in contrast to MgN−, the IPs of MgN up to N = 56 cannot be described by the model, even when taking into account quantum effects like the electron spill-out. Increasing the size of the droplets will allow to extend the measurements to larger N, in order to pursuit the further development of ionization potentials and to identify trends in the electronic properties. Moreover, it will be an appealing task to investigate whether foams are still present in μm-sized helium droplets. Clarifying studies along this direction would open perspectives for single-shot X-ray diffraction experiments19 on these exotic ensembles.Conflicts of interest
There are no conflicts to declare.Acknowledgements
Main parts of the helium droplet machine were provided by J. P. Toennies and his group at the MPI Göttingen. S. Lochbrunner provided us with an OPO laser system. The Deutsche Forschungsgemeinschaft is gratefully acknowledged for financial support.References
- W. D. Knight, K. Clemenger, W. A. de Heer, W. A. Saunders, M. Y. Chou and M. L. Cohen, Phys. Rev. Lett., 1984, 52, 2141–2143 CrossRef CAS.
- J. Jortner, Z. Phys. D: At., Mol. Clusters, 1992, 24, 247–275 CrossRef CAS.
- W. A. de Heer, Rev. Mod. Phys., 1993, 65, 611–676 CrossRef CAS.
- J. A. Alonso, Chem. Rev., 2000, 100, 637–678 CrossRef CAS PubMed.
- C. Binns, Surf. Sci. Rep., 2001, 44, 1–49 CrossRef CAS.
- E. Roduner, Chem. Soc. Rev., 2006, 35, 583–592 RSC.
- M. Haruta, Gold Bull., 2004, 37, 27–36 CrossRef CAS.
- S. P. Gubin, Y. A. Koksharov, G. B. Khomutov and G. Y. Yurkov, Russ. Chem. Rev., 2005, 74, 489–520 CrossRef CAS.
- R. A. Yetter, G. A. Risha and S. F. Son, Proc. Combust. Inst., 2009, 32, 1819–1838 CrossRef CAS.
- S. Manzhos, G. Giorgi, J. Lüder and M. Ihara, Adv. Phys.: X, 2021, 6, 1908848 Search PubMed.
- A. Mathew and T. Pradeep, Part. Part. Syst. Charact., 2014, 31, 1017–1053 CrossRef CAS.
- X.-B. Wang and L.-S. Wang, Annu. Rev. Phys. Chem., 2009, 60, 105–126 CrossRef CAS PubMed.
- S. M. Morton, D. W. Silverstein and L. Jensen, Chem. Rev., 2011, 111, 3962–3994 CrossRef CAS PubMed.
- A. Sanchez, S. Abbet, U. Heiz, W.-D. Schneider, H. Häkkinen, R. N. Barnett and U. Landman, J. Phys. Chem. A, 1999, 103, 9573–9578 CrossRef CAS.
- J. P. Toennies and A. F. Vilesov, Angew. Chem., Int. Ed., 2004, 43, 2622–2648 CrossRef CAS.
- F. Stienkemeier and K. K. Lehmann, J. Phys. B: At., Mol. Opt. Phys., 2006, 39, R127 CrossRef CAS.
- M. Barranco, R. Guardiola, S. Hernández, R. Mayol, J. Navarro and M. Pi, J. Low Temp. Phys., 2006, 142, 1 CrossRef CAS.
- J. Tiggesbäumker and F. Stienkemeier, Phys. Chem. Chem. Phys., 2007, 9, 4748–4770 RSC.
- O. Gessner and A. F. Vilesov, Annu. Rev. Phys. Chem., 2019, 70, 173–198 CrossRef CAS PubMed.
- M. Hartmann, N. Pörtner, B. Sartakov, J. P. Toennies and A. Vilesov, J. Chem. Phys., 1999, 110, 5109–5123 CrossRef CAS.
- T. Gough, M. Mengel, P. Rowntree and G. Scoles, J. Chem. Phys., 1985, 83, 4958 CrossRef CAS.
- S. Grebenev, J.-P. Toennies and A. Vilesov, Science, 1998, 279, 2083–2085 CrossRef CAS.
- J. Higgins, C. Callegari, J. Reho, F. Stienkemeier, W. Ernst, K. Lehmann, M. Gutowski and G. Scoles, Science, 1996, 273, 629–631 CrossRef CAS.
- K. Nauta and R. Miller, Science, 1999, 283, 1895–1896 CrossRef CAS PubMed.
- L. Lundberg, P. Martini, M. Goulart, M. Gatchell, D. K. Bohme and P. Scheier, J. Am. Soc. Mass Spectrom., 2019, 30, 1906–1913 CrossRef CAS PubMed.
- T. Diederich, T. Döppner, J. Braune, J. Tiggesbäumker and K.-H. Meiwes-Broer, Phys. Rev. Lett., 2001, 86, 4807 CrossRef CAS PubMed.
- A. Przystawik, S. Göde, T. Döppner, J. Tiggesbäumker and K.-H. Meiwes-Broer, Phys. Rev. A: At., Mol., Opt. Phys., 2008, 78, 021202 CrossRef.
- A. Hernando, M. Barranco, R. Mayol, M. Pi and F. Ancilotto, Phys. Rev. B: Condens. Matter Mater. Phys., 2008, 78, 184515 CrossRef.
- S. Göde, R. Irsig, J. Tiggesbäumker and K.-H. Meiwes-Broer, New J. Phys., 2013, 15, 015026 CrossRef.
- L. Kazak, S. Göde, K.-H. Meiwes-Broer and J. Tiggesbäumker, J. Phys. Chem. A, 2019, 123, 5951–5956 CrossRef CAS PubMed.
- P. Radcliffe, A. Przystawik, T. Diederich, T. Döppner, J. Tiggesbäumker and K.-H. Meiwes-Broer, Phys. Rev. Lett., 2004, 92, 173403 CrossRef.
- A. Bartelt, J. Close, F. Federmann, N. Quaas and J. Toennies, Phys. Rev. Lett., 1996, 77, 3525 CrossRef CAS PubMed.
- H. G. Limberger and T. P. Martin, J. Chem. Phys., 1989, 90, 2979–2991 CrossRef CAS.
- H. Göhlich, T. Lange, T. Bergmann, U. Näher and T. Martin, Chem. Phys. Lett., 1991, 187, 67–72 CrossRef.
- M. Theisen, F. Lackner, G. Krois and W. E. Ernst, J. Phys. Chem. Lett., 2011, 2, 2778–2782 CrossRef CAS.
- J. Akola, K. Rytkönen and M. Manninen, Eur. Phys. J. D, 2001, 16, 21–24 CrossRef CAS.
- J. Jellinek and P. H. Acioli, J. Phys. Chem. A, 2002, 106, 10919–10925 CrossRef CAS.
- A. Lyalin, I. A. Solovyov, A. V. Solovyov and W. Greiner, Phys. Rev. A: At., Mol., Opt. Phys., 2003, 67, 063203 CrossRef.
- K. Duanmu, O. Roberto-Neto, F. B. C. Machado, J. A. Hansen, J. Shen, P. Piecuch and D. G. Truhlar, J. Phys. Chem. C, 2016, 120, 13275–13286 CrossRef CAS.
- M. Chou and M. Cohen, Phys. Lett., 1986, 113A, 420 CrossRef CAS.
- D. R. Lide, ed., CRC Handbook of Chemistry and Physics, CRC Press; Boca Raton, FL, 2005 Search PubMed.
- O. C. Thomas, W. Zheng, S. Xu and K. H. Bowen, Phys. Rev. Lett., 2002, 89, 213403 CrossRef.
- K. Rademann, B. Kaiser, U. Even and F. Hensel, Phys. Rev. Lett., 1987, 59, 2319–2321 CrossRef CAS PubMed.
- K.-H. Meiwes-Broer, Hyperfine Interact., 1994, 89, 263–270 CrossRef CAS.
- N. W. Ashcroft and N. D. Mermin, Solid State Physics, Saunders College Publishing, 1976 Search PubMed.
- B. von Issendorff and O. Cheshnovsky, Annu. Rev. Phys. Chem., 2005, 56, 549–580 CrossRef CAS.
- K. H. Meiwes-Broer, Hyperfine Interact., 1994, 89, 263–269 CrossRef CAS.
- O. Kostko, PhD thesis, University of Freiburg, 2007.
- M. B. Knickelbein, S. Yang and S. J. Riley, J. Chem. Phys., 1990, 93, 94–104 CrossRef CAS.
- S. Yang and M. B. Knickelbein, J. Chem. Phys., 1990, 93, 1533–1539 CrossRef CAS.
- A. Kaldor, D. M. Cox, D. J. Trevor and M. R. Zakin, Z. Phys. D: At., Mol. Clusters, 1986, 3, 195–204 CrossRef CAS.
- G. Wrigge, M. Astruc Hoffmann, B. von Issendorff and H. Haberland, Eur. Phys. J. D, 2003, 24, 23–26 CrossRef CAS.
- M. Seidl and M. Brack, Ann. Phys., 1996, 245, 275–310 CAS.
- J. P. Perdew, Phys. Rev. B: Condens. Matter Mater. Phys., 1988, 37, 6175–6180 CrossRef PubMed.
- M. A. Hoffmann, G. Wrigge and B. v Issendorff, Phys. Rev. B: Condens. Matter Mater. Phys., 2002, 66, 041404 CrossRef.
- A. Köhn, F. Weigend and R. Ahlrichs, Phys. Chem. Chem. Phys., 2001, 3, 711–719 RSC.
- I. Heidari, S. De, S. M. Ghazi, S. Goedecker and D. G. Kanhere, J. Phys. Chem. A, 2011, 115, 12307–12314 CrossRef CAS PubMed.
- P. Li, G. Gao, Y. Wang and Y. Ma, J. Phys. Chem. C, 2010, 114, 21745–21749 CrossRef CAS.
- M. Seidl, K.-H. Meiwes-Broer and M. Brack, J. Chem. Phys., 1991, 95, 1295–1303 CrossRef CAS.
- K. R. S. Chandrakumar, T. K. Ghanty and S. K. Ghosh, J. Phys. Chem. A, 2004, 108, 6661–6666 CrossRef CAS.
Footnote |
| † Present address: Institute for Quantum Optics, Ulm University, 89081 Ulm, Germany. |
| This journal is © the Owner Societies 2022 |