
 Open Access Article
 This Open Access Article is licensed under a Creative Commons Attribution-Non Commercial 3.0 Unported Licence
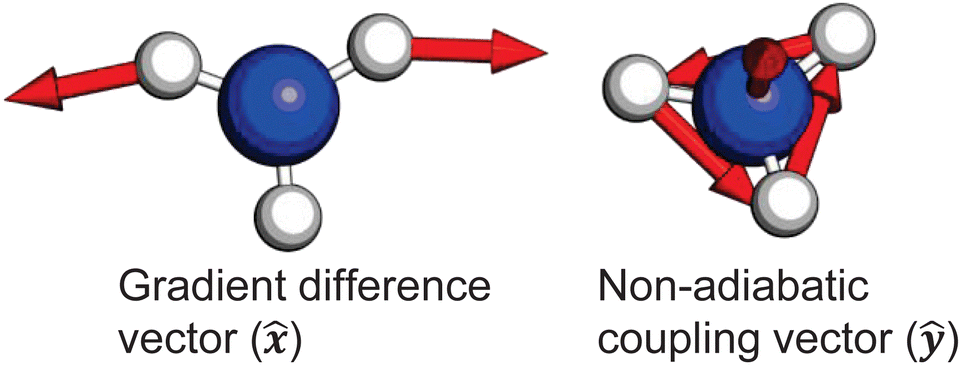
The ultrafast vibronic dynamics of ammonia's ![[D with combining tilde]](https://www.rsc.org/images/entities/h2_i_char_0044_0303.gif) state†
state†
Max D. J.
Waters
 * and
Hans Jakob
Wörner
* and
Hans Jakob
Wörner
Laboratory for Physical Chemistry, ETH Zürich, Vladimir-Prelog-Weg 2, 8093, Zürich, Switzerland. E-mail: max.waters@phys.chem.ethz.ch; Tel: +41 44 633 44 12
First published on 14th September 2022
Abstract
Using vacuum-ultraviolet time-resolved velocity map imaging of photoelectrons, we study ultrafast coupled electronic and nuclear dynamics in low-lying Rydberg states of ammonia. Vibrationally-resolved internal vibrational relaxation (IVR) is observed in a progression of the e′ bending modes. This vibrational progression is only observed in the ![[D with combining tilde]](https://www.rsc.org/images/entities/i_char_0044_0303.gif) state, and is lost upon ultrafast internal conversion to the
state, and is lost upon ultrafast internal conversion to the ![[C with combining tilde]](https://www.rsc.org/images/entities/i_char_0043_0303.gif) and
and ![[B with combining tilde]](https://www.rsc.org/images/entities/i_char_0042_0303.gif) electronic states. Due to the ultrashort time scale of the internal conversion (ca. 64 fs), and the vibronic resolution, the non-adiabatic coupling vectors are identified and verified with ab initio calculations. The time-scale of this IVR process is highly surprising and significant because IVR is usually treated as an incoherent process that proceeds statistically, according to a “Fermi's Golden Rule”-like model, where the process scales with the available degrees of freedom. Here, we show that it can be highly non-statistical, restricted to only a very small subset of vibrational motions.
electronic states. Due to the ultrashort time scale of the internal conversion (ca. 64 fs), and the vibronic resolution, the non-adiabatic coupling vectors are identified and verified with ab initio calculations. The time-scale of this IVR process is highly surprising and significant because IVR is usually treated as an incoherent process that proceeds statistically, according to a “Fermi's Golden Rule”-like model, where the process scales with the available degrees of freedom. Here, we show that it can be highly non-statistical, restricted to only a very small subset of vibrational motions.
1 Introduction
Ammonia is the prototypical amine, making it an ideal candidate for fundamental dynamical studies of sp3-hybridised nitrogen. Spectroscopic studies of ammonia often make heavy use of symmetry arguments, allowing observed behaviour to be rationalised without the need for expensive ab initio theory.1–3 Additionally, due to the fact that it is a very small molecule, many properties can indeed be readily computed at a very high level of theory, making it also an attractive molecule for theoretical investigations.4–8 However, the interest in ammonia is not solely due to its many practicalities. From the perspective of photochemical dynamics, sp3-hybridised nitrogen is often the reactive driving-force in many biomolecules, enabling non-radiative relaxation pathways that allow efficient UV-stability.9 Additionally, much work has been conducted in the examination of the low-lying Rydberg states of a myriad of amines, demonstrating broad similarities in the observed dynamics. This work has allowed some development of intuition for how photochemical processes of molecules containing sp3-hybridised nitrogen.10–14 However, this intuition is restricted in its scope due to the limited ways to access higher-lying electronic states.With regards to the similarities between molecular Rydberg-state dynamics in ammonia, and those that are found in larger amines, these observations are down to the fact that in both systems the nitrogen takes on the role as both the primary chromophore and the dynamophore. Much of the photodynamics that evolve on molecular Rydberg states in amines are driven by Rydberg-valence mixing, introduced as a function of N–R bond distance.12,15–18 By comparison, the ultrafast photodissociation of NH3 is mediated by a conical intersection found along the N–H stretching motion.19 This is additionally an example of Rydberg-valence mixing introduced as a function of the nuclear coordinates, and shows the similarity between the photodynamics present in ammonia and larger amines in general.20 However, despite these general similarities, work in amines has demonstrated that vibrational, and electronic couplings that are either allowed or disallowed by symmetry play a significant role in the fate of the photoexcited system.21,22 In previous work, a similar phenomenon has not been seen in ammonia, though this may well be due to the fact that most time-resolved work has only been able to access the lower-lying Rydberg states.3,23–29
In recent years, the development of table-top vacuum-ultraviolet femtosecond laser sources has made studies of higher-lying electronic states possible. These sources have proven to be indispensible tools for studies of electronic dynamics, allowing access to high-lying electronic states as a pump, or light-induced dynamics leading to photoproducts in the electronic ground state as a probe.30–38
Presented here, the high-lying Rydberg states of ammonia are revisited from previous work.39 Making use of improved energy resolution, greater detail can be extracted, providing a far more complete description of the light-induced dynamics in these states of ammonia. Previous studies have investigated the Rydberg-valence mixing of lower-lying electronically excited states, showing that the excited-state dynamics of these electronic states are dominated by a conical intersection formed by vibronic coupling of a nσ* state with a Rydberg state.40 However, greater sensitivity to vibrational energy levels gives rise to the direct observation of ultrafast intramolecular vibrational relaxation (IVR), seen through population transfer from one highly-excited vibronic state, to a vibrational progression of a different motion. The timescale for this population transfer is within the time-resolution of our instrument, which then mediates ultrafast internal conversion to the lower-lying electronic states. This is a surprising observation, as IVR is typically described as a statistical process which occurs on the picosecond timescale, as opposed to the femtosecond timescale which is reported in this work.
Making use of a recent high-resolution vacuum UV (VUV) spectrum, it is now known that a single 133 nm photon prepares the 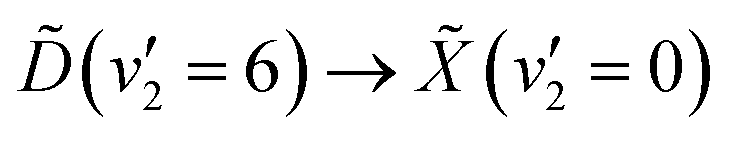 vibronic transition. In the present work, the excited state population is prepared through this transition, and then probed by ionisation with a single 266 nm photon. The photoelectrons are measured by velocity-map imaging (VMI), using the photoelectron angular distribution (PAD) to confirm the nature of the states involved. Varying the time delay between the two laser pulses to give a time-resolved photoelectron spectrum (TRPES), which is then analysed with both a statistical and simple non-statistical model, with the non-statistical model giving superior results. With this in mind, it can be confidently stated that coherent passage through a conical intersection is observed.
In summary, the energy prepared in the  vibronic state of ammonia is redistributed on a few-femtosecond timescale by coupling to the v4(e′) vibrational mode. A vibrational progression of this mode is seen in the TRPES, with a time-dependent onset of each feature in the progression. Ultrafast internal conversion (IC) to the and states is observed after ca. 64 fs, and all photoelectron peaks decay within 1 ps. The vibrational progression is not maintained in the and electronic states. The IC process is poorly described with a statistical model, giving a clear indication that the observed dynamics are driven by vibrationally coherent passage through a conical intersection between the and electronic states.
2 Methodology
2.1 Experimental methods
The spectrometer and beamline used in this experiment have been described in detail previously.33 However, the ion optics responsible for focusing the photoelectron image have been replaced with designs based on ref. 41. This design gives superior energy resolution, enabling greater detail to be extracted from the photoelectron spectra. This has enabled vibronic sensitivity, revealing richer, more complex dynamics in the high-lying Rydberg states of ammonia. In this study, ammonia is pumped with a single-photon centred at 133 nm, and probed with a single-photon at 266 nm.2.2 Computational methods
Most calculations have been completed using the Orca 4.2.1 software suite,42 at the CAM-B3LYP/aug-cc-pVQZ level of theory. The electronic ground state global minimum is obtained by an optimisation constrained to the C3v point group, frequencies are calculated to verify the nature of the stationary point located. It is not possible to calculate excited state non-adiabatic couplings (NADCs) and anharmonic frequency corrections with Orca 4.2.1, so OpenMolcas was used for the NADC calculations, and Gaussian 09 was used for the anharmonic frequency corrections.43,44 Further computational details can be found in the ESI.†3 Results and discussion
The optimised geometry (CAM-B3LYP/aug-cc-pVQZ) for the![[X with combining tilde]](https://www.rsc.org/images/entities/i_char_0058_0303.gif) state of ammonia is shown in Fig. 1, alongside a schematic for the excitation. The C3v symmetric structure has a NH bond lengths of ca. 1.012 Å, HNH bond angles of 108°, and an umbrella angle of 38°. The absorption of a 133 nm photon promotes an electron from the nitrogen lone pair to the 3d Rydberg orbital series.
state of ammonia is shown in Fig. 1, alongside a schematic for the excitation. The C3v symmetric structure has a NH bond lengths of ca. 1.012 Å, HNH bond angles of 108°, and an umbrella angle of 38°. The absorption of a 133 nm photon promotes an electron from the nitrogen lone pair to the 3d Rydberg orbital series.
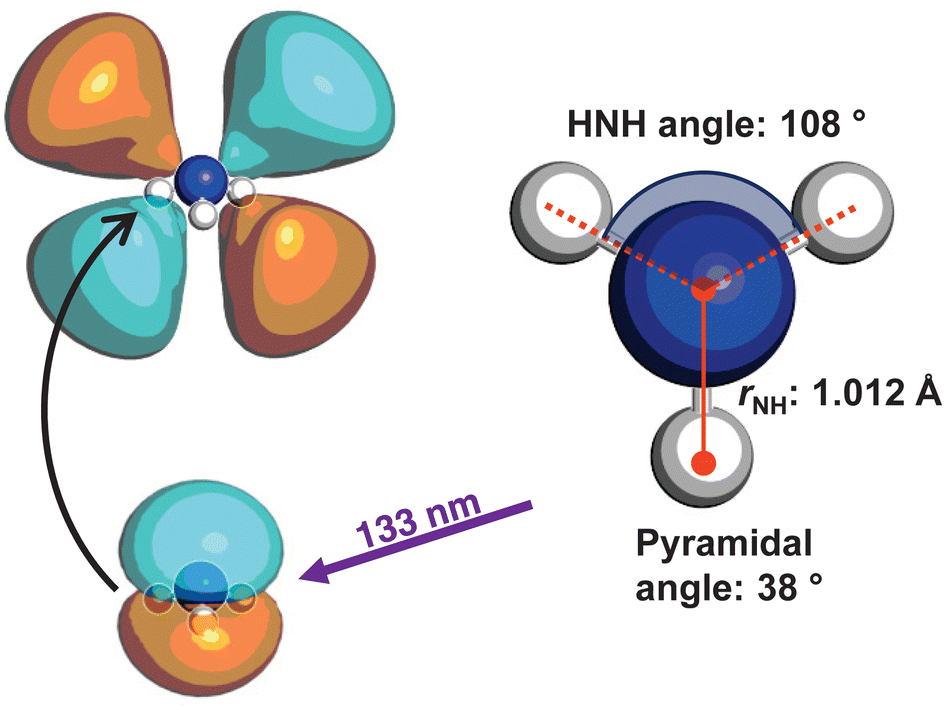 | ||
| Fig. 1 The electronic ground state optimised geometry is shown, optimised at the CAM-B3LYP/aug-cc-pVQZ level of theory. The white spheres represent hydrogen atoms, and the blue sphere represents nitrogen. The important geometric parameters are displayed, and a schematic of the transition induced by the single-photon absorption at 133 nm, where an electron from the nitrogen lone pair is excited into the 3d Rydberg orbital series, is shown. | ||
The frequencies for the optimised geometry shown in Fig. 1 are calculated (CAM-B3LYP/aug-cc-pVQZ), and their displacement vectors are shown in Fig. 2. These values are tabulated in Table 1.
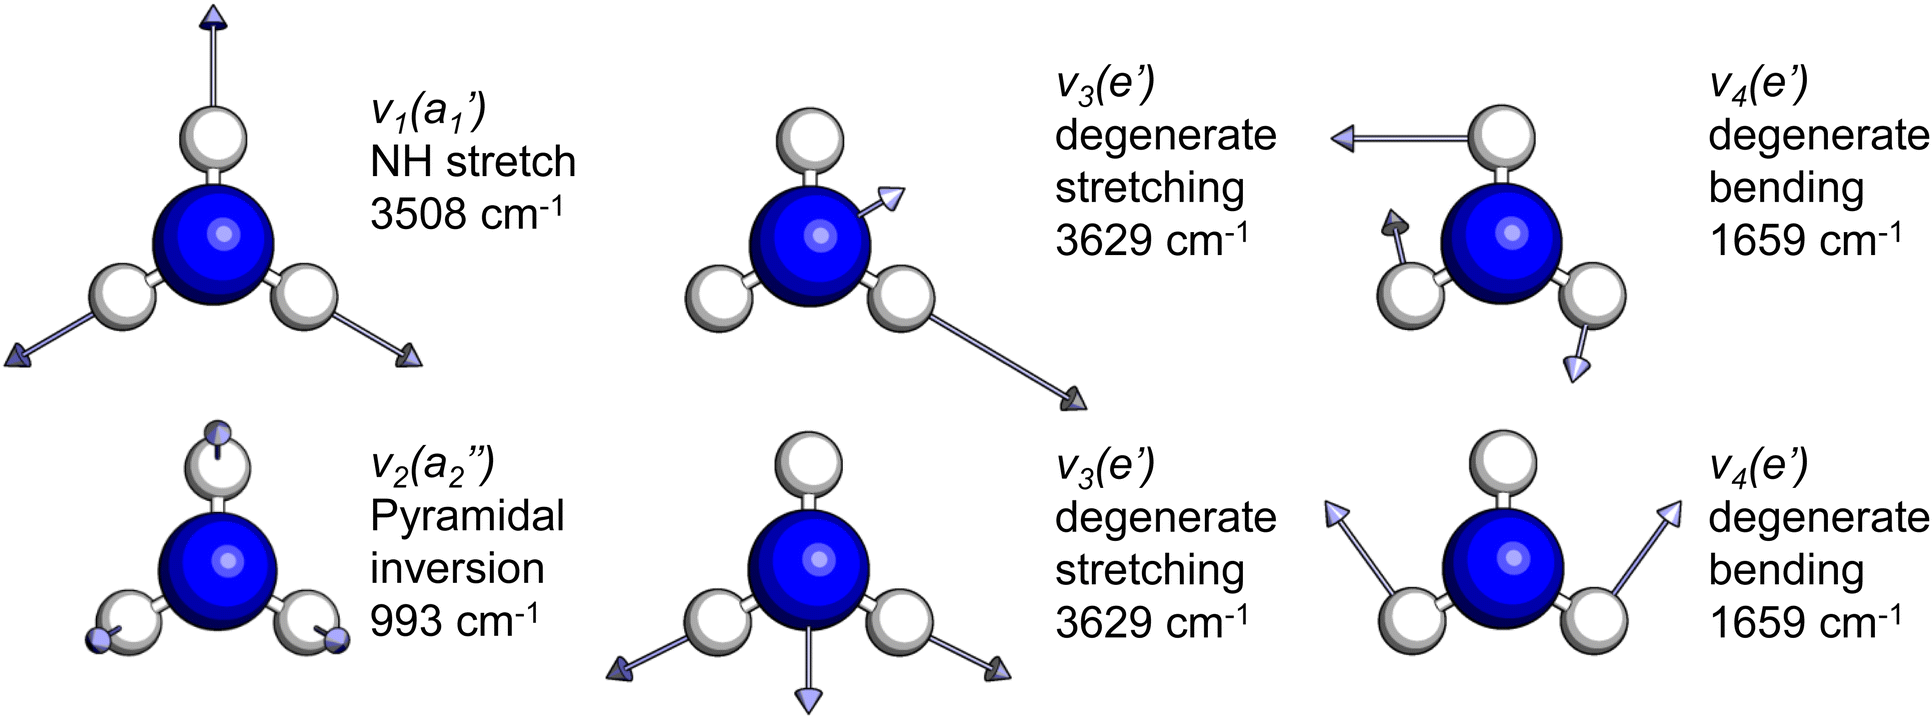 | ||
| Fig. 2 Normal modes of vibration for ammonia, where the displacement vectors are shown by the arrows. White spheres represent hydrogen atoms and blue spheres represent nitrogen atoms. | ||
| Mode (sym.) | Description | Calc. (cm−1) | Lit.47 (cm−1) |
|---|---|---|---|
|
NH s stretch | 3508 | 3337 |
|
NH3 pyr. inv. | 993 | 950 |
|
NH d stretch | 3629 | 3444 |
|
NH2 d bend | 1659 | 1627 |
Fig. 3 shows the pump–probe photoelectron image obtained at time-zero from which the pump-only and probe-only contributions have been subtracted. The left-hand-side of the image shows the pump–probe subtracted image, and the Abel-inverted image (obtained through polar-onion-peeling) is shown on the right-hand side of the image. The laser direction of propagation is shown by the black arrow. As is evident from this image, even the raw data clearly shows at least four photoelectron bands present at time-zero, with the fastest electrons appearing as a very narrow ring (the outer-most band).
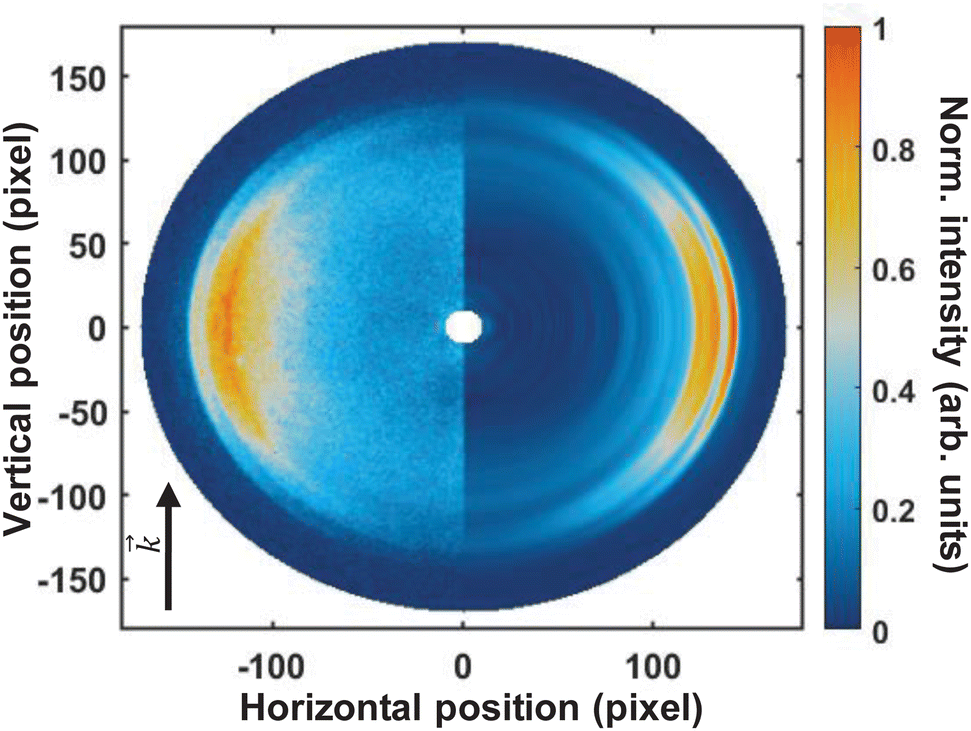 | ||
| Fig. 3 Photoelectron image of ammonia at time zero obtained with a 133 nm pump and a 266 nm probe pulse, with subtracted pump-only and probe-only contributions. The left-hand side shows the raw photoelectron image and the right-hand side shows the Abel-inverted (polar-onion-peeling) image. Even in the raw image, several photoelectron rings can be clearly seen, with varying degrees of anisotropy. The direction of light propagation is shown by the black arrow. | ||
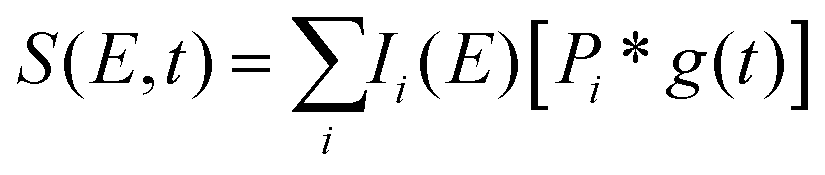
To fit the data two different global fitting methods are used. One assumes a global time-function of the signal, and applies this to each energy bin (which is referred to as a global fit – to keep inline with the established literature), and the other assumes a global energy function of the signal, which is then applied to each delay step (which is referred to as a time-slice approach). In the global fitting approach, the total signal S(E, t) is given as:
 | (1) |
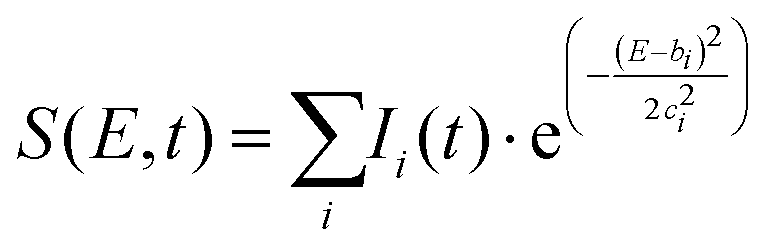
The time-slice approach is similar. However, in this approach, the total photoelectron signal is fitted to a sum of Gaussians, where bi is the central peak position, and ci determines the peak width.
 | (2) |
The time-slice model is applied to extract the decay constants of each individual feature, which is compared to the global fitting results.
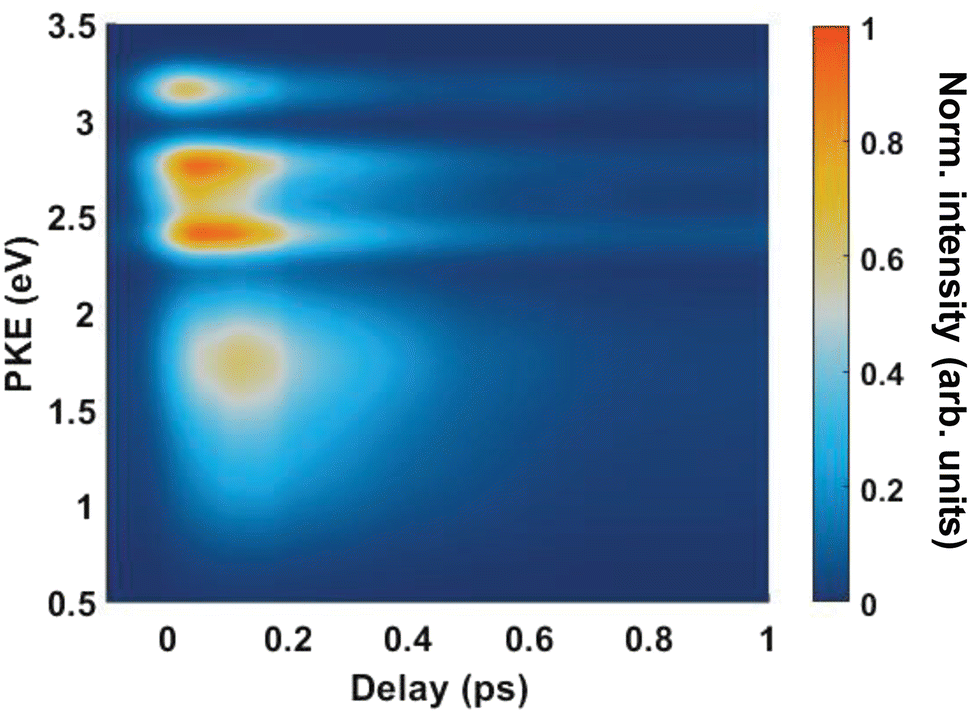
Fig. 4(A) shows the raw time-resolved photoelectron spectrum from 133 nm-pumped ammonia, probed with 266 nm. In this spectrum, the time-evolution of six photoelectron features can clearly be seen (shown in more detail in Fig. 5). The onset of each peak, from highest photoelectron kinetic energy (PKE) to lowest PKE, additionally appears to be delayed. To extract information regarding the time dependence, a global-fitting procedure described in eqn (1) was applied. The resulting global fit is shown in (B), and the residual map is shown in (C) showing that our reconstruction is within 10% of the measured signal. These two panels show that the global fit reproduces the signal very well, though there appears to be a systematic error present in (C), which implies that the time function is not fully adequate. This is seen through the fact that the positive and negative residual signal appears to beat in time, rather than appearing as random noise, and that the signal at later timescales is systematically underdescribed. The fit was not improved by increasing the number of exponential components, or by increasing the decay time limits. This time-dependent deviation will be discussed in more detail subsequently. The DAS are shown in (D), where the blue curve shows the energy-dependent amplitudes for τ1 = 64 fs, and the orange shows the energy-dependent amplitudes for τ2 = 209 fs. Features with negative amplitudes in τ1, but positive amplitudes in τ2 imply a sequential kinetic relationship between the two decay components. The two DAS taken together therefore show that the photoelectron feature at ca. 3.16 eV is populated at time zero, the majority of which then decays with a time-constant of 64 fs, populating states responsible for the other photoelectron features. The remainder of the signal, along with the rest of the spectrum, then decays with a time constant of 209 fs.
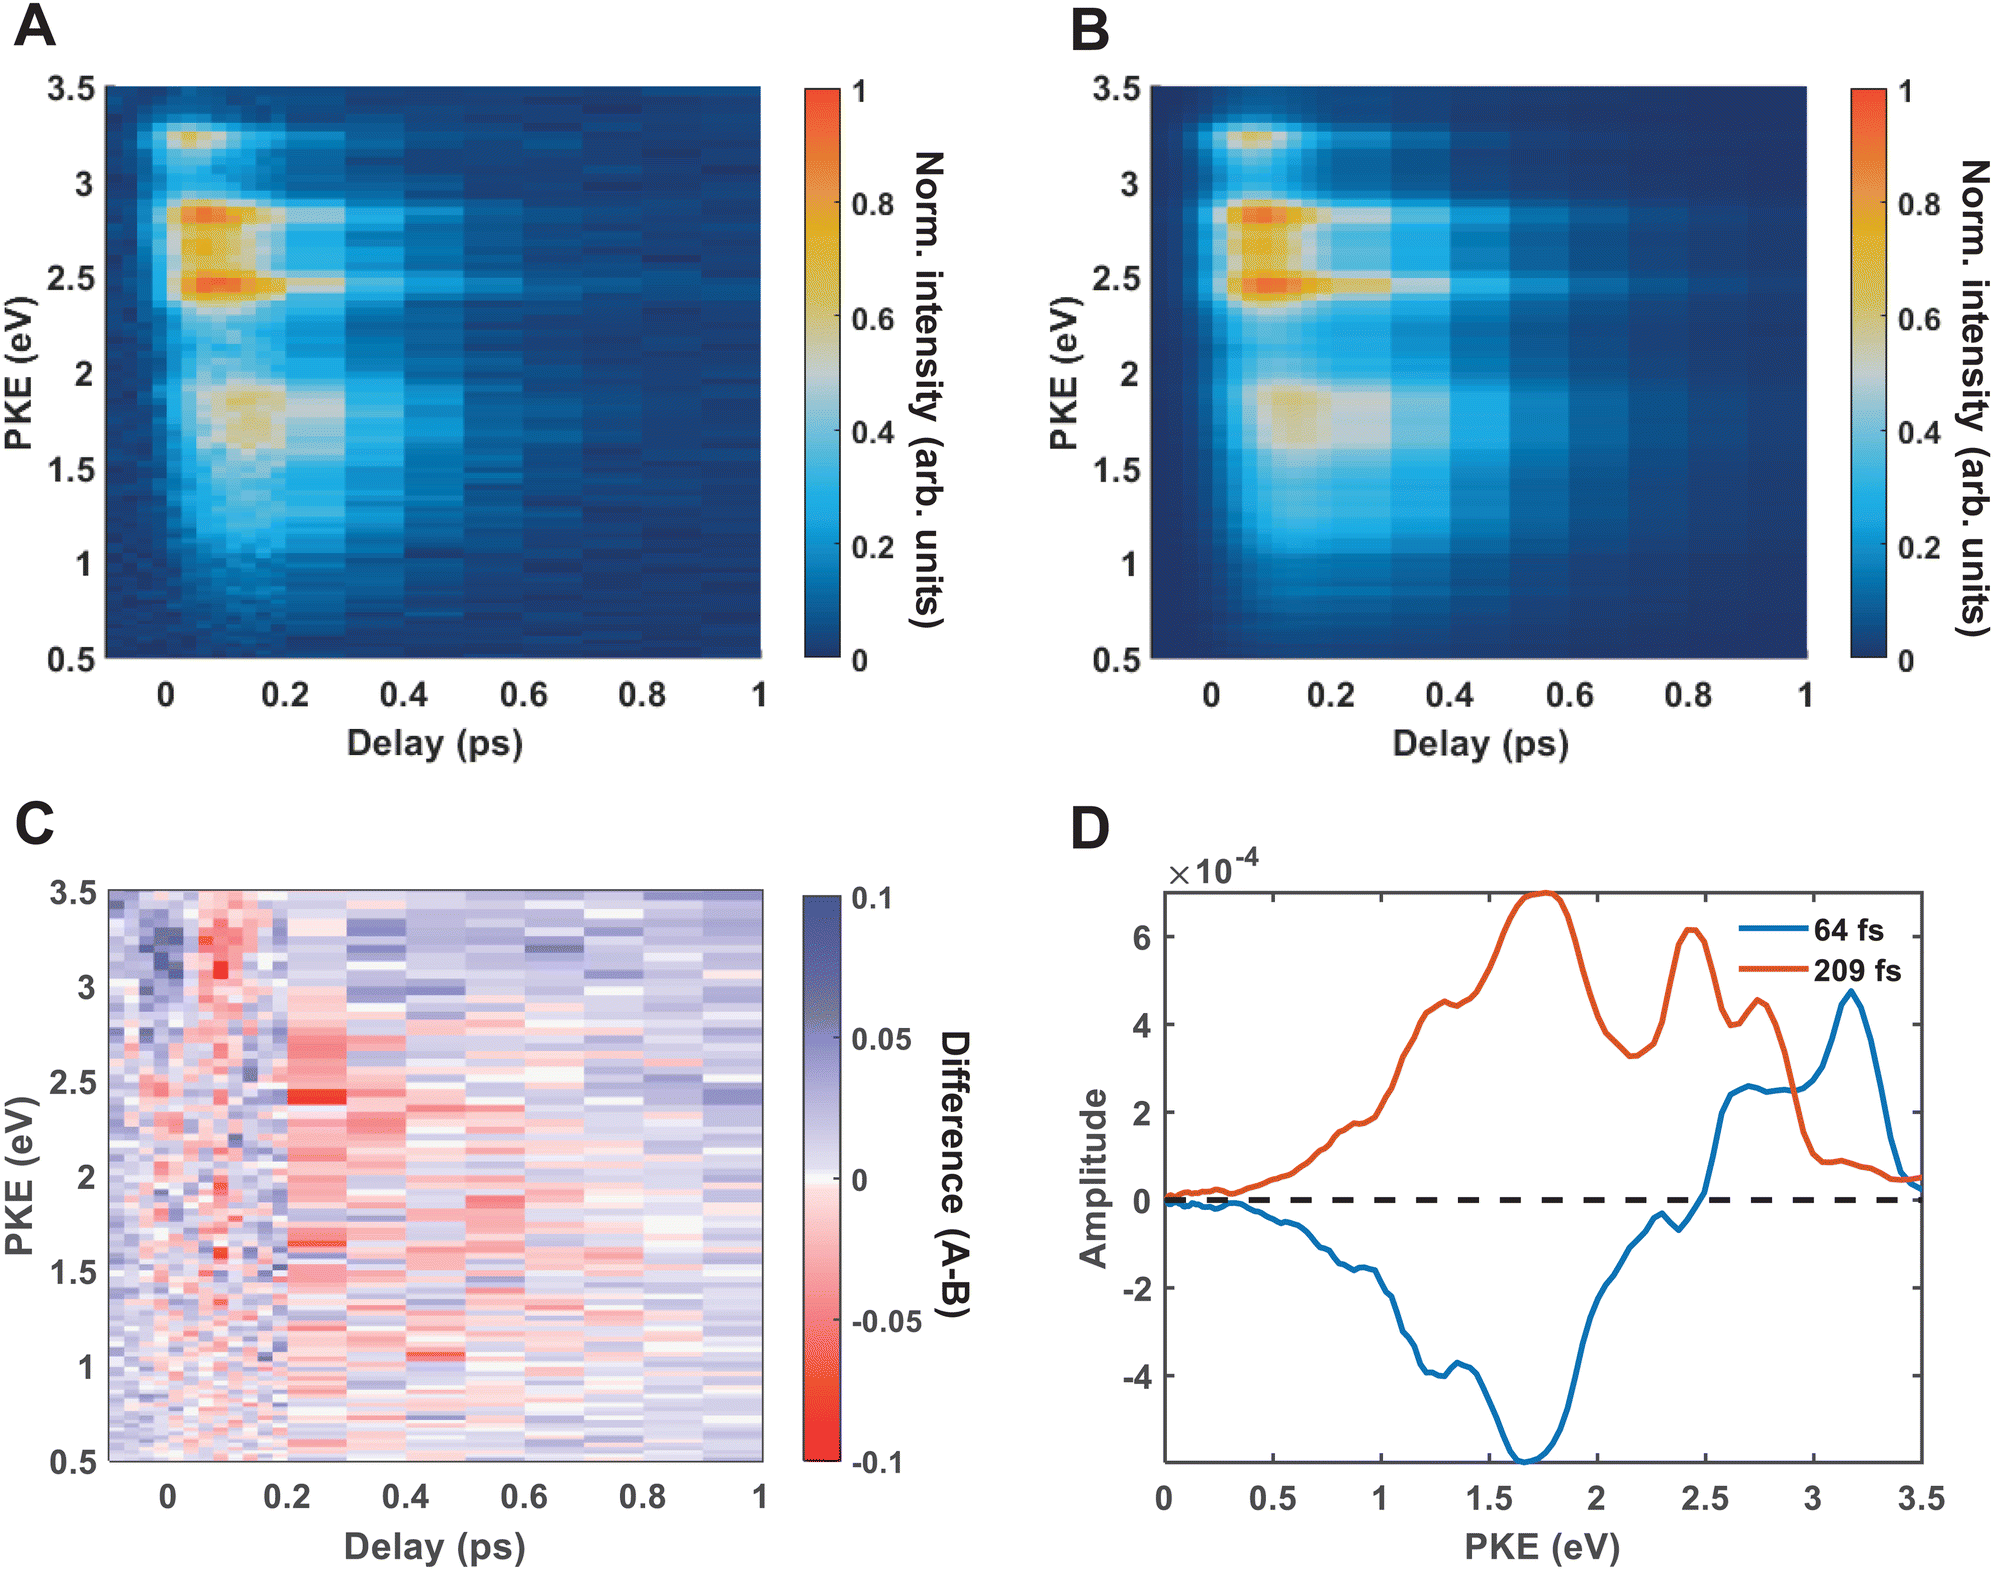 | ||
| Fig. 4 The raw time-resolved photoelectron spectrum of ammonia is shown in (A), and the associated global fit is shown in (B). A biexponential model is used, which gives excellent agreement with the raw data. This is demonstrated by the residual map shown in (C), where it can be seen that the agreement between the fit and the raw data is within 10% of the original signal. The decay associated spectrum is shown in (D), where the amplitudes for each exponential component can be seen. The blue line shows the energy-dependent amplitude of the τ1 component, which has been fit with a decay constant of 64 fs, and the orange line shows the energy-dependent amplitude of the τ2 component, which returns a decay constant of 209 fs. | ||
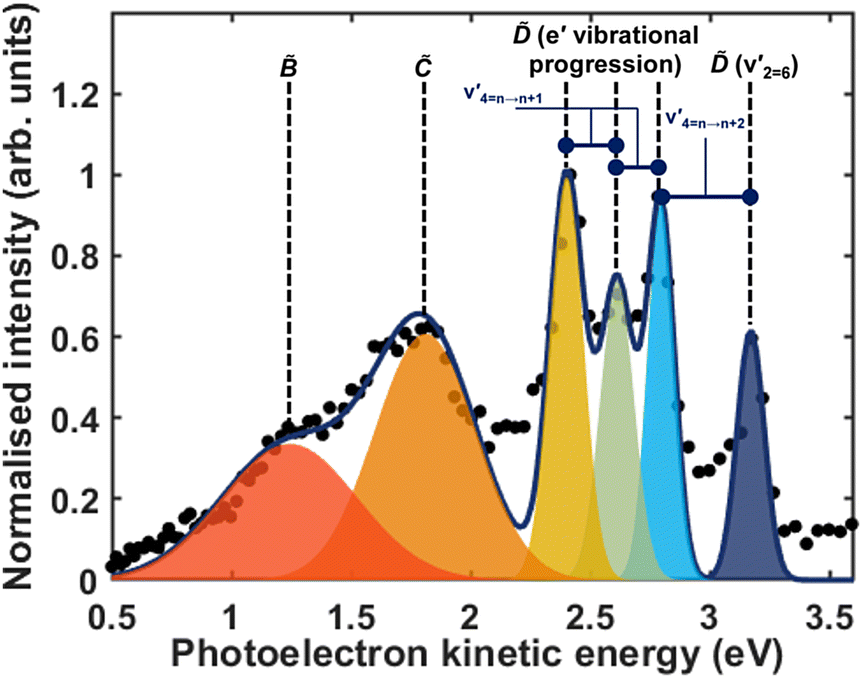 | ||
| Fig. 5 A Gaussian fit of the total photoelectron spectrum of ammonia. The data points from the normalised integration of the total time-resolved photoelectron spectrum is shown by the black dots, the total fit is shown by the blue line, and each component is shown by the coloured Gaussians. The assignment of each peak is shown above. | ||
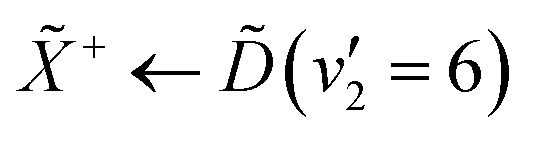
Fig. 5 shows the normalised integration of the total photoelectron signal with the black dots, and a multi-Gaussian fit shown by the blue line. We assign six features which can be seen in the spectrum, shown by the coloured Gaussians. Using synchroton VUV absorption data, we assign the dark blue peak at ca. 3.16 eV as the transition to a specific vibronic state  , which has a literature excitation energy of 9.36 eV,45 and would be expected to give photoelectrons with the observed kinetic energy, given a vertical ionisation potential of 10.85 eV.46 The vibronic states
  are also expected to play some role in this transition, as their transition energies are quite close to the excitation energy. However, the intensities of these transitions, compared to that for excitation of the state, would indicate that the role that these vibronic states play is minor. Additionally, the vibronic resolution provided by the recent synchrotron data shows that the excitation to the Ẽ state (which begins at 9.33 eV), which was previously thought to be responsible for the dynamics observed in this energy region of ammonia, prepares the
  vibrational state.45 Even though the energy of the transition matches exactly with the pump energy, and the calculated oscillator strength is comparatively large, rationalising its assignment in previous work,33 this transition is extremely weak. This can be now explained through the fact that this transition is forbidden in the Franck–Condon approximation, which has only been made possible with the availability of vibronically-resolved VUV absorption data.
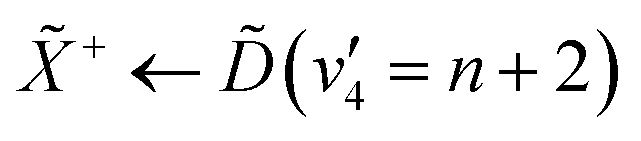
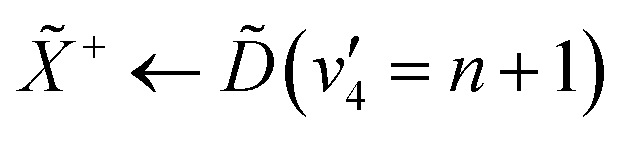
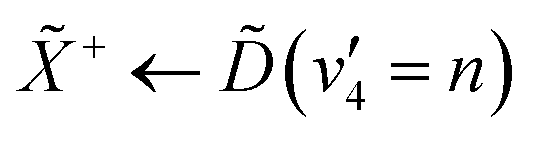
Another feature to be highlighted in Fig. 5 is the vibrational progression of v4. We attribute this from the spacing between the four highest-energy peaks, and the intensity distribution between them. The spacing between the three lower-energy peaks in this region is ca. 0.2 eV, which corresponds to the spacing between different energy levels of v4, and the spacing between the two highest-energy peaks is ca. 0.4 eV, energetically matching twice this spacing. These energies are well-matched by the calculated frequencies shown in Table 1, where the degenerate stretching motion has a calculated frequency of 1659 cm−1, corresponding to 0.21 eV. The intensity profile of these four peaks similarly matches the odd-even progression that would be expected from the Franck–Condon factors that photoionisation from four different neutral vibronic states to the same cationic vibronic state. This interpretation is visualised for the reader by a schematic in Fig. 6. The two lowest-energy peaks show no vibrational features and are assigned as originating from and . This interpretation, taken together with the fact that the photoelectron band observed at ca. 2.41 eV has a negative amplitude in the τ1 DAS, gives a strong indication that this is an observation of ultrafast internal vibrational relaxation (IVR). This is a significant result, as this significantly departs from the bulk of literature which discusses IVR in the context of statistical kinetics expected to be observed only on much longer timescales than presented in this work.
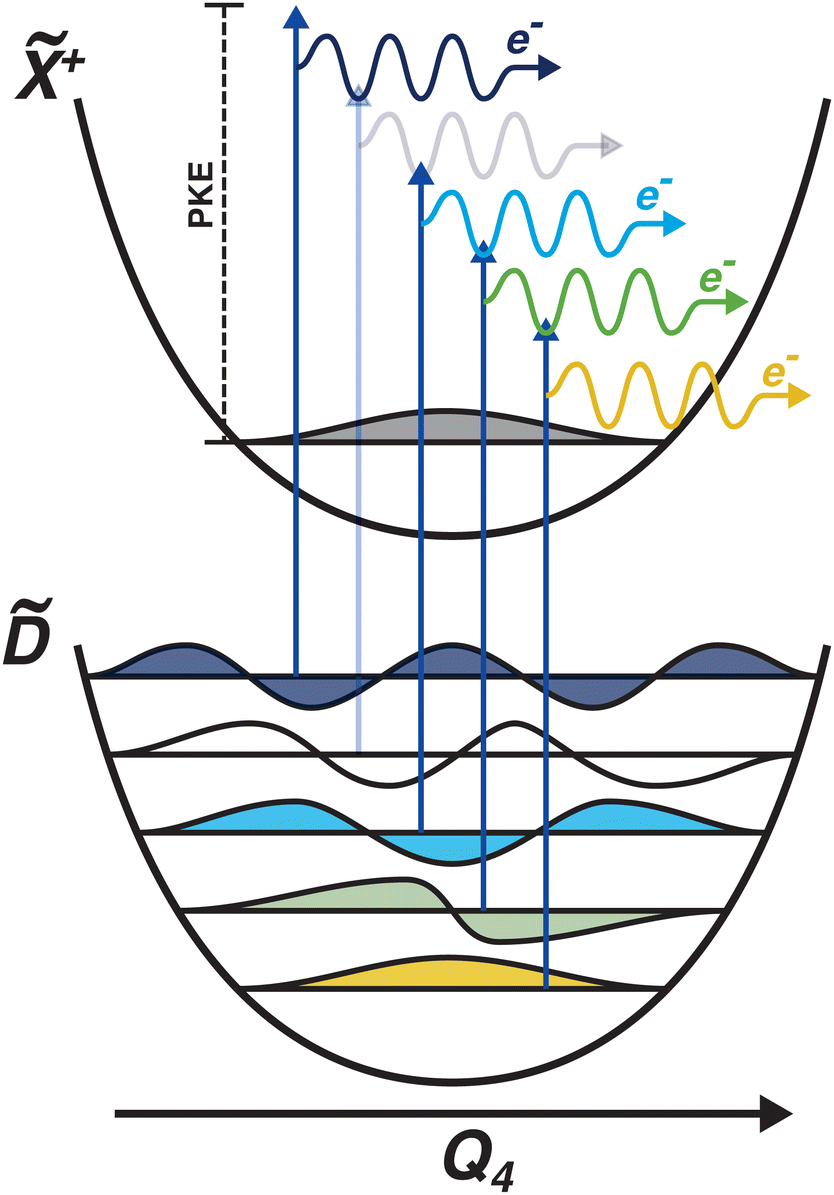 | ||
| Fig. 6 Schematic showing the origin of the vibrational progression observed in the time-resolved photoelectron spectrum. The interpretation is that this is a result of the differing Franck–Condon overlap between four different neutral vibronic states, which are projected onto the same cationic vibronic final state. One vibronic state is not observed (indicated by a more pale photoionisation scheme), which could be due to it being below the noise floor. The colours of the vibrational wavefunctions correspond to the colours of the photoelectron features shown in Fig. 5. | ||
Fig. 7 shows the time evolution of the peaks obtained by the fit in Fig. 5. This was done by applying the fit parameters to each time-slice of the TRPES. The amplitude of each Gaussian component is completely relaxed, and the peak positions and widths are allowed to vary by 10% to capture any broadening or relaxation that may be present. However, in this case, the peak widths and positions remain constant throughout the delay range. The fitted spectrum is then interpolated for missing delay points.
 | ||
| Fig. 7 Multi-Gaussian time-slice fit of the time-resolved photoelectron spectrum of ammonia. | ||
Using high-resolution VUV data, the pump transition can be confidently assigned to be dominated by the 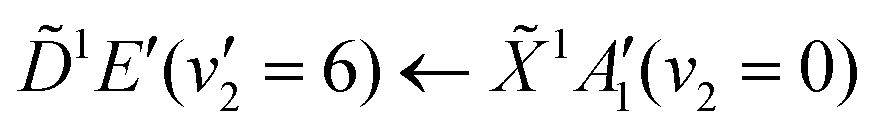 transition, with additional, minimal, components contributed by
 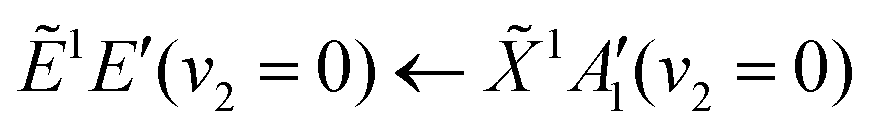 .45 Given the energy regime, it is likely that the prepared wavepacket is a superposition of these two vibronic states, although the Franck–Condon factor between the (v2 = 6) and (v2 = 0) vibronic states is likely to be significantly larger than the Franck–Condon factor between the Ẽ(v2 = 0) and (v2 = 0) vibronic states, given the double-welled nature of the ammonia electronic ground state, compared to the single-welled topology of the Rydberg states. This is further backed up by the relative intensities observed in the VUV absorption spectrum.45
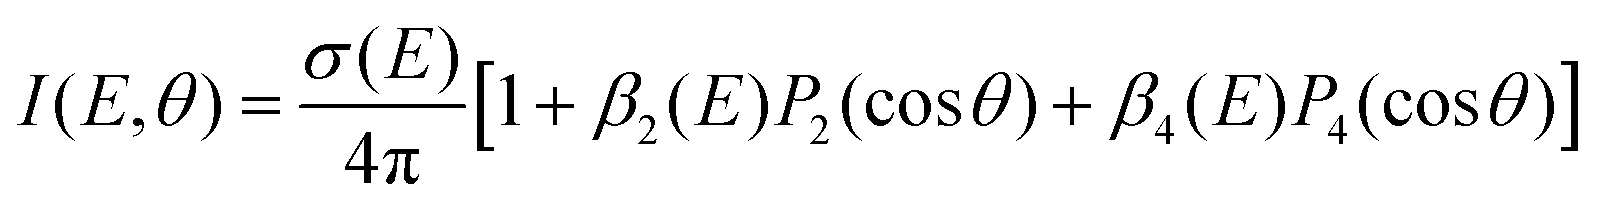
One key strength of velocity-map imaging over magnetic-bottle time-of-flight spectrometers is that one has access to the PAD of each photoelectron band. In a 1 + 1′ photoionisation scheme, the PAD can be described by two anisotropy parameters as a function of the PKE:
 | (3) |
![[thin space (1/6-em)]](https://www.rsc.org/images/entities/char_2009.gif) θ) are nth-order Legendre polynomials. The first anisotropy parameter, β2 can be related to the orbital angular momentum of the ionised orbital. For example, for a pure s atomic orbital (l = 0), one would expect a strongly anisotropic PAD that would be purely p in character giving β2 = 2. In an unaligned molecular case, the picture is slightly more complicated as the orientation of the molecule in the laboratory frame plays a significant role. Additionally, it is rare to photoionise Rydberg or valence-orbitals of pure s, p, d, etc. character, and there can be a scattering effect from the molecular ion core on the outgoing electron, which is not the case for a spherically symmetric atom. The β4 parameter is related to the orientation of the photoionised orbital, and is introduced in a pump–probe scheme due to the fact that the orientation of the pumped population is governed by symmetry selection rules.
θ) are nth-order Legendre polynomials. The first anisotropy parameter, β2 can be related to the orbital angular momentum of the ionised orbital. For example, for a pure s atomic orbital (l = 0), one would expect a strongly anisotropic PAD that would be purely p in character giving β2 = 2. In an unaligned molecular case, the picture is slightly more complicated as the orientation of the molecule in the laboratory frame plays a significant role. Additionally, it is rare to photoionise Rydberg or valence-orbitals of pure s, p, d, etc. character, and there can be a scattering effect from the molecular ion core on the outgoing electron, which is not the case for a spherically symmetric atom. The β4 parameter is related to the orientation of the photoionised orbital, and is introduced in a pump–probe scheme due to the fact that the orientation of the pumped population is governed by symmetry selection rules.
The peak-resolved β2 and β4 parameters can be seen in Table 2. The β2 value for ionisation from (v2 = 6) is nearly totally anisotropic, with a relatively high β4 value as well. The large β2 parameter can be understood by considering the nature of the Rydberg state that is prepared in the pump process. The state populates a 3d Rydberg orbital, which means that the outgoing photoelectron wave will have both p- and f-type components, explaining the strong anisotropy. The large β4 value can be explained by considering both the linear-polarisation of the incoming pump pulse, and the highly-symmetric nature of ammonia. This results in excitation of a subset of the molecules in our gas jet with the correct orientation. The β2 parameters for the e′ vibrational progression on the state are significantly lower than that for (v2 = 6), though they are still strongly anisotropic. The origin of this strong anisotropy is again due to the fact that the electronic state that they originate from is a d-Rydberg state. However, the change in β2 could originate from several factors, such as the probe accessing a different final ion vibrational state than the ionisation from (v2 = 6).48 Additionally, the lowering of the β2 could be an indication of strong vibronic mixing between the and / states as a function of the degenerate bending motion. This would result in mixing between the p-Rydberg-state character of the and states with the d-Rydberg state, meaning that the outgoing photoelectron would have more s-character, decreasing the anisotropy. The decreasing anisotropy is further seen in the photoelectron signal from the and states, which gives an indication that vibronic mixing could be the origin for this observation.
| Peak | β 2 | β 4 |
|---|---|---|
|
1.9 ± 0.2 | 0.6 ± 0.2 |
|
1.52 ± 0.12 | 0.41 ± 0.09 |
|
1.36 ± 0.13 | 0.14 ± 0.01 |
|
1.44 ± 0.02 | 0.22 ± 0.05 |
|
+ ← |
0.53 ± 0.16 | 0.06 ± 0.02 |
|
+ ← |
0.24 ± 0.07 | 0.07 ± 0.03 |
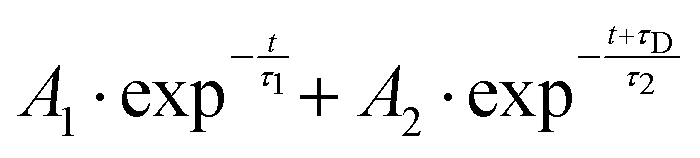
From both the raw data and the global fit shown in Fig. 4, in conjunction with the time-slice analysis shown in Fig. 2, it is clear that the photoelectron signal appearing between ca. 2.2 eV and ca. 0.5 eV appears at longer time delays than the photolectron signal appearing above 3.0 eV. However, a sequential biexponential model does not adequately describe their population. This is clearly demonstrated in Fig. 8, where the sequential biexponential fit (labelled as the statistical fit) is overlaid on top of the experimental data and the fitted amplitude from the time-slice analysis, where panel (a) shows the data for the state and (b) shows the data for the state. The blue curve shows a non-statistical fit, which has the general form:
 | (4) |
and states, this component is fit with a value of (79 ± 8) fs. The cross-correlation for this experiment was measured by non-resonant (1 + 1′)-ionisation of xenon as ca. 84 fs, such that this delay time is comfortably observable within our time resolution.
 | ||
| Fig. 8 In each panel the statistical fit is a sequential biexponential fit and the non-statistical fit is a simultaneous biexponential decay with a time delay between the two components. The green points show the experimental data points for this component, and the black points show the fitted amplitudes from the time-slice analysis. (A) Shows the fits of the state dynamics. In the statistical fit, τ1 is ca. 250 fs, and τ2 is ca. 190 fs. (B) Shows the fits of the state dynamics. In the statistical fit, τ1 is 270 fs, and τ2 is 190 fs. In the non-statistical fit, the delay component has been fit to a value of ca. 80 fs. | ||
The fact that the amplitude of the and states cannot be adequately described with a simple kinetic model is a highly surprising result, and implies that the IC between the state and the / states is coherently driven by a subset of vibrational modes. Given the highly-symmetric nature of ammonia, the coupling between different vibrational modes is quite restricted. In larger amines, this has been shown to reduce dispersion of the initially prepared wavepacket, which can then drastically decrease the lifetime of the electronic state prepared by the pump, coherently directing the population to a crossing seam, if there is a conical intersection found along one of the vibrational motions prepared at early times.21,22
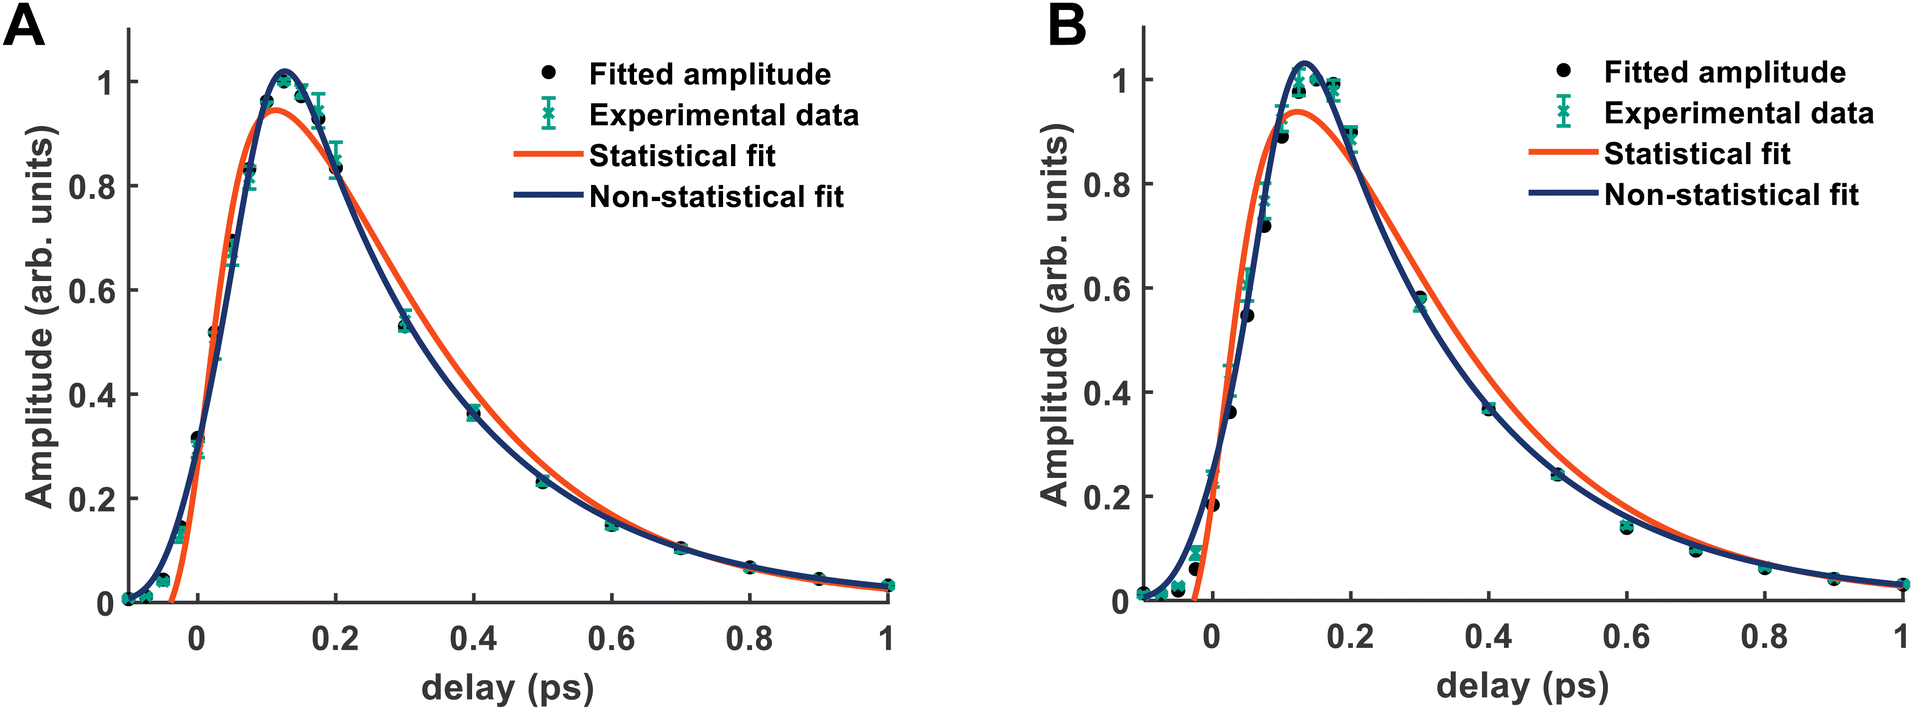
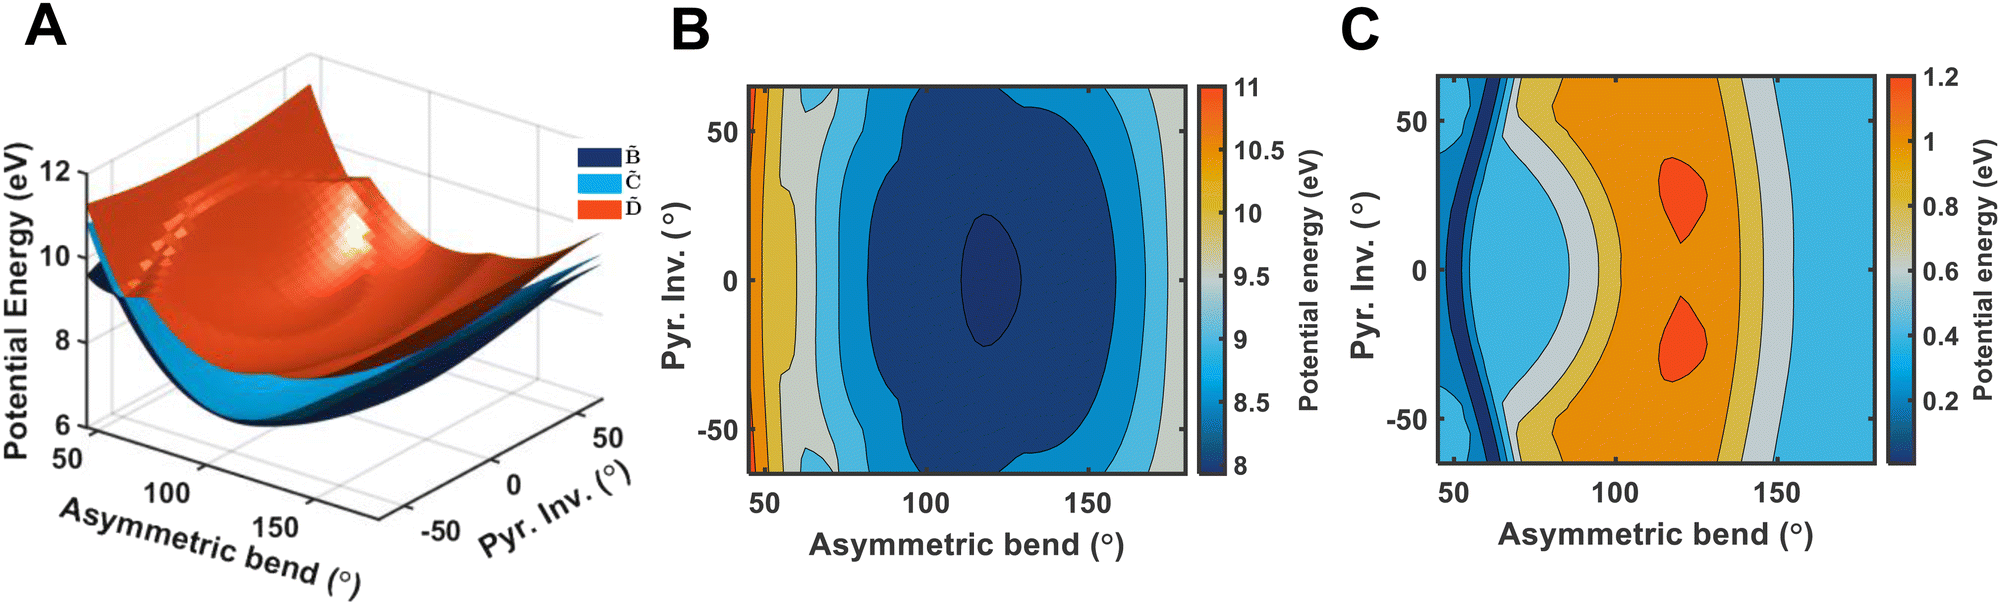
It is quite likely that the -state dynamics in ammonia are exhibiting similar behaviour to what was already shown in larger amines, especially given the fact that the symmetry restrictions would be much more drastic. In Fig. 9(a), we show calculations of the two-dimensional potential-energy surface following the asymmetric e′ bending motion and the pyramidal inversion at the CAM-B3LYP/aug-cc-pVQZ level of theory. The orange, uppermost surface shows the -state potential-energy surface, the cyan, middle surface corresponds to the state, and the lowest-lying, dark-blue surface represents the state. These motions were selected due to their presence in the TRPES shown in Fig. 4(a). Fig. 9(b) shows a contour map of the state, showing the potential-energy changes as a function of the bend and pyramidal inversion motions in more detail, and panel (c) shows the energy difference between the and states. As can be clearly seen, a seam appears as a function of the bending motion, demonstrating that this motion is able to drive IC. The appearance energy for this seam is ca. 9.7 eV, which could originate from the fact that these are not quantitative calculations, and are prone to having numerical differences which would require a benchmarking study to minimise, which is outside the scope of this paper. Furthermore, this is an unrelaxed scan of the potential-energy surface. However, as the purpose was to investigate the possibility of a crossing seam accessed as a function of the degenerate bending motions, this calculation firmly demonstrates that this is indeed the case. For completeness, the same information for the symmetric bending motion is shown in Fig. 10, where panels (a and c) both show clear signatures of a crossing at symmetric wagging angles of ca. 145°. To verify the nature of these crossings, the non-adiabatic coupling vectors between the and states are calculated at the CASSCF(6,12)/aug-cc-pVQZ level of theory. These vectors are shown in Fig. 11, showing that the coupling space is made up of predominately the symmetric wagging motion and the umbrella motion. Interestingly, there is a significant in-plane hydrogen wagging component to the non-adiabatic coupling vector (ŷ), though we do not see an experimental signature of this.
 | ||
| Fig. 9 Panel (A) shows a two-dimensional plot of the potential energy surfaces of the (orange), (cyan), and (dark blue) electronic states, calculated at the CAM-B3LYP/aug-cc-pVQZ level-of-theory. The potential energy is shown relative to the ground electronic state structure. A clear conical intersection seam between the three states can be seen following the pyramidal inversion angle, when the asymmetric bend is ca. 60°. Panel (B) shows the contour plot of the state, and panel C shows the potential energy difference between and , where the conical intersection seam is more obvious. | ||
 | ||
| Fig. 10 Panel (A) shows a two-dimensional plot of the potential energy surfaces of the (orange), (cyan), and (dark blue) electronic states, calculated at the CAM-B3LYP/aug-cc-pVQZ level-of-theory. The potential energy is shown relative to the ground electronic state structure. A clear conical intersection seam between the three states can be seen following the pyramidal inversion angle, when the symmetric bend is ca. 145°. Panel (B) shows the contour plot of the state, and panel C shows the potential energy difference between and , where the conical intersection seam is more obvious. | ||
 | ||
| Fig. 11 Non-adiabatic coupling vectors for the conical intersection between the and states, optimised at the CAS(6,12) level of theory. These vectors clearly show that the coupling is mediated by pyramidal inversion and symmetric wagging components. Further computational details are given in the ESI.† | ||
The experimental results, in conjunction with the theoretical calculations, paint a clear picture of the electronic-relaxation dynamics in the state of ammonia, occurring on an ultrafast timescale. With the 133 nm pump pulse, we prepare an excited population predominantly in the (v2 = 6) vibronic state, which is a highly-excited state of the Franck–Condon active pyramidal inversion motion. This vibrational motion is depopulated due to a strong coupling with the degenerate bending motions, which then coherently take the population to a crossing seam, resulting in population of the and electronic states.
4 Conclusions
The photochemistry of NH3 induced by 133 nm is revisited, revealing a surprisingly rich dynamical picture. Measuring the TRPES in a VMI spectrometer, reveals that absorption of a photon at 133 nm prepares a high-lying vibronic state within the electronic state manifold. IVR is observed and time resolved, revealing a redistribution time well within the instrument response function. In a global analysis approach, the population of the state has been shown to be best described with a simultaneous biexponential decay, where the first decay occurs with a time constant (τ1 ∼ 64 fs) and corresponds to IC to the and states. The longer-lived component is associated with all photoelectron features, and is likely indicative of Rydberg-valence mixing, leading to a photodissociation channel. Individual examination of the and states shows that their build-up is not described well by a statistical approach, providing a best-fit rise time of 270 fs for the state, and 250 fs state. This is clearly not consistent with the primary decay of the state. However, using a simple non-statistical approach, the dynamics of the and states are very well described, giving a rise time of (79 ± 8) fs, which agrees well with the initial decay.
Author contributions
H. J. W. and M. D. J. W. conceived the experiment. M. D. J. W. carried out the experiments, calculations, and data analysis. H. J. W. and M. D. J. W. prepared the manuscript.Conflicts of interest
There are no conflicts of interest to declare.Acknowledgements
The authors acknowledge Mario Seiler, Michael Urban and Andreas Schneider for technical support, as well as ETH Zürich for funding this work.References
- G. C. Nieman and S. D. Colson, J. Chem. Phys., 1978, 68, 5656–5657 CrossRef CAS.
- S. R. Langford, A. J. Orr-Ewing, R. A. Morgan, C. M. Western, M. N. R. Ashfold, A. Rijkenberg, C. R. Scheper, W. J. Buma and C. A. de Lange, J. Chem. Phys., 1998, 108, 6667–6680 CrossRef CAS.
- D. H. Mordaunt, M. N. R. Ashfold and R. N. Dixon, J. Chem. Phys., 1996, 104, 6460–6471 CrossRef CAS.
- C. Woywod, S. Scharfe, R. Krawczyk, W. Domcke and H. Köppel, J. Chem. Phys., 2003, 118, 5880–5893 CrossRef CAS.
- A. Viel, W. Eisfeld, S. Neumann, W. Domcke and U. Manthe, J. Chem. Phys., 2006, 124, 214306 CrossRef PubMed.
- M. Schröder and A. Brown, J. Chem. Phys., 2009, 131, 034101 CrossRef PubMed.
- Y. Q. Li and A. J. C. Varandas, J. Phys. Chem. A, 2010, 114, 6669–6680 CrossRef CAS PubMed.
- O. L. Polyansky, R. I. Ovsyannikov, A. A. Kyuberis, L. Lodi, J. Tennyson, A. Yachmenev, S. N. Yurchenko and N. F. Zobov, J. Mol. Spectrosc., 2016, 327, 21–30 CrossRef CAS.
- G. M. Roberts and V. G. Stavros, Chem. Sci., 2014, 5, 1698–1722 RSC.
- S. Deb, B. A. Bayes, M. P. Minitti and P. M. Weber, J. Phys. Chem. A, 2011, 115, 1804–1809 CrossRef CAS.
- Y. Zhang, H. Jónsson and P. M. Weber, Phys. Chem. Chem. Phys., 2017, 19, 26403–26411 RSC.
- L. B. Klein, T. J. Morsing, R. A. Livingstone, D. Townsend and T. I. Sølling, Phys. Chem. Chem. Phys., 2016, 18, 9715–9723 RSC.
- H. Yong, X. Xu, J. M. Ruddock, B. Stankus, A. M. Carrascosa, N. Zotev, D. Bellshaw, W. Du, N. Goff, Y. Chang, S. Boutet, S. Carbajo, J. E. Koglin, M. Liang, J. S. Robinson, A. Kirrander, M. P. Minitti and P. M. Weber, Proc. Natl. Acad. Sci. U. S. A., 2021, 118, e2021714118 CrossRef CAS PubMed.
- H. Yong, N. Zotev, B. Stankus, J. M. Ruddock, D. Bellshaw, S. Boutet, T. J. Lane, M. Liang, S. Carbajo, J. S. Robinson, W. Du, N. Goff, Y. Chang, J. E. Koglin, M. D. Waters, T. I. Sølling, M. P. Minitti, A. Kirrander and P. M. Weber, J. Phys. Chem. Lett., 2018, 9, 6556–6562 CrossRef CAS PubMed.
- J. O. Thompson, L. B. Klein, T. I. Sølling, M. J. Paterson and D. Townsend, Chem. Sci., 2016, 7, 1826–1839 RSC.
- L. B. Klein and T. I. Sølling, Chem. Phys., 2014, 442, 62–67 CrossRef CAS.
- L. B. Klein, J. O. F. Thompson, S. W. Crane, L. Saalbach, T. I. Sølling, M. J. Paterson and D. Townsend, Phys. Chem. Chem. Phys., 2016, 18, 25070–25079 RSC.
- M. Pápai, X. Li, M. M. Nielsen and K. B. Møller, Phys. Chem. Chem. Phys., 2021, 23, 10964–10977 RSC.
- X. Zhu and D. R. Yarkony, Mol. Phys., 2016, 114, 1983–2013 CrossRef CAS.
- M. N. R. Ashfold, G. A. King, D. Murdock, M. G. D. Nix, T. A. A. Oliver and A. G. Sage, Phys. Chem. Chem. Phys., 2010, 12, 1218–1238 RSC.
- M. D. J. Waters, A. B. Skov, M. A. B. Larsen, C. M. Clausen, P. M. Weber and T. I. Sølling, Phys. Chem. Chem. Phys., 2019, 21, 2283–2294 RSC.
- M. D. J. Waters, W. Du, A. M. Carrascosa, B. Stankus, M. Cacciarini, P. M. Weber and T. I. Sølling, J. Phys. Chem. Lett., 2021, 12, 9220–9225 CrossRef CAS PubMed.
- J. Biesner, L. Schnieder, J. Schmeer, G. Ahlers, X. Xie, K. H. Welge, M. N. R. Ashfold and R. N. Dixon, J. Chem. Phys., 1988, 88, 3607–3616 CrossRef CAS.
- J. Biesner, L. Schnieder, G. Ahlers, X. Xie, K. H. Welge, M. N. R. Ashfold and R. N. Dixon, J. Chem. Phys., 1989, 91, 2901–2911 CrossRef CAS.
- D. H. Mordaunt, M. N. R. Ashfold and R. N. Dixon, J. Chem. Phys., 1998, 109, 7659–7662 CrossRef CAS.
- K. L. Wells, G. Perriam and V. G. Stavros, J. Chem. Phys., 2009, 130, 74308 CrossRef PubMed.
- N. L. Evans, H. Yu, G. M. Roberts, V. G. Stavros and S. Ullrich, Phys. Chem. Chem. Phys., 2012, 14, 10401–10409 RSC.
- A. S. Chatterley, G. M. Roberts and V. G. Stavros, J. Chem. Phys., 2013, 139, 34318 CrossRef PubMed.
- V. Makhija, K. Veyrinas, A. E. Boguslavskiy, R. Forbes, I. Wilkinson, R. Lausten, S. P. Neville, S. T. Pratt, M. S. Schuurman and A. Stolow, J. Phys. B: At., Mol. Opt. Phys., 2020, 53, 114001 CrossRef CAS.
- M. Beutler, M. Ghotbi, F. Noack and I. V. Hertel, Opt. Lett., 2010, 35, 1491–1493 CrossRef CAS PubMed.
- T. Horio, R. Spesyvtsev and T. Suzuki, Opt. Express, 2013, 21, 22423–22428 CrossRef.
- A. von Conta, M. Huppert and H. J. Wörner, Rev. Sci. Instrum., 2016, 87, 073102 CrossRef CAS PubMed.
- V. Svoboda, N. B. Ram, R. Rajeev and H. J. Wörner, J. Chem. Phys., 2017, 146, 084301 CrossRef PubMed.
- A. von Conta, A. Tehlar, A. Schletter, Y. Arasaki, K. Takatsuka and H. J. Wörner, Nat. Commun., 2018, 9, 3162 CrossRef CAS.
- V. Svoboda, R. Michiels, A. C. LaForge, F. Stienkemeier, P. Slavíček and H. J. Wörner, Sci. Adv., 2020, 6, eaaz0385 CrossRef CAS PubMed.
- S. Adachi, M. Sato, T. Suzuki and S. Y. Grebenshchikov, Phys. Rev. A, 2017, 95, 33422 CrossRef.
- C. Wang, M. Waters, P. Zhang, J. Suchan, V. Svoboda, T. T. Luu, C. Perry, Z. Yin, P. Slavicek and H. J. Wörner, Nat. Chem., 2022 DOI:10.1038/s41557-022-01012-0.
- V. Svoboda, N. B. Ram, D. Baykusheva, D. Zindel, M. D. Waters, B. Spenger, M. Ochsner, H. Herburger, J. Stohner and H. J. Wörner, Sci. Adv., 2022, eabq2811 CrossRef CAS.
- V. Svoboda, C. Wang, M. D. Waters and H. J. Wörner, J. Chem. Phys., 2019, 151, 104306 CrossRef PubMed.
- X. Zhu, Q. Zhang, W. Hong, P. Lan and P. Lu, Opt. Express, 2011, 19, 436–447 CrossRef CAS PubMed.
- R. A. Livingstone, J. O. F. Thompson, M. Iljina, R. J. Donaldson, B. J. Sussman, M. J. Paterson and D. Townsend, J. Chem. Phys., 2012, 137, 184304 CrossRef PubMed.
- F. Neese, Wiley Interdiscip. Rev.: Comput. Mol. Sci., 2018, 8, e1327 Search PubMed.
- I. Fdez. Galván, M. Vacher, A. Alavi, C. Angeli, F. Aquilante, J. Autschbach, J. J. Bao, S. I. Bokarev, N. A. Bogdanov, R. K. Carlson, L. F. Chibotaru, J. Creutzberg, N. Dattani, M. G. Delcey, S. S. Dong, A. Dreuw, L. Freitag, L. M. Frutos, L. Gagliardi, F. Gendron, A. Giussani, L. González, G. Grell, M. Guo, C. E. Hoyer, M. Johansson, S. Keller, S. Knecht, G. Kovačević, E. Källman, G. Li Manni, M. Lundberg, Y. Ma, S. Mai, J. P. Malhado, P. Å. Malmqvist, P. Marquetand, S. A. Mewes, J. Norell, M. Olivucci, M. Oppel, Q. M. Phung, K. Pierloot, F. Plasser, M. Reiher, A. M. Sand, I. Schapiro, P. Sharma, C. J. Stein, L. K. Sørensen, D. G. Truhlar, M. Ugandi, L. Ungur, A. Valentini, S. Vancoillie, V. Veryazov, O. Weser, T. A. Wesołowski, P. O. Widmark, S. Wouters, A. Zech, J. P. Zobel and R. Lindh, OpenMolcas: From Source Code to Insight, 2019 Search PubMed.
- M. J. Frisch, G. W. Trucks, H. B. Schlegel, G. E. Scuseria, M. A. Robb, J. R. Cheeseman, G. Scalmani, V. Barone, B. Mennucci, G. A. Petersson, H. Nakatsuji, M. Caricato, X. Li, H. P. Hratchian, A. F. Izmaylov, J. Bloino, G. Zheng, J. L. Sonnenberg, M. Hada, M. Ehara, K. Toyota, R. Fukuda, J. Hasegawa, M. Ishida, T. Nakajima, Y. Honda, O. Kitao, H. Nakai, T. Vreven, J. A. Montgomery Jr., J. E. Peralta, F. Ogliaro, M. Bearpark, J. J. Heyd, E. Brothers, K. N. Kudin, V. N. Staroverov, R. Kobayashi, J. Normand, K. Raghavachari, A. Rendell, J. C. Burant, S. S. Iyengar, J. Tomasi, M. Cossi, N. Rega, J. M. Millam, M. Klene, J. E. Knox, J. B. Cross, V. Bakken, C. Adamo, J. Jaramillo, R. Gomperts, R. E. Stratmann, O. Yazyev, A. J. Austin, R. Cammi, C. Pomelli, J. W. Ochterski, R. L. Martin, K. Morokuma, V. G. Zakrzewski, G. A. Voth, P. Salvador, J. J. Dannenberg, S. Dapprich, A. D. Daniels, Ö. Farkas, J. B. Foresman, J. V. Ortiz, J. Cioslowski and D. J. Fox, Gaussian09, Revision E.01, 2016 Search PubMed.
- P. Limão-Vieira, N. C. Jones, S. V. Hoffmann, D. Duflot, M. Mendes, A. I. Lozano, F. Ferreira Da Silva, G. García, M. Hoshino and H. Tanaka, J. Chem. Phys., 2019, 151, 184302 CrossRef PubMed.
- K. Kimura, S. Katsumata, Y. Achiba, T. Yamazaki and S. Iwata, Handbook of HeI photoelectron spectra, Japan Scientific Societies Press; Tokyo, 1981 Search PubMed.
- T. Koops, T. Visser and W. Smit, J. Mol. Struct., 1983, 96, 203–218 CrossRef CAS.
- S. M. Bellm and K. L. Reid, Phys. Rev. Lett., 2003, 91, 263002 CrossRef PubMed.
Footnote |
| † Electronic supplementary information (ESI) available. See DOI: https://doi.org/10.1039/d2cp03117e |
| This journal is © the Owner Societies 2022 |