Solubilization and coordination of the HgCl2 molecule in water, methanol, acetone, and acetonitrile: an X-ray absorption investigation†
Matteo
Busato
 *a,
Giuseppe
Fazio
 a,
Francesco
Tavani
 a,
Simone
Pollastri
 b and
Paola
D’Angelo
 *a
*a
aDepartment of Chemistry, University of Rome “La Sapienza”, P.le A. Moro 5, 00185, Rome, Italy. E-mail: matteo.busato@uniroma1.it; p.dangelo@uniroma1.it
bElettra-Sincrotrone Trieste S.C.p.A, s.s. 14, km 163.5, I-34149, Basovizza, Trieste, Italy
First published on 8th July 2022
Abstract
X-ray absorption spectroscopy (XAS) has been employed to carry out structural characterization of the local environment around mercury after the dissolution of the HgCl2 molecule. A combined EXAFS (extended X-ray absorption fine structure) and XANES (X-ray absorption near edge structure) data analysis has been performed on the Hg L3-edge absorption spectra recorded on 0.1 M HgCl2 solutions in water, methanol (MeOH), acetone and acetonitrile. The Hg–Cl distance determined by EXAFS (2.29(2)–2.31(2) Å) is always comparable to that found in the HgCl2 crystal (2.31(2) Å), demonstrating that the HgCl2 molecule dissolves in these solvents without dissociating. A small sensitivity of EXAFS to the solvent molecules interacting with HgCl2 has been detected and indicates a high degree of configurational disorder associated with this contribution. XANES data analysis, which is less affected by the disorder, was therefore carried out for the first time on these systems to shed light into the still elusive structural arrangement of the solvent molecules around HgCl2. The obtained results show that, in aqueous and MeOH solutions, the XANES data are compatible with three solvent molecules arranged around the HgCl2 unit to form a trigonal bipyramidal structure. The determination of the three-body Cl–Hg–Cl distribution shows a certain degree of uncertainty around the average 180° bond angle value, suggesting that the HgCl2 molecule probably vibrates in the solution around a linear configuration.
1 Introduction
The interest in the chemistry of mercury originates from its toxicity: once released into the environment, due to its soft acid nature this element is able to interact with soft bases such as sulfur atoms of enzymes, proteins, and nucleic acids, eventually replacing biological Zn(II) ions and altering the normal activity of these species.1–4 Furthermore, mercury can enter the food chain, especially through seafood,5–7 being not expelled by organisms but rather bio-accumulated.8 For these reasons, the treatment of mercury and its compounds represents a dramatic environmental and health concern, and its removal from the environment is one of the current challenges of chemistry.9–12Despite being a naturally abundant metal, the availability of mercury can even rise because of human activities such as metallurgy and fossil fuel employment,13,14 the latter one being derived either from coal combustion or natural gas emission. Natural gas can contain mercury in both its elemental form and as mercuric halides, among which HgCl2 is one of the most common forms.9–11 However, despite the dramatic impact of these compounds on stream, lake, and ocean pollution,15 the nature of the interaction of the HgCl2 molecule with water and with very common molecular solvents seems to deserve further investigation. According to an X-ray absorption spectroscopy (XAS) study,16 in an aqueous solution, a Hg–Cl distance of 2.29(2) Å was determined, which is thus very similar to the 2.283(9) Å value found for the HgCl2 crystal by means of X-ray diffraction (XRD) data.17 This result indirectly suggests that the HgCl2 molecule dissolves in water without dissociating, at variance with what is observed for other salts like the Hg(ClO4)2 and Hg(TfO)2 (TfO = trifluoromethanesulfonate) ones.18–21 This evidence is commonly believed to rely on the strong covalent contribution to the Hg–Cl bond, but no explanation has been achieved so far about the reasons why this molecule dissolves in water without traces of precipitates, even if only at low concentrations owing to moderate water solubility.22 According to an XRD investigation,23 a comparable picture also seems to be obtained in the methanol (MeOH) solution, because a Hg–Cl bond distance of 2.308(3) Å has been determined, even if measurements were carried out under highly concentrated conditions (1.5 M). In light of this, the determination of the dissolution process of the HgCl2 molecule, i.e., if it is present as neutral species or as dissociated ions in solution, has important implications for biological processes addressing human health, because the conservation of neutrality may imply that it does not need a specific channel to pass through the cell membranes, but rather may undergo passive diffusion through them.24 As concerns the arrangement of the solvent molecules around HgCl2, according to ab initio calculations, the most stable configuration involves three water molecules on the equatorial plane of the linear HgCl2 unit, forming an overall trigonal bipyramidal geometry.25,26 In particular, both density functional theory (DFT) optimizations with an incremental number of water molecules and Monte Carlo simulations with DFT-derived interaction potentials resulted in a Hg–Cl distance in the 2.29–2.32 Å range and a Cl–Hg–Cl angle of 179°.26 Other authors found that for DFT optimizations on increasing hydration clusters, a minimum number of 24 water molecules is needed to complete a first hydration shell and the trigonal bipyramidal HgCl2(H2O)3 unit is produced as a result.25 The step-by-step addition of water molecules around HgCl2 provokes the lengthening of the Hg–Cl bond from 2.30 to 2.52 Å and the bending of the Cl–Hg–Cl linear configuration, although a bond angle of 176° is recovered once the trigonal bipyramidal structure is obtained. In this structure, the average Hg–O distance with the three coordinating water molecules is 2.48 Å. The formation of the trigonal bipyramidal HgCl2(H2O)3 species is also observed by the same authors from ab initio molecular dynamics simulations, albeit a high number of exchange events occurs between the coordinating and the outer-sphere water molecules. In contrast, some experimental works indicate the association of two ligands to the HgCl2 molecule, being either water molecules or other O-donor species.27–31 In these structures, the Cl–Hg–Cl angle is bent, and a distorted tetrahedral geometry is formed with the additional two ligands. However, only a few data are presented in support of this putative structure in solution,27 while this coordination seems to be more limited to the solid state.28–31 Additional insight into the interaction of the HgCl2 species with molecular solvents only relies on indirect information from Raman spectroscopy or calorimetric techniques,32–34 thus leaving a vacant space for a clear experimental determination in support of these observations.
Herein, we present a study aimed at deepening the knowledge about the solvation structure of the HgCl2 molecule in an aqueous solution and in common organic solvents, namely MeOH, acetone (Act) and acetonitrile (AN). The difficulty in obtaining an accurate structural description of metal solvation complexes in disordered liquid systems is a well-known task.35–42 This is particularly true for what concerns the d10 Hg(II) center, which, like Zn(II) and Cd(II), presents no electronic spectroscopic handle, making the study of its solvation structure even more challenging.18 In this respect, XAS is an ideal method to provide accurate information on the local arrangement of the solvent molecules around a metal center, owing to its high sensitivity to the closest environment of the photoabsorber.43,44 In particular, the high energy part of the absorption spectrum (EXAFS, extended X-ray absorption fine structure) is known to be particularly sensitive to the closest coordination shell and allows an accurate determination of bond distances, while the low energy part (XANES, X-ray absorption near-edge structure) can provide complementary information on the three-dimensional arrangement of the scattering atoms.35,40,45 In principle, a complete recovery of the local structure around the photoabsorber can be achieved by the simultaneous employment of EXAFS and XANES analysis. This combined approach was therefore employed to obtain a unified picture about the coordination of mercury upon dissolution of the HgCl2 molecule in the studied systems.
2 Materials and methods
2.1 X-ray absorption measurements
Hg L3-edge XAS spectra were obtained at the 11.1 beamline46 of Elettra-Sincrotrone Trieste in the transmission mode. Data were first collected on solid HgCl2 (Sigma-Aldrich), which was diluted with boron nitride, carefully grained in an agate mortar and pressed into a pellet that was put in 1.5 mm aluminum frames with a Mylar tape covering the sample. The four 0.1 M solutions of HgCl2 in deionized Milli-Q water, MeOH, Act and AN were prepared by adding stoichiometric amounts of the salt into the corresponding solvent. Cells with Kapton windows were filled with the liquid samples and kept under N2 flux during data acquisition to avoid contact with the air. All measurements were performed using a Si(111) double crystal monochromator, while the storage ring was operating at 2 GeV with a beam current of 200 mA. At least three spectra were recorded and averaged for each sample. XAS data were also recorded on a 0.1 M solution of Hg(TfO)2 in water as a comparative system.2.2 EXAFS data analysis
The analysis of the EXAFS part of the absorption spectra was carried out using the GNXAS code.47,48 Amplitudes and phase shifts have been calculated from clusters with fixed geometry within the muffin-tin (MT) approximation and advanced models for the exchange–correlation self-energy in the framework of the Hedin–Lundqvist (HL) scheme, which intrinsically allow to take into account the photoelectron inelastic losses in the final state.49 Theoretical signals associated with n-body distribution functions have been calculated in accordance with the multiple-scattering (MS) theory and summed in order to reconstruct the total theoretical contribution. Each two-body distribution has been modelled as a Γ-like function depending on four structural parameters, namely the coordination number N, the average distance R, the Debye–Waller factor σ2, and the asymmetry index β.The EXAFS spectrum of solid HgCl2 was analyzed starting from its crystallographic structure.17 For this purpose, two-body single scattering (SS) signals have been calculated to take into account the two first-shell chlorine atoms (Hg–Cl1st), the six chlorine atoms set in the second shell (Hg–Cl2nd), and the third shell mercury (Hg–Hg) and chlorine (Hg–Cl3rd) atoms with coordination numbers of four and six, respectively. A three-body MS signal has been also calculated to take into account the Cl–Hg–Cl collinear distribution formed between mercury and the two closest chlorine atoms. Further insights about the treatment of the three body terms are provided in the ESI.† The MT radii for the Hg and Cl centers have been optimized by fitting the overlap between the potential spheres of adjacent atoms.
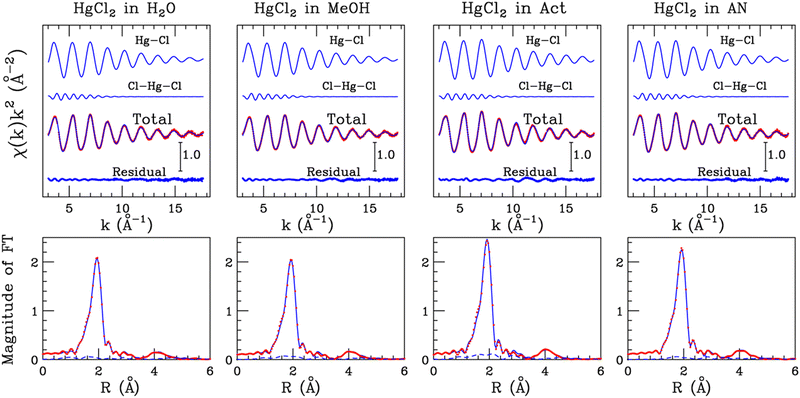
The EXAFS spectra of the 0.1 M solutions of HgCl2 in water, MeOH, Act and AN were analyzed considering the Hg–Cl SS and the three-body Cl–Hg–Cl MS signals related to the two first-shell chlorine atoms. MT radii for Hg and Cl have been kept fixed to the values optimized in the fitting procedure of the HgCl2 crystal. The inclusion of signals connected with the solvent molecules set in the second coordination shell was found not to provide a significant improvement to the quality of the EXAFS data fit (vide infra).
Least-squares minimizations have been carried out directly on the raw data, without preliminary background subtraction and Fourier filtering, by optimizing all the structural parameters. In addition, non-structural parameters have been optimized, namely the L3-edge ionization energy E0 and the energy position and amplitude of the double-electron excitation channels. The inclusion of the double-electron excitations allowed us to keep the S02 amplitude reduction factor constrained between 0.90 and 1.00.
2.3 XANES data analysis
A fitting procedure of the XANES part of the spectra recorded on the HgCl2 solutions was carried out using the MXAN code.50,51 The potential has been calculated in the framework of the MT approximation using a complex optical potential, based on the local density approximation of the excited photoelectron self-energy. The real part of the self-energy was calculated using the HL scheme,49 while the inelastic losses were accounted for by convolution of the theoretical spectrum with a Lorentzian function having an energy-dependent width of the form Γtot(E) = Γc + Γmfp(E). The constant part Γc includes the core–hole lifetime, while the energy-dependent term Γmfp(E) represents all the intrinsic and extrinsic inelastic processes. The function Γmfp(E) is zero below an onset energy Es and begins to increase from a value As, following the universal functional form of the mean free path in solids. The numerical values of Es and As are derived at each computational step using a Monte Carlo fit. A Gaussian convolution was used to account for the experimental resolution.Least-squares fits have been carried out by optimizing the geometry of the starting models with the minimization of a residual function Rsq defined as:
 | (1) |
3 Results and discussion
3.1 HgCl2 crystal: EXAFS analysis
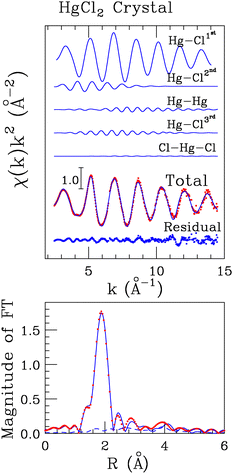
To determine the local structure around mercury in the HgCl2 crystal, we carried out the analysis of the EXAFS part of the absorption spectrum recorded on solid HgCl2 on the basis of its crystallographic structure, a portion of which is reported in Fig. 1.17 For this purpose, two-body signals have been calculated for the two first-shell chlorine atoms (Hg–Cl1st), for the four second shell chlorine atoms (Hg–Cl2nd), for the four mercury atoms set in the third coordination shell (Hg–Hg), and for the six farther chlorine atoms (Hg–Cl3rd). The MS signal associated with the collinear Cl–Hg–Cl configuration involving the first-shell chlorine atoms has been also calculated assuming a bond angle of 180°. A least-squares fit was carried out in the 2.6–14.0 Å−1k-range, computing the MT radii as proportional to the atomic number and optimizing the overlap between the potential spheres of adjacent atoms. The final optimized values were 1.6 Å and 0.9 Å for Hg and Cl, respectively. The best-fit results are shown in the upper panel of Fig. 2, where the theoretical two- and three-body signals are depicted together with the total theoretical contribution compared with the experimental data. As can be observed, a very good agreement between the theoretical and experimental data is obtained. The amplitude of the Cl–Hg–Cl MS term has been found to be low but still detectable. The structural parameters obtained for this three-body distribution are listed in Table S1 (ESI†), while the obtained E0 and S02 values are listed in Table S2 (ESI†) and the parameters for the double-electron excitations are listed in Table S3 (ESI†). The good agreement between the theoretical and the experimental data is also evident from the corresponding FT spectra shown in the lower panel of Fig. 2. The FT has been calculated in the 2.6–13.6 Å−1 range. Here, it can be observed that the main FT peak is dominated by the Hg–Cl1st contribution, while the features above ca. 2.5 Å can be associated with the second-shell chlorine atoms, with the Hg–Hg signal, and with the third-shell chlorine atoms, which are found at increasing distances (Table 1). In the region above ca. 3.5 Å, the theoretical signal is of a slightly lower intensity with respect to the experimental one, resulting in a not perfect match between the experimental and the fitting data. However, the reproduction of such features in the FT would require the employment of a larger model cluster to include the signals at longer distances, making the number of the fitted parameters prohibitive with respect to the number of experimental points. The complete list of the optimized structural parameters is reported in Table 1, while the E0 value resulted to be 2.1 eV above the first inflection point of the experimental spectrum. Note that the Hg–Cl1st distance obtained by the EXAFS analysis (2.31(2) Å, Table 1) is fully compatible with the value previously determined by means of XRD data (2.283(9) Å)17 also taking into account the so-called foreshortening effect in the latter technique,52 corroborating the goodness of the employed protocol.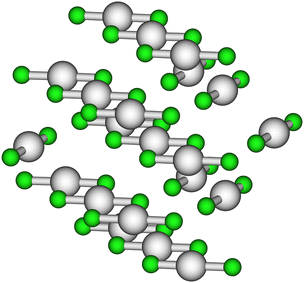 | ||
| Fig. 1 Portion of the HgCl2 crystallographic structure taken from ref. 17. The Hg and Cl atoms are depicted in gray and green, respectively. | ||
| N | R (Å) | σ 2 (Å−2) | β | |
|---|---|---|---|---|
| Hg–Cl1st | 2.0 | 2.31(2) | 0.002(2) | 0.1(1) |
| Hg–Cl2nd | 6.0 | 3.49(3) | 0.025(3) | 0.0(2) |
| Hg–Hg | 4.0 | 4.54(4) | 0.011(4) | 0.5(3) |
| Hg–Cl3rd | 6.0 | 4.77(4) | 0.013(4) | 0.2(3) |
3.2 HgCl2 in solution
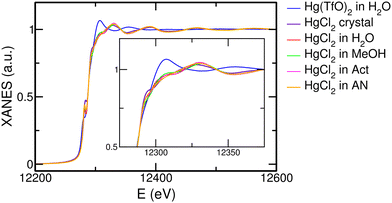
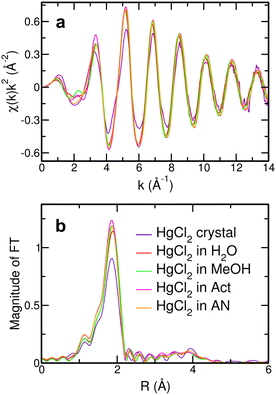
One of the central aims of this work is to determine the influence of the solvent on the structural arrangement of the HgCl2 molecule after its dissolution. The first qualitative insight can be gained by comparing the Hg L3-edge XANES spectra of the HgCl2 crystal and of HgCl2 dissolved in water, MeOH, Act, and AN, together with the XANES spectrum recorded on a Hg(TfO)2 aqueous solution as a comparative system (Fig. 3). As can be observed, the XANES spectra of the HgCl2 crystal and of the HgCl2 solutions present comparable features to one another, albeit small but non-negligible differences that can be better appreciated in the inset of Fig. 3. This is a first clue suggesting that the closest environment of the Hg center is very similar in these systems, regardless of the different nature of the solvent. On the other hand, the XANES spectrum of the Hg(TfO)2 aqueous solution is very different from the previous ones, both in the amplitude and phase of the main oscillations (Fig. 3). The Hg(TfO)2 salt is known to be dissociated in an aqueous solution, giving rise to a hydration complex where the Hg(II) ion is completely surrounded by water molecules.12,18–20 As a consequence, the XANES comparison between these spectra strongly suggests that a different environment around the Hg center occurs after dissolution of the HgCl2 species with respect to the Hg(TfO)2 one and is the first qualitative indication that the HgCl2 molecule is not dissociated in any of the studied solvents. This assumption would also explain the similar shapes of the spectra recorded on the HgCl2 solutions (Fig. 3), being dominated by the Hg–Cl contribution. Further insights can be gained by the comparison among the EXAFS (Fig. 4(a)) and FT spectra (Fig. 4(b)). Here, small differences in the phase of the EXAFS oscillations appear for the HgCl2 solutions (Fig. 4(a)), suggesting the presence of slight differences in distances of the first neighbors around the Hg center. The same circumstance can be observed from different positions of the main FT peak (Fig. 4(b)) and can be interpreted with a lengthening of the Hg–Cl distances following the AN < Act < MeOH < H2O trend.| H2O | MeOH | Act | AN | ||
|---|---|---|---|---|---|
| Hg–Cl | N | 2.0 | 2.0 | 2.0 | 2.0 |
| R (Å) | 2.31(2) | 2.30(2) | 2.29(2) | 2.29(2) | |
| σ 2 (Å−2) | 0.003(2) | 0.002(2) | 0.002(2) | 0.003(2) | |
| β | 0.0(1) | 0.0(1) | 0.0(1) | 0.0(1) |
The structural parameters optimized for the Cl–Hg–Cl distribution, i.e., the bond angle values and standard deviations, are listed in Table S1 (ESI†). Although the EXAFS region possesses a lower sensitivity to the three-body configurations in comparison with the low-energy region of the absorption spectrum, the obtained values could indicate that the HgCl2 molecule vibrates around a linear structure with a root mean square deviation of 4–5°. Note that some authors have previously inferred about a possible deviation from linearity of mercury(II) halide molecules HgX2 dissolved in various solvents.23,27,53,54 This originates from the observation that the ν3(Hg–X) asymmetric stretching becomes weakly active in the Raman spectrum, suggesting a non-centrosymmetric structure of the HgX2 unit, even if the authors pointed out that an unambiguous determination of this mode could not be carried out because of an interference pattern of the solvent.53,54 These studies were later extended to the IR-active modes and compared with XRD data in support of the assertion that the X–Hg–X configuration assumes in solution an angle of 174°.27 Herein, it has to be considered that in a real vibrating system, the probability of finding exactly a linear three-body distribution vanishes.48,55 A more realistic picture should therefore imply the oscillation of the HgCl2 molecule around a linear configuration, this being fully compatible with the appearance of the previously discussed spectral contributions23,27,53,54 and with the mean deviation from linearity that we observed for the Cl–Hg–Cl MS path in the EXAFS data analysis (Table S1, ESI†).
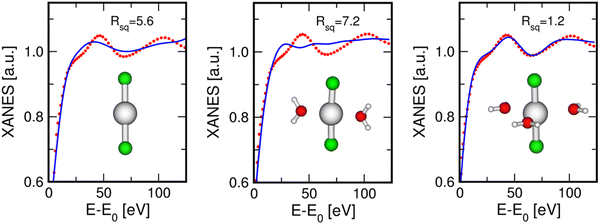
In a further step, we carried out an additional analysis of the EXAFS data collected on the HgCl2 aqueous solution to test the HgCl2(H2O)3 model. For this purpose, an additional Hg–O SS signal associated with three water molecules has been included, and the results of this fitting procedure are shown in Fig. S1 (ESI†), while the optimized structural parameters are listed in Table S4 (ESI†). The agreement between the experimental spectrum and the theoretical signal including the water contribution (Fig. S1, ESI†) is comparable with that obtained for the HgCl2 molecule only (Fig. 5). Considering that the fitting procedure has been carried out including three additional fitting parameters and that the frequency of the Hg–O signal is similar to that of the Hg–Cl one (Fig. S1, ESI†), a quantitative determination of the structural contribution associated with the water molecules is extremely difficult to obtain using the EXAFS technique. Moreover, the Debye–Waller factor of the Hg–O path is quite high (0.075 Å−2 Table S4, ESI†) and this suggests the presence of high configurational disorder of the solvent molecules interacting with the HgCl2 molecule. As a consequence, the amplitude of the EXAFS signal associated with the solvent molecules is quite low and it is mainly detected in the low-k region of the spectrum.35,43,56 This circumstance was already evidenced in an XAS study on HgCl2 in aqueous solution16 and is in line with the high rate of exchange events observed between the coordinating and the outer-sphere water molecules around the HgCl2 molecule obtained by ab initio molecular dynamics simulations.25
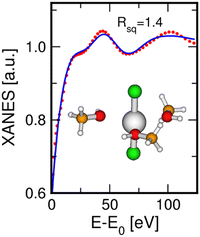
| Solvent | R Hg–Cl (Å) | R Hg–O (Å) | E 0 (eV) | E F (eV) | E S (eV) | A S | Γ exp (eV) |
|---|---|---|---|---|---|---|---|
| H2O | 2.21(8) | 2.75(8) | 0.5 | −3.7 | 11.0 | 11.7 | 3.7 |
| MeOH | 2.20(8) | 2.74(8) | 0.1 | −4.0 | 4.6 | 12.8 | 3.3 |
The XANES data analysis for the water case has also been carried out by taking into account a bent HgCl2 geometry to verify the sensitivity of the XANES data to the Cl–Hg–Cl configuration. For this purpose, fitting procedures have been performed starting from models with 175° and 170° Cl–Hg–Cl angles, plus three water molecules on the equatorial plane. These values have been chosen as some authors previously supported the observation that the HgCl2 molecule assumes a bent configuration in solution with a bond angle of ∼174°.23,27,53,54 The results of these fits are shown in Fig. S2 (ESI†), while the optimized parameters are listed in Table S5 (ESI†). The agreement between the theoretical and the experimental oscillations is similar between these two cases and in comparison to the fit carried out assuming a linear configuration (right panel of Fig. 6), as it is also evident from the similar Rsq values. This result may highlight poor sensitivity of the XANES data to such a small deviation from a linear distribution or, as previously discussed for the EXAFS data analysis, this could indicate that the HgCl2 molecule vibrates in solution around a linear configuration with a root mean square deviation of 4–5°, resulting in an equivalent distribution of all the angle values between ∼180° and 175° in probabilistic terms.
As concerns the HgCl2 molecule in the MeOH solution, the XANES data fit was carried out using a starting model where three MeOH molecules are set in the equatorial plane of the HgCl2 unit, because this was the best-fit model for the aqueous system. In fact, both water and MeOH are O-donor species and it is known that MeOH is the organic solvent that most shares its structural properties with water in terms of coordination geometries and formation of hydrogen-bond networks.58–60 The fit result is shown in Fig. 7, while the optimized parameters are listed in Table 3. As can be observed, this model also provided a theoretical XANES signal in very good agreement with the experimental one for the MeOH solution, as is also testified by the low Rsq value, corroborating the supposition that the solvent molecules around the HgCl2 unit are arranged with the same geometry both in aqueous and MeOH solutions. The best-fit structural parameters show Hg–Cl and Hg–O distances comparable to those found in the XANES analysis of the aqueous solution (Table 3).
An attempt to fit the XANES spectrum recorded on the 0.1 M HgCl2 solution in Act has also been carried out using the model involving three solvent molecules normal to the HgCl2 molecule. The result of this fit is shown in Fig. S3 (ESI†), while the optimized parameters are listed in Table S6 (ESI†). As can be observed, the quality of the fit is acceptable, although it is possible to further improve the agreement between the experimental and the theoretical oscillations. This is because, despite being an O-donor species like water and MeOH, the Act molecule possesses a more complicated structure, where the Hg–O–C MS paths are expected to give a non-negligible contribution due to the so-called “focusing effect”. A systematic study of the HgCl2 coordination in this solvent would, therefore, require the evaluation of different configurations and the absence of putative starting structures makes it more challenging and beyond the scope of the present work. For the same reasons, the fit of the XANES spectrum recorded on the AN solution was not attempted here, as this solvent has an even more different chemical nature, where more marked MS effects are expected due to the linearity of the molecule.
4 Conclusions
Structural characterization of the local environment around mercury after dissolution of the HgCl2 molecule has been carried out by means of a combined approach between EXAFS and XANES data analysis. The analysis of the EXAFS part of the Hg L3-edge absorption spectra recorded on HgCl2 solutions in water, MeOH, Act and AN showed that the Hg–Cl distance (2.29(2)–2.31(2) Å) is always comparable to that determined from the EXAFS analysis of crystalline HgCl2 (2.31(2) Å). The HgCl2 molecule is, therefore, found not to dissociate after dissolution in the studied solvents. Small but detectable differences in the Hg–Cl distance obtained for the solutions follow the AN < Act < MeOH < H2O trend and suggest a different degree of interaction between the solvent molecules and the HgCl2 unit. A small sensitivity of the EXAFS analysis to the solvent molecules interacting with HgCl2 was detected and it is probably derived from the high degree of configurational disorder associated with this contribution. The XANES analysis, which is less affected by thermal and structural broadening, was, therefore, employed for the first time on these systems to shed light on the still elusive arrangement of the solvent around the HgCl2 molecule. Our analysis showed that among the various coordinations reported in the literature, the model where three water molecules are set on the equatorial plane of the HgCl2 unit to form a trigonal bipyramidal geometry is the most compatible with the XANES data. This model was also extended to the MeOH solution and the XANES results support the hypothesis that the MeOH molecules are arranged around HgCl2 in a similar manner compared to what was found for the water case. As concerns the three-body distribution in the HgCl2 molecule, the EXAFS analysis determined a Cl–Hg–Cl bond angle value of 180° with a 4–5° standard deviation. In addition, XANES data analysis for the water case carried out with Cl–Hg–Cl bond angles of 175° and 170° showed similar results with respect to the linear case. Altogether these findings suggest that the HgCl2 molecule vibrates in the solution around a linear configuration and explain the data previously presented in the literature in support of a possible deviation of HgCl2 from linearity. The considerations reported here therefore represent a step forward in the understanding of the dissolution mechanism of the HgCl2 compound in the inspected media and have the potentiality of better clarifying the structural arrangement of the solvent molecules around HgCl2, an issue that sees a proliferation of putative structures previously presented in the scientific literature.Conflicts of interest
There are no conflicts to declare.Acknowledgements
We acknowledge financial support from the Italian Ministry of University and Research (MIUR) through Grant “PRIN 2017, 2017KKP5ZR, MOSCATo” and from the University of Rome “La Sapienza” Grant RG11916B702B43B9. Elettra Sincrotrone Trieste S. C. p. A. and its staff are acknowledged for synchrotron radiation beam time and laboratory facilities (proposal number 20180157).Notes and references
- K. W. Jennette, Environ. Health Perspect., 1981, 40, 233–252 CrossRef CAS PubMed.
- K. Gwozdzinski, Arch. Environ. Contam. Toxicol., 1992, 23, 426–430 CrossRef CAS PubMed.
- L. M. Barone, C. Shih and B. P. Wasserman, J. Biol. Chem., 1997, 272, 30672–30677 CrossRef CAS PubMed.
- R. Ynalvez, J. Gutierrez and H. Gonzales-Cantu, Biometals, 2016, 29, 781–788 CrossRef CAS PubMed.
- P. Grandjean, P. Weihe, R. F. White, F. Debes, S. Araki, K. Yokoyama, K. Murata, N. Sorensen, R. Dahl and P. J. Jorgensen, Neurotoxicol. Teratol., 1997, 19, 417–428 CrossRef CAS PubMed.
- G. J. Myers, P. W. Davidson, C. Cox, C. F. Shamlaye, E. Cernichiari and T. W. Clarkson, Environ. Res., 2000, 83, 275–285 CrossRef CAS PubMed.
- G. J. Myers, P. W. Davidson, C. Cox, C. F. Shamlaye, D. Palumbo, E. Cernichiari, J. Sloane-Reeves, G. E. Wilding, J. Kost, L. S. Huang and T. W. Clarkson, Lancet, 2003, 361, 1686–1692 CrossRef CAS.
- F. M. M. Morel, A. M. L. Kraepiel and M. Amyot, Annu. Rev. Ecol. Syst., 1998, 29, 543–566 CrossRef.
- L. Ji, S. W. Thiel and N. G. Pinto, Ind. Eng. Chem. Res., 2008, 47, 8396–8400 CrossRef CAS.
- M. Abai, M. P. Atkins, A. Hassan, J. D. Holbrey, Y. Kuah, P. Nockemann, A. A. Oliferenko, N. V. Plechkova, S. Rafeen, A. A. Rahman, R. Ramli, S. M. Shariff, K. R. Seddon, G. Srinivasan and Y. Zou, Dalton Trans., 2015, 44, 8617–8624 RSC.
- S. E. E. Warrag, E. O. Fetisov, D. J. G. P. van Osch, D. B. Harwood, M. C. Kroon, J. I. Siepmann and C. J. Peters, Ind. Eng. Chem. Res., 2018, 57, 9222–9230 CrossRef CAS.
- V. Migliorati, G. Fazio, S. Pollastri, A. Gentili, P. Tomai, F. Tavani and P. D'Angelo, J. Mol. Liq., 2021, 329, 115505 CrossRef CAS.
- J. E. Gray and M. E. Hines, Appl. Geochem., 2006, 21, 1819–1820 CrossRef CAS.
- C. T. Driscoll, R. P. Mason, H. M. Chan, D. J. Jacob and N. Pirrone, Environ. Sci. Technol., 2013, 47, 4967–4983 CrossRef CAS PubMed.
- P. Seller, C. A. Kelly, J. W. M. Rudd and A. R. MacHutchon, Nature, 1996, 380, 694–697 CrossRef.
- R. Åkesson, I. Persson, M. Sandström and U. Wahlgren, Inorg. Chem., 1994, 33, 3715–3723 CrossRef.
- V. Subramanian and K. Seff, Acta Crystallogr., Sect. B: Struct. Crystallogr. Cryst. Chem., 1980, 36, 2132–2135 CrossRef.
- G. Chillemi, G. Mancini, N. Sanna, V. Barone, S. Della Longa, M. Benfatto, N. V. Pavel and P. D’Angelo, J. Am. Chem. Soc., 2007, 129, 5430–5436 CrossRef CAS PubMed.
- G. Mancini, N. Sanna, V. Barone, V. Migliorati, P. D'Angelo and G. Chillemi, J. Phys. Chem. B, 2008, 112, 4694–4702 CrossRef CAS PubMed.
- I. Persson, L. Eriksson, P. Lindqvist-Reis, P. Persson and M. Sandström, Chem. – Eur. J., 2008, 14, 6687–6696 CrossRef CAS PubMed.
- W. Lu, P. S. Barber, S. P. Kelley and R. D. Rogers, Dalton Trans., 2013, 42, 12908–12916 RSC.
- W. Y. Shiu, K. C. Ma, D. Mackay, J. N. Seiber and R. D. Wauchope, in Solubilities of Pesticide Chemicals in Water Part II: Data Compilation, ed. G. W. Ware, H. N. Niggs and A. Bevenue, Springer, New York, New York, NY, 1990, pp. 15–187 Search PubMed.
- M. Sandström, Acta Chem. Scand., Ser. A, 1978, 32, 627–641 CrossRef.
- J. Gutknecht, J. Membr. Biol., 1981, 61, 61–66 CrossRef CAS.
- L. Castro, A. Dommergue, A. Renard, C. Ferrari, A. Ramírez-Solís and L. Maron, Phys. Chem. Chem. Phys., 2011, 13, 16772–16779 RSC.
- J. Hernández-Cobos, A. Ramírez-Solís, L. Maron and I. Ortega-Blake, J. Chem. Phys., 2012, 136, 014502 CrossRef PubMed.
- I. Persson, M. Sandström and P. L. Goggin, Inorg. Chim. Acta, 1987, 129, 183–197 CrossRef CAS.
- C.-I. Brändén, Acta Chem. Scand., 1963, 17, 1363–1374 CrossRef.
- K. Balasubramani, P. Thomas, G. Bocelli and A. Cantoni, J. Coord. Chem., 2005, 58, 1689–1694 CrossRef CAS.
- A. Crochet and K. Fromm, Z. Anorg. Allg. Chem., 2010, 636, 1484–1496 CrossRef CAS.
- I. Galkina, A. Tufatullin, D. Krivolapov, Y. Bakhtiyarova, D. Chubukaeva, V. Stakheev, V. Galkin, R. Cherkasov, B. Büchner and O. Kataeva, CrystEngComm, 2014, 16, 9010–9024 RSC.
- I. Persson, C. D. Kailash and K. Yoshiaki, Acta Chem. Scand., 1990, 44, 433–442 CrossRef CAS.
- S. Ahrland, I. Persson and R. Portanova, Acta Chem. Scand., Ser. A, 1981, 35, 49–60 CrossRef.
- S. Ahrland, E. Hansson, A. Iverfeldt and I. Persson, Acta Chem. Scand., Ser. A, 1981, 35, 275–285 CrossRef.
- M. Busato, A. Melchior, V. Migliorati, A. Colella, I. Persson, G. Mancini, D. Veclani and P. D’Angelo, Inorg. Chem., 2020, 59, 17291–17302 CrossRef CAS PubMed.
- V. Migliorati, A. Gibiino, A. Lapi, M. Busato and P. D’Angelo, Inorg. Chem., 2021, 60, 10674–10685 CrossRef CAS PubMed.
- M. Busato, P. D'Angelo, A. Lapi, M. Tolazzi and A. Melchior, J. Mol. Liq., 2020, 299, 112120 CrossRef CAS.
- M. Busato, A. Lapi, P. D’Angelo and A. Melchior, J. Phys. Chem. B, 2021, 125, 6639–6648 CrossRef CAS PubMed.
- M. Busato, P. D’Angelo and A. Melchior, Phys. Chem. Chem. Phys., 2019, 21, 6958–6969 RSC.
- P. D'Angelo, V. Migliorati, F. Sessa, G. Mancini and I. Persson, J. Phys. Chem. B, 2016, 120, 4114–4124 CrossRef PubMed.
- V. Migliorati, A. Caruso and P. D’Angelo, Inorg. Chem., 2019, 58, 14551–14559 CrossRef CAS PubMed.
- V. Migliorati, F. Sessa, G. Aquilanti and P. D’Angelo, J. Chem. Phys., 2014, 141, 044509 CrossRef PubMed.
- A. Filipponi and P. D’Angelo, XAS in Liquid Systems, John Wiley & Sons, Ltd, 2016, ch. 25, pp. 745–771 Search PubMed.
- A. Di Cicco, XAS Res. Rev., 2016, 15, 1–7 Search PubMed.
- P. D’Angelo, M. Benfatto, S. Della Longa and N. V. Pavel, Phys. Rev. B: Condens. Matter Mater. Phys., 2002, 66, 064209 CrossRef.
- A. D. Cicco, G. Aquilanti, M. Minicucci, E. Principi, N. Novello, A. Cognigni and L. Olivi, J. Phys.: Conf. Ser., 2009, 190, 012043 CrossRef.
- A. Filipponi, A. Di Cicco and C. R. Natoli, Phys. Rev. B: Condens. Matter Mater. Phys., 1995, 52, 15122–15134 CrossRef CAS PubMed.
- A. Filipponi and A. Di Cicco, Phys. Rev. B: Condens. Matter Mater. Phys., 1995, 52, 15135–15149 CrossRef CAS PubMed.
- L. Hedin and S. Lundqvist, Solid State Phys., 1969, 23, 1–181 CAS.
- M. Benfatto and S. Della Longa, J. Synchrotron Radiat., 2001, 8, 1087–1094 CrossRef CAS PubMed.
- M. Benfatto, S. Della Longa and C. R. Natoli, J. Synchrotron Radiat., 2003, 10, 51–57 CrossRef CAS PubMed.
- P. Moeck, O. Čertik, B. Seipel, R. Groebner, L. Noice, G. Upreti, P. Fraundorf, R. Erni, N. D. Browning, A. Kiesow and J.-P. Jolivet, Two- and Three-Dimensional Methods for Inspection and Metrology III, 2005, pp. 206–217 Search PubMed.
- J. Smith and T. Brill, Inorg. Chim. Acta, 1976, 18, 225–229 CrossRef CAS.
- D. N. Waters and Z. Kantarci, J. Raman Spectrosc., 1977, 6, 251–256 CrossRef CAS.
- A. Filipponi, A. Di Cicco, R. Zanoni, M. Bellatreccia, V. Sessa, C. Dossi and R. Psaro, Chem. Phys. Lett., 1991, 184, 485–490 CrossRef CAS.
- M. Busato, A. Tofoni, G. Mannucci, F. Tavani, A. Del Giudice, A. Colella, M. Giustini and P. D’Angelo, Inorg. Chem., 2022, 61, 8843–8853 CrossRef CAS PubMed.
- M. Benfatto, C. R. Natoli, A. Bianconi, J. Garcia, A. Marcelli, M. Fanfoni and I. Davoli, Phys. Rev. B: Condens. Matter Mater. Phys., 1986, 34, 5774–5781 CrossRef CAS PubMed.
- V. Migliorati and P. D'Angelo, RSC Adv., 2013, 3, 21118–21126 RSC.
- V. Migliorati and P. D’Angelo, Chem. Phys. Lett., 2015, 633, 70–75 CrossRef CAS.
- M. Busato, A. Del Giudice, V. Di Lisio, P. Tomai, V. Migliorati, A. Gentili, A. Martinelli and P. D’Angelo, ACS Sustainable Chem. Eng., 2021, 9, 12252–12261 CrossRef CAS PubMed.
Footnote |
| † Electronic supplementary information (ESI) available. See DOI: https://doi.org/10.1039/d2cp02106d |
| This journal is © the Owner Societies 2022 |

