Time evolution of entanglement of electrons and nuclei and partial traces in ultrafast photochemistry†
Martin
Blavier
 ab,
R. D.
Levine
bc and
F.
Remacle
 *ab
*ab
aTheoretical Physical Chemistry, University of Liège, 4000 Liège, Belgium. E-mail: fremacle@uliege.be
bThe Fritz Haber Research Center for Molecular Dynamics, The Hebrew University of Jerusalem, 91904 Jerusalem, Israel
cDepartment of Chemistry and Biochemistry and Department of Molecular and Medical Pharmacology, David Geffen School of Medicine, University of California, Los Angeles, CA 90095, USA
First published on 11th July 2022
Abstract
Broad in energy optical pulses induce ultrafast molecular dynamics where nuclear degrees of freedom are entangled with electronic ones. We discuss a matrix representation of wave functions of such entangled systems. Singular Value Decomposition (SVD) of this matrix provides a representation as a sum of separable terms. Their weights can be arranged in decreasing order. The representation provided by the SVD is equivalent to a Schmidt decomposition. If there is only one term or if one term is already a good approximation, the system is not entangled. The SVD also provides either an exact or a few term approximation for the partial traces. A simple example, the dynamics of LiH upon ultrafast excitation to several non-adiabatically coupled electronic states, is provided. The major contribution to the entanglement is created during the exit from the Franck Condon region. An additional contribution is the entanglement due to the nuclear motion induced non-adiabatic transitions.
1. Introduction
Progress in laser atto science has now reached the point where few cycle, few femtosecond pulses are available in the deep UV1,2 and could promote neutral polyatomic molecules to bound excited states, thereby providing new insights on photodynamics in small and bio molecules3–9 and large band gap materials.10 The broad energy width of 2–3 fs pulses in the deep UV means that several electronic states are coherently excited.11,12 The short excitation time also implies that the nuclear configuration of the molecules is localized in the Franck Condon (FC) region. Due to the localization the vibrational wave functions are coherent superpositions of stationary vibrational states. Even starting with a cold molecular ground state, shortly after excitation by the short pulse, the wave function of the excited state typically cannot be written as a product of electronic and vibrational wave functions. Rather, the wave function describes an entangled motion of electronic and nuclear modes meaning that they cannot be described independently of one another. There is no electronic state of the molecule nor is there a vibrational state.Entanglement is an extensively discussed strictly quantum phenomena.13–15 It is often, as in quantum computing,14 used for (two or more) identical systems that are coupled. The early example was two entangled photons emitted from the same source.16,17 But the two systems need not be identical, one can entangle vibrational modes in a polyatomic molecule,18 or scattering channels in chemical reactions.19,20 Entanglement between the electronic and nuclear degrees of freedom was previously studied for stationary eigenstates of vibronic Hamiltonians21,22 and also for time-dependent vibronic wave functions23–26 Here we highlight the coupling of two motions that are characterized by qualitatively different time scales, the electrons and the nuclei and how it affects the time evolution of their entanglement. The entanglement of the two is the physical opposite of the Born–Oppenheimer separation. It is made possible by the ultrafast optical excitation.27–29 Ultrafast attosecond photoionization and the resulting entanglement between the photoelectron and a cation can also be used to probe the vibrational coherences of the cation.30
To solve the dynamics it is practical to represent the Hamiltonian and other operators as matrices in a finite basis. For the electrons we use Ne adiabatic electronic states covering the energy span of the optical pulse. Since the initially excited state is in the FC region we use orthonormal functions |gi〉 localized on points of a discrete grid, one grid per vibrational coordinate.11 For the LiH diatomic molecule that will be our numerical example we use a grid of Ng points. A wave function in a Ng × Ne dimensional space is a tensor product or explicitly a double sum of electronic and grid terms. The adiabatic electronic states, |ej〉, are obtained by diagonalizing the electronic Hamiltonian at each grid point. Near points of avoided crossings such electronic states can be quite different for nearby grid points. The non crossing rule insures however that the index j is unique and therefore the wave function
 | (1) |
Our aim is to reduce the number of terms in eqn (1) that are necessary for an exact or a realistic approximation. We shall show that a finite single sum of Ne or even fewer terms suffices. This resulting single sum of terms is equivalent to the Schmidt decomposition.13,14,31 The number of terms in that single sum is called the Schmidt number or the rank of the state. It provides a quantification of the entanglement of the state: a separable state will have a Schmidt decomposition involving only one term and will therefore have a Schmidt number of 1 whereas an entangled state will have a larger Schmidt number. The compaction of the wave function to a single sum also offers a useful route to the partial traces. These arise when one intends to compute expectation values involving observables that act only on one system and not on the other.14
2. Theory
2.1 The matrix representation of the wave function
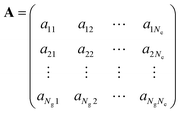
We rewrite the vector a of the coefficients of the wave function at each time point as a rectangular Ng × Ne matrix:This operation is the inverse to the vectorization of a matrix32 and is called matricization. It takes a clear advantage of the physics of the problem where each column is the coefficients along the grid of a particular electronic state while each row is the coefficients of the different electronic states at a particular grid point. The rectangular matrix A can be resolved using the singular value decomposition theorem,33 SVD, in the form:
 | (3) |
For the typical case where Ng > Ne, one can show that A has at most Ne finite singular values that are all positive and Σ is a diagonal matrix of dimension Ne × Ne with the singular values along its diagonal. un and vn are respectively the left and right singular vectors of A. The vectors can be chosen as orthonormal so that Avn = σnun and A†un = σnvn. A compact form of the matrix A is A = UΣV† and it is also useful to note the pair of compact identities A†A = VΣ2V† and AA† = UΣ2U†.
2.2 The chemical physics of the singular vectors
The singular vectors are the eigenvectors of the square and non-negative matrices A†A and AA†, explicitly AA†un= σn2un and A†Avn = σn2vn. It follows that the singular vector vn has the (shorter) length, Ne, and its components are the components of the different electronic states of the system in this n’th singular vector. We call the vectors vn the electronic singular vectors below. On the other hand, the singular vector un has the (longer) length, Ng, and its components are the components of the different states of the grid in this singular vector. We call them the nuclear singular vectors. In the single sum of separable terms vn is the electronic part and un is the nuclear or grid part.The essential practical point is that the SVD theorem states that when we keep Ne terms, the maximal possible number, the SVD representation of A is exact. However, if we rank the (positive) singular values σn by their decreasing size and keep only a smaller number, say, Nmin, of terms in the sum
 | (4) |
2.3 The partial traces
When one wants to consider observables defined only for a particular subsystem it is useful to define the concept of a partial trace. The expectation value of an observable Ô that is diagonal in the electronic subspace, {|ej〉}, and independent of the nuclear system in the entangled state |Ψ〉, eqn (1), is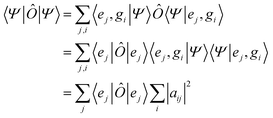 | (5) |
 | (6) |
 , are the populations of the different electronic states while the off-diagonal elements are the electronic coherences. This justifies regarding
 ![[small rho, Greek, macron]](https://www.rsc.org/images/entities/i_char_e0d1.gif) el as a density matrix for the electronic degrees of freedom. In terms of the matrix A on which we perform the SVD, we write the density
el as a density matrix for the electronic degrees of freedom. In terms of the matrix A on which we perform the SVD, we write the density ![[small rho, Greek, macron]](https://www.rsc.org/images/entities/i_char_e0d1.gif) el as
el as![[small rho, Greek, macron]](https://www.rsc.org/images/entities/i_char_e0d1.gif) el = A†A el = A†A | (7) |
 | (8) |
 . Note that both partial trace matrices have a unit trace as expected. Either one can be expressed in terms of the singular vectors, for example:
 | (9) |
2.4 An optimal approximation
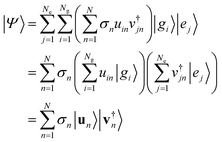
The Schmidt decomposition of the wave function keeping all the singular values is an exact representation. There is however an important secondary conclusion: the analysis based on the SVD theorem shows that the Schmidt decomposition of the wave function provides the minimal number of separable terms that are needed to achieve a given accuracy. The more terms are kept the more accurate is the result. Even keeping just one term, which is a separable approximation, is in general a better approximation than keeping just one term in the starting form, eqn (1), of the wave function.The Schmidt decomposition of the wave function is based on using eqn (3) for the coefficients aij in eqn (1)
 | (10) |
 | (11) |
From the expression of the wave function in terms of the singular components (eqn (10)), one can readily write the expression of the full density matrix:
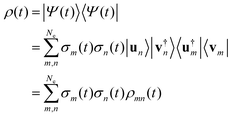 | (12) |
eqn (12) does not lead to a separable expression in terms of the partial traces ![[small rho, Greek, macron]](https://www.rsc.org/images/entities/i_char_e0d1.gif) el and
el and ![[small rho, Greek, macron]](https://www.rsc.org/images/entities/i_char_e0d1.gif) nucl defined above. Its terms ρmn(t) off diagonal in the singular index are essential for describing the vibronic coherences in observables such as the dipole moment or the total momentum, see the Results and discussion section below.
nucl defined above. Its terms ρmn(t) off diagonal in the singular index are essential for describing the vibronic coherences in observables such as the dipole moment or the total momentum, see the Results and discussion section below.
2.5 An illustration of this approach: the photoexcitation of LiH
We chose the LiH molecule to provide an illustration for the description of the time evolution of the entanglement for two reasons: being a diatomic molecule, a grid-based description of the wavefunction is greatly simplified, thereby significantly decreasing the computational cost of the dynamics; and the computational data was already available within our group. The simple one-dimensional grid also allows developing a better intuition of the singular vectors of the nuclei as previously described.The electronic structure of the LiH molecule was computed at the state averaged CAS-SCF(4, 20) level using the 6-311++G(3df, 3dp) Gaussian basis set as a function of the internuclear distance, as described in ref. 34. Only the first seven Σ electronic states were retained in the description of the dynamics. This provided the potential energy curves (PEC) for each electronic state as well as the non-adiabatic couplings (NAC) between them. The potential energy curves, are plotted in Fig. 1a. The NAC and transition dipole curves are given in Fig. S1 and S2 of the ESI.†
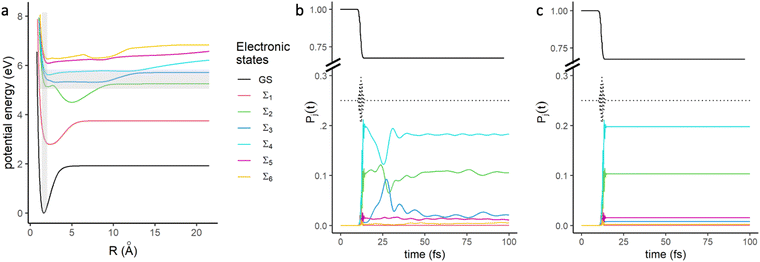 | ||
Fig. 1 (a) Potential energy curves of the 8 lowest Σ states of LiH.34 The FC region is shown the energy bandwidth of the UV pulse are shown in shaded grey areas. (b) Time evolution of the populations of the electronic states,  , computed for the dynamics that includes the NAC in the Hamiltonian (eqn (13)) and (c) the dynamics without NAC (c). The excited electronic states are identified in the inset. The time profile of the electric field of the exciting pulse is represented by the black dotted line. , computed for the dynamics that includes the NAC in the Hamiltonian (eqn (13)) and (c) the dynamics without NAC (c). The excited electronic states are identified in the inset. The time profile of the electric field of the exciting pulse is represented by the black dotted line. | ||
The wavefunction of the molecular system is described onto a grid of 512 points along the internuclear distance R. In this basis, the wavefunction has the expansion given in eqn (1).
In this basis, the matrix of the molecular Hamiltonian for the LiH molecule takes the following form (we use atomic units, a.u., throughout)
| Hij,kl(t) = Vij,klδikδjl + (TN)ij,klδjl −i (τjlδik)·pij,kl − E(t)·(μjl)δik | (13) |
In eqn (13), i and k are indices on the grid and j and l indices of the electronic states. Vij,klδikδjl is diagonal on both nuclear (i, k) and electronic (j, l) indices and correspond to the potential energy for a given electronic state and at a given nuclear geometry.(TN)ij,klδjl is diagonal on electronic indices, but non-diagonal on the grid and describes the nuclear kinetic energy. This nonlocal operator is approximated by fourth order finite differences.11 The third term describes the non-adiabatic interactions, which couple the derivative couplings between electronic states (τjlδik) and the momentum on the grid pij,kl. The last term describes the interaction of the molecule with the electric field of the optical pulse, E(t), in the dipole approximation. The transition dipole moments between two electronic states, (μjl)δik, are diagonal on the grid.
The quantum dynamics is computed by solving numerically the time-dependent Schrödinger equation using a fourth order Runge–Kutta method. The propagation in time of the coefficients, aij, is by the Hamiltonian using matrix-vector multiplication as was early on formulated by Dirac,  . The exciting pulse is given by eqn (14) below. It is centered at 12.1 fs, its carrier frequency, ħν, is 5.5 eV, the amplitude of the electric field is 0.02 a.u. and its full width at half maximum (FWHM) is 1.98 fs. These parameters correspond to a deep UV optical pulse similar to those which could become readily available to experimentalists in the near future.2
 | (14) |
3. Results and discussion
To investigate the time evolution of the entanglement in the LiH molecule, we first computed the time evolution for the probabilities of each electronic state, j, . This evolution is plotted in Fig. 1b.
Before the pulse, the wave packet is localized only on the ground state (GS). The optical pulse then causes amplitude transfer from the GS towards excited electronic states which possesses the largest electric dipole moment from the GS in the FC region. These states are the Σ4 and Σ2 electronic states while Σ3 is almost dark, see Fig. S2 (ESI†) for the transition dipole moments. After the pulse, the population on the ground state remains essentially constant, whereas the populations of the higher excited electronic states significantly change in the first 50 fs due to the effect of non-adiabatic couplings (NAC). The strongest NACs (Fig. S1, ESI†) are taking place between the pairs of states, Σ2 − Σ3, and Σ3 − Σ4, in the range of 2 to 5 Å, which results into an amplitude transfer from the two most populated excited states, Σ2 and Σ4, to Σ3 at the exit of the FC region up to ≈25 fs and then to a transfer back to these two states from Σ3 at ≈30 fs. At longer times, the populations in Σ2 and Σ4 are the largest and do not vary significantly. There are exchange of population between Σ2 and Σ3 due a smaller NAC coupling between 5 and 10 Å.
To gain insight into the impact of NAC in the entanglement during the time evolution, another dynamics was computed without including the NAC (which amounts to removing the (τjlδik)·pij,kl terms in the Hamiltonian of eqn (13)). For comparison, the time evolution for the populations of each electronic state of this dynamics without NAC is shown in Fig. 1c. They are stationary after the pulse. This does not mean, however, that the wave packets are not moving on their respective electronic state but rather that there is no amplitude transfer. Note also that when the NAC is not included in the dynamics, there is essentially no population in Σ3.
We compute the SVD of the wave function at each time of the dynamical evolution to assess the rank of the best possible approximation of the wave function at each moment of the dynamics. At each value of time, we obtain a set of singular values, and a left and right eigenvector, the nuclear and electronic singular vectors respectively. The time evolution of the singular values, σn in eqn (4), is plotted in Fig. 2 for the case of the dynamics that includes the NAC in the Hamiltonian (eqn (13)) shown in Fig. 1b.
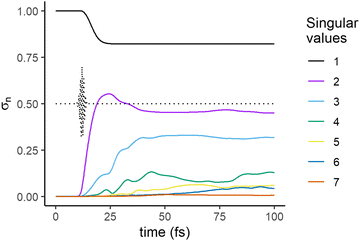 | ||
| Fig. 2 Time evolution of the singular values, σn, eqn (4), computed for the dynamics that includes the NAC term in the Hamiltonian (eqn (13)) shown in Fig. 1b. The time profile of the electric field of the exciting pulse is shown in dotted lines. | ||
Before the pulse, the wave packet is localized in the GS, a situation which is a trivial example of a separable state. This is confirmed by the presence of only one singular value (black line in Fig. 2) in the decomposition. During the pulse, amplitude transfers begin to take place between the GS and the excited electronic states, leading to the appearance of second singular value (violet) in the second half of the pulse. The overall state of the molecule is now entangled, as its Schmidt decomposition (eqn (10)) requires more than one term. Shortly after the end of the pulse, after ≈15 fs, a third singular value (blue) arises. A fourth and a fifth smaller singular values arise at later times, at 20 and 30 fs respectively and a 6th one at ≈60 fs. The 4th and 5th singular eigenvalues get very close at ≈25 fs and then at ≈70 fs, see Fig. S3 (ESI†) for a focus on this range of time. At each time step, the singular values are obtained as the eigenvalues of a semi-positive Hermitian matrix, eqn (9). When considered as a function of time, the different eigenvalues do not cross.
The first avoided crossing is due to the strong non adiabatic interaction between Σ3 and Σ2 in the range 3–5 Å (see Fig. S1, ESI†) and the second to the NAC between these two states at ≈10 Å. At the avoided crossings, the relative weights of the singular electronic eigenstates on Σ3 and Σ2 interchange (Fig. 5c below and Fig. S3, ESI†) but there is no discontinuity in the singular nuclear states.
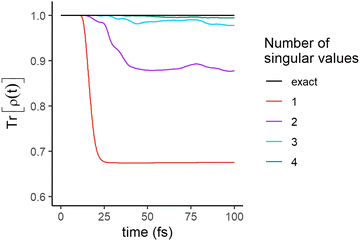
The significance of a singular value can be assessed from how much it contributes to the trace of the full density matrix,  . We show in Fig. 3 the convergence of Tr[ρ(t)] computed for an increasing number of singular values. The trace of the density matrix is reaching values very close to unity with 2 singular values at the end of the pulse and a third and a fourth one are needed after ≈30 and ≈50 fs respectively. The 5th and the 6th have negligible contributions.
The time evolution of the entanglement of the wave function is governed by the time evolution of singular values shown in Fig. 2. In order to understand which features of the dynamics govern their timings, we next turn to the physical meaning of the left and right singular vectors in the decomposition (4).
As discussed in Section 2 above, the right singular vectors, vn, represent the electronic component of a given term in the singular decomposition, eqn (4). Their time evolution reflects the time evolution of the localization of the wave packet on the electronic states. The left eigenvectors, un, correspond to the weights of the singular states on the grid and provide the complementary picture of their localization in the nuclear subspace as time evolves. In the following, we call the left singular eigenvectors, un, and the right singular eigenvector, vn, the nuclear and electronic singular eigenvectors respectively.
The physical meaning of the first singular state in the singular decomposition (eqn (4)) is seen in Fig. 4a and b, where the weights of the electronic singular eigenvector, v1, on the electronic states are shown in panel a and the localization of the nuclear singular eigenvector u1 on the grid in panel b.
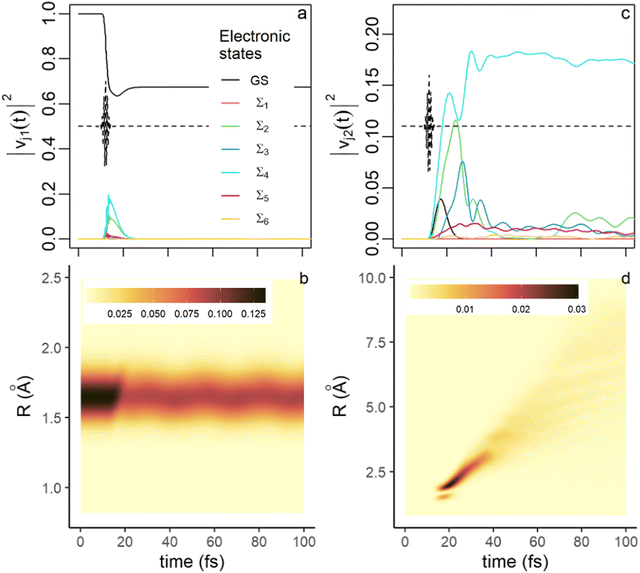 | ||
| Fig. 4 Physical meaning of the first and the second singular states. (a) Time evolution of the weights, |vj1(t)|2, eqn (11), of the electronic singular eigenvector, v1, of the decomposition eqn (4) on the electronic states for the first 100 fs of the dynamics (the color code is the same as in Fig. 1, see inset). (b) Heatmap of the weights, |ui1(t)|2, eqn (11), of the nuclear singular eigenvector, u1, on the grid points, i (R, ordinate) as a function of time (abscissa). (c) Time evolution of |vj2(t)|2, (d) heatmap of localization of |ui2(t)|2 as a function of time on the grid. The weights are multiplied by square of the singular values, σn2, n = 1 or 2. The color code for the heatmaps is shown as an inset in (b and d). | ||
As can be seen from Fig. 4a and b, the first component of the singular decomposition, eqn (4), is localized on the GS in the FC region. During and shortly after the pulse, v1 acquires significant weights on the Σ2 and Σ4 states (Fig. 4a). These are the states that fall in the energy bandwidth of the pulse (Fig. 1a) and carry significant transition dipoles (Fig. S2, ESI†). Since the transfer of amplitude to excited states occurs in the FC region, the localization on the grid of these three electronic states is fully accounted for by the u1 nuclear singular vector during the pulse (Fig. 4b). After the pulse, the first component remains fully localized on the GS and in the FC region. Its magnitude decreases because only ≈70% of the wave packet remains in the GS. Since the fraction of the wave packet localized on the GS is no longer an eigenstate, the oscillations seen in Fig. 4b reflect the vibrational motion in the GS well.
The rise of the singular value of the second component, σ2, in the second half of the pulse (see Fig. 2) corresponds to the decrease in σ1 when the wave packets on Σ2 and Σ4 begin exiting the FC region. At short time (up to 20 fs), the electronic singular vector, v2, (Fig. 4c), is localized on Σ4 and Σ2, the two excited states most populated by the pulse (see Fig. 1) and on the GS, with a rising smaller component on Σ3. These four electronic states are still mainly localized in the FC region, as shown in Fig. 4d. After 30 fs, v2 is localized on the Σ4 state, which is the excited state with the highest population (Fig. 1b). The changes in the electronic composition are reflected by the localization of nuclear singular vector, u2, on the grid shown in Fig. 4d. The weight in the FC region progressively fades and the localization of the u2 vector shifts to larger R values, that reflects the motion of the wave packet to larger R values on the PEC shown in Fig. 1a.
The localization of the third component in electronic and grid subspaces is shown in Fig. 5a and b respectively. This component becomes significant after 20 fs. Up to 25 fs, the electronic singular vector, v3, is mostly localized on the Σ3 state, whose population rises at the end of the pulse (see Fig. 1b) due to the NAC at the exit of the FC region (see Fig. S2, ESI†). At 25 fs, the largest weight shifts from Σ3 to Σ2 to mainly localize on Σ2 at long times. This shift coincides with the rise of the Σ3 component in the fourth electronic singular vector v4 (Fig. 5c). The localization of the nuclear singular vector u3 on the grid (Fig. 5b) reflects the shift in the dominant electronic state in v3. After 40 fs, one sees two branches for u3 on the grid, that reflect the double well of the PES of the Σ2 state (Fig. 1a). The main branch reflects the localization of the third component in the shallow well of Σ2 at large R values while the less intense one corresponds to the fraction of the third component localized in the small well of Σ2 close to the FC region. The fourth component (Fig. 5c and d) has a more minor contribution to the dynamics due to the smaller value of σ42(t). After 25 fs, it localizes on the Σ3 state with small weights on Σ5 and Σ6. At short time, the nodal patterns seen in Fig. 5b and d are mainly induced by the orthogonality of the un vectors. At longer time, in regions of the grid where the non adiabatic coupling is strong and two adiabatic states contribute to the electronic singular vector, these patterns are modulated by the beatings of the vibronic coherence in space and in time.
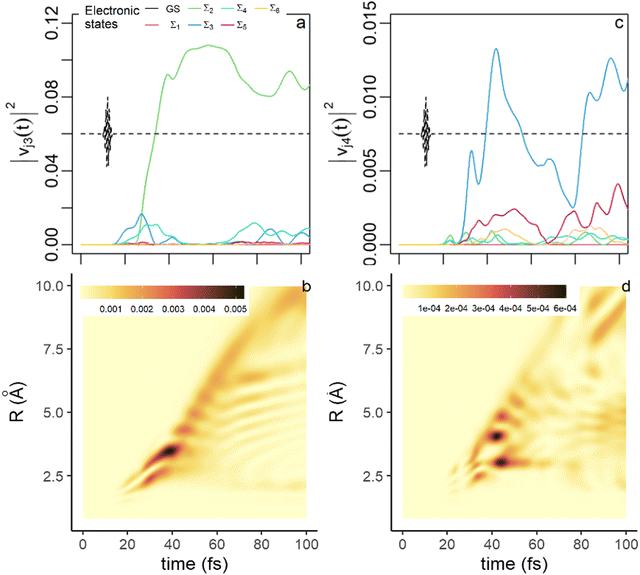 | ||
| Fig. 5 Physical meaning of the third and the fourth singular states. (a) The weights, |vj3(t)|2, eqn (11), of the electronic singular eigenvector, v3, of the decomposition eqn (4) on the electronic states (same color code as in Fig. 4). (b) Heatmap of the weights, |ui3(t)|2, eqn (11), of the nuclear singular eigenvector, u3, on the grid points. (c) time evolution of the weights, |vj4(t)|2, of the fourth electronic singular eigenvector. (d) Heatmap of the localization of the weights, |ui4(t)|2, of the fourth nuclear singular eigenvector on the grid. The weights are multiplied by σn2, n = 3 or 4. | ||
The increase of the number of singular values in the decomposition thus reflects the motion of the wave packets on the populated electronic states and more specifically its exit from the FC region. The motion of several wave packets on the grid leads to a change in the entanglement of the system. The switch of the electronic weights of Σ2 and Σ3 that occurs at ≈25 fs in the third SVD component results from the interplay between the changes in the gradients of the PES (Fig. 1a) that drive the motion of the wave packets at different rates along the R coordinate and the localization of the Σ2 − Σ3 NAC on the grid (Fig. S1, ESI†).
We therefore compared the time evolution of the squares of the singular values, σn, for the dynamics with NAC with the time evolution for the dynamic without NAC shown in Fig. 1c. They are shown in Fig. 6. This provides understanding on the origin of the rise of the third and fourth singular values.
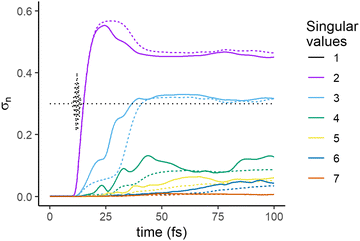 | ||
| Fig. 6 Time evolution of the singular values, σn, n = 2 to 7. Full line: computed for the dynamics with NAC (also shown in Fig. 2), dashed line: computed for the dynamics without NAC. The first singular value, σ1 is not shown as there is essentially no difference in its value for the two computations. | ||
Interestingly, as can be seen in Fig. 6, the rise of σ3 is also observed in the case of dynamics without NAC, but the onset of this increase occurs leads to a plateau at a small value, followed by a significant rise to a second plateau in the range 30–40 fs. The first plateau is not present in the dynamics with NAC for which σ3 rises faster. This suggests that the NAC contributes significantly to the entanglement of the state of the molecule between 15 and 25 fs, after which the effect of the difference in the gradient of the PEC plays a significant role, as can be inferred from Fig. 1a and Fig. S1 (ESI†). In the dynamics without NAC, the onset of σ3 is due to the gradient difference between the potential curves of the Σ4 and the Σ2 PEC in the range of R values between 2 and 5 Å, see Fig. 1a. Σ2 has a double well and the second rise occurs at ≈40 fs when a fraction of the wave packet on Σ2 reaches the second well region. Note that because their change is solely driven by the differences between the gradient on the PEC, the singular values computed for the dynamics without NAC vary more monotonically.
The discussion above suggests that up to 100 fs, the first three terms (Nmin = 3 in eqn (4)) in the singular decomposition, with a smaller role of the fourth one, should provide a good approximation of the populations in electronic states and of the electronic coherences, which are elements of the partial electronic density, ![[small rho, Greek, macron]](https://www.rsc.org/images/entities/i_char_e0d1.gif) el(t) (eqn (6)). As shown in eqn (9), the elements of only depends on the electronic singular vectors vn. As can be seen from Fig. 7a, the electronic population in Σ4 is essentially recovered with only the first two singular terms, since v2 is localized on Σ4 (see Fig. 4c) when the wave packet is outside of the FC region, while for the population in Σ2 (Fig. 7b), the third component is needed because v3 localizes on Σ2 (Fig. 5a). Accordingly, electronic coherence Σ2 − Σ4 (Fig. 8c) is recovered with three terms as well. We show in the ESI,† Fig. S4, the plots for the populations in Σ3 (Fig. S4a, ESI†) as well as the corresponding electronic coherences, Σ3 − Σ4 and Σ3 − Σ2, Fig. S4b and c (ESI†) respectively. To recover the exact results for electronic populations and coherences that involve Σ3, one needs to include the fourth component, as expected from Fig. 5c. Only the coherence Σ3 − Σ4 is well approximated with Nmin = 3.
el(t) (eqn (6)). As shown in eqn (9), the elements of only depends on the electronic singular vectors vn. As can be seen from Fig. 7a, the electronic population in Σ4 is essentially recovered with only the first two singular terms, since v2 is localized on Σ4 (see Fig. 4c) when the wave packet is outside of the FC region, while for the population in Σ2 (Fig. 7b), the third component is needed because v3 localizes on Σ2 (Fig. 5a). Accordingly, electronic coherence Σ2 − Σ4 (Fig. 8c) is recovered with three terms as well. We show in the ESI,† Fig. S4, the plots for the populations in Σ3 (Fig. S4a, ESI†) as well as the corresponding electronic coherences, Σ3 − Σ4 and Σ3 − Σ2, Fig. S4b and c (ESI†) respectively. To recover the exact results for electronic populations and coherences that involve Σ3, one needs to include the fourth component, as expected from Fig. 5c. Only the coherence Σ3 − Σ4 is well approximated with Nmin = 3.
 | ||
| Fig. 8 Approximation of the time evolution of the dipole moment (a), autocorrelation function (b) and nuclear momentum (c) with an increasing number, Nmin, of singular values. The exact time evolution is given in full black lines. The legend is shown in the inset of panel b and is the same in as Fig. 7. | ||
We next discuss the approximation of three observables that depend on the full density matrix,  , and cannot be cast into a trace on a partial density matrix,
 ![[small rho, Greek, macron]](https://www.rsc.org/images/entities/i_char_e0d1.gif) el or
el or ![[small rho, Greek, macron]](https://www.rsc.org/images/entities/i_char_e0d1.gif) n: the dipole moment, μ(t), the autocorrelation function, |C(t)|2 and the nuclear momentum, p(t) given respectively by
n: the dipole moment, μ(t), the autocorrelation function, |C(t)|2 and the nuclear momentum, p(t) given respectively by
 | (15) |
 | (16) |
 | (17) |
![[small rho, Greek, macron]](https://www.rsc.org/images/entities/i_char_e0d1.gif) n, but it also possesses a contribution from the electronic motion and NAC. It is not an observable on a partial trace, but the contribution from the NAC term is small. The nuclear momentum might therefore be well approximated as an observable dependent on the nuclear density matrix only, neglecting the second term in the sum of eqn (17).
n, but it also possesses a contribution from the electronic motion and NAC. It is not an observable on a partial trace, but the contribution from the NAC term is small. The nuclear momentum might therefore be well approximated as an observable dependent on the nuclear density matrix only, neglecting the second term in the sum of eqn (17).
Fig. 8 shows that the three observables are well approximated by three singular values, (Nmin = 3 in eqn (4)) with an even better description using four at longer times (not shown). The dipole moment (Fig. 8a) depends on all the four populated electronic states, Σ1, Σ2, Σ3 and Σ4 and the electronic coherences between them. Since the autocorrelation function (Fig. 8b) measures the overlap between the initial wave packet and the wave packet at a given time, the only significant contribution to this overlap is the contribution of the ground state in the FC region. As the part of the wave packet localized in the FC region requires only two singular values to be described, the autocorrelation function is fully described by the two largest singular values, and even by one singular value except shortly after the exciting pulse. The nuclear momentum (Fig. 8c) essentially depends on the nuclear component of the singular terms, the un vectors. Two singular components are needed at short time, before 25fs, when the wave packets on the different electronic states are still in or in the vicinity of the FC regions. Three components are needed at longer times, to described the specific nuclear dynamics on each electronic state.
4. Conclusions
We described a matrix representation which is suitable for the description of the wave function of entangled systems. The decomposition of the matrix by its singular values and vectors is equivalent to the Schmidt decomposition of the system and provides us with a measure of the entanglement. The physical meaning of the singular vectors was discussed, as well as their direct connection with partial density matrices. We also described how an approximation of the partial density matrices and of the observables depending on the full density matrix can be computed from the SVD. The theoretical framework was then applied to the study of the photoexcitation of the LiH molecule, in which we illustrated the physical meaning of singular vectors in the molecular system and showed that only a few singular values were required in order to approximate well the dynamics. Furthermore, the origin of changes in time in the entanglement of the molecule is shown to be due to the motion of wave packets of different electronic states on the grid. Two effects were observed as the causes of this motion: the leading effect was the interaction with the exciting optical pulse, but an additional nuclear motion was caused by the NACs. Finally, we showed numerically that partial density matrices elements and related observables could be well approximated using few terms of the singular decomposition.Conflicts of interest
There are no conflicts to declare.Acknowledgements
This work was supported by the Fonds National de la Recherche Scientifique (Belgium), F. R. S.-FNRS research grants # T.0205.20. Computational resources have been provided by the Consortium des Equipements de Calcul Intensif (CECI), funded by the F. R. S.-FNRS under Grant # 2.5020.11. Support of the COST action Attochem(CA18222) is also acknowledged. Martin Blavier is supported by an Erasmus+ grant between ULiège and HUJI.References
- U. Graf, M. Fieß, M. Schultze, R. Kienberger, F. Krausz and E. Goulielmakis, Opt. Express, 2008, 16, 18956–18963 CrossRef CAS PubMed.
- M. Galli, V. Wanie, D. P. Lopes, E. P. Månsson, A. Trabattoni, L. Colaizzi, K. Saraswathula, A. Cartella, F. Frassetto, L. Poletto, F. Légaré, S. Stagira, M. Nisoli, R. Martínez Vázquez, R. Osellame and F. Calegari, Opt. Lett., 2019, 44, 1308–1311 CrossRef CAS PubMed.
- L. Bruder, L. Wittenbecher, P. V. Kolesnichenko and D. Zigmantas, Opt. Express, 2021, 29, 25593–25604 CrossRef CAS PubMed.
- B. A. Horn, J. L. Herek and A. H. Zewail, J. Am. Chem. Soc., 1996, 118, 8755–8756 CrossRef CAS.
- T. Latka, V. Shirvanyan, M. Ossiander, O. Razskazovskaya, A. Guggenmos, M. Jobst, M. Fieß, S. Holzner, A. Sommer, M. Schultze, C. Jakubeit, J. Riemensberger, B. Bernhardt, W. Helml, F. Gatti, B. Lasorne, D. Lauvergnat, P. Decleva, G. J. Halász, Á. Vibók and R. Kienberger, Phys. Rev. A, 2019, 99, 063405 CrossRef CAS.
- A. Picchiotti, A. Nenov, A. Giussani, V. I. Prokhorenko, R. J. D. Miller, S. Mukamel and M. Garavelli, J. Phys. Chem. Lett., 2019, 10, 3481–3487 CrossRef CAS PubMed.
- R. Borrego-Varillas, A. Nenov, L. Ganzer, A. Oriana, C. Manzoni, A. Tolomelli, I. Rivalta, S. Mukamel, M. Garavelli and G. Cerullo, Chem. Sci., 2019, 10, 9907–9921 RSC.
- T. Kobayashi and Y. Kida, Phys. Chem. Chem. Phys., 2012, 14, 6200–6210 RSC.
- B. A. West, B. P. Molesky, P. G. Giokas and A. M. Moran, Chem. Phys., 2013, 423, 92–104 CrossRef CAS.
- E. Baldini, T. Palmieri, E. Pomarico, G. Auböck and M. Chergui, ACS Photonics, 2018, 5, 1241–1249 CrossRef CAS.
- S. A. Jayantha, K. G. Komarova, S. V. d Wildenberg, F. Remacle and R. D. Levine, in Attosecond Molecular Dynamics, ed. M. J. J. Vrakking and F. Lepine, Royal Society of Chemistry, Cambridge, 2018, vol. 13, pp. 308–347 Search PubMed.
- A. Valentini, S. van den Wildenberg and F. Remacle, Phys. Chem. Chem. Phys., 2020, 22, 22302–22313 RSC.
- A. Ekert and P. L. Knight, Am. J. Phys., 1995, 63, 415–423 CrossRef.
- M. A. Nielsen and I. L. Chu, Quantum Computation and Quantum Information, Cambridge University Press, Cambridge, 2010 Search PubMed.
- R. Horodecki, P. Horodecki, M. Horodecki and K. Horodecki, Rev. Mod. Phys., 2009, 81, 865–942 CrossRef CAS.
- A. Aspect, J. Dalibard and G. Roger, Phys. Rev. Lett., 1982, 49, 1804–1807 CrossRef.
- A. Aspect, P. Grangier and G. Roger, Phys. Rev. Lett., 1982, 49, 91–94 CrossRef.
- X.-W. Hou, J.-H. Chen and Z.-Q. Ma, Phys. Rev. A, 2006, 74, 062513 CrossRef.
- J. Li and S. Kais, Sci. Adv., 2019, 5, eaax5283 CrossRef CAS PubMed.
- J. Li, M. Sajjan, S. S. Kale and S. Kais, Adv. Quantum Technol., 2021, 2100098 CrossRef CAS.
- J. L. Sanz-Vicario, J. F. Pérez-Torres and G. Moreno-Polo, Phys. Rev. A, 2017, 96, 022503 CrossRef.
- L. K. McKemmish, R. H. McKenzie, N. S. Hush and J. R. Reimers, J. Chem. Phys., 2011, 135, 244110 CrossRef PubMed.
- D. J. Haxton, K. V. Lawler and C. W. McCurdy, Phys. Rev. A, 2011, 83, 063416 CrossRef.
- D. J. Haxton, K. V. Lawler and C. W. McCurdy, Phys. Rev. A, 2015, 91, 062502 CrossRef.
- M. Vatasescu, Phys. Rev. A, 2013, 88, 063415 CrossRef.
- A. F. Izmaylov and I. Franco, J. Chem. Theory Comput., 2017, 13, 20–28 CrossRef CAS PubMed.
- M. Nisoli, P. Decleva, F. Calegari, A. Palacios and F. Martín, Chem. Rev., 2017, 117, 10760–10825 CrossRef CAS PubMed.
- Attosecond molecular dynamics, ed. M. J. J. Vrakking and F. Lepine, The Royal Society of Chemistry, Cambridge, 2019 Search PubMed.
- I. C. D. Merritt, D. Jacquemin and M. Vacher, J. Phys. Chem. Lett., 2021, 12, 8404–8415 CrossRef CAS PubMed.
- M. J. J. Vrakking, Phys. Rev. Lett., 2021, 126, 113203 CrossRef CAS PubMed.
- T.-D. Bradley, E. M. Stoudenmire and J. Terilla, Mach. Learn.: Sci. Technol., 2020, 1, 035008 Search PubMed.
- wikipedia, wikimedia foundation, https://en.wikipedia.org/wiki/Vectorization_(mathematics), 2021.
- G. H. Golub and C. Reinsch, in Linear Algebra, ed. J. H. Wilkinson, C. Reinsch and F. L. Bauer, Springer Berlin Heidelberg, Berlin, Heidelberg, 1971, pp. 134–151 Search PubMed.
- S. van den Wildenberg, B. Mignolet, R. D. Levine and F. Remacle, J. Chem. Phys., 2019, 151, 134310 CrossRef PubMed.
- M. Lein, Phys. Rev. Lett., 2005, 94, 053004 CrossRef PubMed.
Footnote |
| † Electronic supplementary information (ESI) available: Supplemental figures S1, S2, S3, S4 and S5. See DOI: https://doi.org/10.1039/d2cp01440h |
| This journal is © the Owner Societies 2022 |

