
 Open Access Article
 This Open Access Article is licensed under a Creative Commons Attribution-Non Commercial 3.0 Unported Licence
Recipes for superior ionic conductivities in thin-film ceria-based electrolytes
Dennis
Kemp
 *a,
Albert
Tarancón
bc and
Roger A.
De Souza
a
*a,
Albert
Tarancón
bc and
Roger A.
De Souza
a
aInstitute of Physical Chemistry, Landoltweg 2, RWTH Aachen University, 52056 Aachen, Germany. E-mail: kemp@pc.rwth-aachen.de; desouza@pc.rwth-aachen.de; Tel: +49 241 80 98617
bCatalonia Institute for Energy Research (IREC), Jardins de Les Dones de Negre 1, 08930 Sant Adrià del Besòs, Barcelona, Spain
cICREA, 23 Passeig Lluís Companys, Barcelona 08010, Spain
First published on 20th May 2022
Abstract
We employed Molecular Dynamics (MD) and Metropolis Monte Carlo (MMC) simulations to determine the oxide-ion mobility uO in Ce1−yGdyO2−y/2 (y = 0.02, 0.1, 0.2) for the range of temperatures 1400 ≤ T/K ≤ 2000 and field strengths 0.6 ≤ E/MV cm−1 ≤ 15.0. Direct, unambiguous determination of uO(E) from MD simulations is shown to require examination of the ions' mean displacement as a function of time. MD simulations were performed for random distributions of Gd cations and equilibrium distributions obtained by MMC calculations. All uO(E,T,y) data obtained can be described by an (empirically augmented) analytical model with four zero-field parameters, a result that allows data to be extrapolated down to the temperatures of electrolyte operation. Specifically, the oxide-ion conductivity is predicted, for example at T = 700 K, (i) to be up to 101 higher for a random distribution of Gd than for an equilibrium distribution; and (ii) to be a factor of 100.8 higher for a 6 nm thin film than for a μm-thick sample under a potential difference of 1 V. By virtue of non-equilibrium deposition and nm-thick samples, thin films thus provide two new recipes for attaining even higher oxide-ion conductivities in ceria-based electrolytes.
1 Introduction
In the race from promising oxide-ion conductor to high-performance, long-lifetime, commercially viable fuel-cell electrolyte, ceria-based materials have already passed various hurdles. The thermodynamic stability under fuel cell conditions has been demonstrated, in particular for intermediate-temperature fuel cells.1–6 The optimal phase composition has been identified in terms of the amount and type of substituent oxide, namely 10–20% of Gd2O3 or Sm2O3;4,7–11 and the possibility of higher conductivity through co-substitution has been extensively studied with mixed results.12–14 In addition, the need to avoid silicate phases at grain boundaries has been recognised15–17 and mitigation strategies have been developed.9,18–22Of the remaining hurdles, one of the most important is lowering the operation temperature in order to extend the device's lifetime. Many degradation phenomena, such as interdiffusion,23,24 creep,25,26 kinetic demixing,27,28 and aging,29–32 are governed by cation diffusion, a process characterised by a high activation enthalpy, (5 to 6) eV.33,34 Hence, lowering the operation temperature by only 100 K leads to decreases in cation diffusion rates of six orders of magnitude, with corresponding increases in device lifetimes. Of course, oxide-ion conductivity is diminished at lower temperatures, but this can be offset by reducing the thickness of the electrolyte.35,36
In this study, we examined possibilities to overcome the low-temperature hurdle through the use of thin films, and to this end, we combined various simulation methods and theory. In principle, thin films provide two possibilities for increasing the oxide-ion conductivity. If a film is fabricated with a random distribution of substituent cations (by means of a physical deposition method), rather than the equilibrium distribution achieved at high temperatures of sintering, the oxide-ion conductivity should not be diminished by the formation of defect clusters or nano-domains containing multiple point defects.37,38 In addition, if the film is thin enough, relatively small applied voltages result in extraordinarily high electric field strengths, and thus in the possibility of field-enhanced ion transport.39–41 Field strengths of MV cm−1 can increase the ionic conductivity of a dilute solution of non-interacting charge carriers by orders of magnitude. The increases at such high fields for electrolyte compositions (i.e. well beyond the dilute limit) with either random or equilibrium Gd distributions are, however, unclear.
To examine the two possibilities of overcoming the low-temperature hurdle we performed classical molecular dynamics (MD) simulations and Metropolis Monte Carlo (MMC) simulations for three different concentrations (y = 0.02,0.1,0.2) of Ce1−yGdyO2−y/2 with random and equilibrium distributions of the substituent Gd cations. For each of the six systems we obtained the oxide-ion mobility uO as a function of field strength E and temperature T. The subsequent aim of our study was to obtain an analytical expression that describes all uO(E,T,y) data in terms of only zero-field parameters. With such an expression, the oxide-ion conductivity can be predicted, for conditions other than those examined in the simulations, with knowledge of only the bulk conductivity in the low-field limit and its activation enthalpy.
2 Theory
2.1 Obtaining field-dependent ion mobilities from MD simulations
The electrochemical mobility of a charge carrier i is defined as the ratio of the charge carrier's drift velocity (vd,i) to the electric field strength (E) producing drift,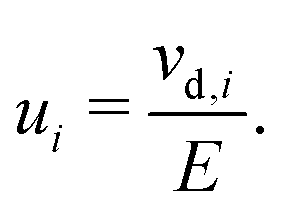 | (1) |
The traditional approach for obtaining ui from an MD simulation is indirect. In an isothermal MD simulation, the ions' mean-squared-displacement 〈ri2〉 is monitored as a function of time (t), and if the increase is smooth and linear, Einstein's relation,
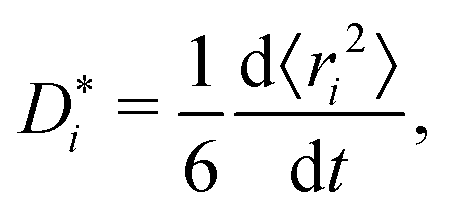 | (2) |
 . Subsequently, the Nernst–Einstein equation (with ion charge zie; Haven ratio Hr; and Boltzmann constant kB)
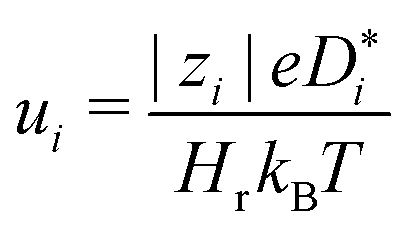 | (3) |
In the present case, this traditional approach is not applicable for two reasons. For simulations in which an applied electric field produces ion drift, the analysis of d〈ri2〉/dt does not yield  . Below we explain what the problem is, and we describe a simple and direct solution. The second reason is that, since concentrated solid solutions are considered (Ce1−yGdyO2−y/2 with y > 0.01) and high-field effects, too, Hr in eqn (3) will deviate from the (constant) dilute–solution value. That is, Hr (E, T, y) would be required.
We come now to the issue of why the analysis of d〈ri2〉/dt does not yield  . For a system of ions undergoing diffusion and drift, the evolution of the ions' probability density function can be written in one dimension (x) as44
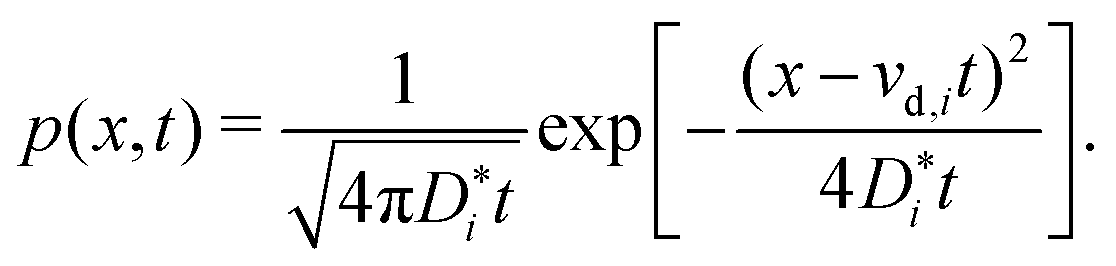 | (4) |
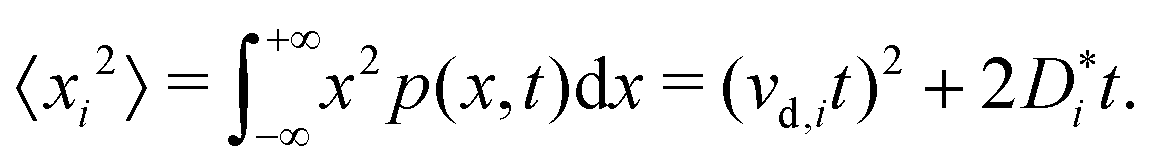 | (5) |
Eqn (5) suggests that one solution to this problem would be to consider the second time derivative of 〈xi2〉 to obtain the drift velocity. We propose that a far simpler and more robust approach is to examine the ions' mean displacement, that is, the first moment of p(x,t),
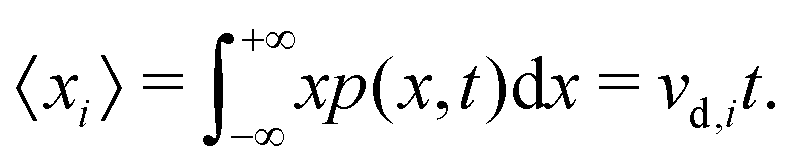 | (6) |
This is the approach we have used previously.45,46 Here we present the underlying foundation because of some misconceptions in the literature. For example, in some studies,47,48 MD simulations with an applied field (vd,i ≠ 0) were analysed with eqn (2) rather than eqn (6). This is clearly incorrect. The “diffusion coefficients” reported in such studies are no such things; consequently, the analysis of such data is unreliable, and the conclusions reached are questionable.
2.2 An analytical expression for the field-dependent ionic conductivity
The second aim of our study, as noted above, is to obtain an expression that allows the oxide-ion conductivity to be predicted for a concentrated solid solution in terms of only zero-field parameters. That is, if one had measured the bulk oxide-ion conductivity of a ceria-based material as a function of temperature, one could predict—with this knowledge and with the analytical expression—the conductivity for the high-field regime without any additional information.The ionic conductivity is the product of the ion's mobility ui, its charge |zi|e and its concentration ci,
| σ = uici|zi|e. | (7) |
The approach's underlying assumption is that the ions migrate over cosinusoidal free energy profiles, upon which the electric field is linearly superimposed.45 The activation enthalpies of ion migration with and against the field, i.e. in the forward and reverse directions, follows as45
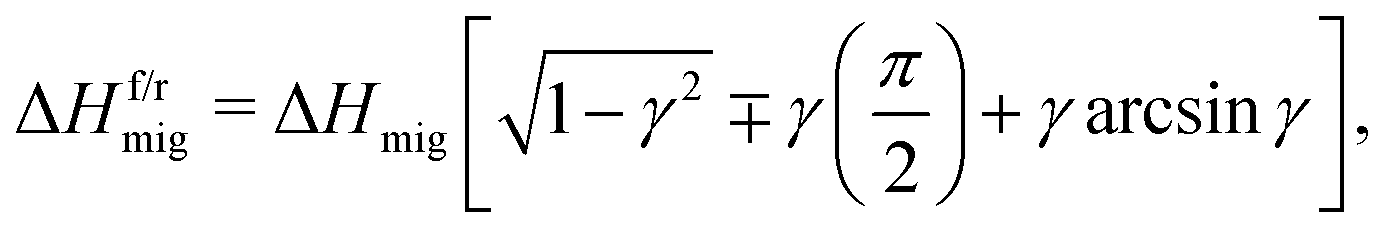 | (8) |
 | (9) |
This approach has been demonstrated45,46 to provide a quantitative description of ui up to relatively high field strengths. It thus indicates that the assumption of a linear field superimposed on the free energy landscape is reasonable, at least up to these fields of MV cm−1. Deviations are expected for exceptionally high E, when the potential wells in which the ions sit are deformed substantially by the field, leading to field-dependent values of ν0 and ΔSmig. In addition, deviations are expected at exceptionally high E, as the electrons' distributions around the ions are significantly modified. These fields are beyond those examined in this study, however. It is noted that if accurate values of ΔHf/rmig for exceptionally high fields are required, then methods are available.50,51 Such routes were not taken in this study, since the fields are not so high as to require such approaches, and since the primary quantity of interest (and one that can be determined experimentally) is the ion mobility. Knowledge of how the many individual barriers in such concentrated solid solutions react to an applied field would be of limited use in obtaining a macroscopic ion mobility.
3 Methods
The molecular dynamics simulations were performed using the LAMMPS code52 with periodic boundary conditions in the NpT ensemble where particle number N, pressure p and temperature T are kept constant. To ensure this a Nosé–Hoover thermostat and barostat with damping parameters of 0.2 and 20 ps, respectively, were used.53,54 The long-range coulombic interactions were calculated with a particle–particle particle–mesh solver55 with an accuracy of 10−5, as implemented in LAMMPS. Newton's equations of motion were integrated by means of the velocity Verlet algorithm with a timestep of 1 fs. There are several sets of potentials available in the literature for CeO2 and Gd-substituted CeO2, ranging from simple Buckingham-type pair potentials to more complex many-body potentials.37,56–64 Our choice of the pair potential set was governed by three factors: reproducibility of experimental values that are important for the scope of this study, primarily the activation enthalpy of oxygen diffusion in pure CeO2 and Gd-substituted CeO2; robust potentials that allow MD simulations to be performed under high electric field strengths without simulation artefacts; and computationally efficient potentials that permit long, large-scale simulations with reasonable computation time. Based on studies that have already compared several sets of potentials for pure and Gd-substituted CeO265,66 and on our own test simulations, we decided, therefore, to use the pair potentials reported by Minervini et al.37. These potentials have already been used in several studies to study oxide-ion conductivity and diffusion65,67,68 as well as grain-boundary and surface segregation of dopants.69,70 Supercells containing 12![[thin space (1/6-em)]](https://www.rsc.org/images/entities/char_2009.gif) 000 ions (4000 f.u., Ce4000O8000) were used and 80, 400 or 800 Ce4+ ions were randomly substituted with Gd3+ ions to yield the intended composition of y = 0.02,0.1 or 0.2. The resulting charge inequality was balanced by randomly removing the appropriate number of O2− ions. The three cells originated from this procedure were the starting configurations for the random distribution of GDC2, GDC10 and GDC20.
000 ions (4000 f.u., Ce4000O8000) were used and 80, 400 or 800 Ce4+ ions were randomly substituted with Gd3+ ions to yield the intended composition of y = 0.02,0.1 or 0.2. The resulting charge inequality was balanced by randomly removing the appropriate number of O2− ions. The three cells originated from this procedure were the starting configurations for the random distribution of GDC2, GDC10 and GDC20.
To obtain equilibrium distributions of Gd cations, two ions from a particular sublattice were picked at random and swapped; the change was accepted or rejected according to the standard Metropolis Monte Carlo (MMC) algorithm.71 Swaps on both anion and cation sublattices were performed (alternating between the two) in order to capture the essential interactions between oxygen vacancies and acceptor-type Gd cations. Since oxygen vacancies are not real particles, they were treated as non-interacting particles without charge so that swaps with oxide ions were possible. This procedure was previously shown by Purton et al. to yield reasonable configurations for cation substituted supercells.72 In the MMC minimisation, 2 × 10⁶ swap attempts for anions and cations, respectively, were conducted, after which the total cell energy had decreased to a constant value. For all three concentrations the same temperature of T = 1800 K was used in the calculation of the acceptance rate allowing Gd cations and oxygen vacancies to reach thermodynamic equilibrium (rather than just oxygen vacancies as at lower temperature).
Oxide-ion mobilities uO were determined from MD simulations with applied electric field strengths in the range of 0.6 ≤ E/MV cm−1 ≤ 15.0 by applying an additional force F = zieE to each ion. Every simulation was first equilibrated for 75 ps followed by a production run of 3 ns for E ≤ 3.0 MV cm−1 or of 1 ns for E > 3.0 MV cm−1. To improve the statistics, we performed three runs with different random number seeds for each simulation at given E and T.
4 Results
4.1 Effect of energy minimisation on Gd distribution
From MD simulations at finite temperature, we calculated the partial radial distribution functions gGd–O(r) and gGd–Gd(r) for two distributions of Gd: the random distributions (with oxygen vacancies allowed to achieve minimum energy configurations); and the equilibrium distributions (obtained from MMC minimisation). The results are compared in Fig. 1 for the three different systems GDC2, GDC10 and GDC20.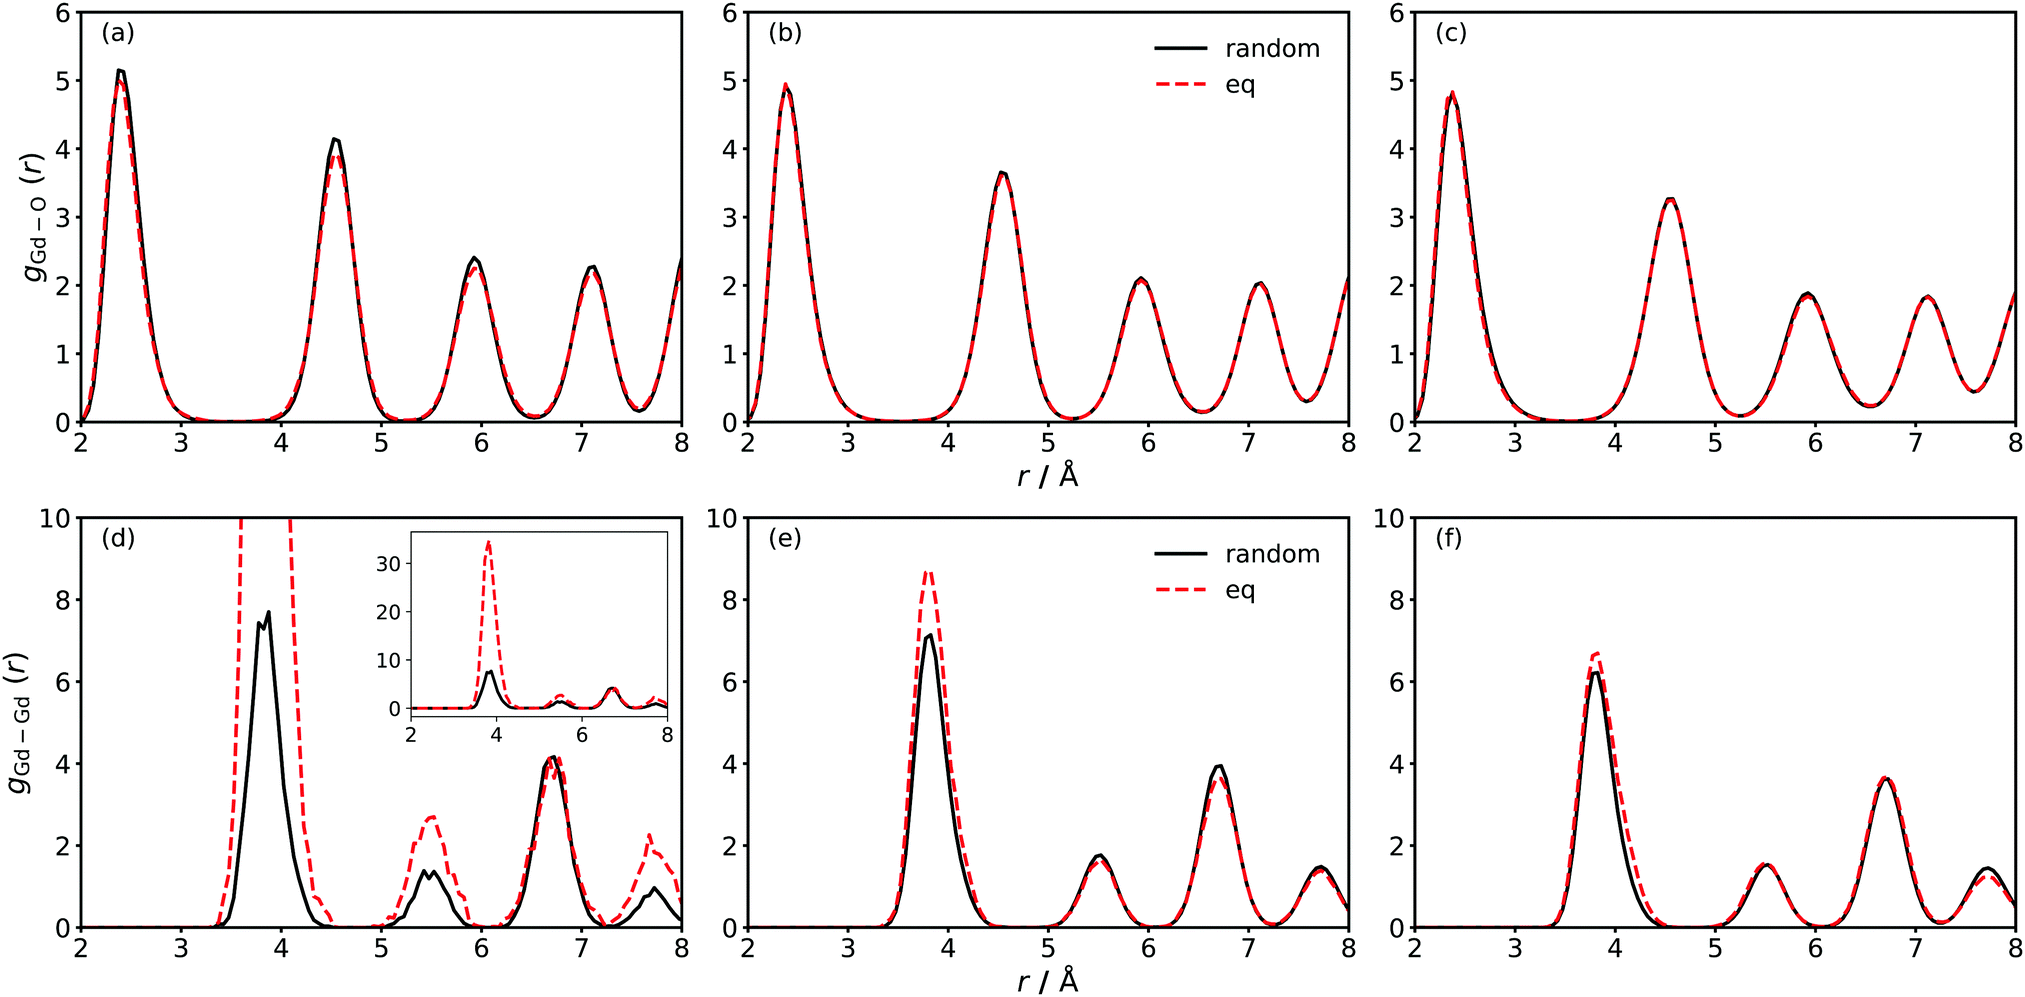 | ||
| Fig. 1 Radial distribution functions for Gd–O (a–c) and Gd–Gd (d–f) of GDC2 (a and d) GDC10 (b and e) and GDC20 (c and f). Black, solid lines refer to random distributions of Gd cations and red, dashed lines refer to equilibrium distributions from Metropolis Monte Carlo (MMC) calculations. The radial distribution functions are extracted exemplarily from simulations at T = 1400 K and 0.6 MV cm−1 and averaged over 3000 timesteps per random seed (which sums up to 9000 timesteps per distribution) to account for different vacancy distributions. The inset in (d) shows the complete height of the first Gd–Gd peak. | ||
At first sight, gGd–O(r) shows no differences between random and equilibrium distributions of Gd. A closer examination reveals indeed no differences for GDC10 and GDC20, but for GDC2 gGd–O(r) is slightly lower for the equilibrium distribution. This indicates an increased presence of oxygen vacancies in the vicinity of Gd cations.
Substantial differences in gGd–Gd(r) are evident for all three compositions [Fig. 1(d)–(f)], with these differences diminishing with increasing Gd concentration. For example, in GDC2 the maximum of the 1NN peak (at 4 Å) increases from ca. 8 for the random distribution to ca. 35 upon energy minimisation [Fig. 1(d)]. Thus the probability of finding two Gd cations next to each other increases by a factor of four. A smaller but still significant increase is also observable for the 2NN (5.5 Å) and 3NN (7.8 Å) peaks, meaning that the Gd cations tend to accumulate. Combined with the observations from gGd–O(r) [Fig. 1(a)] it is evident that for both oxygen vacancies and Gd cations the formation of clusters is energetically favourable. Such behaviour is in agreement with theoretical and experimental studies of concentrated GDC solutions.37,38,74–76 For GDC10 and GDC20, gGd–Gd(r) differs significantly between random and equilibrium distribution in the first peak only but the difference is small compared to GDC2.
These findings were obtained by averaging over the length of the simulation run but they are supported by snapshots of the simulation cells shown in Fig. 2. In the left column the random configurations (after the vacancies have achieved equilibrium) of the three concentrations and in the right column the equilibrium distributions (after the vacancies and Gd cations have achieved equilibrium) obtained from MMC simulations are shown. It is evident that in every case the equilibrium distribution has a smaller number of clusters than the corresponding random distribution. This is due to the clustering of oxygen vacancies and Gd cations with a trend to bigger clusters with increasing concentration of Gd. That is, there are more defects in the largest cluster, too.
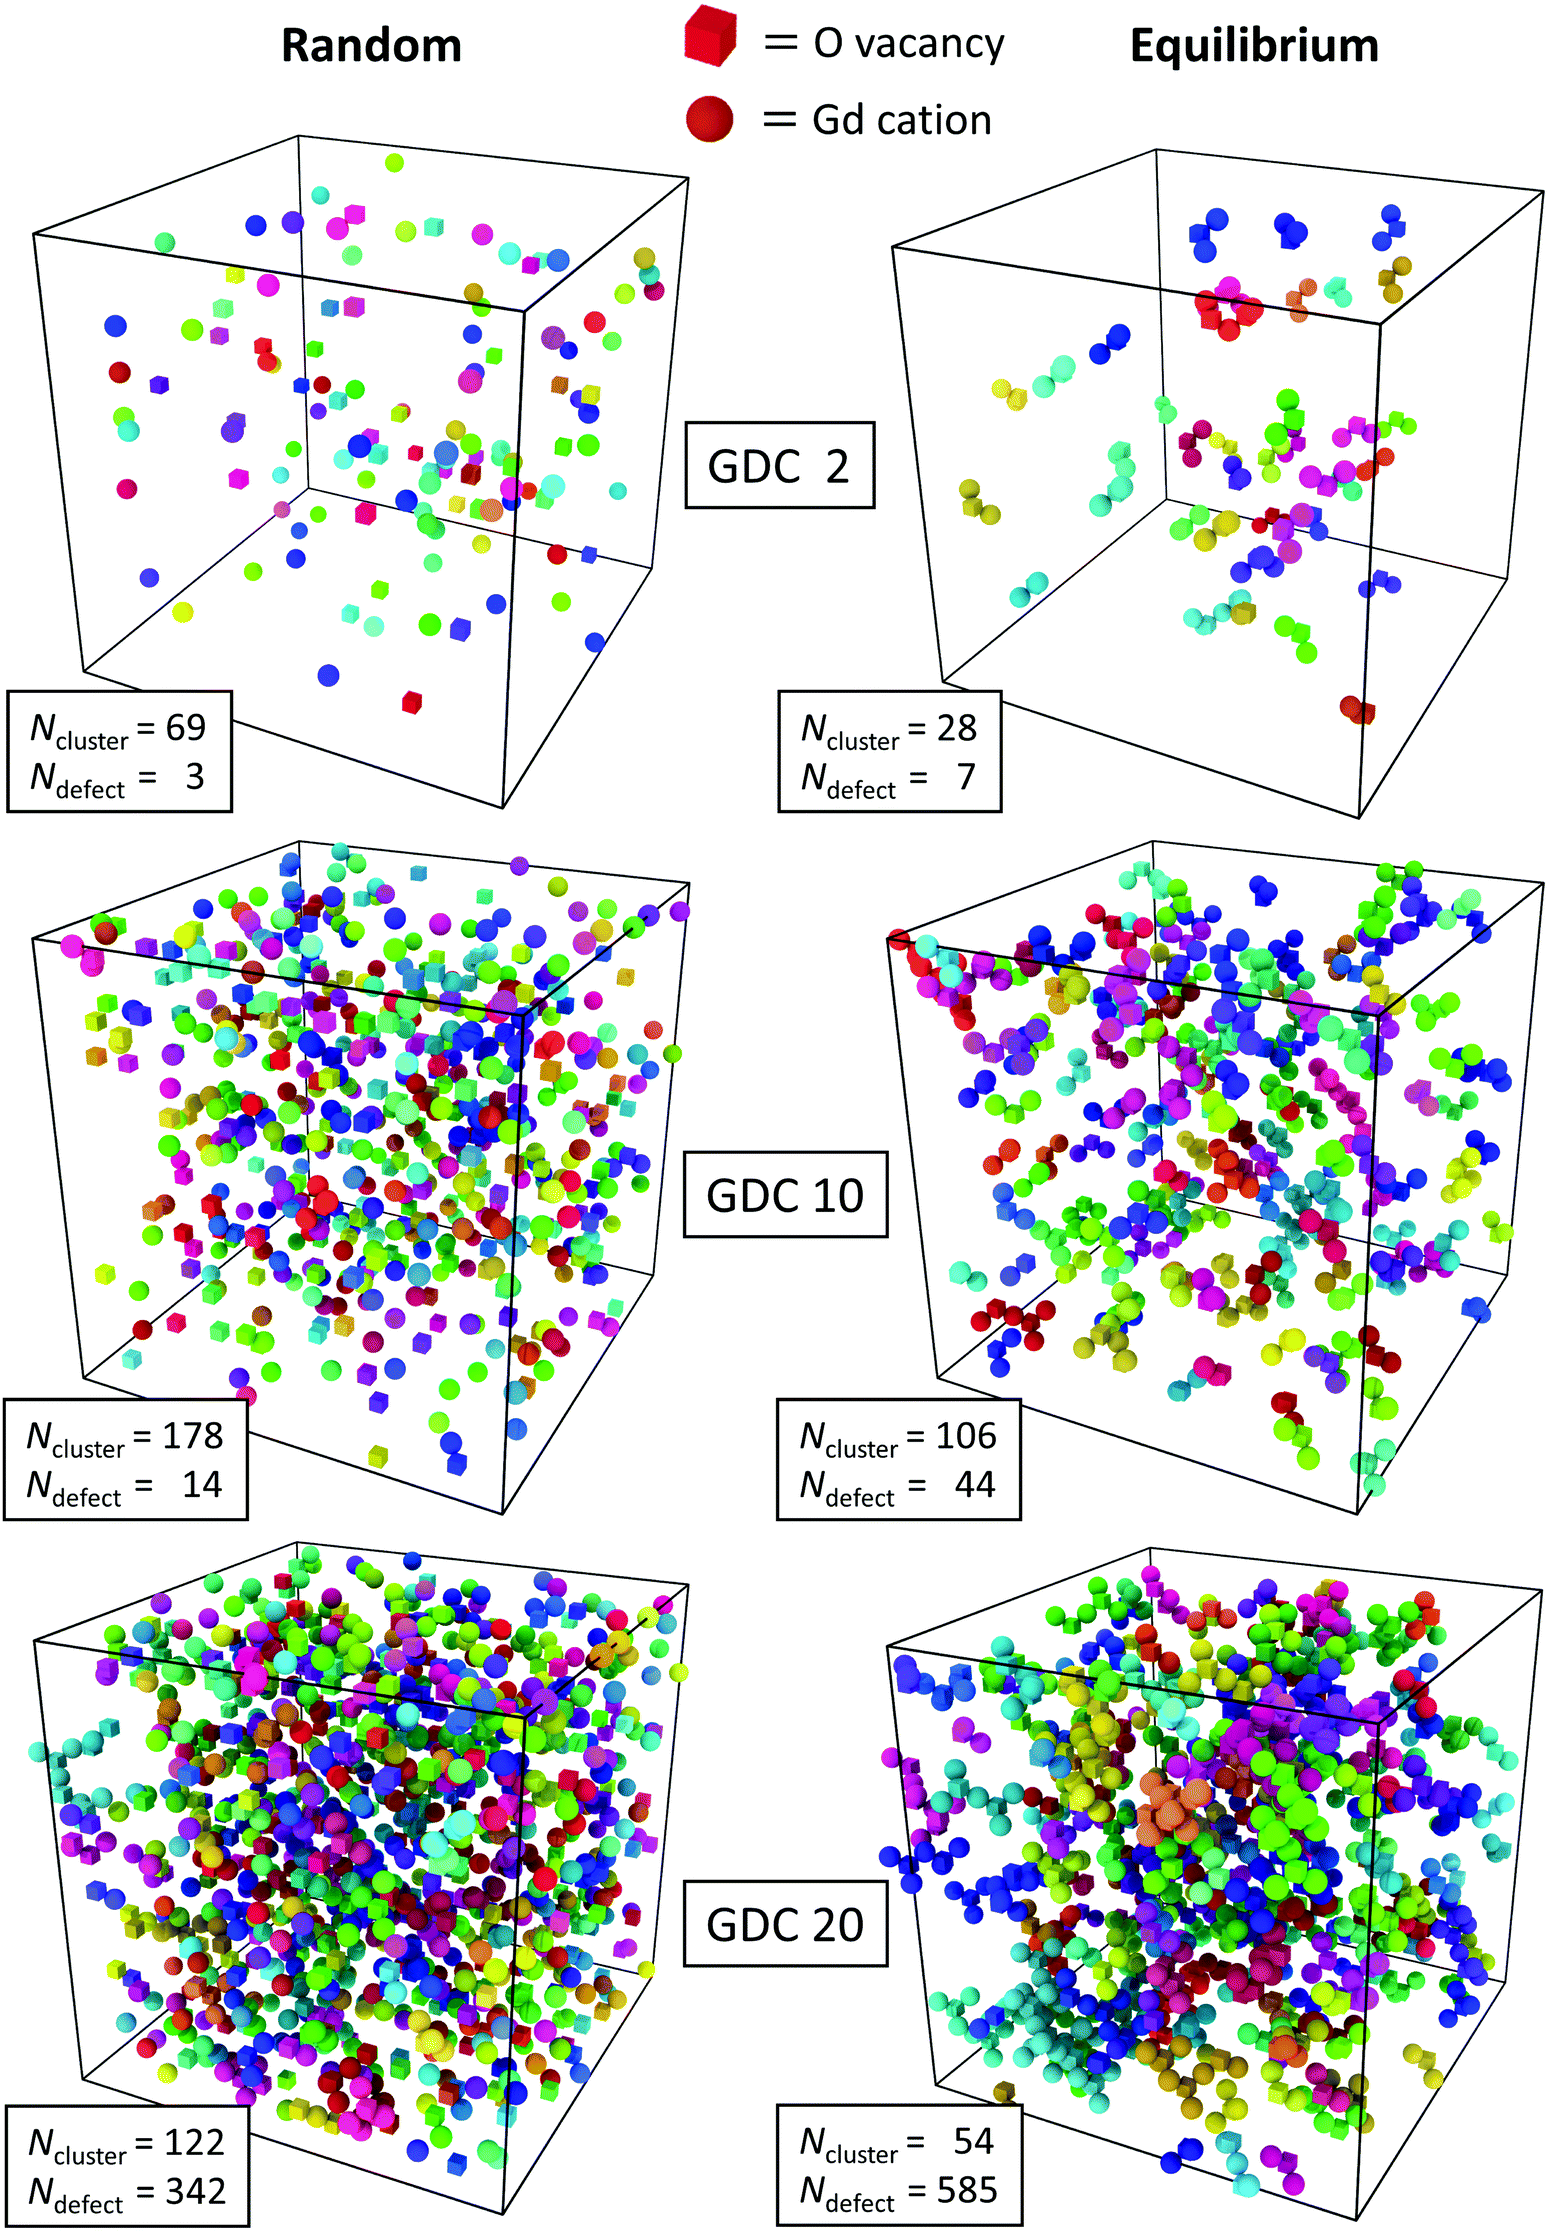 | ||
| Fig. 2 Defect cluster arrangements in GDC2, GDC10 and GDC20 with random and equilibrium distributions visualized with the “Cluster Analysis” tool provided by the software OVITO.73 Oxygen vacancies (cubes) and Gd cations (balls) with a distance of <3.5 Å belong to the same cluster and have the same colour. The number of different clusters per simulation cell, Ncluster, and the size (sum of oxygen vacancies and Gd cations) of the largest cluster, Ndefect, is given. | ||
4.2 Field-dependent oxide-ion mobilities
Oxide-ion mobilities uO obtained from the MD simulations as a function of field strength are shown in Fig. 3. The qualitative behaviour of uO conforms to expectations, that is, constant values in the low-field regime (up to ca. 2 MV cm−1 for the temperatures examined here), and a non-linear increase at higher field strengths. In contrast, the quantitative behaviour is quite different and does not follow the theoretical prediction (dotted lines). For example, the field strength required for an increase of uO(E)/uO(0) = 1.1 at T = 1400 K predicted by eqn (8) and (9) is Etheo = 3.9 MV cm−1 in the case of the random GDC2 system. But from the simulation results we perceive that Esim < 2 MV cm−1 is required, roughly half the expected field strength. Furthermore, for higher field strengths the deviation between theoretical prediction and simulation results becomes even larger, and it is not possible to describe the field-dependency at all regardless of the system's composition. For comparison, we note that uO in a system containing only oxygen-vacancies (and no Gd cations) can be described by eqn (8) and (9) up to E = 20 MV cm−1 at T = 1400 K.45 We attribute the deviations in Fig. 3, therefore, to the more complex energy landscape for ion-transport that the Gd substituents introduce (altered migration barriers and site energies77,78). As we will see in Section 5.2, a quantitative description of the field-dependent oxide-ion mobilities with a modified version of the existing model (Section 2.2) is possible.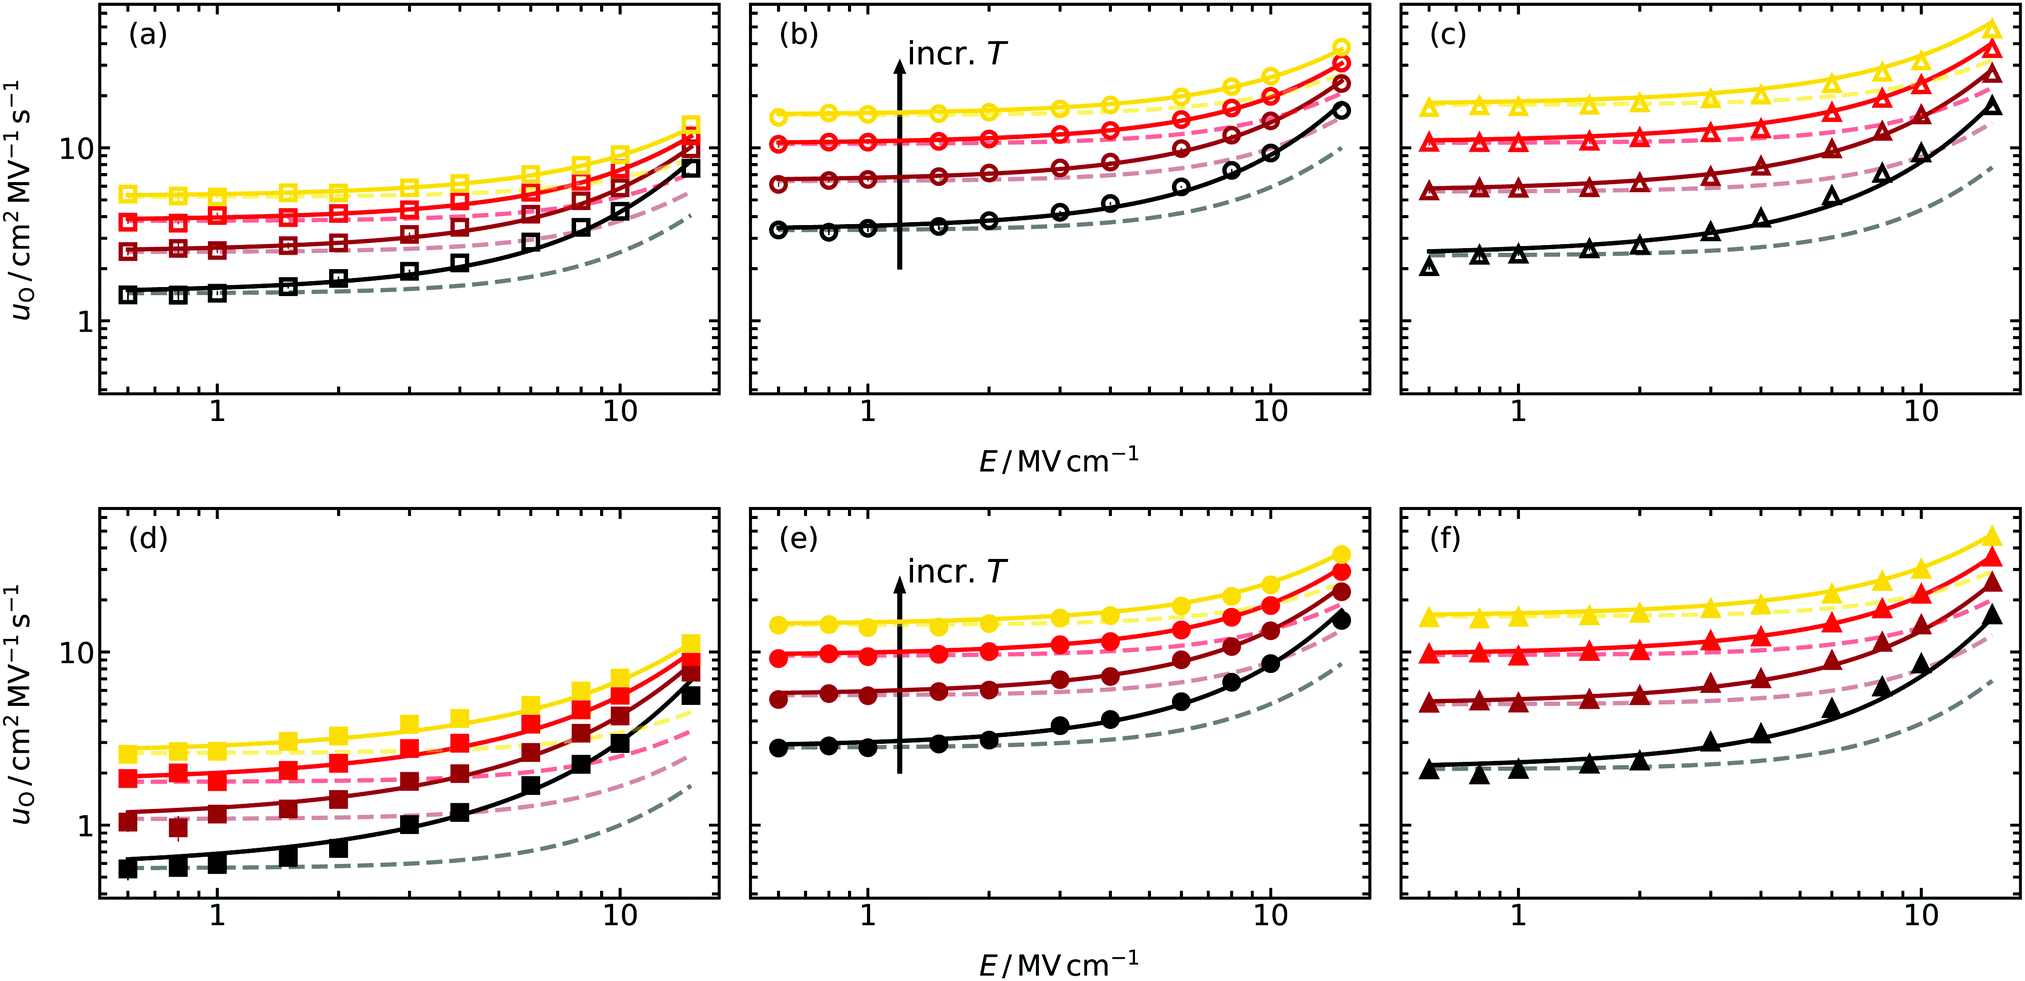 | ||
| Fig. 3 Field-dependent oxide-ion mobilities uO extracted from molecular dynamics simulations at four different temperatures (T/K = 1400, 1600, 1800, 2000) for (a and d) GDC2, (b and e) GDC10 and (c and f) GDC20. The Gd-dopant distribution in (a–c) was random, whereas in (d–f) the equilibrium distributions were employed. The solid lines are fits to the improved model [eqn (10)]; the faded, dashed lines refer to the predictions from the standard treatment45 (Section 2.2). | ||
From the oxide-ion mobilities in the low-field region (E ≤ 1.0 MV cm−1), we extracted uO(T,E → 0). The data are plotted in Fig. 4 as a function of inverse temperature, and they yield effective enthalpies of oxygen-vacancy migration, ΔHmig,v. Comparing the data for random and equilibrium distributions of Gd cations, we find in the more concentrated systems, GDC10 and GDC20, that the absolute values of uO(T,E → 0) and consequently of ΔHmig,v are very similar. For GDC2, though, there is at the lowest simulated temperature already one order of magnitude difference in uO(T,E → 0) and ΔHmig,v differs by 0.1 eV. This behaviour—decreasing differences between random and equilibrium distributions of Gd with increasing Gd concentration—is a direct consequence of the defect clustering evident in Fig. 1 and 2.
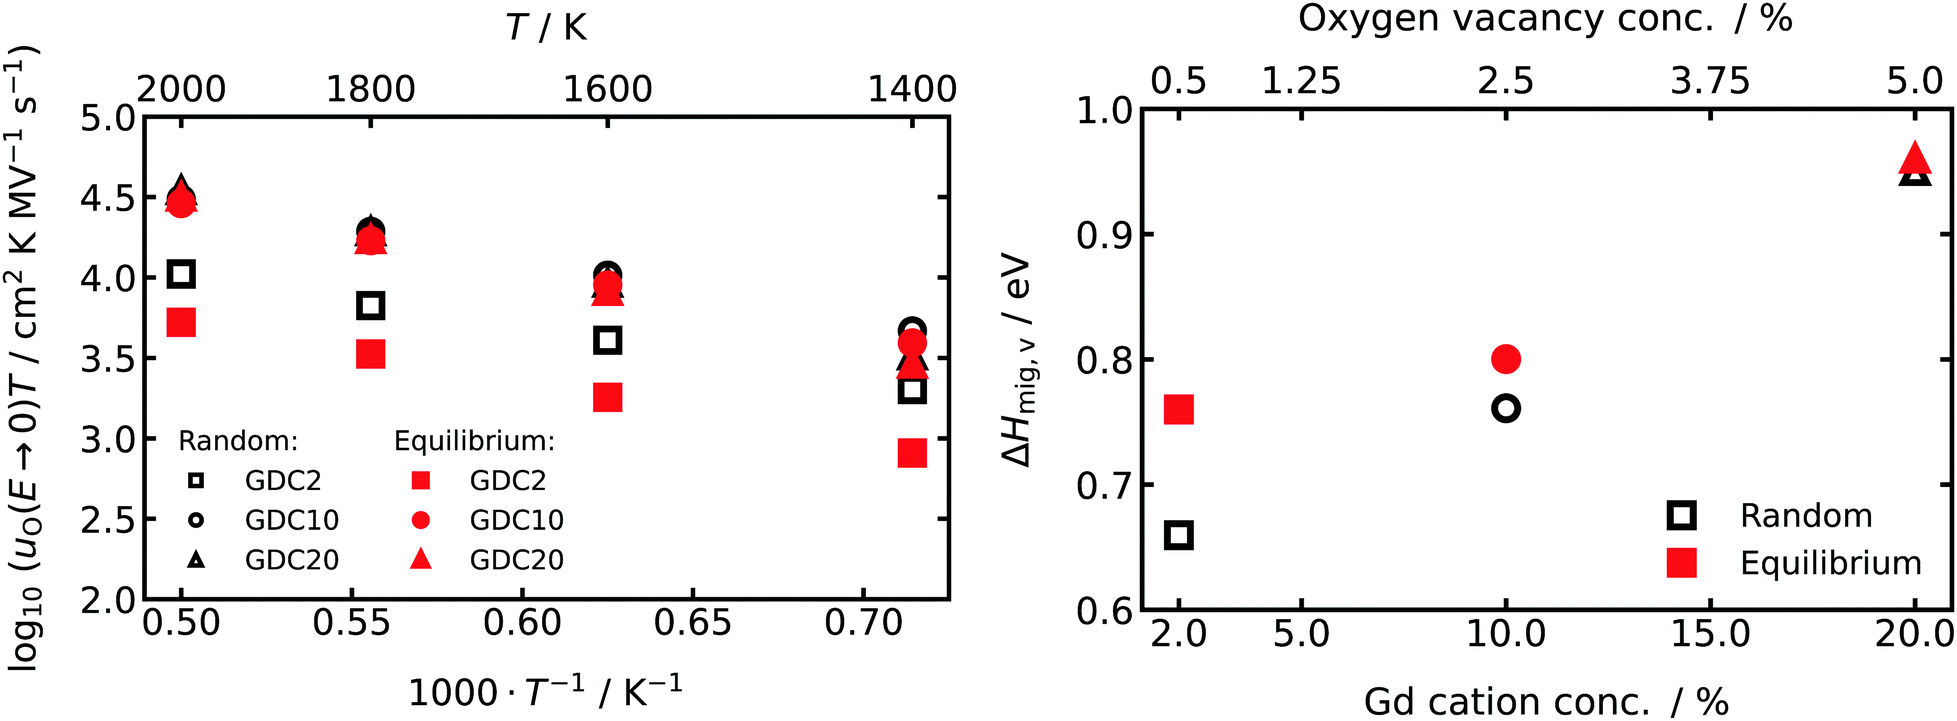 | ||
| Fig. 4 (left) Field-independent oxide-ion mobilities u(T, E → 0) extrapolated from the low-field range (E ≤ 1.0 MV cm−1) of the field-dependent simulations plotted versus inverse temperature 1/T. (right) Dependency of activation enthalpy of vacancy migration ΔHmig,v on the concentration of Gd cations and oxygen vacancies. | ||
5 Discussion
5.1 Influence of the cation distribution on the low-field ion mobility
For all compositions examined, the field-independent oxide-ion mobility uO(T,E → 0) (and hence the conductivity σ) was always lower in the equilibrium case than in the random case, as reported previously for acceptor-doped fluorites.67,72,79 The formation of larger defect clusters (Fig. 1 and 2) is accompanied by a higher binding energy37,74,80 and a higher probability of oxygen vacancies migrating over Gd–Ce or Gd–Gd barriers (these activation barriers being much higher than the Ce–Ce barrier).77,78 Consequently, with increasing Gd concentration but also with larger clusters at a constant concentration of Gd, ΔHmig,v is expected to increase and uO to decrease (Fig. 4).Comparison of ΔHmig,v with values from other experimental and theoretical work reveals two findings: first, the trend of increasing activation energy (for bulk conductivity) with increasing acceptor-ion concentration was also experimentally observed for Gd-doped10 and Sm-doped81 CeO2 over a similar range of acceptor concentrations. Second, the absolute values of ΔHmig,v are in all cases higher than experimentally found activation energies for bulk oxide-ion conduction derived from impedance spectroscopy. For example, in GDC10 and GDC20 for T > 623 K, experimental activation enthalpies are in the range of 0.62–0.70 eV9,10,16,82 and 0.74–0.82 eV,9,10,83 respectively. In comparison the values derived from our MD simulations are 0.76/0.80 eV and 0.95/0.96 eV for the random/equilibrium distributions of GDC10 and GDC20, respectively. Theoretical studies with the same EPP derive similar ΔHmig,v of 0.74 eV67 and 0.78 eV65 for GDC8 and GDC10, respectively. As was pointed out by Grieshammer et al., pair potentials tend to overestimate the repulsive and attractive interactions leading to an overestimation of the activation enthalpy.65 Thus, with increasing Gd concentration, defect–defect interactions become increasing prevalent, thus accounting for the deviation between experimental and computational values of ΔHmig,v of ca. 0.1/0.15 eV for GDC10/GDC20. Nevertheless, the trends of the experimental values are reproduced very well by the simulations and hence a qualitative discussion of the impact of Gd distribution and high electric field strengths (see Section 5.2) on the oxide-ion mobility is possible.
5.2 Quantitative description of field-dependent oxide-ion mobilities
As already described in Section 4.2 and shown in Fig. 3, uO(E,T) cannot be described with the standard analytical treatment (Section 2.2). At field strengths of E > 2 MV cm−1 the treatment underestimates the increase of uO in all systems at all temperatures. This discrepancy is not surprising, however, considering that the treatment45 was derived for ion migration in a simple system (low vacancy concentration, no dopant cations, and a single barrier over which ions jump). In principle, one could remedy the situation by including migration over different barrier heights (depending on the arrangement of Gd cations) and to and from sites with differing energies (depending on the arrangements of Gd cations and oxygen vacancies).77,78,84 It is difficult to imagine, though, that a useful analytical expression would be obtained, given the huge number of possible arrangements of the defects. A simpler approach to obtain an adequate description is to adapt the existing model of eqn (9) in an ad hoc fashion,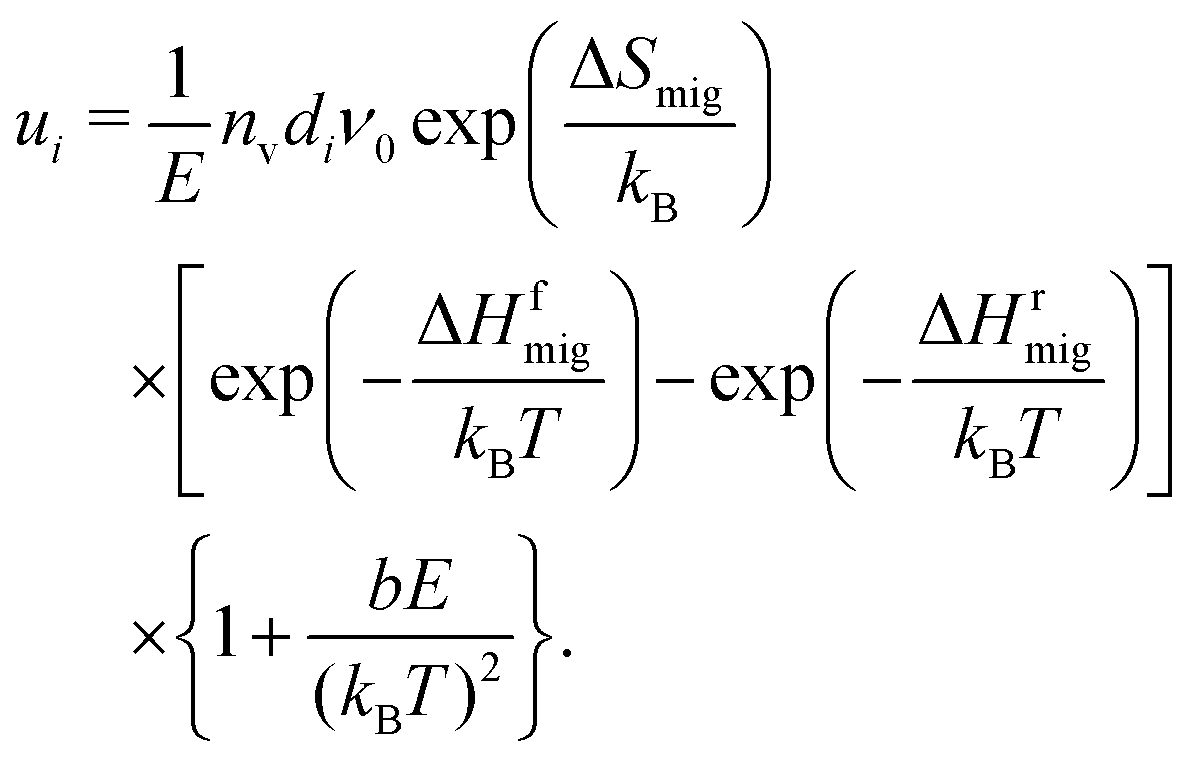 | (10) |
The form of this term was inspired by Onsager's work on the enhanced dissociation of ion pairs in solution by an electric field.85 Initially, we tried to apply the original formalism directly to our data, thus making the unreasonable assumption [Fig. (1) and (2)] that one can describe GDC only in terms of defect pairs (of an oxygen vacancy and a Gd cation) that dissociate more readily with increasing field strength. This approach was not successful, strongly implying that the simple picture of defect pairs is not applicable to our materials. Nevertheless, it is necessary to account for the defect–defect interactions that cause the discrepancy between the simulated mobilities and the prediction from the standard model (Fig. 3). We found that the best (but still simple) form of an additional term needs to be proportional to E/T2 (similar to Onsager's formalism) in order to describe all our uO(E,T,y) data.
An even stronger result is that a single value of b = (1.1 ± 0.2) × 10−3 cm MV−1 eV−2 is able to describe uO(E,T) for all three random configurations and the equilibrium configurations of GDC10 and GDC20, as shown in Fig. 3(a)–(c) and (e), (f) with the solid lines. Only the equilibrium system of GDC2 [Fig. 3(d)] needs a higher value of b = 3.0 × 10⁻³ cm MV−1 eV−2 to describe the entire data.
The reason for the difference is that oxygen vacancies in equilibrium GDC2 were far less likely to encounter Gd cations during a simulation at high fields. That is, once they broke free of a cluster (and almost every oxygen vacancy was bound in a cluster with two Gd cations, see Fig. 2), the oxygen vacancies execute jumps in an almost pure CeO2 matrix, since there aren't that many Gd cations and those that are present are clustered together. Indeed, extracting the average number of Gd cations with full 1NN and 2NN oxygen shells (i.e. no oxygen vacancies present) from the MD simulations, and plotting this data as a function of field strength in Fig. 5, we find that equilibrium GDC2 is the only composition that shows different behaviour, namely, a strong increase in the number of oxygen vacancies not bound to Gd cations with increasing field. Thus, not only can the difference be explained, but also the higher value found for b.
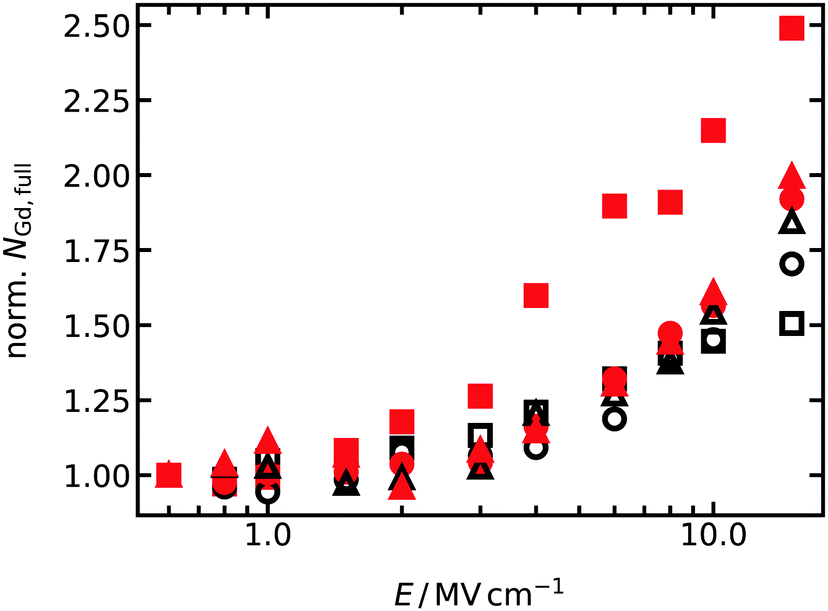 | ||
| Fig. 5 Average number of Gd cations with fully occupied 1NN and 2NN shells of oxide ions, NGd,full, for T = 1400 K. For better comparison between all concentrations and cation distributions, the number of Gd cations are normalised to the value at the lowest field strength. Meaning of the symbols is the same as in Fig. 4. | ||
5.3 Prediction of field-dependent oxide-ion mobilities for thin-film electrolytes
The description of the entire set of data for all systems in Section 5.2 allows us further to predict oxide-ion mobilities, and subsequently conductivities, for other temperatures and field strengths of interest. In Fig. 6 we show calculated σ for all three concentrations in random as well as equilibrium configuration for T = 700 K and field strengths of E = 10−2–101 MV cm−1. This is a typical temperature in the application of IT-SOFCs, and importantly, it is above the temperature range at which a change in enthalpy is often observed experimentally.84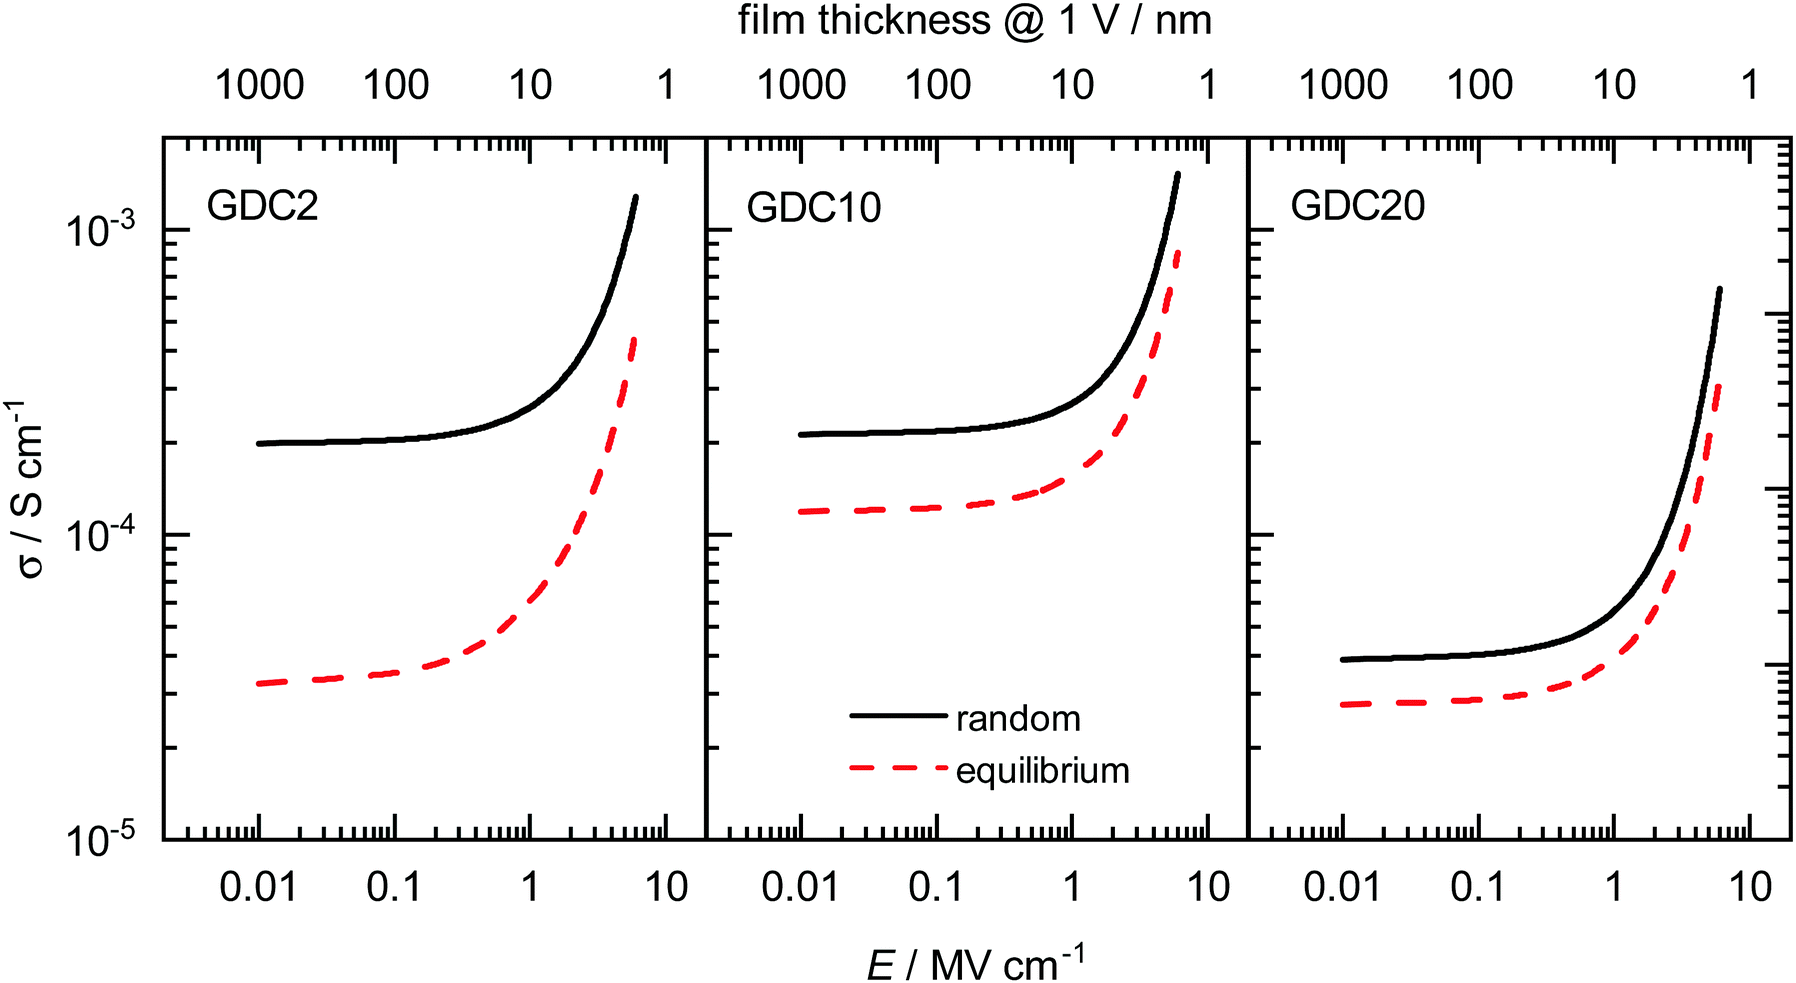 | ||
| Fig. 6 Field-dependent ionic conductivities σ at T = 700 K calculated with eqn (10) and (7) for all three concentrations with random as well as equilibrium distributions of Gd. The corresponding thickness of a hypothetical thin film at an applied voltage of 1 V is shown on the top abscissa axis. | ||
The predictions show that at low field strengths the highest σ are achieved for the random configurations of GDC2 and GDC10. The conductivity for GDC20 at the same T and E is almost one order of magnitude lower due to the higher migration enthalpy (see Section 5.2). σ is always lower in the equilibrium case than in the random case for all three concentrations. Therefore, achieving the highest conductivities involves a random distribution of cations in the sample being produced through physical deposition of a thin film (by, e.g., pulsed laser deposition or sputtering) and being maintained by avoiding high temperatures. Also plotted in Fig. 6 (on the top abscissa axis) is the thickness of a hypothetical thin-film electrolyte that corresponds to the electric field strength E when a voltage of one volt is applied. (Data are plotted down to a film thickness of five nm.) In this way, we show that thin films of physically reasonable thicknesses (i.e. much greater than a unit cell) with a physically reasonable applied voltage (1 V) are predicted to exhibit field-accelerated conductivities, with increases being at least twice as high as in the low-field regime. For an increase of one order of magnitude at this temperature, the film thickness would need to be in the range of only a few nanometres already approaching the unit cell limit. And voltages of 10 V will decompose the oxide.
It needs to be emphasised that the experimental conductivity behaviour of thin ceria films may be affected by a host of other phenomena. Lattice strain introduced during film preparation can be beneficial or detrimental to ionic conductivity;86–88 microstructural features such as grain boundaries can decrease the ionic conductivity.89–93 Thus, carefully conducted measurements as a function of field strength and temperature are needed to safely distinguish field-enhanced ion transport from other effects.45,94,95
5.4 Field-dependent oxide-ion mobilities for resistive switching applications
There is a second application for which the field- and temperature-dependent behaviour of the ion mobility in oxides plays a central role: resistive switching random access memory (ReRAM), an energy-efficient, high-density, non-volatile possibility for information storage. Upon application of a few volts to a ReRAM oxide, its resistance should switch within nanoseconds between low- and high-resistance states (the write step), but upon repeated application of voltages of a fraction of a volt (the read step), the resistance state should remain unchanged. One source of such extreme non-linearity is uO(E,T).96The main contenders for the active ReRAM oxide are un-doped binary systems, HfO2 and Ta2O5. Systems such as Ce1−yGdyO2−y/2 understandably have not received much attention,97 because the changes in defect concentrations upon switching are rather modest, and this leads to unstable resistance states over longer times (the written information does not stay written). What our results show (Fig. 3) is that Ce1−yGdyO2−y/2 systems have higher non-linearity than the pure oxide, and we attribute this to the defect–defect interactions (see Sections 5.1 and 5.2 for details). Such systems, due to their high non-linearity and ability to forget, may be suitable for application in neuromorphic computing.
6 Conclusions
We suggested two new recipes for ceria-based electrolytes to overcome the low-temperature hurdle in the race from promising ion-conductor to a high-performance fuel-cell electrolyte. Through a combination of MD and MMC calculations, we obtained oxide-ion mobilities as a function of temperature and field strength for three different Ce1−yGdyO2−y/2 systems and two different Gd distributions (random and equilibrium). Five key messages are emphasized:• Obtaining (field-dependent) ion mobilities from MD simulations must involve the analysis of the ions' time-dependent mean displacement rather than their mean-squared displacement.
• The distribution of substituent cations has a substantial effect on the oxide-ion mobility uO and its activation enthalpy at low cation concentrations but these effects diminish with increasing Gd concentration.
• The standard analytical treatment for field-dependent ion mobility is not applicable for solid solutions due to defect–defect interactions, but an empirical augmentation of this model with one additional parameter yields a quantitative description of all uO(E,T,y) data obtained in this study.
• The increased non-linearity of uO at high electric fields in Ce1−yGdyO2−y/2 compared with pure ceria suggests that the introduction of interacting defects in such materials may be beneficial for the application in neuromorphic computing.
• Predicted oxide-ion conductivities for T = 700 K, a typical IT-SOFC working temperature, indicate that the combination of thin films with thickness <10 nm and random instead of equilibrium Gd distribution can increase oxide-ion conductivity of ceria–gadolinia materials by more than one order of magnitude.
Author contributions
The project was initiated by R. A. D. S. and A. T. Simulations were performed and analysed by D. K. Data analysis and interpretation was carried out by D. K. under the supervision of R. A. D. S. The paper was written by D. K. and R. A. D. S., with support from A. T.Conflicts of interest
There are no conflicts to declare.Acknowledgements
Funding from the German Research Foundation (DFG) within the framework of the collaborative research center SFB 917 (Nanoswitches) is acknowledged. This project received funding from the European Union's Horizon 2020 research and innovation program under grant agreement no. 101017709 (EPISTORE). Simulations were performed with computing resources granted by RWTH Aachen University under Project No. rwth0517 and rwth0656. We thank G. F. Harrington and R. Dittmann for helpful discussions.Notes and references
- H. L. Tuller and A. S. Nowick, J. Electrochem. Soc., 1975, 122, 255–259 CrossRef CAS.
- H. Yahiro, Y. Baba, K. Eguchi and H. Arai, J. Electrochem. Soc., 1988, 135, 2077–2080 CrossRef CAS.
- M. Sahibzada, B. C. H. Steele, K. Zheng, R. A. Rudkin and I. S. Metcalfe, Catal. Today, 1997, 38, 459–466 CrossRef CAS.
- H. Yahiro, K. Eguchi and H. Arai, Solid State Ionics, 1989, 36, 71–75 CrossRef CAS.
- R. Doshi, V. L. Richards, J. D. Carter, X. Wang and M. Krumpelt, J. Electrochem. Soc., 1999, 146, 1273–1278 CrossRef CAS.
- B. Dalslet, P. Blennow, P. V. Hendriksen, N. Bonanos, D. Lybye and M. Mogensen, J. Solid State Electrochem., 2006, 10, 547–561 CrossRef CAS.
- K. Eguchi, T. Setoguchi, T. Inoue and H. Arai, Solid State Ionics, 1992, 52, 165–172 CrossRef CAS.
- H. Inaba and H. Tagawa, Solid State Ionics, 1996, 83, 1–16 CrossRef CAS.
- B. C. H. Steele, Solid State Ionics, 2000, 129, 95–110 CrossRef CAS.
- Z. Tianshu, P. Hing, H. Huang and J. A. Kilner, Solid State Ionics, 2002, 148, 567–573 CrossRef.
- J. Koettgen, S. Grieshammer, G. Dück, G. Ulbrich, M. Lerch and M. Martin, Solid State Ionics, 2020, 355, 115422 CrossRef CAS.
- D. Maricle, T. Swarr and S. Karavolis, Solid State Ionics, 1992, 52, 173–182 CrossRef CAS.
- J. M. Ralph, J. A. Kilner and B. C. H. Steele, MRS Proc., 1999, 575, 309–314 CrossRef.
- A. V. Coles-Aldridge and R. T. Baker, Solid State Ionics, 2020, 347, 115255 CrossRef CAS.
- R. Gerhardt and A. S. Nowick, J. Am. Ceram. Soc., 1986, 69, 641–646 CrossRef CAS.
- X.-D. Zhou, W. Huebner, I. Kosacki and H. Anderson, J. Am. Ceram. Soc., 2002, 85, 1757–1762 CrossRef CAS.
- X. Guo, W. Sigle and J. Maier, J. Am. Ceram. Soc., 2003, 86, 77–87 CrossRef CAS.
- S. Badwal, Solid State Ionics, 1998, 109, 167–186 CrossRef CAS.
- J. Drennan, Solid State Ionics, 2000, 134, 75–87 CrossRef CAS.
- J. Lane, J. Neff and G. Christie, Solid State Ionics, 2006, 177, 1911–1915 CrossRef CAS.
- T. S. Zhang, J. Ma, S. H. Chan, P. Hing and J. A. Kilner, Solid State Sci., 2004, 6, 565–572 CrossRef CAS.
- T. Zhang, Solid State Ionics, 2004, 167, 203–207 CrossRef CAS.
- A. Tsoga, A. Naoumidis, A. Gupta and D. Stöver, Mater. Sci. Forum, 1999, 308-311, 794–799 CAS.
- Z.-P. Li, T. Mori, G. J. Auchterlonie, J. Zou and J. Drennan, J. Solid State Chem., 2011, 184, 2458–2461 CrossRef CAS.
- F. Iguchi, Y. Endo, T. Ishida, K. Sato, T. Hashida and H. Yugami, Solid State Ionics: The Science and Technology of Ions in Motion – Proceedings of the 9th Asian Conference, 2004, pp. 179–186.
- J. L. Routbort, K. C. Goretta, A. R. de Arellano-López and J. Wolfenstine, Scr. Mater., 1997, 38, 315–320 CrossRef.
- M. Martin and O. Schulz, Solid State Ionics: The Science and Technology of Ions in Motion – Proceedings of the 9th Asian Conference, 2004, pp. 787–797.
- G. Petot-Ervas and C. Petot, Ionics, 2005, 11, 189–197 CrossRef CAS.
- T. S. Zhang, J. Ma, H. T. Huang, P. Hing, Z. T. Xia, S. H. Chan and J. A. Kilner, Solid State Sci., 2003, 5, 1505–1511 CrossRef CAS.
- T. S. Zhang, J. Ma, L. B. Kong, S. H. Chan and J. A. Kilner, Solid State Ionics, 2004, 170, 209–217 CrossRef CAS.
- M. Yan, T. Mori, J. Zou, G. J. Auchterlonie and J. Drennan, J. Eur. Ceram. Soc., 2010, 30, 2505–2513 CrossRef CAS.
- R. Fuentes and R. Baker, Int. J. Hydrogen Energy, 2008, 33, 3480–3484 CrossRef CAS.
- S. Beschnitt, T. Zacherle and R. A. De Souza, J. Phys. Chem. C, 2015, 119, 27307–27315 CrossRef CAS.
- S. Beschnitt and R. A. De Souza, Solid State Ionics, 2017, 305, 23–29 CrossRef CAS.
- E. Gourba, P. Briois, A. Ringuedé, M. Cassir and A. Billard, J. Solid State Electrochem., 2004, 8, 633–637 CrossRef CAS.
- H. Huang, T. M. Gür, Y. Saito and F. Prinz, Appl. Phys. Lett., 2006, 89, 143107 CrossRef.
- L. Minervini, M. O. Zacate and R. W. Grimes, Solid State Ionics, 1999, 116, 339–349 CrossRef CAS.
- D. R. Ou, T. Mori, F. Ye, J. Zou, G. Auchterlonie and J. Drennan, Phys. Rev. B: Condens. Matter Mater. Phys., 2008, 77, 024108 CrossRef.
- E. Verwey, Physica, 1935, 2, 1059–1063 CrossRef CAS.
- J. Frenkel, Kinetic Theory of Liquids, Oxford University Press, Oxford, 1946 Search PubMed.
- N. F. Mott and R. W. Gurney, Electronic Processes in Ionic Crystal, Oxford University Press, Oxford, 2nd edn, 1950 Search PubMed.
- G. Murch, Solid State Ionics, 1982, 7, 177–198 CrossRef CAS.
- H. J. D. Bruin and G. E. Murch, Philos. Mag., 1973, 27, 1475–1488 CrossRef.
- M. Schroeder and M. Martin, Z. Phys. Chem., 1998, 207, 1–19 CrossRef CAS.
- A. R. Genreith-Schriever and R. A. De Souza, Phys. Rev. B, 2016, 94, 224304 CrossRef.
- D. Kemp and R. A. De Souza, Phys. Rev. Mater., 2021, 5, 105401 CrossRef CAS.
- M. S. Abdallah and M. Youssef, Phys. Rev. Mater., 2021, 5, 114606 CrossRef CAS.
- W. Xu, A. Maksymenko, S. Hasan, J. J. Meléndez and E. Olevsky, Acta Mater., 2021, 206, 116596 CrossRef CAS.
- M. Schie, S. Menzel, J. Robertson, R. Waser and R. A. De Souza, Phys. Rev. Mater., 2018, 2, 035002 CrossRef CAS.
- A.-M. El-Sayed, M. B. Watkins, T. Grasser and A. L. Shluger, Phys. Rev. B, 2018, 98, 064102 CrossRef CAS.
- N. Salles, L. Martin-Samos, S. de Gironcoli, L. Giacomazzi, M. Valant, A. Hemeryck, P. Blaise, B. Sklenard and N. Richard, Nat. Commun., 2020, 11, 3330 CrossRef CAS PubMed.
- A. P. Thompson, H. M. Aktulga, R. Berger, D. S. Bolintineanu, W. M. Brown, P. S. Crozier, P. J. In't Veld, A. Kohlmeyer, S. G. Moore, T. D. Nguyen, R. Shan, M. J. Stevens, J. Tranchida, C. Trott and S. J. Plimpton, Comput. Phys. Commun., 2022, 271, 108171 CrossRef CAS.
- S. Nosé, J. Chem. Phys., 1984, 81, 511–519 CrossRef.
- W. G. Hoover, Phys. Rev. A: At., Mol., Opt. Phys., 1985, 31, 1695–1697 CrossRef PubMed.
- R. W. Hockney, Computer simulation using particles, CRC Press, Boca Raton, 1988 Search PubMed.
- V. Butler, C. Catlow, B. Fender and J. Harding, Solid State Ionics, 1983, 8, 109–113 CrossRef CAS.
- M. W. D. Cooper, M. J. D. Rushton and R. W. Grimes, J. Phys.: Condens. Matter, 2014, 26, 105401 CrossRef CAS PubMed.
- A. Gotte, D. Spangberg, K. Hermansson and M. Baudin, Solid State Ionics, 2007, 178, 1421–1427 CrossRef CAS.
- A. Gotte, K. Hermansson and M. Baudin, Surf. Sci., 2004, 552, 273–280 CrossRef CAS.
- R. W. Grimes, G. Busker, M. A. McCoy, A. Chroneos, J. A. Kilner and S.-P. Chen, Ber. Bunsen-Ges., 1997, 101, 1204–1210 CrossRef CAS.
- A. Pedone, G. Malavasi, M. C. Menziani, A. N. Cormack and U. Segre, J. Phys. Chem. B, 2006, 110, 11780–11795 CrossRef CAS PubMed.
- T. Sayle, S. Parker and C. Catlow, Surf. Sci., 1994, 316, 329–336 CrossRef CAS.
- T. X. T. Sayle, M. Molinari, S. Das, U. M. Bhatta, G. Möbus, S. C. Parker, S. Seal and D. C. Sayle, Nanoscale, 2013, 5, 6063 RSC.
- S. Vyas, R. W. Grimes, D. H. Gay and A. L. Rohl, J. Chem. Soc., Faraday Trans., 1998, 94, 427–434 RSC.
- S. Grieshammer, L. Momenzadeh, I. Belova and G. E. Murch, Solid State Ionics, 2020, 355, 115424 CrossRef CAS.
- H. Xu, R. K. Behera, Y. Wang, F. Ebrahimi, S. B. Sinnott, E. D. Wachsman and S. R. Phillpot, Solid State Ionics, 2010, 181, 551–556 CrossRef CAS.
- A. Tarancón, A. Morata, F. Peiró and G. Dezanneau, Fuel Cells, 2010, 11, 26–37 CrossRef.
- J. A. Purton, Phys. Chem. Chem. Phys., 2019, 21, 9802–9809 RSC.
- G. Arora and D. S. Aidhy, J. Mater. Chem. A, 2017, 5, 4026–4035 RSC.
- H. B. Lee, F. B. Prinz and W. Cai, Acta Mater., 2013, 61, 3872–3887 CrossRef CAS.
- N. Metropolis, A. W. Rosenbluth, M. N. Rosenbluth, A. H. Teller and E. Teller, J. Chem. Phys., 1953, 21, 1087–1092 CrossRef CAS.
- J. A. Purton, N. L. Allan and D. S. D. Gunn, Solid State Ionics, 2017, 299, 32–37 CrossRef CAS.
- A. Stukowski, Modell. Simul. Mater. Sci. Eng., 2010, 18, 015012 CrossRef.
- Z.-P. Li, T. Mori, F. Ye, D. Ou, J. Zou and J. Drennan, J. Chem. Phys., 2011, 134, 224708 CrossRef PubMed.
- P. A. Žguns, A. V. Ruban and N. V. Skorodumova, Phys. Chem. Chem. Phys., 2017, 19, 26606–26620 RSC.
- P. A. Žguns, A. V. Ruban and N. V. Skorodumova, Phys. Chem. Chem. Phys., 2018, 20, 11805–11818 RSC.
- S. Grieshammer, B. O. H. Grope, J. Koettgen and M. Martin, Phys. Chem. Chem. Phys., 2014, 16, 9974 RSC.
- M. Nakayama and M. Martin, Phys. Chem. Chem. Phys., 2009, 11, 3241 RSC.
- S. Vives, D. Ramel and C. Meunier, Ceram. Int., 2019, 45, 21625–21634 CrossRef CAS.
- F. Ye, T. Mori, D. Ou, A. Cormack, R. Lewis and J. Drennan, Solid State Ionics, 2008, 179, 1962–1967 CrossRef CAS.
- J. Koettgen and M. Martin, J. Am. Ceram. Soc., 2020, 103, 3776–3787 CrossRef CAS.
- B. Li, X. Wei and W. Pan, Int. J. Hydrogen Energy, 2010, 35, 3018–3022 CrossRef CAS.
- L. Chen, C. L. Chen, D. X. Huang, Y. Lin, X. Chen and A. J. Jacobson, Solid State Ionics, 2004, 175, 103–106 CrossRef CAS.
- J. Koettgen, S. Grieshammer, P. Hein, B. O. H. Grope, M. Nakayama and M. Martin, Phys. Chem. Chem. Phys., 2018, 20, 14291–14321 RSC.
- L. Onsager, J. Chem. Phys., 1934, 2, 599–615 CrossRef CAS.
- R. A. De Souza, A. Ramadan and S. Hörner, Energy Environ. Sci., 2012, 5, 5445–5453 RSC.
- G. F. Harrington, L. Sun, B. Yildiz, K. Sasaki, N. H. Perry and H. L. Tuller, Acta Mater., 2019, 166, 447–458 CrossRef CAS.
- G. F. Harrington, S. Kim, K. Sasaki, H. L. Tuller and S. Grieshammer, J. Mater. Chem. A, 2021, 9, 8630–8643 RSC.
- D. S. Mebane and R. A. De Souza, Energy Environ. Sci., 2015, 8, 2935–2940 RSC.
- G. F. Harrington, A. Cavallaro, D. W. McComb, S. J. Skinner and J. A. Kilner, Phys. Chem. Chem. Phys., 2017, 19, 14319–14336 RSC.
- D. V. Laethem, J. Deconinck, D. Depla and A. Hubin, J. Eur. Ceram. Soc., 2016, 36, 1983–1994 CrossRef.
- X. Tong, D. S. Mebane and R. A. De Souza, J. Am. Ceram. Soc., 2019, 103, 5–22 CrossRef.
- D. V. Laethem, J. Deconinck and A. Hubin, J. Eur. Ceram. Soc., 2020, 40, 2404–2416 CrossRef.
- S. Murugavel and B. Roling, J. Non-Cryst. Solids, 2005, 351, 2819–2824 CrossRef CAS.
- A. Heuer, S. Murugavel and B. Roling, Phys. Rev. B: Condens. Matter Mater. Phys., 2005, 72, 174304 CrossRef.
- S. Menzel, M. von Witzleben, V. Havel and U. Böttger, Faraday Discuss., 2019, 213, 197–213 RSC.
- R. Schmitt, J. Spring, R. Korobko and J. L. M. Rupp, ACS Nano, 2017, 11, 8881–8891 CrossRef CAS PubMed.
| This journal is © the Owner Societies 2022 |