Cation structure-dependence of the Pockels effect in aprotic ionic liquids
Yufeng
Wang
a,
Laxmi
Adhikari
b,
Gary A.
Baker
 b and
G. J.
Blanchard
 *a
*a
aMichigan State University, Department of Chemistry, East Lansing, MI 48824, USA. E-mail: blanchard@chemistry.msu.edu; Tel: +1 517 353 1105
bUniversity of Missouri, Department of Chemistry, Columbia, MO 65211, USA
First published on 18th July 2022
Abstract
We report on the dependence of surface charge-induced birefringence (the Pockels effect) in room temperature ionic liquids (RTILs) with different cation constituents. The induced birefringence is related to the induced free charge density gradient (ρf) in the RTIL. The RTILs are confined in a lens-shaped cell and the surface charge density of the concave cell surface is controlled by the current passed through the surface ITO film. We find that, in all cases, the induced birefringence is proportional to the surface charge density and that the change in refractive index nearest the ITO surface can be on the order of 20%. Our findings indicate that the induced birefringence depends more sensitively on the cation aliphatic substituent length than on the identity of the charge-carrying headgroup.
Introduction
Room temperature ionic liquids (RTILs) have received extensive attention, not only because of their demonstrated utility in a wide range of applications, but also because achieving a fundamental understanding of the factors responsible for observed bulk behavior remains to be accomplished. Among the reasons for the interest in RTILs is that this class of materials possesses a ca. 5 eV electrochemical window in addition to their ability to dissolve compounds with a wide range of polarities. Careful examination of RTIL properties by a number of groups has revealed the existence of long-range organization on a variety of length scales and it remains to be determined how all of these observations can be reconciled within the framework of a single model. The Shaw group has reported on structural organization in RTIL thin films that evolves subsequent to the formation of the film.1 In that work, they reported that the structural organization persists over distances of at least 1 μm, based on vibrational spectroscopic and second order nonlinear optical data.1–3 The Fayer group has reported variation in the order of RTILs over distances in the hundreds of nm range in thin RTIL films based on their use of small vibrational chromophores.4–9 Gebbie et al. have also identified organization in RTILs but on a much shorter length scale, using force measurements, and based on their data they asserted that the extent of RTIL dissociation was rather limited.10,11 The Blanchard group has reported on the existence of an induced free charge density gradient (ρf) in RTILs that persists over distances greater than 50 μm.12–17 While all of these investigations share the conclusion that organization in RTILs can persist for distances vastly in excess of that seen in normal solution phase systems, identifying the connection(s) between these different bodies of work as well as the physical and chemical basis for this organization, remains to be accomplished.Among the issues that complicate the treatment of RTILs is a knowledge gap concerning the extent of their dissociation. The measurement of conductivity is one means to evaluate extent of dissociation provided the bulk materials properties of the RTIL are known with sufficient accuracy,18 and there is an emerging body of work that suggests the extent of dissociation is on the order of 50% in many RTILs.19 This finding, which provides important insight into this class of materials, also complicates their theoretical treatment because they are neither purely dielectric materials nor conductors, and the applicability of Maxwell's equations in either limit is not fully justified.
We have reported recently on the induced birefringence in RTILs that is a direct consequence of ρf.16 What was not clear from first principles was the relationship between the magnitude of ρf and the magnitude of the resulting gradient in refractive index (n). In the initial report, we found that the refractive index of an imidazolium RTIL (BMIM+TFSI−) could, in fact, be substantial and the Welton and Shigeto groups have recently reported on the Pockels effect in RTILs, detected using confocal Raman microspectroscopy.20 This is an important finding for several reasons; it provides a probe-free means of evaluating ρf and it demonstrates a simple way to characterize the polarizability of RTILs. In this work we consider the dependence of the induced birefringence on the molecular structure of the RTIL cation. We have examined two pyrrolidinium RTILs with pendant butyl and octyl aliphatic chains, alongside their imidazolium RTIL counterparts possessing the same aliphatic chain lengths. We find that the magnitudes of the induced birefringence are similar for the pyrrolidinium and imidazolium cations, with the primary structural-dependence being the length of the cation aliphatic chains.
Experimental section
Materials
1-Octyl-3-methylpyrrolidinium bis(trifluoromethylsulfonyl)imide (OMPyrr+TFSI−) and 1-butyl-3-methylpyrrolidinium bis(trifluoromethylsulfonyl)imide (BMPyrr+TFSI−) were prepared followed methods reported elsewhere.21 1-Octyl-3-methylimidazolium bis(trifluoromethylsulfonyl)imide (OMIM+TFSI−, ≥99%) was from Alfa Aesar and 1-butyl-3-methylimidazolium bis(trifluoromethylsulfonyl)imide (BMIM+TFSI−, ≥98%) was from Sigma-Aldrich. All RTILs are purified as detailed below before use. 2-Propyl alcohol (≥99.5%, Sigma-Aldrich) and activated charcoal (powder, −100 mesh particle size, decolorizing, Sigma-Aldrich) were used as received.Purification of RTILs
RTILs were purified by the method described previously.12,22 The RTIL is stored over activated charcoal for 3 days and removed by a syringe filter (Durapore® (PVDF), 0.22 μm pore size, Millex). The RTIL is then stirred and heated for 3 h at 90 °C while purging with ultrapure Ar (99.9995%, Linde) to reduce water in the RTIL. The water content in purified RTILs is ca. 50 ppm, determined by Karl Fischer titration. All glassware is dried at 150 °C at least 24 h before use to minimize water contamination.Sample cell preparation
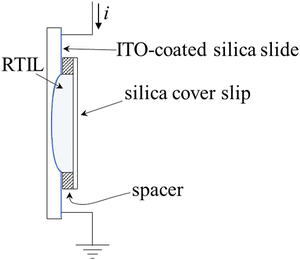
We have constructed a closed sample cell to confine the RTIL between a transparent conductive ITO-coated single depression concave glass slide (slide size: 25 mm × 75 mm × 1 mm (Fig. 1). The concave region size is 16 mm in diameter and 0.5 mm maximum depth, Amscope) and a microscope cover glass (22 × 22 mm, #1.5 thickness: 0.175 mm, Globe Scientific). The details of the sample cell construction have been disclosed previously.16 The ITO-coated concave slide and cover glass are sonicated in detergent (Sparkleen 1, Fisher) solution, Milli-Q water, and iso-propyl alcohol for 15 min each. The cleaned ITO-coated slide and cover glass are dried for 30 min at 200 °C and cooled in a desiccator. The cooled slide and cover glass are then placed in a UV/ozone cleaner for 20 min. Copper wires are connected to the conductive ITO surface by silver epoxy (MG Chemicals). To cure the epoxy, the ITO-coated slide is heated for 30 min at 120 °C. The purified RTIL sample is added to the concave region of the ITO-coated slide by syringe and the cover glass is set in place.Characterization of charge-induced change in RTIL refractive index
The far-field image of the light beam passed through the RTIL lens is used to measure the change of RTIL refractive index.16 The intensity of light passing through an aperture is detected with an optical power meter (Newport) as a function of the current applied to the ITO film on the concave slide. The light source is a dye laser that produces light at 575 nm (<10 mW average power). When the Gaussian laser beam passes through the RTIL sample in the cell, the shape of the far-field image varies according to the refractive index of the RTIL. Uncertainties reported in the data are standard deviations of at least three determinations for each data point.Results and discussion
It is important to compare the results we report here to the characterization of ρf in pyrrolidinium and imidazolium RTILs by rotational diffusion experiments. The measurement of ρf and the refractive index gradient are related to one another but do not measure precisely the same quantity. The surface charge which induces ρf is a static electric field and the rotational diffusion measurements characterize the induced gradient in a frequency regime corresponding to the inverse of the rotational diffusion time constant (ca. 2 × 10⁸ Hz). For the refractive index measurements we report, the probing electric field (λ = 575 nm, ca. 5 × 10¹⁴ Hz) is not static and we have used the relation ε(ω) = n2(ω), which holds in the high frequency limit. Because ε(ω = 0) and ε(ω > 0) is a continuous function, there is relationship between ε(0), ε(2 × 10⁸ Hz) and ε(5 × 10¹⁴ Hz) (= n2) which is not known, a priori, without characterization of the dielectric responses of the RTILs over a wide frequency range. An important goal of the Δn experiments is to establish whether the proportionality between ε at the relevant frequencies is such that one can relate the two measurements. The induced charge density gradient ρf is related to the refractive index gradient according to eqn (1).16| ρf = (∇n2)·E | (1) |
The characterization of ∇n in the four RTILs examined was done using the experimental apparatus and procedure described previously.16 From our characterization of ρf with rotational diffusion measurements, we know that the characteristic persistence length for these RTILs is the same for all to within the experimental uncertainty, ca. 70 μm.21 It is useful to note the complementary nature of these two measurement schemes. The persistence length of ρf is not measured directly with the ∇n measurements and, conversely, while the persistence length of ρf is readily available from the rotational diffusion measurements, evaluating the magnitude of ρf with that approach is more involved.
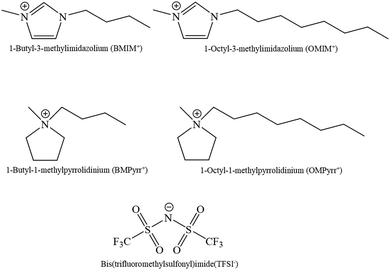
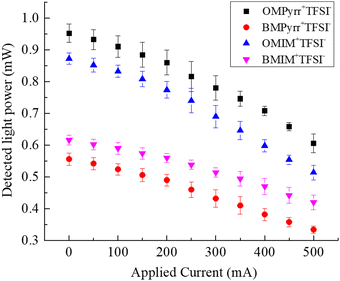
As noted above, the RTIL sample cell is in the form of a plano-convex lens. We control ρf in the RTIL contained within the sample cell through the surface charge on the ITO film on the curved inner surface of the sample cell as a function of the current applied to the ITO film surface. ITO carries a net positive surface charge under our experimental conditions and the application of a current across the ITO film mediates the carrier (e−) density in the film. The charge-induced change in n will alter the effective focal length of the RTIL lens, thereby changing the intensity of the light beam in the far field. We detect experimentally the intensity of light reaching the detector through a fixed aperture as a function of current passed across the ITO film surface in the sample holder. To calibrate the system for intensity of light measured as a function of refractive index of the medium within the sample cell, we performed measurements for a range of solvents of different refractive index.16 This calibration provides a direct means to evaluate the dependence of the average refractive index of the RTIL in the sample cell as a function of current passed across the ITO surface. To gauge the effect of RTIL structure on ∇n, we have selected four RTILs which have a common anion but different cations (Fig. 2). The relationship between detected light intensity and applied current for these RTILs is shown in Fig. 3.
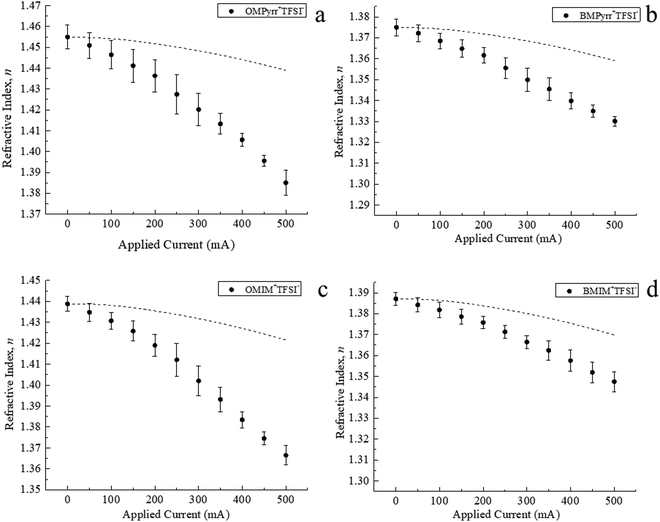
The manner in which we control the surface charge density, σs, on the ITO surface gives rise to Joule heating. Because the refractive index of any material will exhibit a temperature-dependence, it is important to discern the contribution to our experimental signals from Joule heating and that from induced ∇n. We have previously reported on the temperature change of the RTIL BMIM+TFSI− as a function of current applied.13 The temperature-dependence of RTIL refractive index has also been studied for a number of other imidazolium and pyrrolidinium RTILs.23 We have calibrated our sample cell in terms of Joule heating as a function of current applied13 and, using this calibration information, we plot the temperature-dependence of n for each RTIL (Fig. 4). With the calibration of the relationship between refractive index and light intensity,16 we report the relationship between the average RTIL index within the sample cell and current passed across the ITO surface (Fig. 5), where the effect of Joule heating is accounted for (dashed lines in Fig. 5a–d). The difference between these the temperature and surface charge dependencies reflects the contribution of ρf to the data, averaged over the thickness of the cell.
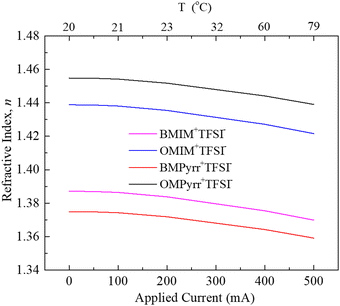 | ||
| Fig. 4 Change in the refractive index (n) of RTILs caused by Joule heating. Black line represents for OMPyrr+TFSI−, red line is BMPyrr+TFSI−, blue line is OMIM+TFSI− and purple line is BMIM+TFSI−. | ||
The identity of the RTIL cation plays an important role in determining the magnitude of ρf in RTILs.14 The charge-induced change in n of the RTIL is related to ρf and it follows that the change in detected light intensity is dependent on the RTIL cation structure, as can be seen from the data in Fig. 5. For each RTIL, the induced change in n is averaged over the thickness of the sample lens. Determining the change in n at the RTIL-ITO interface is important because it provides a gauge for what could be achieved using a thin film format. We have related the induced change in average n(naverage) and the change in n at the interface (n(0)).3 We know the functional form of ρf(x)12,14,15 and this can be related to the functional form of n(x) (eqn (2)),16
|n(x) − nbulk| = |n(0) − nbulk|exp![[thin space (1/6-em)]](https://www.rsc.org/images/entities/char_2009.gif) (−x/2d) (−x/2d) | (2) |
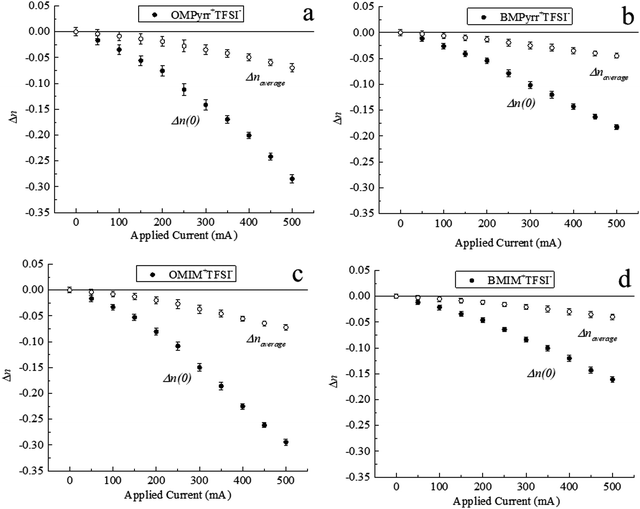
We consider next the dependence of n(0) on surface charge density for the four RTILs. The change in n(0) for RTILs as a function of the current applied is found to be different from the change in naverage (Fig. 6). The relatively modest change in naverage is because of the relative values of the lens thickness (l) and the ρf persistence length (d). Larger change in naverage could be realized by reducing the thickness of the lens to be closer to d.
By comparing the Δn for the selected four RTILs, it is clear that Δn varies with the identity of the RTIL cation (Fig. 6). The magnitude of Δn for OMPyrr+TFSI− (Fig. 6a) is larger than that of BMPyrr+TFSI− (Fig. 6b). This finding is consistent with the analogous data for OMIM+TFSI− (Fig. 6c) and BMIM+TFSI− (Fig. 6d). Based on these findings, it is clear that the RTIL cation alkyl chain length plays a larger role in determining ρf and thus Δn than the RTIL cation charged headgroup does.
The polarizability of a molecule depends on structure and orientation. In this case, we consider that the relevant “molecule” is the RTIL ion pair, not the dissociated ion(s). The optical susceptibility of a material is likewise known to depend on molecular-organization within the material. As discussed above, the induced change in n is significant for all RTILs studied here, suggesting that these systems exhibit comparatively large polarizabilities. We can utilize the Lorentz–Lorenz expression to evaluate polarizabilities and changes in polarizability for the imidazolium and pyrrolidinium RTILs (eqn (3) and (4)).24,25
 | (3) |
 | (4) |
| RTIL | FW (g mol−1) | ρ (g cm−3) | N (cm−3) | n (0) | n bulk | α (0) (Å3) | α bulk (Å3) | Δα (Å3) |
|---|---|---|---|---|---|---|---|---|
| The value of n(0) reported here is for the data acquired at I = 500 mA. | ||||||||
| OMPyrr+TFSI− | 478.52 | 1.270 | 1.599 × 10²¹ | 1.1705 | 1.4549 | 16.39 | 40.50 | −24.11 |
| BMPyrr+TFSI− | 422.41 | 1.390 | 1.982 × 10²¹ | 1.1924 | 1.3749 | 14.85 | 27.57 | −12.72 |
| OMIM+TFSI− | 475.48 | 1.320 | 1.672 × 10²¹ | 1.1445 | 1.4388 | 13.37 | 37.54 | −24.17 |
| BMIM+TFSI− | 419.37 | 1.437 | 2.064 × 10²¹ | 1.2259 | 1.3871 | 16.61 | 27.24 | −10.63 |
Conclusion
We characterize the charge-induced gradient in the refractive index for four RTILs, as a function of the current passed across the ITO film in contact with the RTIL. The induced gradient in n is along the E-field propagation axis, x, and for any given distance from the ITO film there is no change in n parallel to the support surface (yz plane). The induced change in n is thus an induced birefringence in the RTIL, which suggests the potential of RTILs to be used as novel electro-optic materials.3 We achieve significant change in n with modest change in σs. The magnitude of Δn and Δα is found to depend on the RTIL cation aliphatic chain length, providing useful insight into the design of RTIL constituents for the optimization of electro-optic effects. This work also demonstrates the connection between the ρf and Δn in the RTIL, induced by the surface charge.Conflicts of interest
There are no conflicts to declare.Acknowledgements
The research was carried out under the framework of project #W911-NF-14-10063 funded by the Army Research Office.References
- R. S. Anaredy and S. K. Shaw, Langmuir, 2016, 32, 5147–5154 CrossRef CAS PubMed.
- R. S. Anaredy and S. K. Shaw, J. Phys. Chem. C, 2018, 122, 19731–19737 CrossRef CAS.
- R. S. Anaredy and S. K. Shaw, J. Phys. Chem. C, 2019, 123, 8975–8982 CrossRef CAS.
- J. Nishida, J. P. Breen, B. Wu and M. D. Fayer, ACS Cent. Sci., 2018, 4, 1065–1073 CrossRef CAS PubMed.
- J. Y. Shin, S. A. Yamada and M. D. Fayer, J. Am. Chem. Soc., 2017, 139, 311–323 CrossRef CAS PubMed.
- J. Y. Shin, S. A. Yamada and M. D. Fayer, J. Am. Chem. Soc., 2017, 139, 11222–11232 CrossRef CAS PubMed.
- J. E. Thomaz, H. E. Bailey and M. D. Fayer, J. Chem. Phys., 2017, 147, 194502 CrossRef PubMed 1-11.
- B. Wu, J. P. Breen and M. D. Fayer, J. Phys. Chem. C, 2020, 124, 4179–4189 CrossRef CAS.
- B. Wu, J. P. Breen, X. Xing and M. D. Fayer, J. Am. Chem. Soc., 2020, 142, 9482–9492 CrossRef CAS PubMed.
- M. A. Gebbie, H. A. Dobbs, M. Valtiner and J. N. Israelachvilli, Proc. Natl. Acad. Sci. U. S. A., 2015, 112(24), 7432–7437 CrossRef CAS PubMed.
- M. A. Gebbie, M. Valtiner, X. Banquy, E. T. Fox, W. A. Henderson and J. N. Israelachvilli, Proc. Natl. Acad. Sci. U. S. A., 2013, 110(24), 9674–9679 CrossRef CAS PubMed.
- K. Ma, R. Jarosova, G. M. Swain and G. J. Blanchard, Langmuir, 2016, 32, 9507–9512 CrossRef CAS PubMed.
- K. Ma, R. Jarosova, G. M. Swain and G. J. Blanchard, J. Phys. Chem. C, 2018, 122, 7361–7367 CrossRef CAS.
- Y. Wang, R. Jarosova, G. M. Swain and G. J. Blanchard, Langmuir, 2020, 36, 1152–1155 Search PubMed.
- Y. Wang, F. Parvis, M. I. Hossain, K. Ma, R. Jarosova, G. M. Swain and G. J. Blanchard, Langmuir, 2021, 37, 605–615 CrossRef CAS PubMed.
- Y. Wang, G. M. Swain and G. J. Blanchard, J. Phys. Chem. B, 2021, 125, 950–955 CrossRef CAS PubMed.
- M. I. Hossain and G. J. Blanchard, Phys. Chem. Chem. Phys., 2022, 24, 3844–3853 RSC.
- P. Bonhote, A. P. Dias, N. Papageorgiou, K. Kalyanasundaram and M. Gratzel, Inorg. Chem., 1996, 35, 1168–1178 CrossRef CAS PubMed.
- O. Nordness and J. F. Brennecke, Chem. Rev., 2020, 120, 12873–12902 CrossRef CAS PubMed.
- S. Toda, R. Clark, T. Welton and S. Shigeto, Langmuir, 2021, 37, 5193–5201 CrossRef CAS PubMed.
- Y. Wang, L. Adhikari, G. A. Baker and G. J. Blanchard, Phys. Chem. Chem. Phys., 2022 Search PubMed , in review.
- R. Jarosova and G. M. Swain, J. Electrochem. Soc., 2015, 162, H507–H511 CrossRef CAS.
- S. Seki, S. Tsuzuki, K. Hayamizu, Y. Umebayashi, N. Serizawa, K. Takei and H. Miyashiro, J. Chem. Eng. Data, 2012, 57, 2211–2216 CrossRef CAS.
- H. A. Lorentz, Ann. Phys., 1881, 248(1), 127–136 CrossRef.
- L. Lorenz, Ann. Phys., 1880, 247(9), 70–103 CrossRef.
| This journal is © the Owner Societies 2022 |

