DOI:
10.1039/D2AN00875K
(Paper)
Analyst, 2022,
147, 3732-3740
Low-cost electrochemical paper-based device for exosome detection†
Received
26th May 2022
, Accepted 23rd June 2022
First published on 1st July 2022
Abstract
Exosomes are vesicles released by healthy and cancer cells into the extracellular matrix and bodily fluid. Cancer cell-derived exosomes have attracted much attention in early-stage detection and prognostication of treatment response. Thus, detecting exosomes is of great interest to biology and medicine. However, many conventional detection methods require high-cost equipment and centralized laboratory facilities, making diagnostics inaccessible in limited-resource settings. This study reports a proof-of-concept low-cost electrochemical paper-based analytical device to quantify both the total bulk and cancer cell-derived exosomes in cell culture media. The device employs a sandwich immune assay design, where exosomes are initially captured using the electrode-bound generic antibodies (i.e. CD9) and subsequently detected via ovarian cancer-specific CA125 antibodies. Our proposed device quantifies the total bulk exosome concentration with a detection limit of 9.3 × 10⁷ exosomes per mL and ovarian cancer cell-derived exosomes with a detection limit of 7.1 × 10⁸ exosomes per mL, with a relative standard deviation of <10% (n = 3). We suggest that this low-cost and simple electrochemical paper-based device could be an alternative tool for detecting disease-specific exosomes in biological samples with the potential to be further developed for point-of-care diagnosis.
1. Introduction
Recently, exosome isolation and analysis has attracted a great deal of attention from many research groups.1 Nanoparticle tracking analysis (NTA),2,3 plasmonic-based sensors,4 flow cytometry,5,6 and enzyme-linked immunosorbent assay (ELISA)7,8 have successfully been demonstrated for exosome detection and quantification. However, exosome quantification with NTA, plasmonic-based sensors and flow cytometry requires expensive and complex equipment such as a microscope with a particular optical setup. ELISA is considered a universal assay capable of analysing biomolecules, including exosomes utilizing the interaction between antibodies and exosome surface membrane proteins. However, the standard ELISA protocol for exosome detection is less sensitive and poorly specific (i.e., affected by the high false-positive response), requiring a laborious and time-consuming sample preparation process, including loading, washing, and incubation steps. Thus, there is an urgent need for developing a forthright and low-cost detection strategy to sensitively and perceptibly quantify exosomes present in biological samples.
Recent advances have suggested that paper-based platforms provide many sustainable cost-effective assays and sample preparation methods for various biomedical applications, including cancer biomarker detection.9,10 Integration of electrochemical readout to paper-based devices can offer additional advantages of achieving highly sensitive, specific, and portable biomolecular detection systems. Electrochemical paper-based devices, consisting of a three-electrode configuration (working, counter and reference electrodes), can facilitate point-of-care testing by offering eco-friendly and integrated technology compared to traditional screen-printed electrodes.11–13 The three-electrode system consists of a carbon working electrode, carbon counter electrode, and silver/silver chloride reference electrode. They have recently been used to detect many biological targets such as heavy metal ions in urine,14,15 disease-specific biomarkers such as SARS-CoV-2 antibodies and antigens, prostate specific antigen (PSA), C-reactive protein (CRP), troponin I (cTnI), and procalcitonin (PCT),16–18 or DNA detection.19,20
Compared to conventional electrochemical paper-based devices, a device that utilizes a three-carbon electrode system (i.e., replacing the silver/silver chloride reference electrode with a conducting carbon electrode) offers a more straightforward fabrication as well as more cost-effective. Carneiro et al. have developed such a device on a polyvinyl chloride (PVC) substrate and used it for microRNA detection.21 Wahyuni and his group have developed another similar device on PVC substrates to detect uric acid in human urine.22 To the best of our knowledge, an electrochemical paper-based device with all three-carbon electrode systems has not been developed for exosome detection. The critical principle of paper-based device fabrication is to make the paper both hydrophobic and hydrophilic, via surface amphiphilic treatment, so that biological samples, including chemicals, can be locally introduced on the paper substrate. Wax and polymer printing are commonly used on paper substrates due to the simplicity of fabrication.23–25 However, polymers or wax can cause over-permeation in the melting step, resulting in inconsistent patterns.26 As electrochemical assays require uniform electrode systems to prevent batch-to-batch variation, consistent fabrication methods are crucial. Recently, we reported the parafilm hot pressing technique for the fabrication of paper-based devices.27 This method offers a simple (requiring only two steps), fast (taking only five minutes per device), and low-cost (less than 0.01 USD per device) fabrication process. Moreover, the pattern mask can be easily drawn by the software and made by laser cutting in less than a minute.
Herein, we report a simple, low cost, electrochemical paper-based approach for detecting ovarian cancer cell-derived exosomes from total exosome populations. Exosomes are isolated from cell culture media, spiked into phosphate buffered saline (PBS), and subsequently characterized by NTA. Paper-based carbon electrodes (PCEs) are immobilized with a universal tetraspanin biomarker antibody (i.e., CD9). Subsequently, PCEs are exposed to the total exosomes from prepared samples. The sandwich immunological assay captures ovarian cancer-derived exosomes via the interaction between previously coated surface-bound anti-CD9 and subsequently loaded ovarian cancer-specific CA125 antibodies. Differential pulse voltammetry (DPV) is performed to observe faradaic current produced in subsequent steps of binding biomolecules in the presence of a [Fe(CN)6]3−/4− redox system. The stepwise addition of subsequent biomolecules on the PCEs hinders the diffusion of [Fe(CN)6]3−/4− ions at the electrode interface due to the adsorbed biomolecules, leading to the attenuation of the DPV current response. This DPV response after exosome binding corresponds to the amount of captured exosome targets and serves as a proof-of-concept for detecting and quantifying cancer cell-derived exosomes.
2. Materials and methods
2.1. Chemicals and reagents
Chromatography filter paper (CHR, Whatman, UK) was used as our device platform. We utilized Parafilm (Bemis Company, US) to make the paper substrate hydrophobic. During the fabrication process, a gloss laminate pouch with 80 μm thickness served as the patterning mask (front and back support). Carbon conductive paint (RS Components, UK) was used to prepare the carbon ink for the carbon electrode. Electrochemical assays were performed with 5 mM K3Fe(CN)6 (PA025-500G, Chem Supply, Australia) and 5 mM K4Fe(CN)6 (PA039-500G, Chem Supply, Australia) prepared in PBS, which is 1× PBS (137 mM NaCl, 10 mM phosphate, and 2.7 mM KCl, pH 7.4), unless specified.
For exosome preparation, OVCAR3 (ovarian cancer cells, ATCC, USA) and Met-5A (human epithelial cells, ATCC, USA) were cultured to produce exosomes. RPMI-1640 media (11875-093, Gibco, Thermo Fisher Scientific, Germany), Foetal Bovine Serum (FBS, A3160901, Gibco, Thermo Fisher Scientific, Germany) and exosome-depleted Foetal Bovine Serum (exosome-free FBS, A25904DG, Gibco, Thermo Fisher Scientific, Germany) constitute the cell culture medium. 1% Penicillin and Streptomycin (PenStrep, 15140-122, Gibco, Thermo Fisher Scientific, Germany) was added into the cell culture medium to prevent bacterial and fungal contamination. TrypLE (12604-021, Gibco, Thermo Fisher Scientific, Germany) was used for trypsinization during the subculturing process. HBSS (14175-095, Gibco, Thermo Fisher Scientific, Germany) was used as a buffer to wash the cells. Exosomes were isolated with total exosome isolation kits (4478359, Invitrogen, Thermo Fisher Scientific, Germany).
2.2. Paper-based electrochemical device fabrication
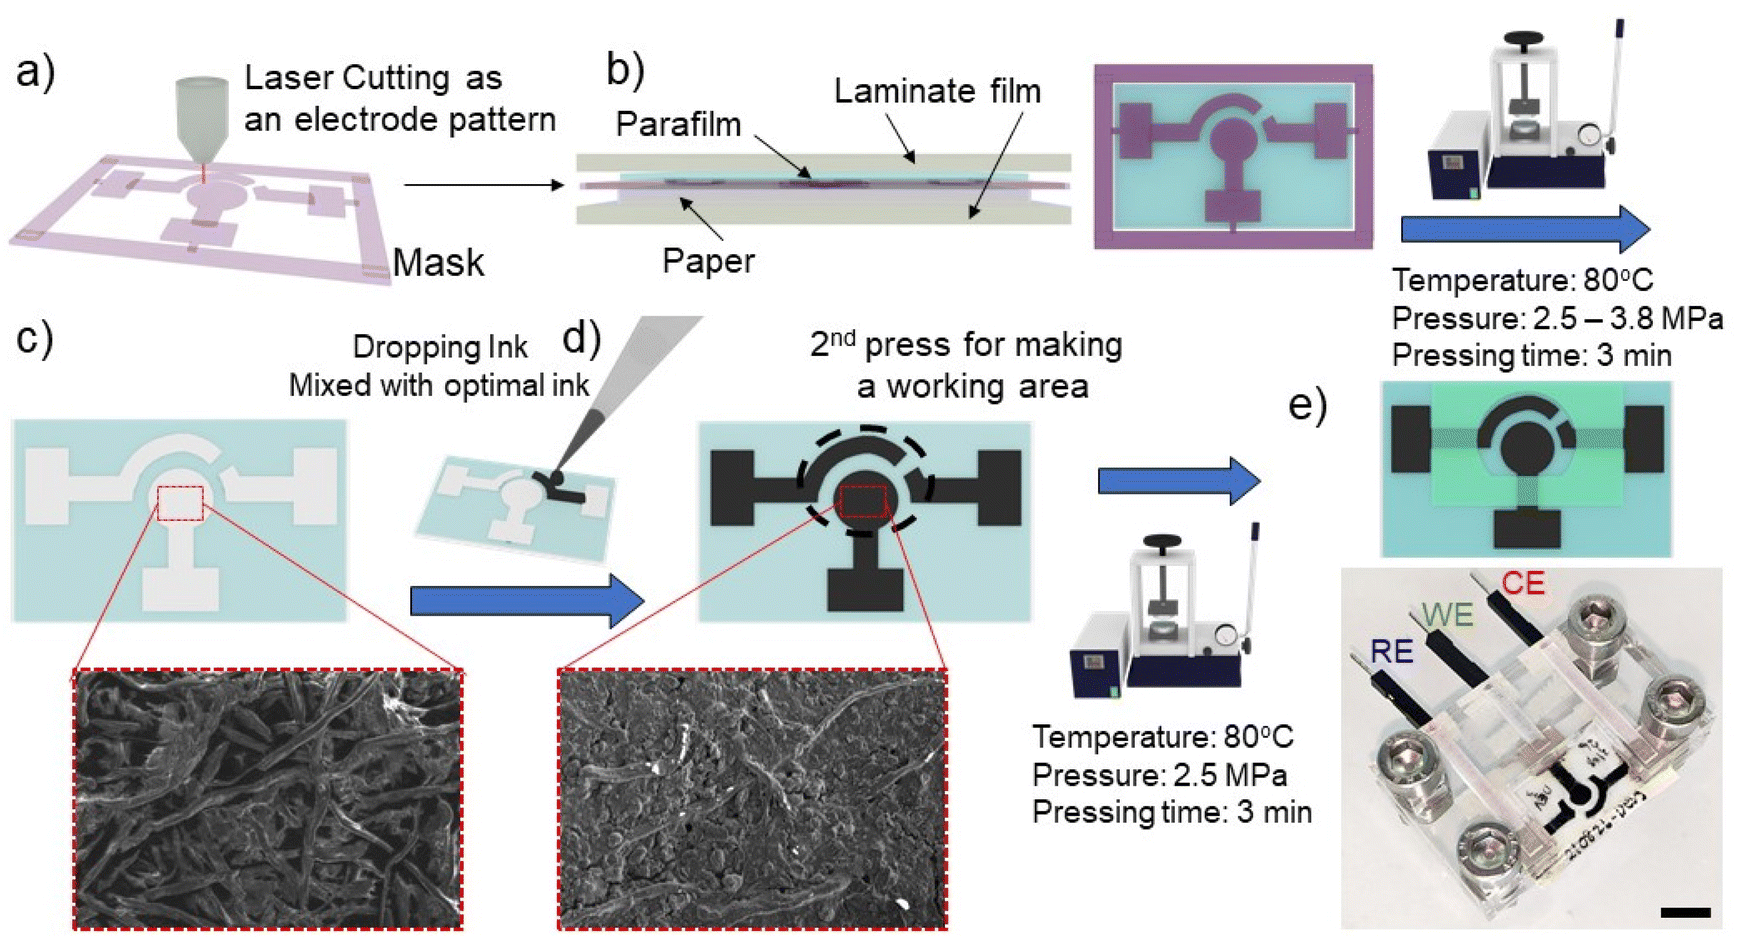
The electrochemical paper-based device was fabricated following a modified protocol of our previous published method.27,28 In brief, the laminate pouch was designed by CorelDraw software (CorelDRAW2019, Corel Corporation Inc., Canada) and patterned as a mask using a laser cutting machine (Rayjet 50 Laser Engraver, Trotec laser, Austria) (Fig. 1a). Parafilm, patterning laminate mask, and CHR paper were orderly layered, and then covered with aluminium foil to form the paper substrate (Fig. 1b). Subsequently, the layered substrate was placed into a hot press machine (Specac, UK) with a pressure of 3.8 MPa, temperature of 80 °C and 3 minutes of pressing time. Under the hot-pressing conditions, parafilm was melted and permeated into the paper through the patterning mask (Fig. 1c). The carbon electrodes were formed by adding 20 μL of optimal carbon ink as discussed in section 3.1 on the substrate surface. The subsequent electrode area formation was governed by the patterning mask (Fig. 1d). The carbon electrodes were then dried at room temperature for 2 hours. An additional parafilm pressing step was performed to cover the connecting electrode and to define a specific working area (Fig. 1e). The paper was pressed with the following parameters: a pressure of 2.5 MPa, a temperature of 80 °C and 3 minutes of pressing time. Since the working area was well-defined by the parafilm hot pressing step, the solvent can only wet the working carbon electrode area. Before using the paper-based device for electrochemical assay, excess carbon which did not adhere to the paper substrate was removed from the surface of the substrate by allowing 100 μL of deionized (DI) water to soak into the working electrode area for 20 minutes, with subsequent removal of excess water by a pipette. Further drying of PCEs was performed by drying and blotting onto a paper towel. The PCEs device was inserted into the custom-made box connector for electrochemical analysis.
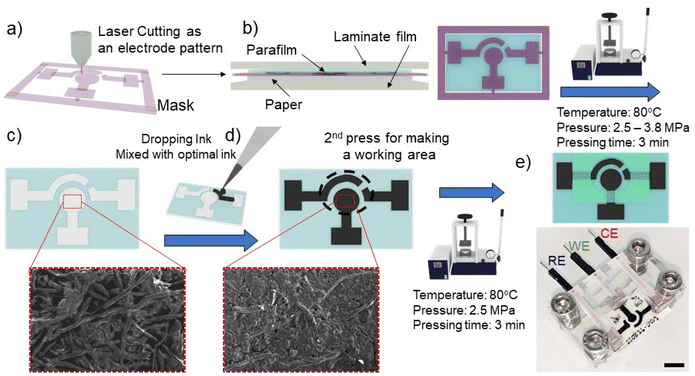 |
| | Fig. 1 Schematic diagram of the fabrication process with parafilm hot pressing for an electrochemical paper-based device with a three carbon-electrode system. (a) The patterning mask was cut with laser cutting. (b) Parafilm, patterning mask, and CHR paper were orderly stacked to create hydrophobic/hydrophilic patterns. (c) Parafilm was melted and pressed through a patterned laminate mask for making hydrophobic (blue colour) and hydrophilic (white colour) areas. (d) Optimal carbon conductive ink was added onto the hydrophilic area to create the carbon electrodes (counter, working and reference). The pores of the paper matrix are filled with the ink as shown in SEM images. (e) Subsequently, the working area was defined by additional parafilm pressing. The PCEs were inserted into custom-made connectors to support the connection of working, reference, and counter electrodes with the potentiostat to perform the electrochemical assay. The scale bar represents 1 cm. | |
2.3. Electrochemical measurement
All electrochemical experiments were performed on a CHI660E potentiostat (CH Instruments, USA). Electrochemical properties of PCEs were investigated by cyclic voltammetric experiments of the [Fe(CN)6]3−/4− redox couple. The potential window of the working electrode was varied from −0.3 to 0.5 V with the designated scan rates (10–500 mV s−1) and electrolyte concentrations (1–25 mM of [Fe(CN)6]3−/4− redox couple electrolyte solution in PBS). For differential pulse voltammetry (DPV) experiments, the assay was performed by scanning from −0.3 to 0.5 V with a pulse width of 50 ms and an amplitude of 50 mV in 5 mM [Fe(CN)6]3−/4− redox couple solution in PBS.
2.4. Exosome sample preparation
The exosome sample was prepared following our previous studies.13,29,30 OVCAR3 and Met-5A cell lines were cultured with RPMI-1640 base media supplemented with 10% FBS and 1% PenStrep. Both cell lines (after reaching 70–80% confluence) were washed three times with HBSS to remove the waste and conditioned media before replacing the cultured cells with exosome-free media (RPMI-1640 consisting of 10% exosome-depleted FBS). The conditioned media was collected after a 60-hour incubation and was centrifuged at 2000g for 30 min to remove debris and dead cells. The exosome isolation kit was incubated with the exosome-conditioned media with the ratio of 1![[thin space (1/6-em)]](https://www.rsc.org/images/entities/char_2009.gif) :2 by volume to precipitate the exosomes as suggested by manufacturer protocol. After overnight incubation, the mixture was centrifuged at 10000g for 1 hour. Then, the exosome pellet was acquired by discarding the supernatant. The pellet was resuspended in PBS and kept at −80 °C for further use.
:2 by volume to precipitate the exosomes as suggested by manufacturer protocol. After overnight incubation, the mixture was centrifuged at 10000g for 1 hour. Then, the exosome pellet was acquired by discarding the supernatant. The pellet was resuspended in PBS and kept at −80 °C for further use.
2.5. Exosome quantification using nanoparticle tracking analyser (NTA)
The purified exosomes (from OVCAR3 and Met-5A cell lines) were quantified using nanoparticle tracking analysis (NanoSight NS300, Malvern, UK). The isolated exosome samples were diluted with filtered PBS and loaded by syringe pumps into the sample chamber. The NTA software tracks micro- to nanoscale particles moving under Brownian motion and employs the Stokes–Einstein equation to calculate particle size, determining the concentration and size distribution of the particles.
2.6. Assay preparation and exosome detection
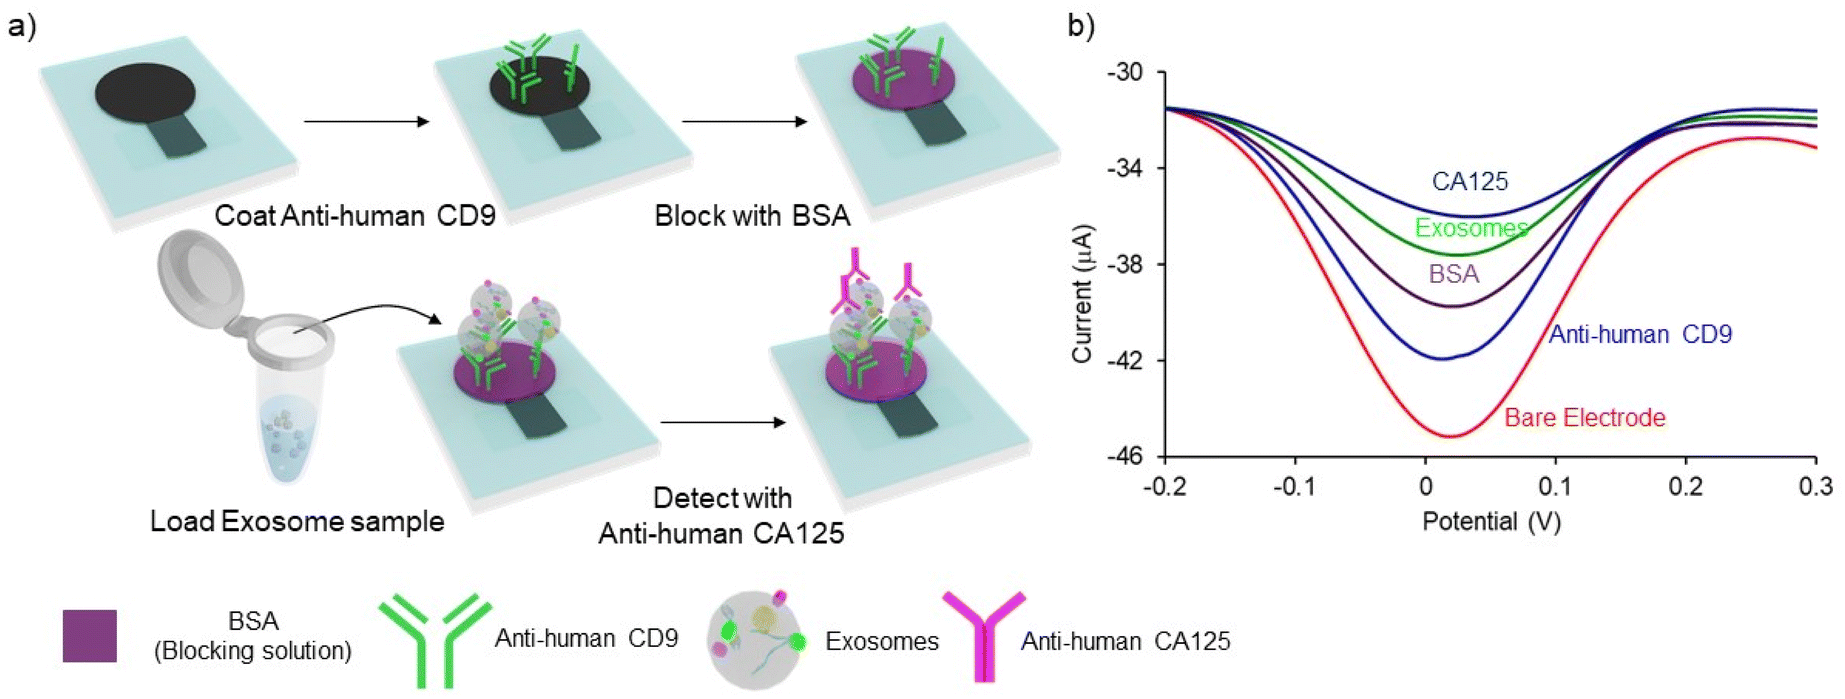
The sandwich immune assay on PCEs for detecting exosomes is schematically depicted in Fig. 2. The assay protocol is slightly modified and optimized from our previous studies.13,29 The working electrode of the PCEs was incubated with 5 μL of 0.1 mg mL−1 of Anti-human CD9 for 20 min and the device was dried at 37 °C for 20 min. To prevent non-specific adsorption, 5 μL of 2% BSA was subsequently incubated for 20 min, and the device was dried at 37 °C for 20 min 5 μL of exosome sample was added and incubated for 30 min to allow the direct capture of surface immobilized/functionalized CD9 antibodies. Subsequently, 5 μL of 50 μg mL−1 of ovarian cancer-specific anti-CA125 antibody was loaded onto the sensing layer to bind with the exosome membrane. Electrochemical analysis was performed by placing PCEs in custom-made box connectors and linking the connector with a potentiostat. DPV signal was obtained by adding 50 μL of 5 mM K3Fe(CN)6 and 5 mM K4Fe(CN)6 solution to cover all electrodes in the working area. In each step, the electrodes were washed three times with PBS by pipetting over the working area, and excessive PBS was absorbed by placing a paper towel under the PCEs. The relative change of current (%I) was obtained using the following relationships:| | | %ICD9 = (IBare − ICD9)/IBare × 100 | (1) |
| | | %IBSA = (ICD9 − IBSA)/ICD9 × 100 | (2) |
| | | %IExo = (IBSA − IExosome)/IBSA × 100 | (3) |
| | | %ICA125 = (IExosome − ICA125)/IExosome × 100 | (4) |
where %ICD9, %IBSA, %IExo, and %ICA125 are percentage current changes after incubating CD9, blocking with BSA, loading exosomes, and adding CA125, respectively. IBare, ICD9, IBSA, IExosome, and ICA125 are peak current for the [Fe(CN)6]3−/4− redox couple at bare, anti-CD9/bare, BSA/anti-CD9/bare, and anti-CA125/exosomes/anti-CD9/bare electrodes, respectively.
 |
| | Fig. 2 Schematic diagram of the sandwich immunological assay for cancer cell-derived exosomes detection. (a) The exosomes were extracted from the cell culture media and spiked in PBS buffer. CD9 antibodies were immobilized on PCEs by protein adsorption on the paper matrix. Total exosome populations were captured via their immune interaction with surface-bound CD9 antibodies. Ovarian cancer cell-derived exosomes were sub-populated by using CA-125 antibodies. (b) DPV signal depicting the stepwise attachment of each layer on the PCEs surface. | |
3. Results and discussion
3.1. Paper-based carbon electrodes for electrochemical assay fabrication
PCEs acquire three electrically isolated electrodes with minimal resistive characteristics to be used in electrochemical-based biosensors. The fabrication of electrochemical PCEs devices consists of a two-step strategy which includes (i) hydrophobic patterning and (ii) electrode painting. For hydrophobic patterning, the paper matrix was filled with parafilm to define a boundary for creating the electrode area. Subsequently, conductive ink was manually dropped onto the hydrophilic area to make the designated geometric area of the working electrode (Fig. 1). In addition to the requirement of using low resistant conducting ink, the uniformity of conductive ink dispersal onto the paper substrate is also important to achieve reproducible electrochemical responses. Conductive ink with adequate viscosity can disperse throughout the paper substrate. However, highly viscous ink cannot adequately penetrate the paper matrix.31 This leads to the deposition of more ink on the surface of the substrate. The ink with high viscosity can be washed away more easily during the washing/cleaning step of the sensor fabrication. In our case, the optimal electrochemical response with the relative standard deviation (%RSD) of around 15% was achieved with the dilution ratio of 1:1. Hence, this ratio was the optimal composition for fabricating PCEs devices for all subsequent electrochemical experiments.
3.2. Electrochemical characterization
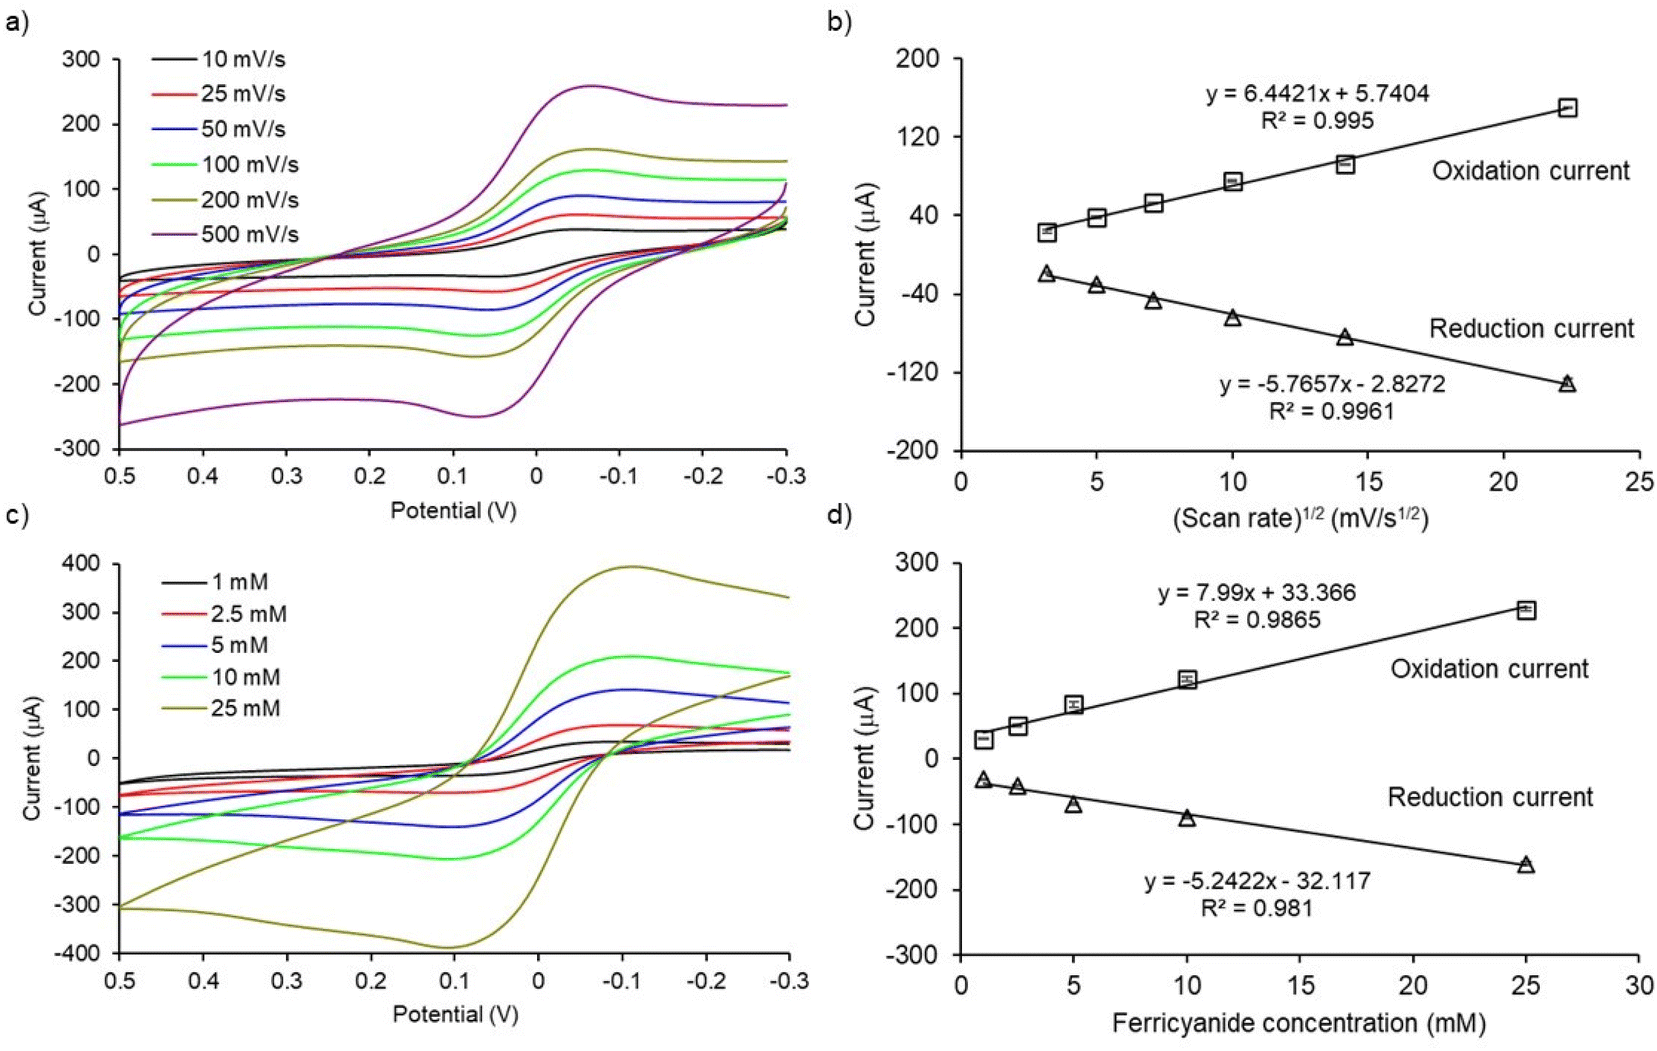
To check the electrochemical performance of PCEs, cyclic voltammograms of [Fe(CN)6]3−/4− redox system at designated scan rates and analyte concentrations were studied. As shown in Fig. 3a, the magnitude of the peak currents (ipa and ipc, ipa = oxidation peak current and ipc = reduction peak current) and peak separation (ΔE = |Epa − Epc|, where Epa = oxidation potential and Epc = reduction potential) increased with increasing the scan rate from 10 to 500 mV s−1. The magnitude of the peak current increases linearly with the square root of the scan rate (R2 values were 0.9950 and 0.9961 for oxidation and reduction processes, respectively; Fig. 3b). These results indicate that the electron-transfer process at PCEs is diffusion-controlled. Moreover, the magnitude of oxidation and reduction peak currents also increase with increasing concentrations of [Fe(CN)6]3−/4− redox system from 1 to 25 mM in PBS (Fig. 3c). The peak currents increased linearly with the analyte concentration (R2 values were 0.9865 and 0.9810 for oxidation and reduction processes, respectively; Fig. 3d). In conclusion, cyclic voltammetric studies of PCEs demonstrated quasi-reversible, diffusion-controlled electron transfer kinetics for the [Fe(CN)6]3−/4− redox system. These results are in-line with the other studies.21,22
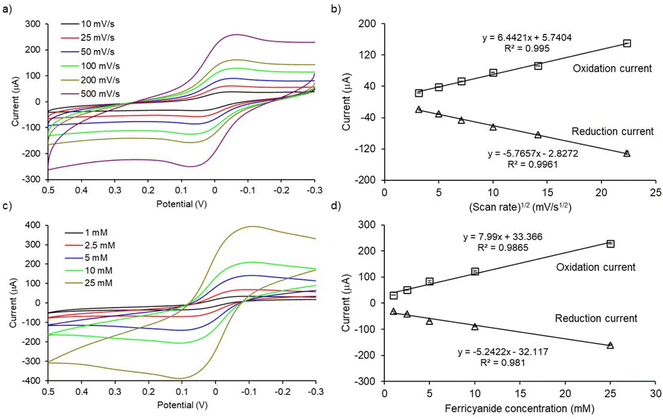 |
| | Fig. 3 Cyclic voltammetry for electrochemical characterization of PCEs (a) CV of 5 mM [Fe(CN)6]3−/4− electrolyte solution in PBS performed at various scan rates, (b) linear correlation between square root of scan rates with oxidation and reduction peak currents, (c) CV of different concentrations of [Fe(CN)6]3−/4− electrolyte solution in PBS at scan rate of 100 mV s−1, (d) Linear correlation between ferricyanide concentrations with oxidation and reduction peak currents. All CV results presented in (a) and (c) are subtracted with background which is PBS only. Error bars represent the standard deviations for three individual replicates. | |
3.3. Exosome detection assay
Fig. 2a illustrates the overall protocol for electrochemical detection of cancer cell-derived exosomes. Briefly, the exosome samples collected from cell lines were prepared in PBS. The PCEs were first coated with anti-CD9, a generic exosomal membrane antibody.32 The total exosome population within the sample consisting of normal, and cancer cell-derived exosomes was incubated on the anti-CD9-coated electrode surface. Ovarian cancer cell-derived exosomes from the samples were sub-populated by using CA-125 antibodies.33 Characterization of the subsequent surface blocking by the sequential attachment of the biomolecules was observed using DPV in the presence of a [Fe(CN)6]3−/4− redox system. The addition of subsequent biomolecular layers on the electrode surface results in the attenuation of the current in DPV (see ESI S1†), indicating the successful binding of biomolecules on PCEs (Fig. 2b). The detection system was further characterized using electrochemical impedance spectroscopy (EIS) measurement (see ESI S2†). The charge transfer resistance (Rct) at the electrode surface increased with the increasing biomolecule layers, determining the successful stepwise binding of coating antibodies, exosomes and detecting antibodies on the electrode surface (Fig. S2†).
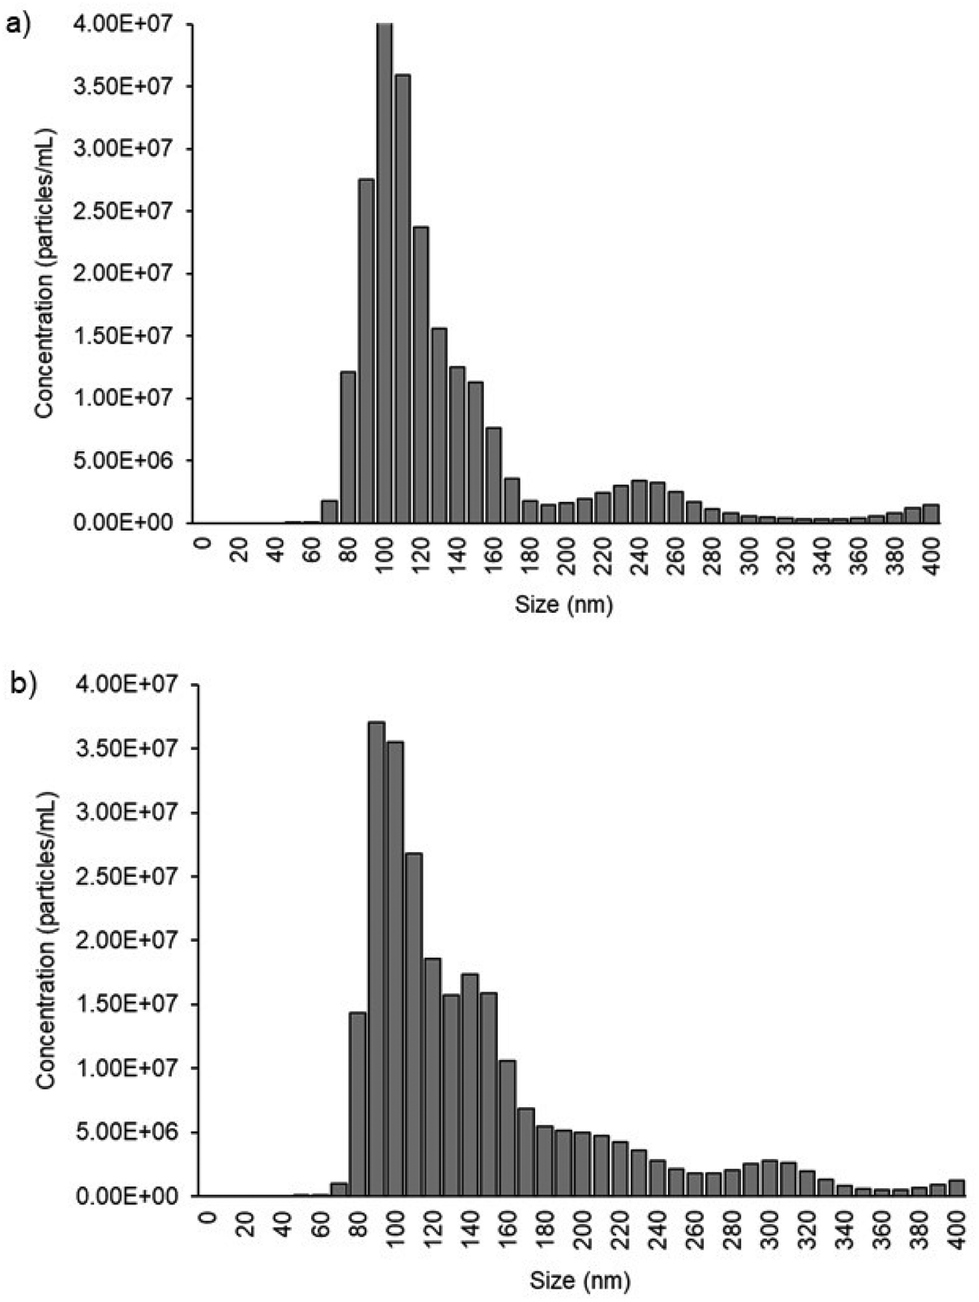
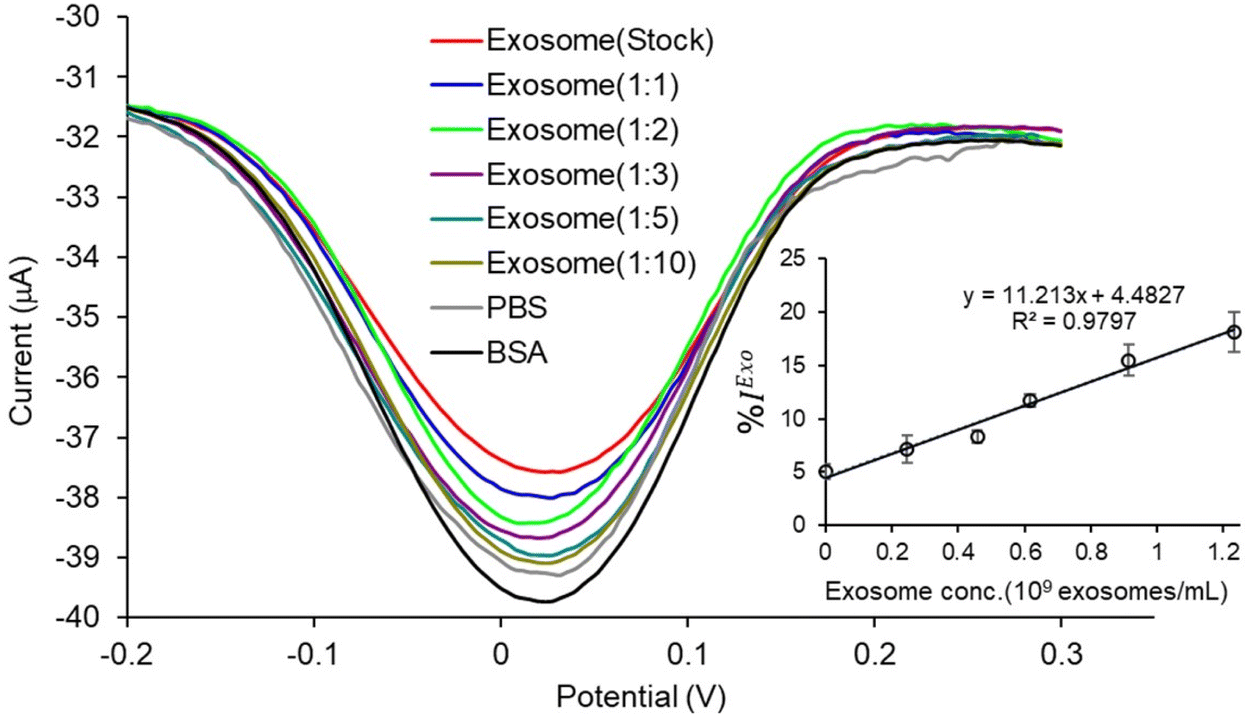
We used cell culture samples extracted from CA125(+) OVCAR3 ovarian cancer cell lines and CA125(−) Met-5A epithelial cell lines to demonstrate exosome detection. Exosome concentration and size distribution were quantified by Nanosight NS300 analysis. In Fig. 4, the most particles that were more than 80% of the whole population from the prepared samples were among the range of typical exosome size, which is 50–180 nm. The concentration of exosomes in OVCAR3 and Met-5A cell-derived exosome samples was estimated to be 2.47 × 10⁹ and 9.15 × 10⁸ exosomes per mL, respectively. The OVCAR3 cell-derived exosome sample was used to prepare a designated concentration of exosomes (2.47 × 10⁸ to 2.47 × 10⁹ exosomes per mL) via spiking in PBS. For electrochemical detection, 5 μL of exosome samples were seized on the anti-CD9 coated PCEs. We observed an increasing relative change of DPV signal after loading exosomes (%IExo). The peak current decreases with increasing concentration of exosomes, resulting from blocking the electron transfer process of [Fe(CN)6]3−/4− redox couple via the increased concentration of non-conducting biomolecules attached at the sensing electrode/solution interface (Fig. 5). The relative standard deviation (%RSD) of DPV results shows the reproducibility of <10% for the sample (n = 3). The linear equation for DPV current change %IExo was fitted to be y = 11.21x + 4.483 (R2 = 0.9797) with exosome concentrations from 2.47 × 10⁸ to 1.23 × 10⁹ exosomes per mL (inset of Fig. 5). The limit of detection (LOD) was estimated by the linear equation. Briefly, the LOD concentration was determined by three times of standard deviation of blank samples divided by the slope of the equation. The LOD of our method was estimated to be 9.3 × 10⁷ exosomes per mL. The LOD assessed by this study is comparable to commercial screen-printed carbon electrodes (LOD is ∼108–109 exosomes per mL for breast cancer-derived exosomes)13 and lateral flow immunological assays (LOD is ∼108–109 exosomes per mL).34
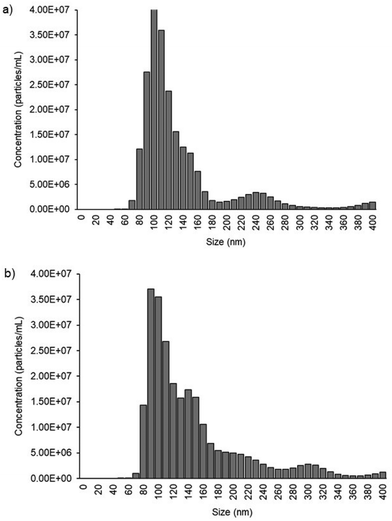 |
| | Fig. 4 Exosome quantification by NTA. (a) Exosome distribution derived from CA125(+) OVCAR3. The total concentration of exosomes present in the 1:4 diluted sample is 4.93 ± 0.16 × 10⁸ exosomes per mL. (b) Exosome distribution derived from CA125(−) Met-5a. The total concentration of exosomes presents in the 1:4 diluted sample is 1.83 ± 0.65 × 10⁸ exosomes per mL. | |
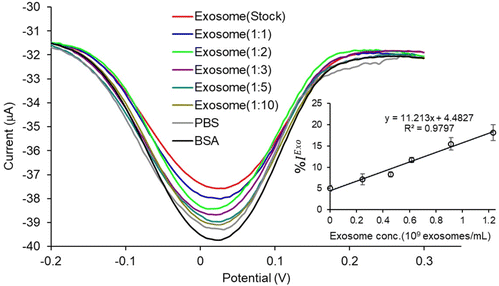 |
| | Fig. 5 Detection of total exosome concentrations on PCEs: DPV signal of current changes after adding exosomes obtained for OVCAR3 in PBS (1:10 to stock = 2.47 × 10⁸ to 2.47 × 10⁹ exosomes per mL). Inset shows the linear calibration plots between % current relative changes after loading different exosome concentrations (1:10 to stock = 2.47 × 10⁸ to 2.47 × 10⁹ exosomes per mL) compared to BSA obtained from the prior step. Error bars represent the standard deviations for three individual replicates. | |
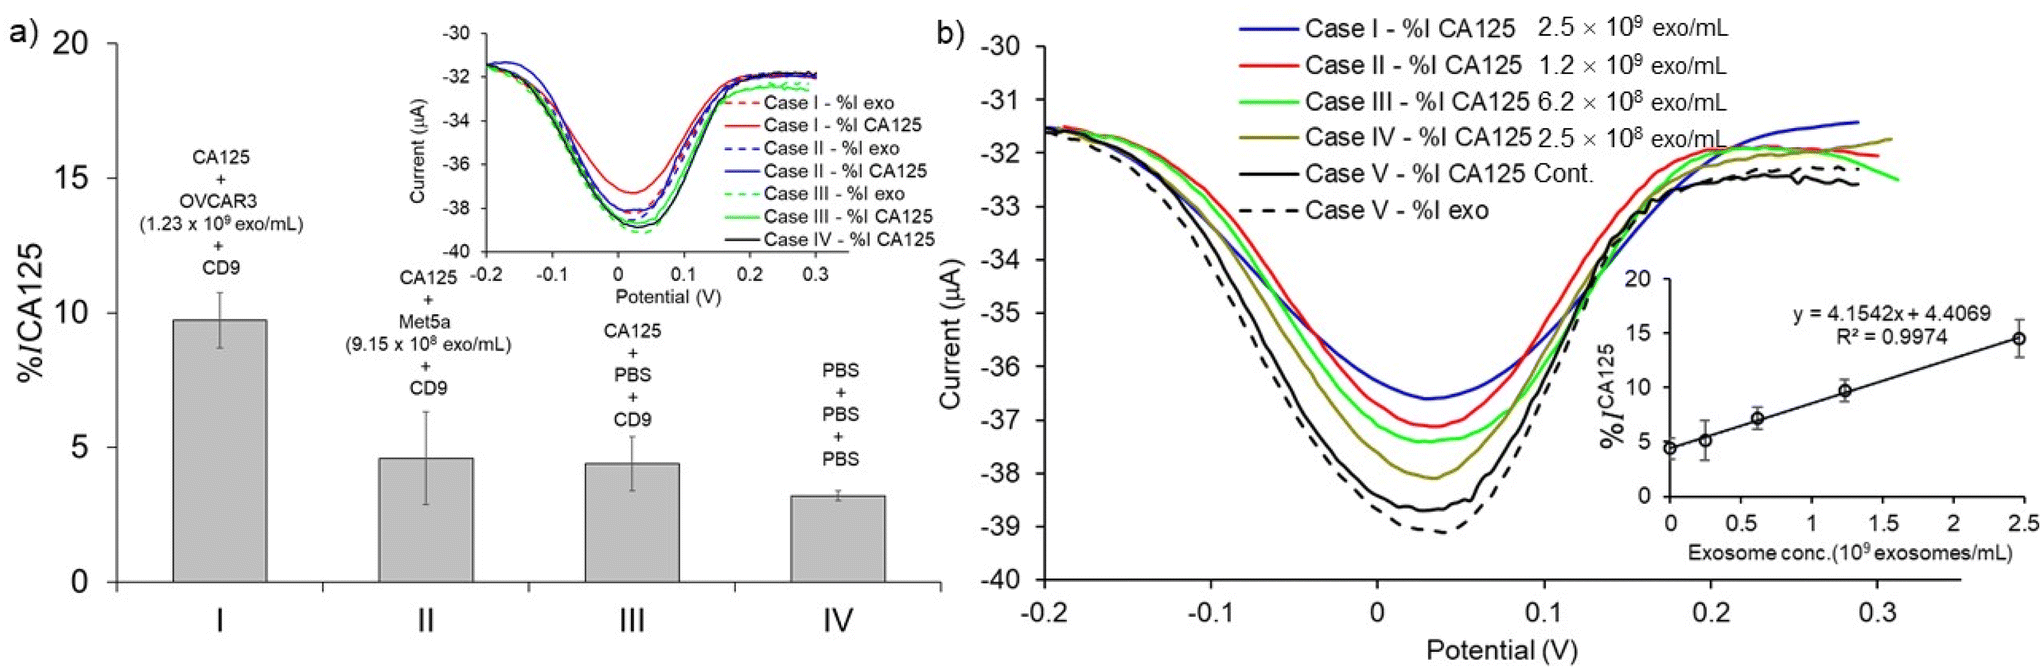
To validate the assay specificity and to evaluate the false positive DPV response resulting from non-specific adsorption,11 control experiments were performed using the following conditions: (1) the exosome target was extracted from the CA125(-) Met-5A sample (i.e., NTA analysis results showed that the concentration of exosomes in these samples was 9.15 × 10⁸ exosomes per mL). (2) the exosome target was replaced with PBS. (3) PBS was used in all steps of the assay fabrication. When the CA125(+) OVCAR3 exosomes were replaced with CA125(−) Met-5A exosomes, the DPV current change %ICA125 was reduced by 4.60% (Fig. 6a (II)). In the second control experiment, when the exosome target was replaced with PBS (i.e., the absence of exosomes), the DPV current change %ICA125 was attenuated by 4.40% (Fig. 6a (III)). The changes in the faradaic current for both these control experiments are almost identical (Fig. 6a (II)versus6a (III)) and almost 2-fold lower than that of the CA125(+) OVCAR3 cell-derived exosomes, indicating that the assay is suitable for discriminating between CA125(+) OVCAR3 and CA125(−) Met-5A cell-derived exosomes (Fig. 6a (I)versus6a (II)). PBS was used in all incubation steps instead of using antibodies and exosomes in the third control experiment. The DPV current change decreased by 3.21% (Fig. 6a (IV)). The data shown in Fig. 6a (II), (III), and (IV) indicates that our assay is affected by the nonspecific adsorption of biomolecules. These results are in-line with the other paper-based electrochemical devices.13,16–18 It is worth noting that in addition to nonspecific adsorption, after incubation with PBS sample following with subsequent washing, the DPV response of the PCEs device also decreases the relative peak current in the same range from 3–5% shown in Fig. 6a (IV), Fig. 6b, and Fig. S1.† This may be attributed to the diminishing and deteriorating surface area of the PCEs. Thus, the background signal from nonspecific adsorption and PBS incubation, as well as subsequent washing, are included as relative current change calculated on the same device.
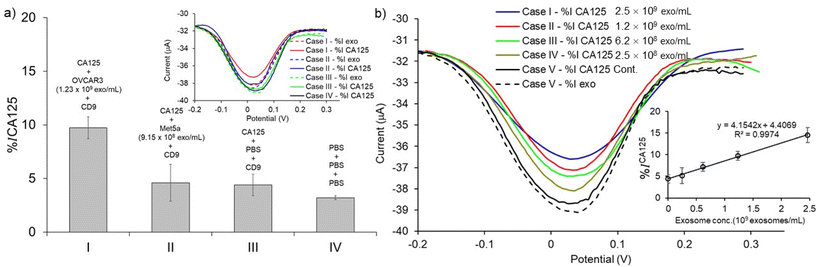 |
| | Fig. 6 Assay specificity and sensitivity. (a) The bar graph of average value of % current relative changes after loading anti-CA125 measured for the detection of exosomes derived from (I) CA125(+) OVCAR3, (II) CA125(−) Met-5A, (III) PBS (in the absence of exosomes) (IV) control experiment which the assay was treated with PBS in all steps (in the absence of CD9 and CA125). Inset presents the DPV signal of current changes after adding anti-CA125 (bold lines) and samples (dash lines). (b) DPV signal of current relative changes after loading anti-CA125 obtained for the detection of exosome derived from CA125(+) OVCAR3 spiked in PBS (1:10 to stock = 2.47 × 10⁸ to 2.47 × 10⁹ exosomes per mL). Inset represents the linear relationship of average value of the % current relative changes after adding anti-CA125 responding to exosome concentrations. Each data represents the average of three devices (n = 3) and the error bars represent the standard deviation for three individual replicates. | |
We performed a serial dilution of CA125(+) OVCAR3 exosomes in PBS to prepare the designated concentration of exosomes (2.47 × 10⁸ to 2.47 × 10⁹ exosomes per mL) via spiking in PBS (2.47 × 10⁹ to 2.47 × 10⁸ exosomes per mL) to investigate the sensitivity of the assay for detecting ovarian cancer-cell derived exosomes in bulk exosome populations. The exosome samples were captured by CD9 antibodies and sub-populated by CA125 antibodies. An increase in DPV current change (%ICA125) with increasing concentration of CA125(+) OVCAR3-derived exosomes was observed. The current changes for 2.47 × 10⁸ to 2.47 × 10⁹ exosomes per mL were linearly fitted to be y = 4.154 + 4.407 (R2 = 0.9974) (inset of Fig. 6b). The detection limit was calculated by the linear equation as described above. The LOD of CA125(+) OVCAR3-derived exosomes was estimated to be 7.1 × 10⁸ exosomes per mL. The LOD is comparable to the conventional screen-printed carbon electrode (LOD is ∼108–109 exosomes per mL for breast cancer-derived exosomes).13
3.4. Translational potential of our low-cost electrochemical device
We believe that the 3-carbon electrode system on our paper-based device offers many advantages compared to conventional electrochemical paper-based devices/assays. The hot-pressing method allows rapid and straightforward substrate fabrication, requiring only 10 minutes of pressing time. The assay fabrication was completed after an additional 2 hours, which included the addition of the carbon electrodes to the substrate (via drop casting with ink) and washing and drying steps to remove excess carbon. This paper-based device fabrication could circumvent additional steps as all electrodes are carbon electrodes. Avoiding using silver/silver chloride keeps the cost of fabrication and devices minimum. Our assay only required a 1-hour incubation time, and it produced an electrochemical response within 10 minutes (inclusive of post-incubation, washing, and electrolyte addition steps). Additionally, our assay required a relatively small sample volume of 5 μL due to the small working electrode area. In contrast, ELISA takes up to 100 μL of sample and usually takes a longer time to yield a result. The principle of the exosome detection method outlined in our assay is not limited to ovarian cell-derived exosomes, as the immunosensor could be altered to detect any protein-based biomarkers by simply replacing the detecting antibodies specific to the desired biomolecular targets. Our device's total exosome detection limit (9.3 × 10⁷ exosomes per mL) lies within the range of exosomes present in human plasma and serum, varying from 108 to 1010 exosomes per mL depending on isolation methods.35–37 In addition, our detection protocol does not require any tedious surface modification, and the entire substrate is disposable, as well as being ultra-low-cost (PCEs <0.05 USD per device).
4. Conclusion
We have developed a simple, disposable, low-cost paper-based (three-carbon electrode) electrochemical device for the detection of cancer cell-derived exosomes (CA125(+) OVCAR3) from a total exosome population. We have demonstrated that our method specifically detects approximately 108 exosomes per mL from isolated samples. We expect this method to be an alternative approach for exosome quantification with the potential to be further developed for point-of-care diagnostics. Our assay could interest other researchers working in protein marker detection.
Conflicts of interest
There are no conflicts to declare.
Acknowledgements
The authors acknowledge the support of the Australian Research Council (DP180100055) and higher degree research scholarships GUIPRS and GUPRS Scholarships to S. K. from Griffith University.
References
- K. Boriachek, M. N. Islam, A. Möller, C. Salomon, N.-T. Nguyen, M. S. A. Hossain, Y. Yamauchi and M. J. A. Shiddiky, Small, 2018, 14, 1702153 CrossRef PubMed.
- R. A. Dragovic, C. Gardiner, A. S. Brooks, D. S. Tannetta, D. J. P. Ferguson, P. Hole, B. Carr, C. W. G. Redman, A. L. Harris, P. J. Dobson, P. Harrison and I. L. Sargent, Nanomedicine, 2011, 7, 780–788 CrossRef CAS PubMed.
- C. Y. Soo, Y. Song, Y. Zheng, E. C. Campbell, A. C. Riches, F. Gunn-Moore and S. J. Powis, Immunology, 2012, 136, 192–197 CrossRef CAS PubMed.
- L. K. Chin, T. Son, J.-S. Hong, A.-Q. Liu, J. Skog, C. M. Castro, R. Weissleder, H. Lee and H. Im, ACS Nano, 2020, 14, 14528–14548 CrossRef PubMed.
- U. Erdbrügger and J. Lannigan, Cytometry, Part A, 2016, 89, 123–134 CrossRef PubMed.
- R. Lacroix, S. Robert, P. Poncelet and F. Dignat-George, Semin. Thromb. Hemostasis, 2010, 36, 807–818 CrossRef PubMed.
- S. Khan, H. F. Bennit, D. Turay, M. Perez, S. Mirshahidi, Y. Yuan and N. R. Wall, BMC Cancer, 2014, 14, 176 CrossRef PubMed.
- M. Logozzi, A. De Milito, L. Lugini, M. Borghi, L. Calabrò, M. Spada, M. Perdicchio, M. L. Marino, C. Federici, E. Iessi, D. Brambilla, G. Venturi, F. Lozupone, M. Santinami, V. Huber, M. Maio, L. Rivoltini and S. Fais, PLoS One, 2009, 4, e5219 CrossRef PubMed.
- J. Mettakoonpitak, K. Boehle, S. Nantaphol, P. Teengam, J. A. Adkins, M. Srisa-Art and C. S. Henry, Electroanalysis, 2016, 28, 1420–1436 CrossRef CAS.
- E. Noviana, C. P. McCord, K. M. Clark, I. Jang and C. S. Henry, Lab Chip, 2020, 20, 9–34 RSC.
- Y. S. Grewal, M. J. A. Shiddiky, L. J. Spadafora, G. A. Cangelosi and M. Trau, Biosens. Bioelectron., 2014, 55, 417–422 CrossRef CAS PubMed.
- K. M. Koo, A. A. I. Sina, L. G. Carrascosa, M. J. A. Shiddiky and M. Trau, Analyst, 2014, 139, 6178–6184 RSC.
- S. Yadav, K. Boriachek, M. N. Islam, R. Lobb, A. Möller, M. M. Hill, M. S. A. Hossain, N.-T. Nguyen and M. J. A. Shiddiky, ChemElectroChem, 2017, 4, 967–971 CrossRef CAS.
- W. Wang, S. Ding, Z. Wang, Q. Lv and Q. Zhang, Biosens. Bioelectron., 2021, 187, 113310 CrossRef CAS PubMed.
- Y. Guan and B. Sun, Microsyst. Nanoeng., 2020, 6, 14 CrossRef CAS PubMed.
- S. Boonkaew, I. Jang, E. Noviana, W. Siangproh, O. Chailapakul and C. S. Henry, Sens. Actuators, B, 2021, 330, 129336 CrossRef CAS.
- C. K. Tang, A. Vaze and J. F. Rusling, Anal. Methods, 2014, 6, 8878–8881 RSC.
- A. Yakoh, U. Pimpitak, S. Rengpipat, N. Hirankarn, O. Chailapakul and S. Chaiyo, Biosens. Bioelectron., 2021, 176, 112912 CrossRef CAS PubMed.
- C. Srisomwat, P. Teengam, N. Chuaypen, P. Tangkijvanich, T. Vilaivan and O. Chailapakul, Sens. Actuators, B, 2020, 316, 128077 CrossRef CAS.
- J. Lu, S. Ge, L. Ge, M. Yan and J. Yu, Electrochim. Acta, 2012, 80, 334–341 CrossRef CAS.
- M. C. C. G. Carneiro, F. T. C. Moreira, R. A. F. Dutra, R. Fernandes and M. G. F. Sales, Microchem. J., 2018, 138, 35–44 CrossRef CAS.
- W. T. Wahyuni, B. R. Putra, R. Heryanto, E. Rohaeti, D. H. Y. Yanto and A. Fauzi, Int. J. Electrochem. Sci., 2021, 16, 210221 CrossRef CAS.
- D. A. Bruzewicz, M. Reches and G. M. Whitesides, Anal. Chem., 2008, 80, 3387–3392 CrossRef CAS PubMed.
- X. Li, J. Tian, G. Garnier and W. Shen, Colloids Surf., B, 2010, 76, 564–570 CrossRef CAS PubMed.
- Y. Lu, W. Shi, L. Jiang, J. Qin and B. Lin, Electrophoresis, 2009, 30, 1497–1500 CrossRef CAS PubMed.
- A. K. Yetisen, M. S. Akram and C. R. Lowe, Lab Chip, 2013, 13, 2210–2251 RSC.
- S. Kasetsirikul, K. Clack, M. J. A. Shiddiky and N.-T. Nguyen, Micromachines, 2022, 13, 48 CrossRef PubMed.
-
E. M. Dunfield, Y. Y. Wu, T. P. Remcho, M. T. Koesdjojo and V. T. Remcho, Simple and rapid fabrication of paper microfluidic devices utilizing Parafilm®, https://blogs.rsc.org/chipsandtips/2012/04/10/simple-and-rapid-fabrication-of-paper-microfluidic-devices-utilizing-parafilm%C2%AE/?doing_wp_cron=1635550211.3899741172790527343750, (accessed 1-Dec-2021).
- K. Boriachek, M. N. Islam, V. Gopalan, A. K. Lam, N.-T. Nguyen and M. J. A. Shiddiky, Analyst, 2017, 142, 2211–2219 RSC.
- K. Boriachek, M. K. Masud, C. Palma, H.-P. Phan, Y. Yamauchi, M. S. A. Hossain, N. T. Nguyen, C. Salomon and M. J. A. Shiddiky, Anal. Chem., 2019, 91, 3827–3834 CrossRef CAS PubMed.
- J. R. Camargo, L. O. Orzari, D. A. G. Araújo, P. R. de Oliveira, C. Kalinke, D. P. Rocha, A. Luiz dos Santos, R. M. Takeuchi, R. A. A. Munoz, J. A. Bonacin and B. C. Janegitz, Microchem. J., 2021, 164, 105998 CrossRef CAS.
- Z. Andreu and M. Yáñez-Mó, Front. Immunol., 2014, 5, 442 Search PubMed.
- A. Cheruvanky, H. Zhou, T. Pisitkun, J. B. Kopp, M. A. Knepper, P. S. T. Yuen and R. A. Star, Am. J. Physiol.: Renal Physiol., 2007, 292, F1657–F1661 CrossRef CAS PubMed.
- M. Oliveira-Rodríguez, S. López-Cobo, H. T. Reyburn, A. Costa-García, S. López-Martín, M. Yáñez-Mó, E. Cernuda-Morollón, A. Paschen, M. Valés-Gómez and M. C. Blanco-López, J. Extracell. Vesicles, 2016, 5, 31803–31803 CrossRef PubMed.
- K. Brennan, K. Martin, S. P. FitzGerald, J. O'Sullivan, Y. Wu, A. Blanco, C. Richardson and M. M. Mc Gee, Sci. Rep., 2020, 10, 1039 CrossRef CAS PubMed.
- M. R. Fernando, C. Jiang, G. D. Krzyzanowski and W. L. Ryan, PLoS One, 2017, 12, e0183915–e0183915 CrossRef PubMed.
- X. Huang, T. Yuan, M. Tschannen, Z. Sun, H. Jacob, M. Du, M. Liang, R. L. Dittmar, Y. Liu, M. Liang, M. Kohli, S. N. Thibodeau, L. Boardman and L. Wang, BMC Genomics, 2013, 14, 319 CrossRef CAS PubMed.
|
| This journal is © The Royal Society of Chemistry 2022 |
Click here to see how this site uses Cookies. View our privacy policy here. 
 ab,
Kim Thinh
Tran
c,
Kimberley
Clack
ac,
Narshone
Soda
ab,
Kim Thinh
Tran
c,
Kimberley
Clack
ac,
Narshone
Soda