Interfacial behaviour and quantitative analysis of hexadecyl phosphocholine drug at a polarized liquid/liquid interface
Benjamín Nahuel
Viada
ab,
Mónica Cristina
García
 cd and
Lidia Mabel
Yudi
 *ab
*ab
aUniversidad Nacional de Córdoba, Facultad de Ciencias Químicas, Departamento de Fisicoquímica, Córdoba, Argentina. E-mail: mjudi@fcq.unc.edu.ar; mabel.yudi@unc.edu.ar
bConsejo Nacional de Investigaciones Científicas y Técnicas, CONICET, Instituto de Investigaciones en Fisicoquímica de Córdoba, INFIQC, Córdoba, Argentina
cUniversidad Nacional de Córdoba. Facultad de Ciencias Químicas, Departamento de Ciencias Farmacéuticas, Córdoba, Argentina
dConsejo Nacional de Investigaciones Científicas y Técnicas, CONICET, Unidad de Investigación y Desarrollo en Tecnología Farmacéutica, UNITEFA, Córdoba, Argentina
First published on 3rd November 2021
Abstract
The interfacial behaviour of the amphiphilic drug hexadecyl phosphocholine (HePC, also called miltefosine) was analysed by cyclic voltammetry applied at the water/1,2-dichloroethane interface. HePC is the only oral drug currently approved for the treatment of visceral, mucosal and cutaneous leishmaniasis. Because of its amphiphilic character, it can interact with biological membranes, solubilizing their compounds and leading to cell disruption. These interactions are responsible for its side effects and toxicity; therefore, HePC quantification in biological fluids and pharmaceutical preparations is extremely important. However, the lack of a chromophore in its structure prevents its spectroscopic determination. For this reason, the main challenge of this work was to propose an electroanalytical method for the quantification of this drug, which constitutes a simpler alternative than liquid chromatography-tandem mass spectrometry already reported. With this aim, in the first part of this work, the mechanism of the electrochemical process occurring after polarizing the interface was studied. By varying the experimental conditions, it was possible to determine that in a first step, at open circuit or at low potential values, HePC spontaneously adsorbed to the interface. Later, as the potential increased, the transfer of the anions present in the organic phase towards the aqueous side of the interface, where the HePC polar head groups were present, occurred thus forming adsorbed “ion pairs” and producing an increase in positive current. Subsequently, in the negative sweep, the “ion pairs” dissociated and desorbed giving rise to a negative peak. In this way, both negative and positive currents were considered useful for quantitative purposes. In the second part of this work, an appropriate experimental procedure was designed and proposed as a quantitative methodology for the HePC determination, which consisted of cleaning the interface and controlling the time at open circuit, followed by the voltammetric analysis. A linear response of both, positive or negative, peak currents with drug concentration was obtained within an acceptable range, providing a simple solution for the HePC quantification problem. Future studies will be carried out to evaluate the quantification and selectivity in real matrices containing polymer micelles working as HePC nanocarriers with the aim of avoiding the adverse effects of HePC when it is orally or intravenously administered.
1. Introduction
Amphiphilic compounds or surface-active agents (surfactants) are structurally characterized by possessing a polar head group (non-ionic, anionic, cationic or zwitterionic) and a hydrophobic portion. As a result, they tend to self-associate or aggregate in an aqueous environment. The spatial separation between the polar and non-polar moieties, as well as the molecular shape, and the hydrophilic–lipophilic balance determine their tendency to form different structures, such as micelles, monolayers, bilayers, hexagonal or cubic phases. Eventually, the self-association can be dependent on pH, temperature, ionic strength, and concentration.1Many pharmacologically active compounds are amphiphilic or hydrophobic molecules. Even if their target is intracellular, the knowledge of their interaction with simple membrane models is essential to understand how they behave. Amphiphilic drugs can interact with biological membranes, solubilizing membrane compounds (proteins and lipids) and leading to cell disruption.2 In most cases, these drugs follow the same principles as classical surfactants, and often these interactions are responsible for their side effects and toxicity.1
Among the different amphiphilic drugs, hexadecyl phosphocholine (HePC), also known as miltefosine, is the only oral drug currently registered for the treatment of visceral, mucosal and cutaneous leishmaniasis. In 2014, the Food and Drug Administration approved its use for infections caused by Leishmaniasis braziliensis, Leishmaniasis panamensis and Leishmaniasis guyanensis.3
HePC is an alkyl phosphocholine based on lysophosphatidylcholine analogues, lacking the glycerol backbone. The structure of HePC is shown in Scheme 1. As can be seen, this molecule is composed of two parts, a polar head group of phosphocholine, which contains a phosphate group and a quaternary ammonium group, giving a zwitterionic character, and a hydrophobic chain of 16 carbons. Given the amphiphilic character of this molecule, HePC can self-aggregate, forming micelles with an average critical micelle concentration (CMC) value equal to 10 μM.4 Although it is water-soluble, monomers are able to adsorb at the air–water interface forming a monolayer.5
HePC lacks any chromophores in its chemical structure, which makes ultraviolet or fluorescence detection very difficult. For that reason, some bioanalytical methods to quantify HePC in human matrices, based on liquid chromatography-tandem mass spectrometry, have been reported hitherto.6–8 Moreover, modified spectrophotometric assays to quantify quaternary ammonium compounds, such as HePC, by preparing colorimetric derivatives through the interaction with anionic ammonium ferrithiocyanate9 or bromothymol blue10 have been also described. Despite that, in some cases, the methodology to quantify the drug is not properly detailed,11 making more difficult to comprehensively understand the method used for its quantitative determination. Thus, the quantification of HePC in chemical samples is still a challenge.
Considering the aforementioned, electrochemical methods can offer a useful tool for HePC quantitative analysis. Electrochemistry at the interface between two immiscible electrolyte solutions (ITIES) is an analytical method based on the measurement of charge transfer across the interface. The voltammetric behaviour of biological macromolecules at the ITIES has been studied by different authors as a means to detection of such molecules and evaluation of their performance.12 Particularly, the behaviour of surfactants at the interface of two immiscible electrolyte solutions has been studied and characterised, by using voltammetric techniques and electrochemical impedance spectroscopy.13 Among surfactant molecules studied, special interest has been paid to the study of the adsorption of phospholipids and ion transfer across these monolayers;14–20 the phenomena of electrochemical instability caused by ionic surfactants;21–23 and the effect of surfactants on fusion of emulsion particles to the interface;24 as well as the transfer of cationic surfactants, employed as template species for the generation of mesoporous silica deposits.25–30
The aim of the present work was to study the electrochemical behaviour of HePC at the water/1,2-dichloroethane interface, in order to contribute to the knowledge of this drug from a new approach. The properties of the drug both in solution and at the surface were analysed and a methodology to quantify HePC was developed, obtaining a linear response of the current with respect to the drug concentration within an acceptable range. This work is the first part of a larger study involving the incorporation of HePC drug into nanocarriers such as polymer micelles with the aim to contribute to the development of improved pharmaceutical formulations for oral or intravenous administration, which may avoid its side effects. This future study will include the evaluation of HePC quantification and selectivity in those complex matrices.
2. Experimental
2.1 Materials and electrochemical cell
A four-electrode system employing a conventional glass cell of 0.17 cm2 interfacial area was used for the electrochemical measurements. The reference electrodes were Ag/AgCl and two platinum wires were used as counter electrodes. The reference electrode corresponding to the organic phase was immersed in an aqueous solution composed of 10.0 mM tetraphenylarsonium chloride (TPhAsCl) or 10.0 mM tetrapentylammoniun bromide (TPnABr, Sigma-Aldrich) and 10.0 mM KCl. All potential values (E) reported in this work are those which include or
or  for the transfer of TPnA+ or TPhAs+ respectively, depending on the experiment.
The base electrolyte solutions were 10.0 mM KCl (p.a. grade) in ultra-pure water and 10.0 mM tetrapentylammonium tetrakis (4-chlorophenyl) borate (TPnATClPhB) or 10.0 mM tetraphenylarsonium dicarbollycobaltate (TPhAsDCC) in 1,2-dichloroethane (1,2-DCE, Dorwill p.a.). TPnATClPhB and TPhAsDCC were prepared by metathesis of TPnABr and potassium tetrakis (4-chlorophenyl) borate (KTClPhB, Sigma-Aldrich p.a.) or tetraphenylarsonium chloride (TPhAsCl, Sigma-Aldrich p.a.) and sodium dicarbollylcobaltate (NaDCC, Strem Chemicals), respectively. The surfactant HePC was purchased from Avanti Polar Lipids® (Alabaster, USA) and employed without further purification. This drug was added to the aqueous phase in a concentration range from 0.01 mM to 0.80 mM. These values are equal to or higher than the CMC value.4 The pH was varied from 4.00 to 1.50 by addition of HCl (Merck p.a.). At these pH values, the drug was ionised in water, in its zwitterionic (not protonated phosphate group) or cationic form (with a protonated phosphate group).
In this way, the electrochemical cell employed was as follows:
| Ag(s) | AgCl(s) | 10.0 mM TPhAsCl or 10.0 mM TPnABr + 10 mM KCl (w′) | 10 mM TPnATCIPhB or TPhAsDCC (1,2-DCE) | 0.01–0.80 mM HePC + 10.0 mM KCl (w) | AgCl(s) | Ag(s) |
The potential values E reported in the voltammograms are the applied potentials between the two Ag | AgCl reference electrodes which are related to the Galvani potential difference (Δwoφ) across the interface by
| E = (Δwoφ) + ΔEref, |
2.2 Instruments
A four-electrode potentiostat with periodic current interruption for automatic elimination of solution resistance was used for CV experiments. The potential was changed from 0.150 V to 0.900 V with a waveform generator (Hi-Teck Instruments). Voltammograms were recorded employing a 10 bit computer board acquisition card connected to a personal computer. The voltammograms were obtained with typical errors of ±10% in current values.3. Results and discussion
3.1 Voltammetric behaviour of HePC
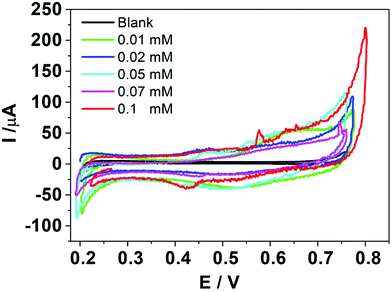
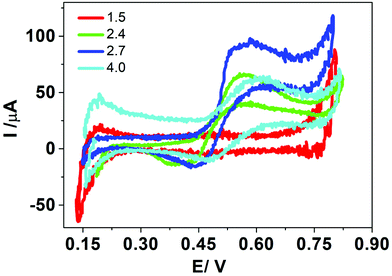
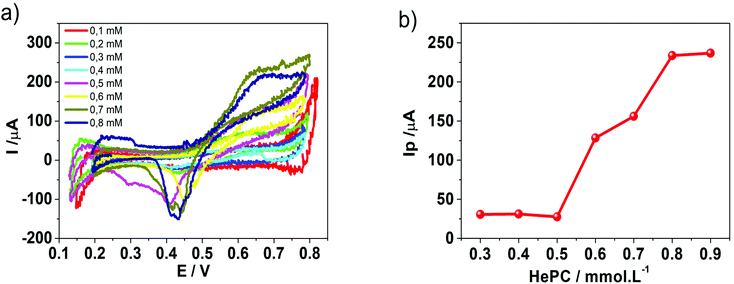
Fig. 1 shows the voltammetric response obtained when HePC was added to the aqueous phase at different concentrations. As can be seen, although there are positive and negative signals around E(+) = 0.65 V (positive scan) and E(−) = 0.55 V (negative scan), respectively, the current values at these potentials were quite low and did not have a clear dependence on the concentration. The electrical noise observed in the current signal is characteristic of systems involving surfactant molecules due to the electrochemical instability produced by these species adsorbed to the interface, as described by Kakiuchi's group.21–23 The positive and negative signals observed in Fig. 1 could be related to the presence of HePC in the aqueous phase, since they were not observed in its absence; however, this electrochemical response is not useful for analytical purposes. For this reason, different experimental parameters such as pH, organic electrolyte nature, scan rate, potential step previous to scan, and a more extended concentration range of HePC were evaluated in order to enhance the signal.The changes in the electrochemical signals depending on pH values can be explained considering the interfacial behaviour of HePC. This drug, as mentioned, is a surfactant so it spontaneously adsorbs at the liquid/liquid interface orienting the polar head groups towards the aqueous phase and the hydrocarbon chains to the organic phase. Under these conditions, the drug would form a monolayer or a film at the interface, whose stability will depend, on the one hand, on the side attractions of the hydrocarbon chains of neighbouring molecules, and on the other hand, on the interactions of the polar head groups. In this way, changes in both phases’ composition can generate variations in these interactions and consequently on the monolayer's compaction.31 So, if charge transfer through the interface occurs after HePC adsorption, the degree of compaction of the monolayer and its stability will have a direct effect on the transfer current.
Concerning the current peaks observed in Fig. 2, when the surfactant was present in the aqueous phase at pH values 2.4, 2.7 and 4.0, three different processes were plausible to occur during the positive scan: (a) transfer of adsorbed HePC molecules towards the aqueous or the organic phases, (b) transfer of another ion through the adsorbed HePC film, or (c) formation of an interfacial “ion pair” between the polar groups of adsorbed HePC molecules and one of the ions of the supporting electrolytes, involving the transfer of this ion. For any of the three cases, a lower faradaic current would be expected as the compaction and stability of the monolayer increase. The HePC polar head contains the phosphate group and the quaternary amine, similar to phosphatidylcholine. It has been reported that phosphatidylcholine remains as a zwitterion in a pH range between 3 and 12.32 Based on a similar structure of polar head groups, the same behaviour could be expected for HePC. Then, assuming that the zwitterion was the main form of HePC at pH 4.0, it can be postulated that the change from zwitterionic to cationic form of a fraction of HePC molecules could be the explanation of the increase in the current response when the pH changes from 4.0 to 2.7. However, as mentioned above, a successive decrease in pH (pH 2.4 and 1.5) leads to a decrease in peak current. This would be due to the fact that, under these conditions, the compaction of the monolayer is high as a result of non-electrostatic intermolecular interactions, such as hydrogen bonds between the phosphate groups in polar heads of neighbouring molecules, behaviour already reported.33 These interactions increase as the pH approaches the pKa value, further promoting monolayer stability.34 Higher compaction of the monolayer would result in a lower electrochemical signal (peak current) whatever the transfer mechanism (for any of the three cases a, b or c mentioned above). At pH equal to 1.5, the decrease in the current also could be explained considering a possible degradation of HePC at this extreme pH value.
Based on these results, all subsequent experiments were carried out at pH 2.7 for the aqueous phase.
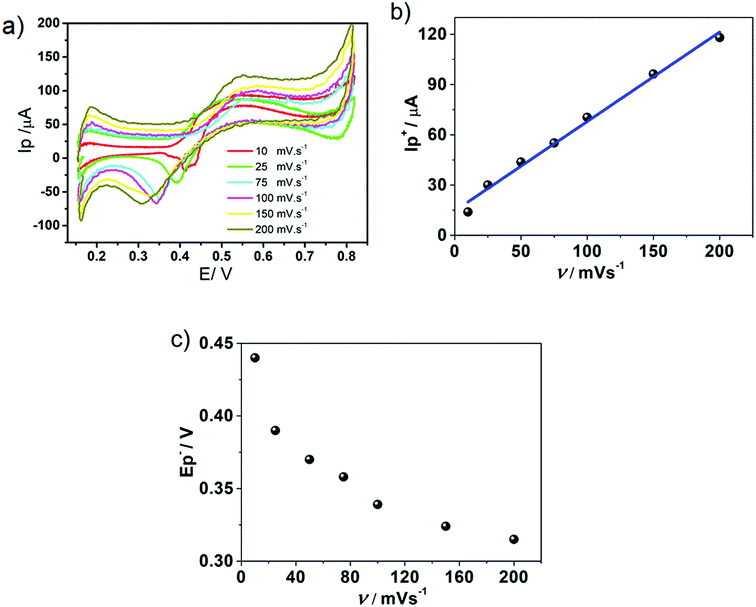
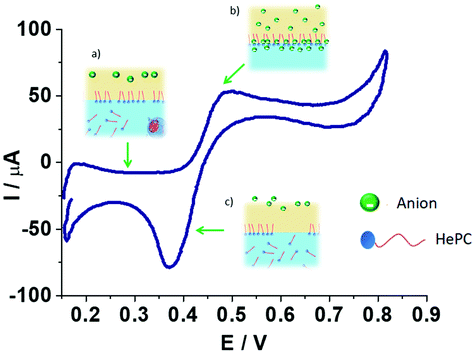
Concerning the positive peak, Fig. 3b shows a linear behaviour of positive peak current, I+p, with v. The same behaviour with v was obtained for the negative peak current, I−p, indicating that an adsorption process was involved previously to both, positive and negative, electrochemical transfer processes. Fig. 3c shows the variation of negative peak potential values, E−p, as a function of v. From the analysis of Fig. 3a–c, it can be postulated that a strong adsorption previous to the transfer processes occurred during the positive scan. Therefore, the desorption of HePC molecules and their subsequent transfer to any of the bulk phases, during the negative scan, required higher potentials as the scan rate increased, producing a shift in transfer potentials towards more negative values, demonstrating a kinetic control in the desorption and the subsequent transfer. In addition, under the condition of v = 0.010 V s−1, a second peak or shoulder was observed during the negative sweep (process that will be discussed later). Based on these results, the following interfacial processes are proposed: partially charged HePC molecules spontaneously adsorb at the interface and undergo interfacial rearrangement processes during the positive scan while the anions of the organic electrolyte (TClPhB−) diffuse from the organic phase to the interface and penetrate into the aqueous side of the interface, due to the presence of adsorbed HePC molecules which serve as a substrate for the anion association to the polar head groups of HePC, forming an adsorbed “ion pair”. These HePC interfacial rearrangement and ion pairing with TClPhB− processes could be responsible for the positive current during the positive sweep. During the reverse scan, this “ion pair” dissociates and HePC molecules are transferred or desorbed into the aqueous phase, while the TClPhB− anion is also transferred from the interface (aqueous side) to the organic phase, leading to a sharp negative desorption peak observed. In this way, the interfacial behaviour of HePC could be explained, as well as the effect of experimental conditions, such as pH and v, on the electrochemical response. Thus, changes in the aqueous phase composition modify the interactions between the neighbouring HePC molecules, and, consequently, changes in the compaction and stability of the film occur, modifying the charge transfer, which results in changes in the shape of the voltammograms. This mechanism involving an interfacial molecular film followed by the formation/desorption of an interfacial “ion pair” has been reported by several authors for monolayers of polyelectrolytes36–38 and proteins39–41 at liquid/liquid interfaces.
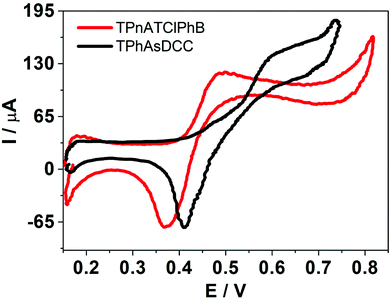
 and
and  . In this way, if the voltammetric current is associated with the adsorption/desorption of an interfacial “ion pair” between the organic electrolyte anion and HePC, as mentioned above, it would be expected that the presence of TClPhB− or DCC− in the organic phase leads to changes in the electrochemical response. As can be observed, there was a shift in both positive and negative peak potentials when TClPhB− was replaced by DCC− in the organic electrolyte: for DCC− the positive peak potential was 0.615 V while for TPhClB− it was 0.489 V. Similarly, there was a shift of the negative peak potential towards more positive values in the case of DCC− with respect to TPhClB−. As mentioned above, these changes may be due to different strength of the “ion pair” interactions between the positive charges in HePC head groups and the organic electrolyte anion. A similar behaviour has been reported for counter-ions binding to protamine polyions at a polarised liquid/liquid interface.42 From the analysis of the transfer potentials, the present results would indicate that the “ion pair” formed by the TPhClB− anion is more stable than that formed by DCC−, since the first one required higher negative potential for desorption. According to the literature, the stability of the “ion pair” decreases with the size of the anion, which is in agreement with our results since the DCC− anion is the most voluminous.43
3.2 Potential step (pulse) followed by negative linear sweep and effect of switching potential
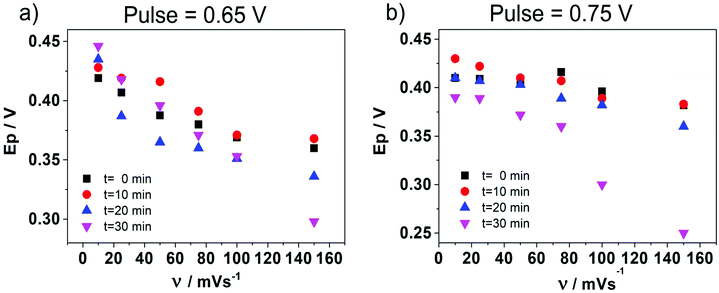
In order to deeply understand the adsorption process and its consequent effect on the I+pvs. concentration curve (Fig. 5b), potential step (pulse) experiments at E1 = 0.650 V and E2 = 0.750 V were performed, during different times prior to the application of a negative potential sweep. E1 and E2 were selected since the adsorption and formation of the [HePC-DCC] “ion pair” occurred at these potential values (Fig. 5a). Fig. 6a and b show the variation of the negative peak potential (E−p) as a function of the scan rate (v), obtained from the voltammetric negative sweep after applying a potential pulse at E1 = 0.650 V or E2 = 0.750 V, respectively, during different times. In all cases, HePC was added to the aqueous phase in a concentration equal to 0.7 mM. As can be seen, a general E−p shift towards more negative values occurred as the reverse scan rate increased, similar behaviour to that shown in Fig. 3a. This effect became more evident when the pulse time increased (higher negative slope), which suggests the presence of attractive interactions between the adsorbed [HePC-DCC] “ion pairs”. That is, as the pulse time increased, the amount of adsorbed HePC molecules and the formation of [HePC-DCC] “ion pairs” at the interface increased, and the film became more strongly adsorbed, requiring increasingly higher negative potentials (higher energy) for its desorption, which necessarily was a consequence of attractive interactions between neighbouring molecules. This shift is characteristic of quasi-reversible adsorption/desorption processes, supporting the hypothesis stated before.Considering these results, cyclic voltammetry experiments at different switching potentials, Eλ, were carried out. Since the increase in switching potential enhances the amount of HePC molecules adsorbed and the formation of [HePC-DCC] “ion pairs” at the interface, then a shift towards more negative desorption peak potentials (E−p) is expected if the interactions between neighbouring adsorbed species are attractive. Fig. 7 shows the voltammetric profiles obtained at different Eλ, recorded at a slow sweep rate (v = 0.010 V s−1). As can be observed, when Eλ increased, E−p shifted towards more negative values. This result reinforces the hypothesis of positive interactions between adsorbed species. At low scan rates and high Eλ values, the interfacial accumulation of HePC and DCC− at the interface was important and neutralization of HePC molecules with DCC− ions occurred. In this way, the [HePC-DCC] “ion pair” was adsorbed to both sides of the interface, with the polar heads of HePC oriented towards the aqueous phase and their hydrophobic chains towards the organic one. Then, the stability of this “ion pair” would increase at higher Eλ values, thus requiring a higher energy for desorption of HePC towards the aqueous phase or DCC− towards the organic phase, leading to the observed changes in E−p. Furthermore, for Eλ = 0.700 V and Eλ = 0.750 V, a second peak (p2) appeared in the negative sweep, along with a decrease in the current of the first peak (p1). This p2 was not noticeable at higher sweep rates. As mentioned above, from the observation of the voltammogram measured at v = 10 mV s−1 in Fig. 3a, two negative current peaks were distinguished. As observed in Fig. 7, the first peak was favoured at lower Eλ, while the second one at higher Eλ, where the interfacial coating was greater and the monolayer more stable. The potential shift was more significant for the second process since in this case, the peak potentials for Eλ = 0.700 V and Eλ = 0.750 V were Ep2 = 0.350 V and Ep2 = 0.290 V, respectively. Under the same conditions, potential values for p1 were equal to Ep1 = 0.400 V and Ep1 = 0.370 V for Eλ = 0.700 V and Eλ = 0.750 V, respectively. That is, for the second process (p2)  while for the first one (p1) it was equal to ΔEp1 = 0.030 V.
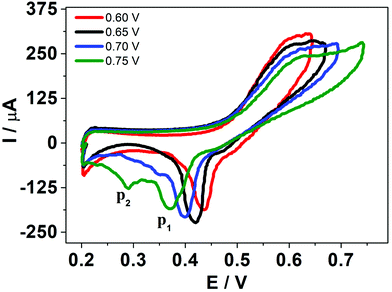 | ||
| Fig. 7 HePC voltammograms at different switching potential. Aqueous phase composition: 0.7 mM HePC + 10.0 mM KCl, pH = 2.7. Organic phase composition: 10.0 mM TPhAsDCC. v = 0.050 V s−1. | ||
A possible hypothesis to explain the appearance of this second peak (p2) for high Eλ values and low scan rates is the following: as the potential advances during the positive scan, the interfacial “ion pairs” undergo rearrangements, generating domains with different conformation and different degrees of stabilization. The two peaks observed in the negative scan then correspond to desorption of the adsorbed species with different interfacial conformation and stability.
After analysing the voltammetric responses obtained under different experimental conditions (pH, composition of organic electrolyte, concentration of HePC, scan rate, switching potential and application of potential pulses at different times), we can postulate a transfer mechanism involving a spontaneous HePC adsorption followed by the electrochemical step according to:
HePC(w) ⇌ HePC(ads) Step 1
HePC(ads) + DCC(o)− ⇌ [HePC-DCC](ads) Step 2 (direct EQ)
[HePC-DCC](ads) ⇌ HePC(w) + DCC(o)− Step 3 (reverse EQ)
Step 1 occurs at open circuit, before starting the potential sweep, due to the amphiphilic nature of HePC. This step is highly dependent on the time elapsed from both phases are brought into contact until the potential sweep begins. As potential increases during the sweep, the electrochemical step (EQ) of DCC− anion penetration into the polar head group of HePC (orientated towards the aqueous side of the interface) occurs to form the [HePC-DCC] “ion pair” adsorbed to the interface (step 2). This process gives rise to a positive current. As the potential moves towards more positive values, this film reorders and stabilizes.
By switching the scan towards more negative potentials, the interfacial “ion pair” dissociates, causing the electrochemical transfer (EQ) of some HePC molecules to the aqueous phase and DCC− ions to the organic phase, giving rise to the negative peak of desorption during the negative scan (step 3).
3.3 Concentration range for HePC quantification
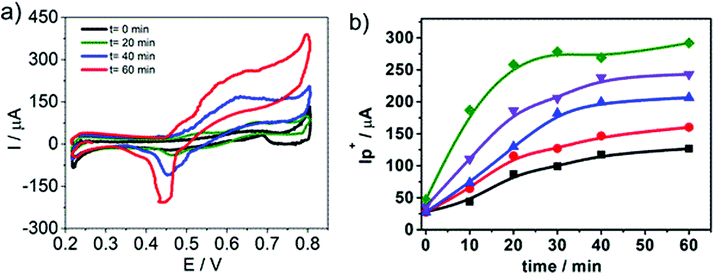
In order to propose cyclic voltammetry as a useful technique for quantitative determination of HePC in aqueous solutions, the effort was focused on improving the linear range between the peak current and the HePC concentration shown in Fig. 5b. Taking into account the behaviour of HePC at the water/1,2-DCE interface and the reaction scheme proposed in the previous section, the effect of the time elapsed at open circuit previous to the application of the potential sweep arises as an important point to be analysed. In this way, an experimental procedure was designed, which included two steps: the first one consisted of cleaning the interface and controlling the time at open circuit before applying the potential sweep. This time is necessary to establish the adsorption equilibrium between HePC molecules in solution, free molecules or organised in micelles, and those present at the interface. The second step consisted of the detection of the analyte (HePC) by applying the voltammetric sweep. So that, the following experimental steps were performed after filling the electrochemical cell with the aqueous phase containing HePC and KCl, and the organic phase containing TPhAsDCC: (1) the interface was cleaned by suction of a small volume with a micro syringe, (2) the system was kept at open circuit during different times (toc), and (3) the potential sweep was applied. The methodology proposed here is similar to the one previously reported by other authors.45–48Fig. 8a shows the voltammetric profiles obtained for 0.7 mM HePC, following the described methodology, with toc equal to 0, 20, 40 or 60 min. As can be noted, there was an important change in the current values depending on the time elapsed after cleaning the interface (toc). This can be explained considering that HePC adsorption requires an equilibrium time, during which these species diffuse from the aqueous phase to the interface, dissociate from micellar structures, are reordered and adsorb. Consequently, the longer is toc, the higher is the amount of adsorbed molecules, obtaining a greater electrochemical signal. For toc upper than 60 min, there was not a further increase in the current, which indicated a saturation effect (data not shown). Taking into account these results, this procedure was repeated within a HePC concentration range between 0.1 and 0.8 mM. Fig. 8b shows the variation of the positive current, I+p, measured at E = 0.600 V as a function of toc for all the HePC concentrations analysed.As can be seen in Fig. 8b, the current values depended on the initial HePC concentration in the aqueous phase. At low concentration values (0.2 mM, 0.4 mM) the current response continued varying at high toc (60 min for the lowest concentration). When the HePC concentration increased, constant current values, and consequently saturation of the interface, were reached at lower toc. However, in all cases, it took a while to achieve a constant current. Similar behaviour has already been reported for the detection of proteins.46,49
The challenge then was to find the optimum toc that leads to the largest linear range in calibration curves, providing high sensitivity and good reproducibility of the analytical procedure for HePC quantification.
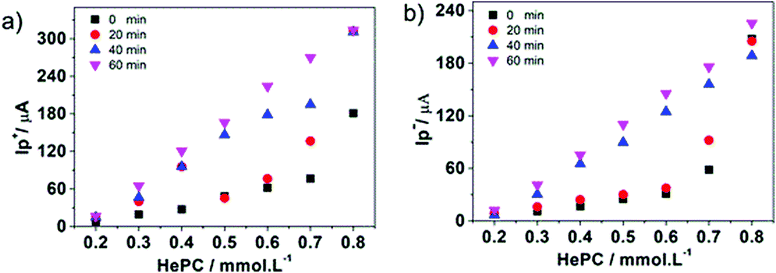
Fig. 9a and b show the positive and negative peak currents, respectively, as a function of the HePC concentration for all toc analysed.
It can be noted that as toc increased, the linear interval of the current versus concentration curves increased for both positive and negative processes. In order to select the best toc to quantify HePC, different analytical parameters were calculated for all toc analysed. The results are shown in the Table 1 for both positive and negative peaks.
| Positive peak current/I+p | Negative peak current/I−p | |||||
|---|---|---|---|---|---|---|
| Time/min | Sensitivity/μA μM−1 | Linear range/μM | R 2 | Sensitivity/μA μM−1 | Linear range/μM | R 2 |
| 0 | 140.16 | 0.4–0.7 | 0.98 | 109.24 | 0.2–0.6 | 0.94 |
| 20 | 233.60 | 0.5–0.7 | 0.81 | 139.68 | 0.2–0.6 | 0.89 |
| 30 | 436.60 | 0.2–0.7 | 0.98 | 115.75 | 0.2–0.6 | 0.90 |
| 40 | 426.04 | 0.2–0.7 | 0.98 | 221.25 | 0.2–0.8 | 0.93 |
| 50 | 456.78 | 0.2–0.8 | 0.99 | 254.25 | 0.2–0.8 | 0.97 |
| 60 | 505.44 | 0.2–0.8 | 0.99 | 274.06 | 0.2–0.8 | 0.98 |
From Table 1 it can be deduced that, for positive and negative peak currents, the longer times provide a greater slope of the calibration curve (improved sensitivity). In addition, the linear interval also improves with increasing toc.
4. Conclusions
The electrochemical behaviour of HePC at the water/1,2-DCE interface was evaluated. The experimental results indicate that the interfacial processes involving the drug adsorption, the penetration of organic anions into polar head groups of HePC, and the formation of [HePC-DCC] “ion pairs” at the interface depend on the time at open circuit, on the different experimental conditions studied, including pH of the aqueous phase, supporting electrolyte of the organic phase, scan rate, switching potential, HePC concentration, and on the application of potential pulses. Then, from the analysis of the effects of these experimental conditions on the voltammetric response, the following scheme can be proposed for the mechanism of charge transfer in the presence of HePC at the water/1,2-DCE interface (Scheme 2).Each image in Scheme 2 represents a step in the mechanism for the electrochemical process occurring in the presence of HePC at different potential intervals (potential regions): in the first step (a) the drug molecules are transported from the aqueous phase to the interface by diffusion and they adsorb at the interface due to their amphiphilic nature, as previously mentioned. This adsorption process of HePC at the interface occurs at open circuit and also at low potential values (from 0.100 to 0.400 V). The number of adsorbed molecules will depend on time elapsed at open circuit and will respond to adsorption equilibrium (HePC(w) ⇌ HePC(ads)). If the interface is polarised at higher potential values (from 0.400 to 0.800 V, region (b)), DCC− anions diffuse from the organic phase to the interface and penetrate into the polar head groups of the previously adsorbed HePC molecules, where they associate forming [HePC-DCC] interfacial “ion pairs”. This association neutralizes the electric charge of HePC molecules, leading to a more structured and stable film as potential increases. The negative potential sweep induces dissociation of the [HePC-DCC] interfacial “ion pair” and the HePC molecules are transferred from the interface to the bulk of the aqueous phase while DCC− is transferred from the interface to the bulk of the organic phase, resulting in a negative current peak at a potential equal to 0.370 V (c). The sharp shape of this peak is characteristic of a desorption process. In this way, cyclic voltammetry experiments carried out under different experimental conditions allowed postulating a transfer mechanism, which involves the adsorption of positively charged HePC at the interface accompanied by “ion pair” formation with the anions from the organic phase.
Moreover, taking into account the results presented in this paper, an appropriate experimental procedure, consisting of cleaning the interface and controlling the time at open circuit followed by the voltammetric analysis, can be proposed as a useful methodology for the quantification of HePC. A linear response of peak current with drug concentration can be obtained within an acceptable concentration range and high sensitivity, providing a simple solution to the HePC quantification problem, which is hampered by the lack of chromophores in its chemical structure. These promising results are part of a larger study in which HePC-loaded nanocarriers such as polymer micelles will be evaluated. The incorporation of HePC drug into nanocarriers is expected to provide optimised pharmaceutical formulations for oral or intravenous administration of this drug, diminishing or avoiding its side effects. This future study will include the evaluation of HePC quantification and selectivity in these complex matrices.
Conflicts of interest
There are no conflicts to declare.Acknowledgements
García MC and Yudi M are members of Argentinean National Council for Scientific and Technical Research (CONICET)’s scientific career. The authors wish to acknowledge the assistance of the CONICET and the National University of Cordoba (UNC, Argentina), both of which provided facilities for this work. Financial support from Consejo Nacional de Investigaciones Científicas y Tecnológicas (CONICET), Agencia Nacional de Promoción Científica y Tecnológica (ANPCyT) – Fondo para la investigación Científica y Tecnológica (Grant numbers PICT-2016-2552 and PICT 2019-00048) and Secretaría de Ciencia y Tecnología de la Universidad Nacional de Córdoba (SECyT-UNC, Grant number Formar-33820190100091CB and 33620180100966CB) is gratefully acknowledged. B. Viada thanks ANPCyT and CONICET for the doctoral fellowships awarded. M. García thanks CONICET for the postdoctoral fellowship granted.References
- S. Schreier, S. V. P. Malheiros and E. de Paula, Biochim. Biophys. Acta, Biomembr., 2000, 1508, 210–234 CrossRef CAS.
- C. C. Domingues, S. V. P. Malheiros and E. de Paula, Braz. J. Med. Biol. Res., 2008, 41, 758–764 CrossRef CAS PubMed.
- O. Salomon, Int. J. Infect. Dis., 2018, 73, 47 CrossRef.
- C. Ménez, P. Legrand, V. Rosilio, S. Lesieur and G. Barratt, Mol. Pharmaceutics, 2007, 4, 281–288 CrossRef PubMed.
- M. Rakotomanga, P. M. Loiseau and M. Saint-Pierre-Chazalet, Biochim. Biophys. Acta, Biomembr., 2004, 1661, 212–218 CrossRef CAS PubMed.
- S. Jaiswal, A. Sharma, M. Shukla and J. Lal, Bioanalysis, 2016, 8, 533–545 CrossRef CAS PubMed.
- T. P. C. Dorlo, M. J. X. Hillebrand, H. Rosing, T. A. Eggelte, P. J. de Vries and J. H. Beijnen, J. Chromatogr. B: Anal. Technol. Biomed. Life Sci., 2008, 865, 55–62 CrossRef CAS PubMed.
- A. E. Kip, H. Rosing, M. J. X. Hillebrand, M. M. Castro, M. A. Gomez, J. H. M. Schellens, J. H. Beijnen and T. P. C. Dorlo, J. Chromatogr. B: Anal. Technol. Biomed. Life Sci., 2015, 998–999, 57–62 CrossRef CAS PubMed.
- T. P. C. Dorlo, T. A. Eggelte, P. J. de Vries and J. H. Beijnen, Analyst, 2012, 137, 1265–1274 RSC.
- R. M. El-Moslemany, M. M. Eissa, A. A. Ramadan, L. K. El-Khordagui and M. Z. El-Azzouni, Acta Trop., 2016, 159, 142–148 CrossRef CAS PubMed.
- J. J. da Gama Bitencourt, W. M. Pazin, A. S. Ito, M. B. Barioni, C. de Paula Pinto, M. A. D. Santos, T. H. S. Guimarães, M. R. M. dos Santos and C. J. Valduga, Biophys. Chem., 2016, 217, 20–31 CrossRef PubMed.
- H. A. Santos, V. García-Morales and C. M. Pereira, ChemPhysChem, 2010, 11, 28–41 CrossRef CAS PubMed.
- B. N. Viada, A. V. Juárez, E. M. P. Gómez, M. A. Fernández and L. M. Yudi, Electrochim. Acta, 2018, 263, 499–507 CrossRef CAS.
- C. I. Camara, M. V. Colqui Quiroga, N. Wilke, A. Jimenez-Kairuz and L. M. Yudi, Electrochim. Acta, 2013, 94, 124–133 CrossRef CAS.
- H. Janchenova, A. Lhotský, K. Stulik and V. J. Marecek, J. Electroanal. Chem., 2007, 60, 101–106 CrossRef.
- L. M. A. Monzon and L. M. Yudi, Electrochim. Acta, 2007, 52, 6873–6879 CrossRef CAS.
- M. V. Colqui Quiroga, L. M. A. Monzon and L. M. Yudi, Electrochim. Acta, 2011, 56, 7022–7028 CrossRef CAS.
- M. A. Mendez, Z. Nazemi, I. Uyanik, Y. Lu and H. H. Girault, Langmuir, 2011, 27, 13918–13924 CrossRef CAS PubMed.
- V. Marecek, A. Lhotsky and H. Janchenova, J. Phys. Chem. B, 2003, 107, 4573–4578 CrossRef CAS.
- A. K. Kontturi, K. Kontturi, L. Murtomaki, B. Quinn and V. J. Cunnane, J. Electroanal. Chem., 1997, 424, 69–74 CrossRef CAS.
- T. Kasahara, N. Nishi, M. Yamamoto and T. Kakiuchi, Langmuir, 2004, 20, 875–881 CrossRef CAS PubMed.
- T. Kakiuchi, J. Electroanal. Chem., 2004, 569, 287–291 CrossRef CAS.
- T. Kakiuchi, N. Nishi, T. Kasahara and M. Chiba, ChemPhysChem, 2003, 4, 179–185 CrossRef CAS PubMed.
- M. Nakagawa, N. Sezaki and T. Kakiuchi, J. Electroanal. Chem., 2001, 501, 260–263 CrossRef CAS.
- V. Marecek and H. Jänchenová, J. Electroanal. Chem., 2003, 558, 119–123 CrossRef CAS.
- H. Jänchenová, K. Stulík and V. Marecek, J. Electroanal. Chem., 2006, 591, 41–45 CrossRef.
- L. Poltorak, K. Morakchi, G. Herzog and A. Walcarius, Electrochim. Acta, 2015, 179, 9–15 CrossRef CAS.
- L. Poltorak, G. Herzog and A. Walcarius, Langmuir, 2014, 30, 11453–11463 CrossRef CAS PubMed.
- L. Poltorak, M. Dossot, G. Herzog and A. Walcarius, Phys. Chem. Chem. Phys., 2014, 16, 26955–26962 RSC.
- L. Poltorak, G. Herzog and A. Walcarius, Electrochem. Commun., 2013, 37, 76–79 CrossRef CAS.
- J.-F. Tocanne and J. Teissié, Biochim. Biophys. Acta, Rev. Biomembr., 1990, 1031, 111–142 CrossRef CAS.
- G. Cevc, Biochemistry, 1987, 26, 6305–6310 CrossRef CAS PubMed.
- M. M. de Sá, V. Sresht, C. O. Rangel-Yagui and D. Blankschtein, Langmuir, 2015, 31, 4503–4512 CrossRef PubMed.
- H. Sakae, Y. Toda and T. Yokoyama, Electrochem. Commun., 2018, 90, 83–86 CrossRef CAS.
- Y. Yuan, L. Wang and S. Amemiya, Anal. Chem., 2004, 76, 5570–5578 CrossRef CAS PubMed.
- J. S. Riva, D. M. Beltramo and L. M. Yudi, Electrochim. Acta, 2014, 115, 370–377 CrossRef CAS.
- J. S. Riva and L. M. Yudi, Phys. Chem. Chem. Phys., 2015, 17, 1644–1652 RSC.
- J. S. Riva, R. Iglesias and L. M. Yudi, Electrochim. Acta, 2013, 107, 584–591 CrossRef CAS.
- F. Kivlehan, Y. Lanyon and D. W. M. Arrigan, Langmuir, 2008, 24, 9876–9882 CrossRef CAS PubMed.
- R. A. Hartving, M. A. Mendez, M. van der Weert, L. Jorgensen, J. Ostergaard, H. H. Girault and H. Jensen, Anal. Chem., 2010, 82, 7699–7705 CrossRef PubMed.
- M. D. Scanlon, E. Jennings and D. W. M. Arrigan, Phys. Chem. Chem. Phys., 2009, 11, 2272–2280 RSC.
- A. Trojánek, J. Langmaier, E. Samcová and Z. Samec, J. Electroanal. Chem., 2007, 603, 235–242 CrossRef.
- G. Feng, Y. Xiong, H. Wang and Y. Yang, Electrochim. Acta, 2008, 53, 8253–8257 CrossRef CAS.
- R. Kalvoda, Fresenius’ J. Anal. Chem., 1994, 349, 565–570 CrossRef CAS.
- G. Herzog, Analyst, 2015, 140, 3888–3896 RSC.
- E. Alvarez de Eulate, L. Serls and D. W. M. Arrigan, Anal. Bioanal. Chem., 2013, 405, 3801–3806 CrossRef CAS PubMed.
- G. Herzog and V. Beni, Anal. Chim. Acta, 2013, 769, 10–21 CrossRef CAS PubMed.
- D. W. M. Arrigan, M. J. Hackett and R. L. Mancera, Curr. Opin. Electrochem., 2018, 12, 27–32 CrossRef CAS.
- E. Alvarez de Eulate and D. W. M. Arrigan, Anal. Chem., 2012, 84, 2505–2511 CrossRef CAS PubMed.
| This journal is © The Royal Society of Chemistry 2022 |


