DOI:
10.1039/D2RA02694E
(Paper)
RSC Adv., 2022,
12, 18806-18820
Synthesis, crystal structure and in silico studies of novel 2,4-dimethoxy-tetrahydropyrimido[4,5-b]quinolin-6(7H)-ones†
Received
28th April 2022
, Accepted 21st June 2022
First published on 29th June 2022
Abstract
Herein, acetic acid mediated multicomponent synthesis of novel 2,4-dimethoxy-tetrahydropyrimido[4,5-b]quinolin-6(7H)-one (2,4-dimethoxy-THPQs) was reported. Single-crystal XRD analysis of four newly developed crystals of 2,4-dimethoxy-THPQs and their DFT study were also reported. The structure of all molecules was optimized using DFT B3LYP/6-31G(d) level and compared with the corresponding single-crystal XRD data. As a result, the theoretical and experimental geometrical parameters (bond lengths and bond angles) were found to be in good agreement. Frontier molecular orbital (FMO) and molecule electrostatic potential (MEP) analyses were used to investigate the physicochemical properties and relative reactivity of 2,4-dimethoxy-THPQs. The formation of strong C–H⋯O and N–H⋯O interaction was investigated by Hirshfeld analysis. Furthermore, electronic charge density concentration in 2,4-dimethoxy-THPQs was analysed by the Mulliken atomic charges which helps to predict the ability of 2,4-dimethoxy-THPQs to bind in the receptor. The molecular docking of the crystal structure of 2,4-dimethoxy-THPQs in the main protease (Mpro) of SARS-CoV-2 suggested that all four 2,4-dimethoxy-THPQs efficiently docked in Mpro. Furthermore, 2,4-dimethoxy-THPQs with a 3-chloro substitution in the phenyl ring have the highest binding affinity because of the additional formation of halogen bonds and highest dipole moment.
1. Introduction
Detailed theoretical studies of pharmaceutically important pyrimido[4,5-b]quinolines (PQs) are important to explore unknown properties of PQs and they help to design a new application based on the theoretical outcome. Density functional theory (DFT) calculations help to predict the crystal structure of PQs, their reactive behaviour and physicochemical properties after the validation process. DFT calculations have become a highly essential and commonly used method in this study for developing a strong relationship between theoretical and experimental data by providing insights about molecular geometry as well as physicochemical properties.1 Once the DFT calculation validates with known PQs, one can use the same for unknown pyrimido[4,5-b]quinoline. So, the crystals of novel 2,4-dimethoxy-tetrahydropyrimido[4,5-b]quinolin-6(7H)-ones (2,4-dimethoxy-THPQs) were developed and analysed by single-crystal X-ray diffraction (SCXRD) and DFT calculation.
Pyrimido[4,5-b]quinolines exhibited biological activities such as MDM2 ubiquitin ligase inhibitory,2 anticancer,3 Src kinase inhibitory,4 antimicrobial,5–7 antioxidant7 and antiallergy activity.8 Due to their diverse functionality, there is also scope to develop a new biological application of PQs. In recent times, novel coronavirus (COVID-19) became a major concern in medical and pharmaceutical science. Widespread community transfer of COVID-19 creates severe socio-economic consequences. So, the development of potent antiviral agents is on-trend. Quinoline based chloroquine and hydroxychloroquine have been proposed for COVID-19 treatment according to the protocols published in 2020 (Fig. 1).9 Due to lacking experimental evidence, its efficiency is still questioned and needs detailed investigation.10,11 Molnupiravir (EIDD-2801) is a pyrimidine based antiviral drug which was approved by FDA-USA,12 MHRA-UK13 and DCGI-India14 for emergency use. So, quinoline and pyrimidine based pyrimido[4,5-b]quinolines are best candidate for antiviral agent. Here, crystal structures of newly synthesised 2,4-dimethoxy-THPQs were analysed by molecular docking. Recently, some study report molecular docking in main protease (Mpro) of SARS-CoV-2.15–19 Here we report effective docking of 2,4-dimethoxy-THPQs in terms of binding energy and inhibition constant.
 |
| | Fig. 1 Anti corona viral agents. | |
To determine the relationship between substitution in 2,4-dimethoxy-THPQs and their binding affinity in main protease (Mpro) of SARS-CoV-2, the study of molecular structure, physicochemical properties and intermolecular interaction is required. Frontier molecular orbital (FMO) is used to investigate the stability and reactivity of the molecule.20–22 It also help to investigate intermolecular interaction which affect the binding affinity. In addition, molecular electrostatic potential (MEP) were used to investigate the most reactive nucleophilic and electrophilic site in crystal against biologically reactive potentials.20 Mulliken atomic charge analysis gives information about the changes distribution on atoms in terms of population of molecular orbitals.23 It suggests the formation of donor–acceptor pair23 which helps to predict the ability to bind in the receptor. Moreover, Hirshfeld surface and fingerprint plots were used to understand strong hydrogen bonding interaction in crystals.1 As a result, these approaches have shown to be quite accurate in predicting a variety of molecular properties of the molecule.
To synthesise novel 2,4-dimethoxy-THPQs, a multi-component strategy was utilised which is used to generate a wide variety of heterocyclic compounds with multifaceted medicinal uses.24 Previous methods utilised various catalyst such as nano-[Fe3O4@SiO2@R-NHMe2][H2PO4],25 graphene oxide,26 MIL-100(Cr)/NHEtN(CH2PO3H2)2,27 choline chloride/oxalic acid,28 IR-MOF-3-ILOAc-Fe(acac)3,29 N,N-diethyl-N-sulfoethanaminium chloride30 and nano-[Fe3O4@SiO2/N-propyl-1-(thiophen-2-yl)ethanimine][ZnCl2]31 to synthesised 2,4-dimethoxy-THPQs. Catalyst-free synthesis of THPQs were also reported using absolute ethanol,32 acetic acid,33–35 and electrolysis in presence of alcohol.36 In continuation of our work in multicomponent synthesis,37–42 here, we reported the simple acetic acid-mediated multicomponent synthesis of novel PQs. This simple protocol generated 2,4-dimethoxy-THPQs 4(a–d) with good yield of products (68–73%). Due to the crystalline nature of compound, single crystal of (a–d) by simple recrystallisation method using methanol/dichloromethane solvent.
2. Experimental
2.1. General remarks
All chemical reagents were purchased from the TCI, Sisco Research Laboratories Pvt. Ltd. and Sigma-Aldrich and used without further purification. The open capillary tube method was used to determine the melting points of all solid compounds that are uncorrected.
2.2. General experimental procedure
A mixture of aromatic aldehydes (1, 1 mmol), dimedone (2, 1 mmol), 6-amino-2,4-dimethoxypyrimidine (3, 1 mmol) and acetic acid (3 mL) were charged in a 50 mL round bottom flask. The reaction mixture was refluxed for 90 minutes. The reaction progress was monitored on TLC using the n-hexane![[thin space (1/6-em)]](https://www.rsc.org/images/entities/char_2009.gif) :
:![[thin space (1/6-em)]](https://www.rsc.org/images/entities/char_2009.gif) ethyl acetate (70
ethyl acetate (70![[thin space (1/6-em)]](https://www.rsc.org/images/entities/char_2009.gif) :
:![[thin space (1/6-em)]](https://www.rsc.org/images/entities/char_2009.gif) 30, v/v) as the mobile phase. After complete consumption of starting material, the reaction mixture was cooled at room temperature and poured into 30 mL of cold water. The obtained crude product was filtered and dried in an oven. Further purification, the crude product was stirred in 10 mL ice-cold diethyl ether to obtain pure product.
30, v/v) as the mobile phase. After complete consumption of starting material, the reaction mixture was cooled at room temperature and poured into 30 mL of cold water. The obtained crude product was filtered and dried in an oven. Further purification, the crude product was stirred in 10 mL ice-cold diethyl ether to obtain pure product.
2.3. X-ray analysis
Single crystals of 2,4-dimethoxy-THPQs 4(a–d) are grown by recrystallisation method using a mixture of 20 mL dichloromethane and 2 mL methanol. The X-ray intensity measurements were taken at 296(2) K using Mo Kα radiation with a wavelength of 0.71073 on a Bruker X8 Kappa APEX II diffractometer with an X-ray generator operating at 50 kV and 30 mA. The Bruker SAINT software suite was used to collect intensity data and correct frames using a narrow-frame algorithm. The empirical absorption correction (multiscan) was performed on each structure using SADABS. SHELXL-2014/7, which is part of the Sheldrick-2014 programme suite, was used to solve the structure using direct methods. The positional and anisotropic temperature parameters of non-hydrogen atoms were refined by the full-matrix least-squares method on F2 using the SHELXL-2014/7. Crystallography tools PLATON, ORTEP and MERCURY were used for structure analysis and demonstration of results. Details of data collection, crystal parameters and structure refinement process of 4(a–d) are given in Table 3.
2.4. Computational details
The DFT calculations were accomplished in the ground state (in vacuo) with Gaussian 16 programme package43 by using the B3LYP method with the 6-31G(d) basis set. To understand, the nature, reactivity and stability of the compound, Becke’s three parameters (B3LYP) diffusion functionals were carried out at 6-31G(d) basis set. The frontier molecular orbital (FMO) and molecule electrostatic potential (MEP) analyses were performed at the B3LYP level of DFT and 6-31G(d) basis set. The energy gap values and quantum chemical descriptors were computed from the frontier molecular orbitals with the same conceptual level and by using known equations. Geometry and data visualisation was done using Gauss view 6.1.1.44 Crystal Explorer 17.5 program45 was used for the Hirshfeld surface analysis and the development of their related 2D fingerprint plot.
2.5. Molecular docking study
All calculations were done using autodock 4.2.6 software installed on 2.5 GHz intel® Core™ i5-7200U CPU. AutoDock Tools (ADT) version 1.5.6 was utilised for structure pre-processing as stated previously.46 PyMOL and PLIP47 were employed to investigate bound conformations and different interactions. The crystal structure of Mpro (PDB ID: 6lu7) was retrieved from the Protein Data Bank (https://www.rcsb.org/). All crystal structures were stored as SYBYL2 (.mol2) file format for input to ADT. A grid box with a dimension of 40 × 40 × 40 Å3 with 0.547 Å spacing and centred on −13.145, 11.568, 68.702 was created surrounding co-crystallised ligand N3 using ADT. After that, grid energy calculations were performed. Default docking parameters were employed in the AutoDock docking computation and 50 docked conformations were obtained for each compound. Using genetic algorithms, the energy calculations were accomplished.
3. Results and discussion
3.1. Chemistry
In this study, we selected 4-chlorobenzaldehyde 1a, dimedone 2 and 6-amino-2,4-dimethoxypyrimidine 3 as a model substrate for the preparation of compound 4a via multicomponent synthesis (Scheme 1). To achieve our target molecule 4a, the reaction was optimised by using different solvents and p-TSA as mentioned in Table 1. We did not observe the complete conversion of 1a to 4a under catalyst-free conditions using water and ethanol as solvents at room temperature (entries 1 and 2). The reaction is also performed without catalyst under reflux in ethanol and we found a trace amount of the 4a with the incomplete conversion of 1a. p-TSA is an efficient catalyst for this similar type of reaction. So, we selected it for the optimisation of our target molecule (entries 4–7). We observed that glacial acetic acid is the best suitable solvent for this reaction. At room temperature, p-TSA/acetic acid converted from 1a to 4a in 5 hours. In comparison, 1a converted to 4a in 1.5 hours under reflux in p-TSA/acetic acid. Similar results were also observed in the case of glacial acetic acid only (entries 8 and 9). So, we decided to proceed with the best-optimised condition (entry 9) in which desired product 4a was obtained in only 1.5 hours by glacial acetic acid under reflux. Using this best-optimised condition reaction was then carried out using different aryl aldehydes such as p-chlorobenzaldehyde (1a, 1 mmol), Benzaldehyde (1b, 1 mmol), 3-methoxybenzaldehyde (1c, 1 mmol) and m-chlorobenzaldehyde (1d, 2 mmol) with dimedone (2, 1 mmol) and 6-amino-2,4-dimethoxypyrimidine (3, 1 mmol) in 3 mL acetic acid. 4(a–d) were obtained with yield ranging from 68–73% in the 90 minutes as shown in Table 2. In presence of electron-withdrawing and electron-releasing substituents of aldehyde, this protocol worked well and consumed all subtracts in 90 min to achive target molecule.
 |
| | Scheme 1 Three-component synthesis of 4a from 4-chlorobenzaldehyde, dimedone and 6-amino-2,4-dimethoxypyrimidine. | |
Table 1 Optimisation of solvent and catalyst for the synthesis of 4aa
| Entries |
Catalyst |
Solventb |
Temperature |
Time (h) |
Conversion relative to aldehydec |
| Reaction condition: 1 mmol p-chlorobenzaldehyde 1a, 1 mmol dimedone 2 and 1 mmol 6-amino-2,4-dimethoxypyrimidine. 3 mL solvent. Observed from TLC analysis. |
| 1 |
— |
Water |
rt |
12 |
NR |
| 2 |
— |
Ethanol |
rt |
12 |
NR |
| 3 |
— |
Ethanol |
Reflux |
12 |
Incomplete |
| 4 |
PTSA (20 mol%) |
Ethanol |
Reflux |
6 |
100% |
| 5 |
PTSA (20 mol%) |
Acetonitrile |
Reflux |
8.5 |
100% |
| 6 |
PTSA (20 mol%) |
Acetic acid |
rt |
5 |
100% |
| 7 |
PTSA (20 mol%) |
Acetic acid |
Reflux |
1.5 |
100% |
| 8 |
— |
Acetic acid |
rt |
5 |
100% |
| 9 |
— |
Acetic acid |
Reflux |
1.5 |
100% |
Table 2 Substrate scope of the synthesis of 2,4-dimethoxy-THPQs 4(a–d)a

|
| Entries |
R |
Product |
Time (min) |
% Yieldb |
| Reaction condition: 1 mmol aldehyde 1(a–d), 1 mmol dimedone 2 and 1 mmol 6-amino-2,4-dimethoxypyrimidine 3. Isolated yield. |
| 1 |
4-Cl |
4a |
90 |
73 |
| 2 |
4-H |
4b |
90 |
71 |
| 3 |
3-OMe |
4c |
90 |
72 |
| 4 |
3-Cl |
4d |
90 |
68 |
3.2. X-ray crystal structure description
Single crystals of 4(a–d) were grown by slow evaporation recrystallisation method using a mixture of 20 mL dichloromethane and 2 mL methanol at room temperature. In order to investigation of structural properties, crystals of 2,4-dimethoxy-THPQs 4(a–d) were subjected to SCXRD analysis. X-ray crystal data showed that compound 4a crystallises in triclinic system, space group P![[1 with combining macron]](https://www.rsc.org/images/entities/char_0031_0304.gif) with a = 6.1119(17) Å, b = 12.856(3) Å, c = 13.503(2) Å, V = 990.8(4) Å3, Z = 2, density = 1.340 g cm−3, and linear absorption coefficient 0.220 mm−1. Compound 4b crystallises in monoclinic system, space group P21/n with a = 11.3367(6) Å, b = 13.5799(7) Å, c = 13.0546(6) Å, V = 1901.73(17) Å3, Z = 4, density = 1.276 g cm−3, and linear absorption coefficient 0.087 mm−1. Compound 4c crystallises in monoclinic system, space group P21/n with a = 12.5837(13) Å, b = 13.0752(17) Å, c = 13.0356(16) Å, V = 2004.4(4) Å3, Z = 4, density = 1.310 g cm−3, and linear absorption coefficient 0.091 mm−1. Compound 4d crystallises in monoclinic system, space group P21/n with a = 12.2403(6) Å, b = 13.3075(7) Å, c = 12.8408(7) Å, V = 1975.65(18) Å3, Z = 4, density = 1.344 g cm−3, and linear absorption coefficient 0.221 mm−1. Full crystallographic data and structure refinement of 4(a–d) showed in Table 3. Fig. 2–5 show ORTEP view of crystal structures and molecular packing generated by Mercury.
with a = 6.1119(17) Å, b = 12.856(3) Å, c = 13.503(2) Å, V = 990.8(4) Å3, Z = 2, density = 1.340 g cm−3, and linear absorption coefficient 0.220 mm−1. Compound 4b crystallises in monoclinic system, space group P21/n with a = 11.3367(6) Å, b = 13.5799(7) Å, c = 13.0546(6) Å, V = 1901.73(17) Å3, Z = 4, density = 1.276 g cm−3, and linear absorption coefficient 0.087 mm−1. Compound 4c crystallises in monoclinic system, space group P21/n with a = 12.5837(13) Å, b = 13.0752(17) Å, c = 13.0356(16) Å, V = 2004.4(4) Å3, Z = 4, density = 1.310 g cm−3, and linear absorption coefficient 0.091 mm−1. Compound 4d crystallises in monoclinic system, space group P21/n with a = 12.2403(6) Å, b = 13.3075(7) Å, c = 12.8408(7) Å, V = 1975.65(18) Å3, Z = 4, density = 1.344 g cm−3, and linear absorption coefficient 0.221 mm−1. Full crystallographic data and structure refinement of 4(a–d) showed in Table 3. Fig. 2–5 show ORTEP view of crystal structures and molecular packing generated by Mercury.
Table 3 Crystal data and structure refinement of 4(a–d)
| Crystal data |
4a |
4b |
4c |
4d |
| CCDC no. |
2133239 |
2149722 |
2157100 |
2157099 |
| Empirical formula |
C21H22N3O3Cl |
C21H23N3O3 |
C22H25N3O4 |
C21H22N3O3Cl |
| Formula weight |
399.86 |
365.42 |
395.45 |
399.86 |
| Temperature (K) |
296(2) |
296(2) |
296(2) |
296(2) |
| Crystal system |
Triclinic |
Monoclinic |
Monoclinic |
Monoclinic |
| Space group |
P![[1 with combining macron]](https://www.rsc.org/images/entities/char_0031_0304.gif) |
P21/n |
P21/n |
P21/n |
| a, b, c (Å) |
6.1119(17), 12.856(3), 13.503(2) |
11.3367(6), 13.5799(7), 13.0546(6) |
12.5837(13), 13.0752(17), 13.0356(16) |
12.2403(6), 13.3075(7), 12.8408(7) |
| α, β, γ (°) |
74.018(10), 83.479(15), 76.619(15) |
90, 108.872(2), 90 |
90, 110.844(5), 90 |
90, 109.168(2), 90 |
| Volume (Å3) |
990.8(4) |
1901.73(17) |
2004.4(4) |
1975.65(18) |
| Z |
2 |
4 |
4 |
4 |
| ρcalc (g cm−3) |
1.340 |
1.276 |
1.310 |
1.344 |
| (μ mm−1) |
0.220 |
0.087 |
0.091 |
0.221 |
| F(000) |
420.0 |
776.0 |
840.0 |
840.0 |
| Crystal size (mm3) |
0.28 × 0.22 × 0.16 |
0.28 × 0.22 × 0.16 |
0.25 × 0.22 × 0.1 |
0.25 × 0.12 × 0.1 |
| Radiation |
Mo Kα (λ = 0.71073) |
Mo Kα (λ = 0.71073) |
Mo Kα (λ = 0.71073) |
Mo Kα (λ = 0.71073) |
| 2Θ range for data collection (°) |
3.142 to 49.994 |
4.146 to 50 |
1.93 to 25.0 |
3.99 to 50 |
| Absorption correction |
Multi-scan |
Multi-scan |
Multi-scan |
Multi-scan |
| Tmin, Tmax |
0.941, 0.966 |
0.976, 0.986 |
0.978, 0.991 |
0.947, 0.978 |
| Reflections collected |
4723 |
15821 |
12334 |
13789 |
| Independent reflections |
2395 [Rint = 0.0294] |
3353 [Rint = 0.0240] |
3528 [Rint = 0.0376] |
3472 [Rint = 0.0283] |
| Refinement method |
Full-matrix least-squares on F2 |
| Refinement program |
SHELXL-2014/7 (Sheldrick, 2014) |
| Data/restraints/parameters |
2395/0/261 |
3353/0/253 |
3528/0/268 |
3472/0/257 |
| Goodness-of-fit on F2 |
1.083 |
1.556 |
1.029 |
1.015 |
| Final R indexes [I ≥ 2σ (I)] |
R1 = 0.0636, wR2 = 0.1659 |
R1 = 0.0389, wR2 = 0.1058 |
R1 = 0.0429, wR2 = 0.0985 |
R1 = 0.0409, wR2 = 0.0965 |
| Final R indexes [all data] |
R1 = 0.1141, wR2 = 0.2058 |
R1 = 0.0545, wR2 = 0.1134 |
R1 = 0.0742, wR2 = 0.1160 |
R1 = 0.0606, wR2 = 0.1089 |
| Largest diff. peak, hole (e Å−3) |
0.20, −0.27 |
0.18, −0.18 |
0.201, −0.186 |
0.39, −0.38 |
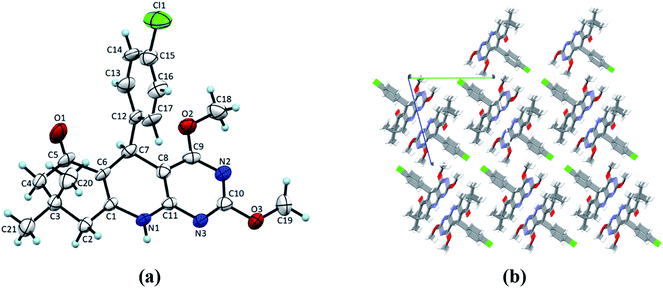 |
| | Fig. 2 (a) ORTEP view of 4a with displacement ellipsoids drawn at 50%. (b) The packing diagram for 4a view along the a-axis. | |
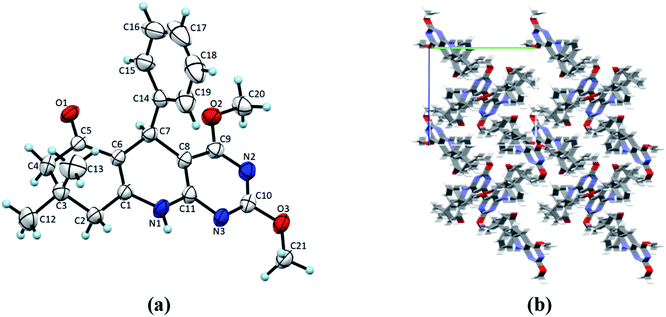 |
| | Fig. 3 (a) ORTEP view of 4b with displacement ellipsoids drawn at 50%. (b) The packing diagram for 4b view along the a-axis. | |
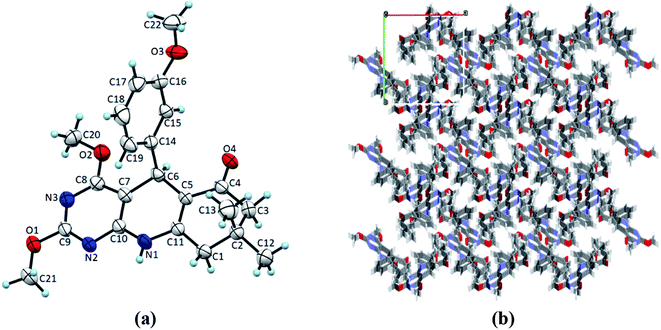 |
| | Fig. 4 (a) ORTEP view of 4c with displacement ellipsoids drawn at 50%. (b) The packing diagram for 4c view along the c axis. | |
 |
| | Fig. 5 (a) ORTEP view of 4d with displacement ellipsoids drawn at 50%. (b) The packing diagram for 4d view along the a-axis. | |
3.3. Theoretical computational study
To investigate geometrical parameters of 2,4-dimethoxy-THPQ 4a density functional theory (DFT) calculations were performed using Becke’s three parameters (B3LYP) diffusion functionals methods with lower to higher basis sets such as 6-31G, 6-31G(d), 6-31G(d,p), 6-311G, 6-311G+(2d,p), 6-311G++(d,p) and 6-311G++(d,2p). Herein, we choose seven basis sets which are generally used for the theoretical investigation to get accurate theoretical data corresponds to the experimental data obtained from the SCXRD. The comparison of results obtained from DFT calculation with experimental data of 4a is shown in Table S1 (included in ESI†).
Fig. 6 shows correlation graphs of geometrical parameters of 4a using different basis sets in the gaseous phase with the corresponding experimental data derived by XRD by using the correlation coefficient value (R2). R2 value is higher in 6-31G(d) and 6-311G+(2d,p) basis set for bond length and bond angle. For bond length R2 value is higher in 6-311G+(2d,p) basis set while the bond angle R2 value is higher in 6-31G(d) basis set. So, we choose 6-31G(d) basis set for further investigation of other compounds. Comparison of calculated geometrical parameters of 4(b–d) obtained (DFT/B3LYP) method using 6-31G(d) basis sets in gaseous phase with the corresponding experimental data derived by XRD by using R2 value is mentioned in Table S2 (included in ESI†) and graphed in Fig. 7. As theoretical calculations were performed in the gas phase and crystal data were conducted in the solid phase, calculated and experimental parameters are different.
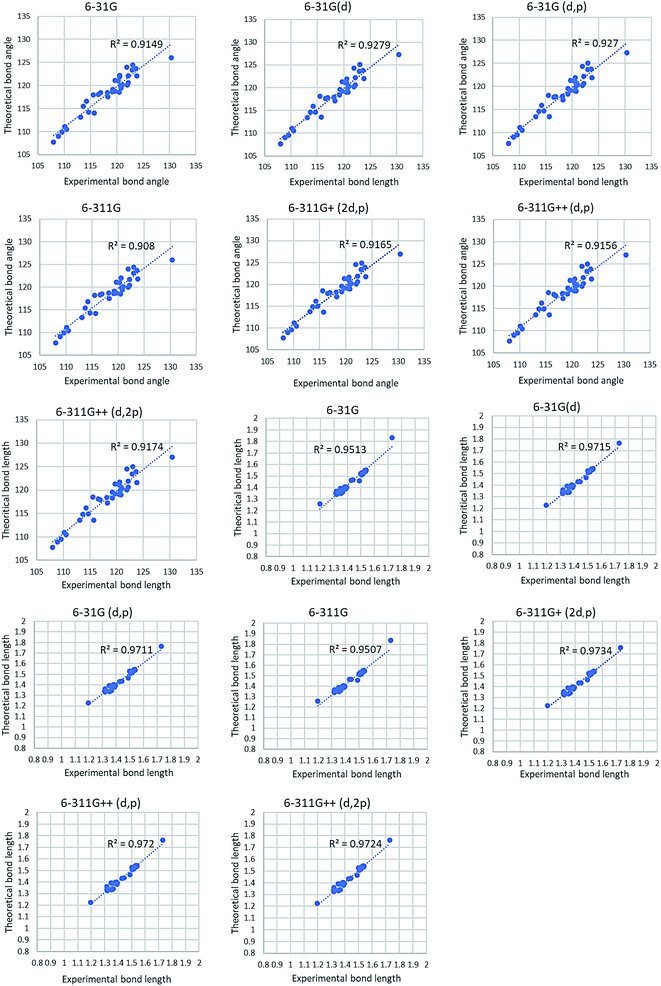 |
| | Fig. 6 Correlation graph of theoretical and experimental parameters of 4a. | |
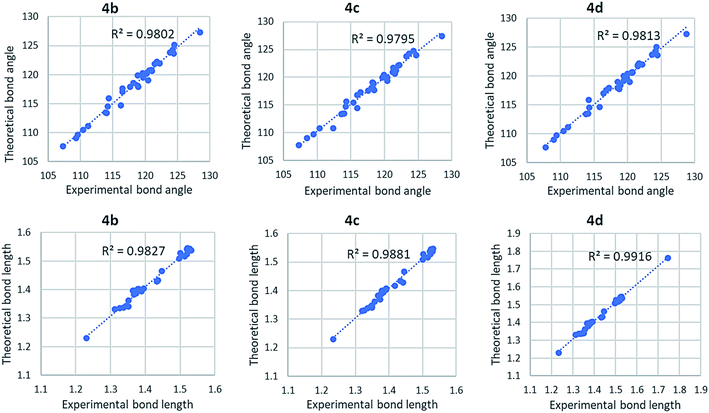 |
| | Fig. 7 Correlation graph of theoretical and experimental parameters of 4(b–d) using B3LYP/6-31G(d) basis sets in the gaseous phase. | |
3.4. Frontier molecular orbital (FMO) analysis
To investigate the stability and reactivity of 4(a–d), HOMO and LUMO orbital energy and the dipole moment of molecule 4(a–d) are calculated at the B3LYP method using 6-31G(d) basis set in a gaseous state. HOMO–LUMO representation of molecule 4(a–d) is shown in Fig. 8. As a smaller value of energy gap, Eg = ELUMO − EHOMO, shows more reactivity and less stability, 2,4-dimethoxy-THPQ 4c with 3-methoxy substitution in phenyl ring has more reactivity and less stability than 4a, 4b and 4d. The order of Egap: 4a > 4d > 4b > 4c. Furthermore, the HOMO is mostly an electron donor, whereas the LUMO is primarily an electron acceptor. The HOMO and LUMO energy values are associated with the ionization potential (IP) and electron affinities (EA), respectively. The higher the IP value, more energy it requires to remove an electron from the HOMO orbital. The lower the EA, more quickly the molecule undergoes electrophilic reactions. The values of IP and EA of 4(a–d) were calculated as: IP = −EHOMO and EA = −ELUMO. 4c also have the lowest EA. So 4c more quickly molecule undergoes electrophilic reactions.
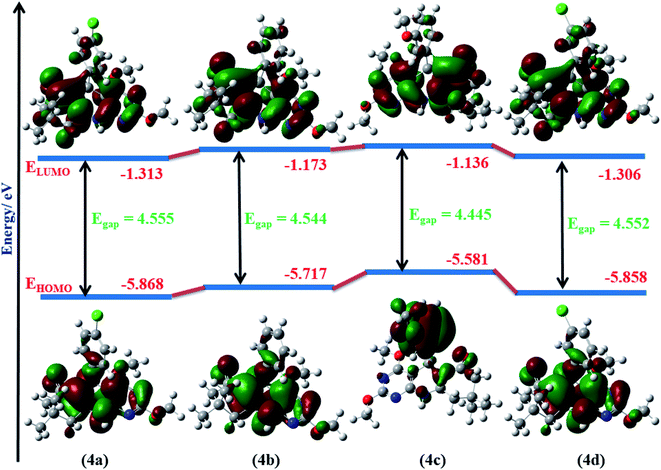 |
| | Fig. 8 Molecular orbital diagrams and calculated HOMO–LUMO energy levels for 4(a–d). | |
All calculated quantum parameters of 2,4-dimethoxy-THPQs 4(a–d) are shown in Table 4 and are related to FMO energy values. Koopman’s theorem48 defines these chemical parameters, which were derived using the B3LYP/6-31G(d) basis set in gaseous phase. Chemical hardness (η) and chemical softness (σ) are reciprocal of each other and calculated as: η = (IP − EA)/2 and σ = 1/2η. 4a has the highest hardness (η = 2.277 eV) i.e., 4a would be less reactive and more stable. Whereas 4c have the highest softness (σ = 0.225 eV) i.e., 4c would be more reactive and less stable. Electronegativity (χ) and its negative chemical potential (μ) is expressed as: χ = −(EHOMO + ELUMO)/2 and μ = −χ. Highest electronegativity (χ = 3.590 eV) of 2,4-dimethoxy-THPQ 4a show that 4a with 4-chloro substitution in phenyl ring has the highest reducing power. The electrophilicity index (ω) was defined by Parr et al.49 as. “Specific property of a chemical species, the square of its electronegativity divided by its chemical hardness, be taken as defining its electrophilicity index.” It is expressed as: ω = χ2/2η. 2,4-Dimethoxy-THPQ 4a have highest electrophilicity index (ω = 2.830 eV). So, 4a have the highest ability to accept an electron. For the correlation of the electronic property of 2,4-dimethoxy-THPQs, the dipole moment (D) of the molecule is a key factor. If D value of 2,4-dimethoxy-THPQs is large then the molecule has strong intermolecular interaction. The highest D value of 2,4-dimethoxy-THPQ 4d with 3-chloro substitution in the phenyl ring indicates that 4d has strong intermolecular interactions. And 4d can strongly bind to protein receptors.
Table 4 Calculated chemical quantum parameters of dimethoxy-THPQs 4(a–d)a
| Parameter |
4a |
4b |
4c |
4d |
| B3LYP/6-31G(d) was used in a gaseous state. |
| EHOMO (eV) |
−5.868 |
−5.717 |
−5.581 |
−5.858 |
| ELUMO (eV) |
−1.313 |
−1.173 |
−1.136 |
−1.306 |
| Eg (eV) |
4.555 |
4.544 |
4.445 |
4.552 |
| IP (eV) |
5.868 |
5.717 |
5.586 |
5.858 |
| EA (eV) |
1.313 |
1.173 |
1.136 |
1.306 |
| η (eV) |
2.277 |
2.272 |
2.222 |
2.276 |
| σ (eV) |
0.220 |
0.220 |
0.225 |
0.220 |
| χ (eV) |
3.590 |
3.445 |
3.359 |
3.582 |
| μ (eV) |
−3.590 |
−3.445 |
−3.359 |
−3.582 |
| ω (eV) |
2.830 |
2.612 |
2.538 |
2.818 |
| Dipole moment (D, Debye) |
4.219 |
2.511 |
3.916 |
4.668 |
3.5. Molecular electrostatic potential
It is well understood that any charge distribution of molecule in the surrounding space generates an electrostatic potential. Electrostatic potential map design allows us to visualise molecular surface particle zones with varying charges. The molecular electrostatic potential (MEP) was found to be a very useful tool for analysing and evaluating molecular reactive behaviour. As a result, the advantage of the molecular electrostatic potential map includes the ability to visualize chemical interactions within the molecules and chemical bonds have the ability to predict how molecules interact with one another by exploiting the charge distribution on the surface of molecules. The MEP surface of 2,4-dimethoxy-THPQs 4(a–d) is calculated using B3LYP/6-31G(d) basis set in a gaseous state are shown in Fig. 9. The varied colours in the plots represent different MEP surface values. The dark blue colour represents the electron-deficient regions in 4(a–d), therefore it has the strongest attraction and readily undergoes nucleophilic attack whereas the deepest red colour represents the electron-rich regions in 4(a–d), therefore it has the strongest repulsion and readily undergoes electrophilic attack. The light blue colour represents a slightly electron-deficient zone in 2,4-dimethoxy-THPQs 4(a–d), and the yellow colour represents a slightly electron-rich region in 2,4-dimethoxy-THPQs 4(a–d), and the green colour represents a neutral region in 2,4-dimethoxy-THPQs 4(a–d). This discrepancy in the MEP surface is due to the electron density of the atom. The negative region 2,4-dimethoxy-THPQs 4(a–d) is related to carbonyl, methoxy group and Cl atom. The positive regions 2,4-dimethoxy-THPQs 4(a–d) are situated around the secondary amine group.
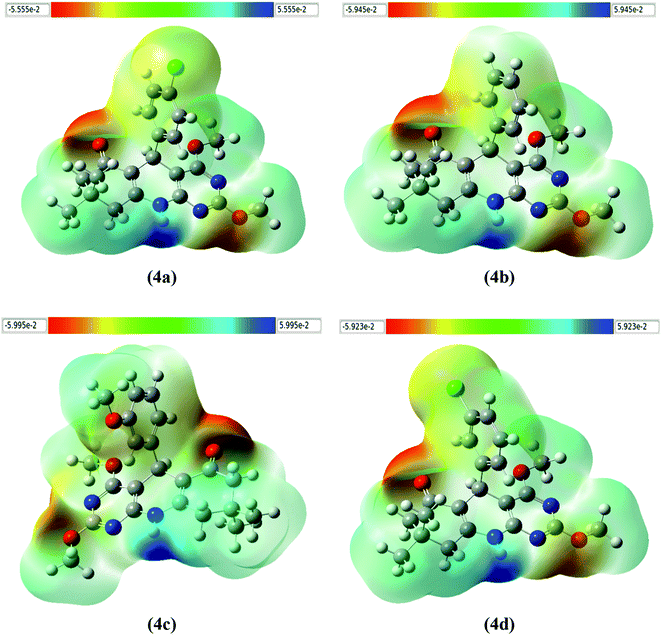 |
| | Fig. 9 The molecular electrostatic potential surface of the molecule 4(a–d). | |
3.6. Hirshfeld surface analysis
The Hirshfeld surface (HS) analysis and their related 2D fingerprint plots were carried out with the help of the Crystal Explorer 17.5 programme. The percentage contribution of different hydrogen bonds in the crystal system and other intramolecular interactions to the total HS of 2,4-dimethoxy-THPQs 4(a–d) were analysed and demonstrated in a two-dimensional fingerprint plot shown in Fig. 10–13. The cif (Crystallographic Information File) of molecule 4(a–d) was used for the analysis. Allocating de and di as an atom’s external and internal distances to the HS and normalising these pairs of values to the respective atoms’ van der Waals (VdW) radii is called dnorm surface map value. Negative values are emphasized on the surface map as red spots when interactions are smaller than the sum of the VdW radii of the two atoms. Close interactions to the VdW radii limit are shown as white, whereas interactions greater than the sum of the VdW radii positive value are emphasised as blue on the surface. HS mapped over dnorm for 2,4-dimethoxy-THPQs 4(a–d) are shown in Fig. 10–13.
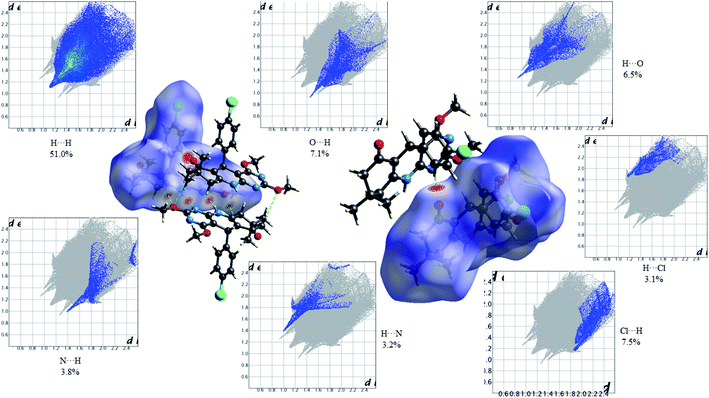 |
| | Fig. 10 HS mapped over dnorm and 2D fingerprint plots showing relative contributions (%) to the HS area for the several close intermolecular contacts in 2,4-dimethoxy-THPQ 4a. | |
Fig. 10 shows the Hirshfeld dnorm surface mapped over the standard surface resolution for 2,4-dimethoxy-THPQ 4a, with a fixed colour scale of −0.3161 to 1.5878 a.u. The HS of 4a shows two intense red spots on the dnorm surface produced due to the strong interatomic interactions of O⋯H and H⋯O, while four light red spots appear due to the weak interatomic interactions of O⋯H–C, C–H⋯O, N⋯H–N and N–H⋯N. As seen in Fig. 10, the most important interactions were revealed with H⋯H (51.0%), O⋯H (7.1%), H⋯O (6.5%), Cl⋯H (7.5%), H⋯Cl (3.1%), N⋯H (3.8%) and H⋯N (3.2%) contact contributions to the HS.
Fig. 11 shows the Hirshfeld dnorm surface mapped over the standard surface resolution for 2,4-dimethoxy-THPQ 4b, with a fixed colour scale of −0.6042 to 1.4707 a.u. The HS of 4b shows two intense red spots on the dnorm surface produced due to the strong interatomic interactions of O⋯H–N and N–H⋯O. As seen in Fig. 11, the most important interactions were revealed with H⋯H (62.6%), O⋯H (8.2%), H⋯O (7.0%), C⋯C (1.8%), C⋯H (6.2%), H⋯C (5.4%), N⋯H (3.1%) and H⋯N (2.1%) contact contributions to the HS.
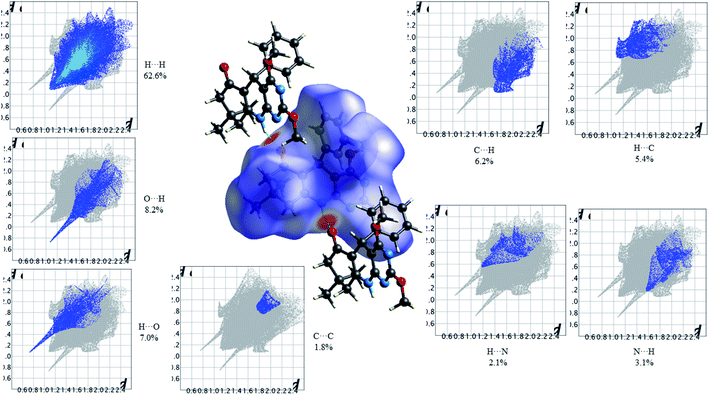 |
| | Fig. 11 HS mapped over dnorm and 2D fingerprint plots showing relative contributions (%) to the HS area for the several close intermolecular contacts in 2,4-dimethoxy-THPQ 4b. | |
Fig. 12 shows the Hirshfeld dnorm surface mapped over the standard surface resolution for molecule 4c, with a fixed colour scale of −0.5663 to 1.4051 a.u. The HS of 2,4-dimethoxy-THPQ 4c shows two intense red spots on the dnorm surface produced due to the strong interatomic interactions of O⋯H–N and N–H⋯O, while two light red spots appear due to the weak interatomic interactions of O⋯H–C and C–H⋯O. As seen in Fig. 12, the most important interactions were revealed with H⋯H (61.7%), O⋯H (9.3%), H⋯O (8.3%), C⋯C (1.6%), C⋯H (5.7%), H⋯C (4.5%), N⋯H (2.6%) and H⋯N (2.4%) contact contributions to the HS.
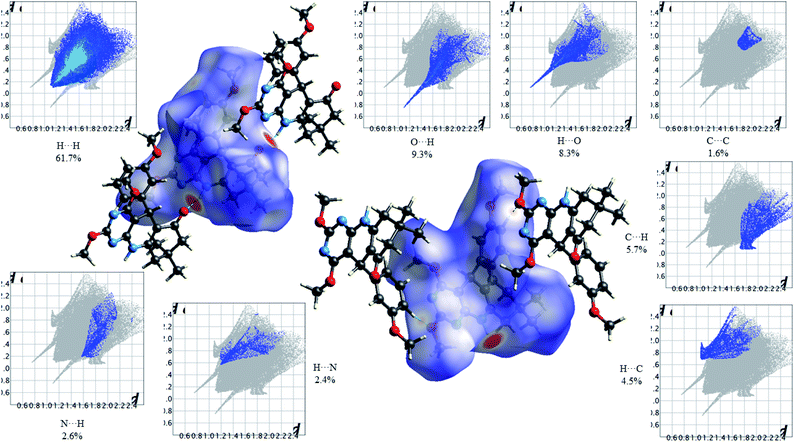 |
| | Fig. 12 HS mapped over dnorm and 2D fingerprint plots showing relative contributions (%) to the HS area for the several close intermolecular contacts in 2,4-dimethoxy-THPQ 4c. | |
Fig. 13 shows the Hirshfeld dnorm surface mapped over the standard surface resolution for 2,4-dimethoxy-THPQ 4d, with a fixed colour scale of −0.5775 to 1.4141 a.u. The 2,4-dimethoxy-THPQ of 4d shows two intense red spots on the dnorm surface produced due to the strong interatomic interactions of O⋯H–N and N–H⋯O, while two light red spots appear due to the weak interatomic interactions of O⋯H–C and C–H⋯O. As seen in Fig. 13, the most important interactions were revealed with H⋯H (53.1%), O⋯H (7.5%), H⋯O (6.7%), C⋯C (1.6%), C⋯H (5.7%), H⋯C (4.7%), N⋯H (2.3%), H⋯N (2.0%), Cl⋯H (6.3%) and H⋯Cl (3.9%) contact contributions to the HS.
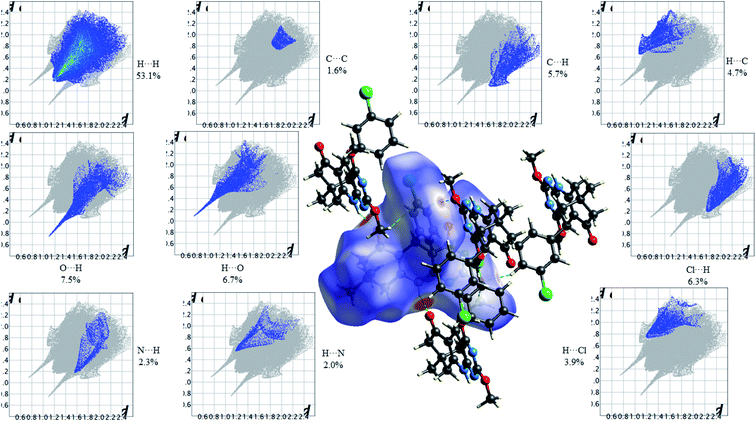 |
| | Fig. 13 HS mapped over dnorm and 2D fingerprint plots showing relative contributions (%) to the HS area for the several close intermolecular contacts in 2,4-dimethoxy-THPQ 4d. | |
3.7. The Mulliken atomic charges analysis
Mulliken atomic charges give information about a molecule’s electronic charge density concentration. In chemical reactions, atomic charges have been used to illustrate the processes of electronegativity equalisation and charge transfer. The charge distribution in the molecular system is used to measure parameters like the dipole moment, polarizability and chemical reactivity. Mulliken atomic charges of 2,4-dimethoxy-THPQs 4(a–d) are calculated at DFT/B3LYP method using 6-31G(d) basis set and it is represented in Table 5. The result shown in Table 5 indicates that all hydrogen atoms in 4(a–d) are positively charged. The H1N atom in 4(a–d) possesses a highly positive charge as compared to the other hydrogen atom because H1N atom is attached to the most electronegative nitrogen atom. The N1 atom in 4(a–d) possesses a highly negative charge on nitrogen atom other than electronegative nitrogen and oxygen atom due to the formation of N–H⋯N and N–H⋯O hydrogen bond interaction. It is worthy to note that C10 in molecules 4a, 4b and 4d as well as C9 in molecule 4c possess a higher charge than other carbon atoms in all molecules because this carbon atom is bonded with two electronegative nitrogen atoms and one oxygen atom. We can also see that all nitrogen and oxygen atoms in molecule 4(a–d) are the most negatively charged, implying that these centres have the highest electron density and may easily interact with the positively charged region of the receptor.
Table 5 Mulliken atomic charges of the molecule 4(a–d)
| Molecule 4a |
Molecule 4b |
Molecule 4c |
Molecule 4d |
| Atom |
Charges |
Atom |
Charges |
Atom |
Charges |
Atom |
Charges |
| C1 |
0.330 |
C1 |
0.329 |
C1 |
−0.351 |
C1 |
0.330 |
| C2 |
−0.357 |
C2 |
−0.357 |
C2 |
0.079 |
C2 |
−0.357 |
| C3 |
0.080 |
C3 |
0.081 |
C3 |
−0.351 |
C3 |
0.080 |
| C4 |
−0.354 |
C4 |
−0.353 |
C4 |
0.404 |
C4 |
−0.354 |
| C5 |
0.407 |
C5 |
0.405 |
C5 |
0.029 |
C5 |
0.407 |
| C6 |
0.022 |
C6 |
0.022 |
C6 |
−0.307 |
C6 |
0.021 |
| C7 |
−0.308 |
C7 |
−0.308 |
C7 |
0.049 |
C7 |
−0.308 |
| C8 |
0.044 |
C8 |
0.049 |
C8 |
0.534 |
C8 |
0.046 |
| C9 |
0.536 |
C9 |
0.534 |
C9 |
0.678 |
C9 |
0.536 |
| C10 |
0.677 |
C10 |
0.677 |
C10 |
0.502 |
C10 |
0.677 |
| C11 |
0.495 |
C11 |
0.495 |
C11 |
0.325 |
C11 |
0.495 |
| C12 |
0.198 |
C12 |
−0.449 |
C12 |
−0.450 |
C12 |
−0.455 |
| C13 |
−0.167 |
C13 |
−0.456 |
C13 |
−0.451 |
C13 |
−0.450 |
| C14 |
−0.135 |
C14 |
0.198 |
C14 |
0.195 |
C14 |
0.198 |
| C15 |
−0.066 |
C15 |
−0.159 |
C15 |
−0.241 |
C15 |
−0.167 |
| C16 |
−0.133 |
C16 |
−0.134 |
C16 |
0.375 |
C16 |
−0.071 |
| C17 |
−0.187 |
C17 |
−0.130 |
C17 |
−0.198 |
C17 |
−0.131 |
| C18 |
−0.207 |
C18 |
−0.133 |
C18 |
−0.143 |
C18 |
−0.132 |
| C19 |
−0.204 |
C19 |
−0.191 |
C19 |
−0.171 |
C19 |
−0.184 |
| C20 |
−0.450 |
C20 |
−0.206 |
C20 |
−0.207 |
C20 |
−0.207 |
| C21 |
−0.455 |
C21 |
−0.203 |
C21 |
−0.202 |
C21 |
−0.204 |
| N1 |
−0.753 |
N1 |
−0.754 |
C22 |
−0.211 |
N1 |
−0.755 |
| N2 |
−0.582 |
N2 |
−0.584 |
N1 |
−0.757 |
N2 |
−0.582 |
| N3 |
−0.568 |
N3 |
−0.562 |
N2 |
−0.596 |
N3 |
−0.551 |
| O1 |
−0.503 |
O1 |
−0.502 |
N3 |
−0.554 |
O1 |
−0.500 |
| O2 |
−0.488 |
O2 |
−0.487 |
O1 |
−0.457 |
O2 |
−0.487 |
| O3 |
−0.455 |
O3 |
−0.458 |
O2 |
−0.488 |
O3 |
−0.457 |
| Cl1 |
−0.038 |
H1N |
0.337 |
O3 |
−0.511 |
Cl1 |
−0.035 |
| H1N |
0.339 |
H2A |
0.149 |
O4 |
−0.500 |
H1N |
0.338 |
| H2A |
0.150 |
H2B |
0.164 |
H1N |
0.332 |
H2A |
0.150 |
| H2B |
0.165 |
H4A |
0.155 |
H1A |
0.140 |
H2B |
0.165 |
| H4A |
0.156 |
H4B |
0.162 |
H1B |
0.169 |
H4A |
0.156 |
| H4B |
0.163 |
H7 |
0.171 |
H3A |
0.158 |
H4B |
0.164 |
| H7 |
0.174 |
H12A |
0.140 |
H3B |
0.159 |
H7 |
0.175 |
| H13 |
0.160 |
H12B |
0.149 |
H6 |
0.172 |
H12A |
0.139 |
| H14 |
0.152 |
H12C |
0.141 |
H13A |
0.140 |
H12B |
0.151 |
| H16 |
0.149 |
H13A |
0.138 |
H13B |
0.141 |
H12C |
0.164 |
| H17 |
0.136 |
H13B |
0.149 |
H13C |
0.150 |
H13A |
0.142 |
| H18A |
0.168 |
H13C |
0.167 |
H15 |
0.131 |
H13B |
0.140 |
| H18B |
0.170 |
H15 |
0.148 |
H17 |
0.125 |
H13C |
0.151 |
| H18C |
0.166 |
H16 |
0.126 |
H18 |
0.125 |
H15 |
0.172 |
| H19A |
0.162 |
H17 |
0.123 |
H19 |
0.144 |
H17 |
0.149 |
| H19B |
0.166 |
H18 |
0.123 |
H20A |
0.169 |
H18 |
0.134 |
| H19C |
0.163 |
H19 |
0.125 |
H20B |
0.165 |
H19 |
0.132 |
| H20A |
0.150 |
H20A |
0.167 |
H20C |
0.173 |
H20A |
0.168 |
| H20B |
0.142 |
H20B |
0.169 |
H21A |
0.159 |
H20B |
0.172 |
| H20C |
0.150 |
H20C |
0.164 |
H21B |
0.164 |
H20C |
0.166 |
| H21A |
0.165 |
H21A |
0.165 |
H21C |
0.162 |
H21A |
0.166 |
| H21B |
0.139 |
H21B |
0.161 |
H22A |
0.150 |
H21B |
0.162 |
| H21C |
0.150 |
H21C |
0.162 |
H22B |
0.149 |
H21C |
0.162 |
| |
|
|
|
H22C |
0.165 |
|
|
3.8. Molecular docking study
After obtaining significant outcomes in Section 3.7, a molecular docking study of 4(a–d) was carried out to obtain binding conformation of 4(a–d) in the receptor. As discussed earlier, the continuing outbreak of the novel coronavirus (COVID-19) has claimed many lives of humans. So, docking studies have been applied on 4(a–d) with the main protease (Mpro) of SARS-CoV-2. Results of the study show that 4(a–d) are effectively bound in the active site of Mpro. Values of binding energy (ΔG) and inhibition constant Ki for 4(a–d) show the potential of binding. 4b docked in Mpro with ΔG as −9.69 kcal mol−1 and Ki as 79.24 nM. Chlorine substitution at para position decreased the strength of binding of 4a with ΔG as −8.97 kcal mol−1 and Ki as 267.95 nM. Whereas chlorine substitution at the meta position increased the strength of binding of 4d with ΔG as −11.47 kcal mol−1 and Ki as 3.91 nM. Methoxy substitution at the position also increased the strength of binding and 4c with ΔG as −10.71 kcal mol−1 and Ki as 14.10 nM. Here, due to the highest dipole moment, 4d was more effectively docked in the active site of Mpro.
Protein–ligand interaction diagrams show nitrogen and oxygen atoms of 4(a–d) make a hydrogen bond with HIS41, TYR54, GLY143, GLU166 and GLN189 which match with prediction based on Mulliken atomic charges analysis (Fig. 14 and 15). 4b docked in Mpro with four H-bond [HIS41 (3.44 Å), TYR54 (3.49 Å), GLU166 (3.60 Å) and GLN189 (3.92 Å)] and one hydrophobic bond [MET165 (3.13 Å)]. 4b docked in Mpro with four H-bond [HIS41 (3.44 Å), TYR54 (3.49 Å), GLU166 (3.60 Å) and GLN189 (3.92 Å)] and one hydrophobic interaction [MET165 (3.13 Å)]. 4a docked in Mpro with two H-bond [TYR54 (2.92 Å), GLU166 (3.50 Å)], three hydrophobic interactions [ASN142 (3.81 Å), MET165 (3.21 Å), GLN (189 Å)] and one π-stacking [HIS41 (4.07) Å]. 4d docked in Mpro similarly to 4a with an additional halogen bond with THR190 (3.90 Å). 4c docked in Mpro with three H-bond [HIS41 (3.11 Å), GLY143 (3.90 Å), GLU166 (4.01 Å)] and one hydrophobic interaction [THR25 (3.89 Å)]. Thus, pyrimido[4,5-b]quinolinone with chlorine at meta position efficiently binds to Mpro of SARS-CoV-2 and could be the potential lead molecule for an antiviral drug.
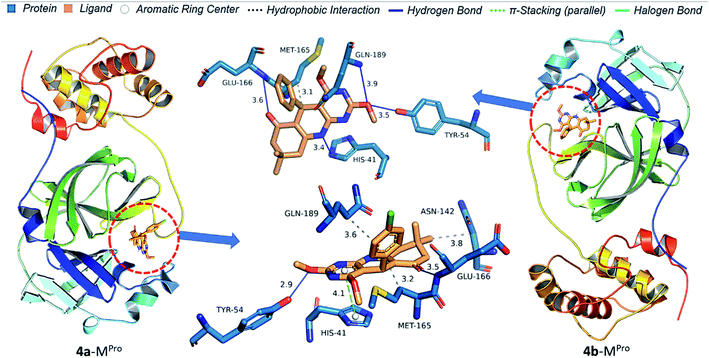 |
| | Fig. 14 Protein–ligand interaction diagram of 4a and 4b with Mpro of SARS-CoV-2. | |
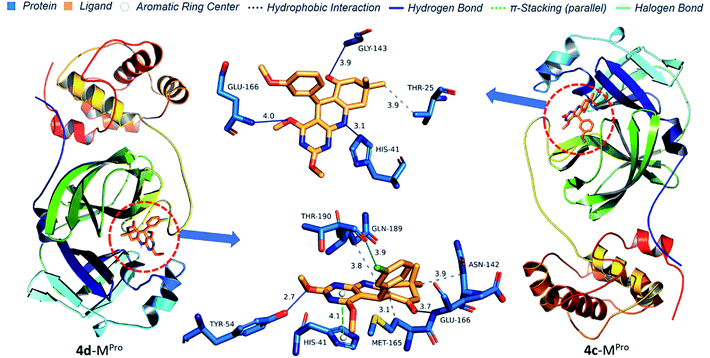 |
| | Fig. 15 Protein–ligand interaction diagram of 4c and 4d with Mpro of SARS-CoV-2. | |
4. Conclusion
In this study, we synthesized novel 2,4-dimethoxy-THPQs 4(a–d) via multicomponent reaction. All four 4(a–d) were employed for SCXRD analysis. The structure of 4(a–d) was optimized based on DFT calculation by using the B3LYP method with 6-31G(d) basis set. The DFT-optimized structures were compared with the corresponding experimental data derived by SCXRD studies for the geometrical parameter. The R2 values between experimental and theoretical bond lengths and bond angles revealed that the structure derived by single-crystal XRD agrees well with the optimal structure. FMO study indicates that 4c have the highest reactivity. Due to the highest dipole moment and additional halogen bond 4d have the highest binding affinity in the main protease (Mpro) of SARS-CoV-2. Also, the Hirshfeld surface analysis and fingerprint plots were represents the strong C–H⋯O and N–H⋯O hydrogen bonding formation.
Conflicts of interest
The authors declare no conflict of interest.
Acknowledgements
The authors are grateful to the Department of Chemistry, Sardar Patel University for providing lab facilities and computational Studies. The authors are also grateful to UGC, New Delhi for UGC-CAS, phase-II sponsored under award letter no. F-540/5/CAS-II/2018 (SAP-I) dated July 25, 2018, for providing chemical facilities. SGP is grateful to the UGC, New Delhi for a UGC-JRF (NTA Ref. No. 201610157514; dated: 01.04.2021).
References
- K. Karrouchi, S. Fettach, M. M. Jotani, A. Sagaama, S. Radi, H. A. Ghabbour, Y. N. Mabkhot, B. Himmi, M. El Abbes Faouzi and N. Issaoui, J. Mol. Struct., 2020, 1221, 128800 CrossRef CAS.
- X. Dou, X. Li, L. Tao, C. Hu, L. Zhang, Q. He, B. Yang and Y. Hu, Med. Chem., 2013, 9, 581–587 CrossRef CAS PubMed.
- M. M. Ghorab, F. A. Ragab, H. I. Heiba, R. K. Arafa and E. M. El-Hossary, Eur. J. Med. Chem., 2010, 45, 3677–3684 CrossRef CAS PubMed.
- D. H. Boschelli, D. Powell, J. M. Golas and F. Boschelli, Bioorg. Med. Chem. Lett., 2003, 13, 2977–2980 CrossRef CAS.
- G. Prasoona, B. Kishore and G. Brahmeshwari, Lett. Org. Chem., 2021, 18, 303–310 CrossRef CAS.
- A. B. A. El-Gazzar, A. S. Aly, M. E. A. Zaki and H. N. Hafez, Phosphorus, Sulfur Silicon Relat. Elem., 2008, 183, 2119–2138 CrossRef CAS.
- F. Usama, S. G. Rasha, Y. Ahmed and H. E.-G. Dina, Pharmacogn. J., 2021, 13(2), 550–562 Search PubMed.
- T. H. Althuis, P. F. Moore and H. J. Hess, J. Med. Chem., 1979, 22, 44–48 CrossRef CAS PubMed.
- J. Liu, R. Cao, M. Xu, X. Wang, H. Zhang, H. Hu, Y. Li, Z. Hu, W. Zhong and M. Wang, Cell Discovery, 2020, 6, 16 CrossRef CAS PubMed.
- S. Shah, S. Das, A. Jain, D. P. Misra and V. S. Negi, Int. J. Rheum. Dis., 2020, 23, 613–619 CrossRef CAS PubMed.
- J. Geleris, Y. Sun, J. Platt, J. Zucker, M. Baldwin, G. Hripcsak, A. Labella, D. K. Manson, C. Kubin, R. G. Barr, M. E. Sobieszczyk and N. W. Schluger, N. Engl. J. Med., 2020, 382, 2411–2418 CrossRef CAS PubMed.
- Merck News Release: Merck and Ridgeback’s Molnupiravir Receives U.S. FDA Emergency Use Authorization for the Treatment of High-Risk Adults With Mild to Moderate COVID-19, https://www.merck.com/news/merck-and-ridgebacks-molnupiravir-receives-u-s-fda-emergency-use-authorization-for-the-treatment-of-high-risk-adults-with-mild-to-moderate-covid-19/ Search PubMed.
- GOV. UK, First oral antiviral for COVID-19 Lagevrio (molnupiravir), approved by MHRA, https://www.gov.uk/government/news/first-oral-antiviral-for-covid-19-lagevrio-molnupiravir-approved-by-mhra Search PubMed.
- Sun Pharma, Sun Pharma receives DCGI approval for Molxvir® (Molnupiravir) in India, https://sunpharma.com/wp-content/uploads/2021/12/Press-Release-Sun-Pharma-receives-DCGI-approval-for-Molxvir-Molnupiravir-in-India.pdf Search PubMed.
- R. K. Hussein and H. M. Elkhair, J. Mol. Struct., 2021, 1231, 129979 CrossRef CAS PubMed.
- G. Singh, M. Pawan, S. Diksha, S. Priyanka, A. Saini and A. Kaur, J. Mol. Struct., 2022, 1250, 131858 CrossRef CAS PubMed.
- A. Chhetri, S. Chettri, P. Rai, D. K. Mishra, B. Sinha and D. Brahman, J. Mol. Struct., 2021, 1225, 129230 CrossRef CAS PubMed.
- C. Shivanika, S. Deepak Kumar, V. Ragunathan, P. Tiwari, A. Sumitha and P. Brindha Devi, J. Biomol. Struct. Dyn., 2022, 40, 585–611 CrossRef CAS PubMed.
- M. Vijayakumar, B. Janani, P. Kannappan, S. Renganathan, S. Al-Ghamdi, M. Alsaidan, M. A. Abdelaziz, A. Peer Mohideen, M. Shahid and T. Ramesh, Saudi J. Biol. Sci., 2022, 29, 18–29 CrossRef CAS PubMed.
- O. Noureddine, N. Issaoui and O. Al-Dossary, J. King Saud Univ., Sci., 2021, 33, 101248 CrossRef PubMed.
- A. S. Kazachenko, F. Akman, H. Abdelmoulahi, N. Issaoui, Y. N. Malyar, O. Al-Dossary and M. J. Wojcik, J. Mol. Liq., 2021, 342, 117475 CrossRef CAS.
- A. Sagaama, S. A. Brandan, T. Ben Issa and N. Issaoui, Heliyon, 2020, 6, e04640 CrossRef PubMed.
- S. Gatfaoui, A. Sagaama, N. Issaoui, T. Roisnel and H. Marouani, Solid State Sci., 2020, 106, 106326 CrossRef CAS.
- H. A. Younus, M. Al-Rashida, A. Hameed, M. Uroos, U. Salar, S. Rana and K. M. Khan, Expert Opin. Ther. Pat., 2021, 31, 267–289 CrossRef CAS.
- A. Zare, N. Lotfifar and M. Dianat, J. Mol. Struct., 2020, 1211, 128030 CrossRef CAS.
- R. Singha, P. Basak, M. Bhattacharya and P. Ghosh, ChemistrySelect, 2020, 5, 6514–6525 CrossRef CAS.
- H. Sepehrmansouri, M. Zarei, M. A. Zolfigol, A. R. Moosavi-Zare, S. Rostamnia and S. Moradi, Mol. Catal., 2020, 481, 110303 CrossRef CAS.
- A. Gholami, M. Mokhtary and M. Nikpassand, Dyes Pigm., 2020, 180, 108453 CrossRef CAS.
- Z. Karami and M. M. Khodaei, Res. Chem. Intermed., 2022, 48, 1773–1792 CrossRef CAS.
- A. Zare and M. Dianat, Z. Naturforsch. B, 2021, 76, 85–90 CrossRef CAS.
- S. Esmaili, A. R. Moosavi-Zare and A. Khazaei, RSC Adv., 2022, 12, 5386–5394 RSC.
- Y. M. Elkholy and M. A. Morsy, Molecules, 2006, 11(11), 890–903 CrossRef CAS.
- A. A. Harutyunyan, S. G. Israyelyan, H. A. Panosyan, M. R. Hakobyan and T. R. Hovsepyan, Russ. J. Org. Chem., 2019, 55, 1896–1901 CrossRef CAS.
- J. Quiroga, J. Trilleras, B. Insuasty, R. Abonía, M. Nogueras, A. Marchal and J. Cobo, Tetrahedron Lett., 2010, 51, 1107–1109 CrossRef CAS.
- H. M. Diab, M. E. Salem, I. A. Abdelhamid and A. H. M. Elwahy, Monatsh. Chem., 2021, 152, 967–976 CrossRef CAS.
- A. Upadhyay, L. K. Sharma, V. K. Singh and R. K. P. Singh, Tetrahedron Lett., 2016, 57, 5599–5604 CrossRef CAS.
- D. M. Patel, H. J. Patel, J. M. Padrón and H. M. Patel, RSC Adv., 2020, 10, 19600–19609 RSC.
- M. G. Sharma, J. Pandya, D. M. Patel, R. M. Vala, V. Ramkumar, R. Subramanian, V. K. Gupta, R. L. Gardas, A. Dhanasekaran and H. M. Patel, Polycyclic Aromat. Compd., 2021, 41, 1495–1505 CrossRef CAS.
- R. M. Vala, M. G. Sharma, D. M. Patel, A. Puerta, J. M. Padrón, V. Ramkumar, R. L. Gardas and H. M. Patel, Arch. Pharm., 2021, 354, 2000466 CrossRef CAS PubMed.
- D. M. Patel and H. M. Patel, ACS Sustainable Chem. Eng., 2019, 7, 18667–18676 CrossRef CAS.
- D. M. Patel, R. M. Vala, M. G. Sharma, D. P. Rajani and H. M. Patel, ChemistrySelect, 2019, 4, 1031–1041 CrossRef CAS.
- H. M. Patel, Green Sustainable Chem., 2015, 5, 137 CrossRef CAS.
- M. J. Frisch, G. W. Trucks, H. B. Schlegel, G. E. Scuseria, M. A. Robb, J. R. Cheeseman, G. Scalmani, V. Barone, G. A. Petersson, H. Nakatsuji, X. Li, M. Caricato, A. V. Marenich, J. Bloino, B. G. Janesko, R. Gomperts, B. Mennucci, H. P. Hratchian, J. V. Ortiz, A. F. Izmaylov, J. L. Sonnenberg, D. Williams-Young, F. Ding, F. Lipparini, F. Egidi, J. Goings, B. Peng, A. Petrone, T. Henderson, D. Ranasinghe, V. G. Zakrzewski, J. Gao, N. Rega, G. Zheng, W. Liang, M. Hada, M. Ehara, K. Toyota, R. Fukuda, J. Hasegawa, M. Ishida, T. Nakajima, Y. Honda, O. Kitao, H. Nakai, T. Vreven, K. Throssell, J. A. Montgomery Jr, J. E. Peralta, F. Ogliaro, M. J. Bearpark, J. J. Heyd, E. N. Brothers, K. N. Kudin, V. N. Staroverov, T. A. Keith, R. Kobayashi, J. Normand, K. Raghavachari, A. P. Rendell, J. C. Burant, S. S. Iyengar, J. Tomasi, M. Cossi, J. M. Millam, M. Klene, C. Adamo, R. Cammi, J. W. Ochterski, R. L. Martin, K. Morokuma, O. Farkas, J. B. Foresman and D. J. Fox, Gaussian 16 Revision C.01, Gaussian, Inc., Wallingford CT, 2016 Search PubMed.
- D. Roy, T. A. Keith and J. M. Millam, GaussView, Version 6, Semichem Inc., Shawnee Mission, KS, 2016 Search PubMed.
- P. R. Spackman, M. J. Turner, J. J. McKinnon, S. K. Wolff, D. J. Grimwood, D. Jayatilaka and M. A. Spackman, J. Appl. Crystallogr., 2021, 54, 1006–1011 CrossRef CAS PubMed.
- V. Tandon, R. M. Vala, A. Chen, R. L. Sah, H. M. Patel, M. C. Pirrung and S. Banerjee, Biosci. Rep., 2022, 42, BSR20212721 CrossRef CAS.
- M. F. Adasme, K. L. Linnemann, S. N. Bolz, F. Kaiser, S. Salentin, V. J. Haupt and M. Schroeder, Nucleic Acids Res., 2021, 49, W530–W534 CrossRef CAS PubMed.
- I. Tankov, R. Yankova, S. Genieva, M. Mitkova and D. Stratiev, J. Mol. Struct., 2017, 1139, 400–406 CrossRef CAS.
- R. G. Parr, L. v. Szentpály and S. Liu, J. Am. Chem. Soc., 1999, 121, 1922–1924 CrossRef CAS.
|
| This journal is © The Royal Society of Chemistry 2022 |
 Open Access Article
 a,
Ruturajsinh M. Vala
 a,
Paras J. Patel
 a,
Dipti B. Upadhyay
 a,
V. Ramkumarb,
Ramesh L. Gardas
 b and
Hitendra M. Patel
 *a
*a
![[thin space (1/6-em)]](https://www.rsc.org/images/entities/char_2009.gif) :
:![[thin space (1/6-em)]](https://www.rsc.org/images/entities/char_2009.gif) ethyl acetate (70
ethyl acetate (70![[thin space (1/6-em)]](https://www.rsc.org/images/entities/char_2009.gif) :
:![[thin space (1/6-em)]](https://www.rsc.org/images/entities/char_2009.gif) 30, v/v) as the mobile phase. After complete consumption of starting material, the reaction mixture was cooled at room temperature and poured into 30 mL of cold water. The obtained crude product was filtered and dried in an oven. Further purification, the crude product was stirred in 10 mL ice-cold diethyl ether to obtain pure product.
30, v/v) as the mobile phase. After complete consumption of starting material, the reaction mixture was cooled at room temperature and poured into 30 mL of cold water. The obtained crude product was filtered and dried in an oven. Further purification, the crude product was stirred in 10 mL ice-cold diethyl ether to obtain pure product.

![[1 with combining macron]](https://www.rsc.org/images/entities/char_0031_0304.gif) with a = 6.1119(17) Å, b = 12.856(3) Å, c = 13.503(2) Å, V = 990.8(4) Å3, Z = 2, density = 1.340 g cm−3, and linear absorption coefficient 0.220 mm−1. Compound 4b crystallises in monoclinic system, space group P21/n with a = 11.3367(6) Å, b = 13.5799(7) Å, c = 13.0546(6) Å, V = 1901.73(17) Å3, Z = 4, density = 1.276 g cm−3, and linear absorption coefficient 0.087 mm−1. Compound 4c crystallises in monoclinic system, space group P21/n with a = 12.5837(13) Å, b = 13.0752(17) Å, c = 13.0356(16) Å, V = 2004.4(4) Å3, Z = 4, density = 1.310 g cm−3, and linear absorption coefficient 0.091 mm−1. Compound 4d crystallises in monoclinic system, space group P21/n with a = 12.2403(6) Å, b = 13.3075(7) Å, c = 12.8408(7) Å, V = 1975.65(18) Å3, Z = 4, density = 1.344 g cm−3, and linear absorption coefficient 0.221 mm−1. Full crystallographic data and structure refinement of 4(a–d) showed in Table 3. Fig. 2–5 show ORTEP view of crystal structures and molecular packing generated by Mercury.
with a = 6.1119(17) Å, b = 12.856(3) Å, c = 13.503(2) Å, V = 990.8(4) Å3, Z = 2, density = 1.340 g cm−3, and linear absorption coefficient 0.220 mm−1. Compound 4b crystallises in monoclinic system, space group P21/n with a = 11.3367(6) Å, b = 13.5799(7) Å, c = 13.0546(6) Å, V = 1901.73(17) Å3, Z = 4, density = 1.276 g cm−3, and linear absorption coefficient 0.087 mm−1. Compound 4c crystallises in monoclinic system, space group P21/n with a = 12.5837(13) Å, b = 13.0752(17) Å, c = 13.0356(16) Å, V = 2004.4(4) Å3, Z = 4, density = 1.310 g cm−3, and linear absorption coefficient 0.091 mm−1. Compound 4d crystallises in monoclinic system, space group P21/n with a = 12.2403(6) Å, b = 13.3075(7) Å, c = 12.8408(7) Å, V = 1975.65(18) Å3, Z = 4, density = 1.344 g cm−3, and linear absorption coefficient 0.221 mm−1. Full crystallographic data and structure refinement of 4(a–d) showed in Table 3. Fig. 2–5 show ORTEP view of crystal structures and molecular packing generated by Mercury.
![[1 with combining macron]](https://www.rsc.org/images/entities/char_0031_0304.gif)


