
Core-satellite assembly of gold nanoshells on solid gold nanoparticles for a color coding plasmonic nanosensor†
Nguyen H.
Le
a,
Nicole
Cathcart
 ab,
Vladimir
Kitaev
b and
Jennifer I. L.
Chen
*a
ab,
Vladimir
Kitaev
b and
Jennifer I. L.
Chen
*a
aDepartment of Chemistry, York University, 4700 Keele Street Toronto, Ontario M3J 1P3, Canada. E-mail: jilchen@yorku.ca
bDepartment of Chemistry and Biochemistry, Wilfrid Laurier University, 75 University Ave. W., Waterloo, Ontario N2L 3C5, Canada
First published on 29th November 2021
Abstract
We present core-satellite assemblies comprising a solid gold nanoparticle as the core and hollow decahedral gold nanoshells as satellites for tuning the optical properties of the plasmonic structure for sensing. The core-satellite assemblies were fabricated on a substrate via the layer-by-layer assembly of nanoparticles linked by DNA. We used finite-difference time-domain simulations to help guide the geometrical design, and characterized the optical properties and morphology of the solid-shell nanoparticle assemblies using darkfield microscopy, single-nanostructure spectroscopy, and scanning electron microscopy. Plasmon coupling yielded resonant peaks at longer wavelengths in the red to near-infrared range for solid-shell assemblies compared with solid–solid nanoparticle assemblies. We examined sensing with the solid-shell assemblies using adenosine triphosphate (ATP) as a model target and ATP-aptamer as the linker. Binding of ATP induced disassembly and led to a decrease in the scattering intensity and a color change from red to green. The new morphology of the core-satellite assembly enabled plasmonic color-coding of multiplexed sensors. We demonstrate this potential by fabricating two types of assemblies using DNA linkers that target different molecules – ATP and a model nucleic acid. Our work expands the capability of chip-based plasmonic nanoparticle assemblies for the analysis of multiple, different types of biomolecules in small sample sizes including the microenvironment and single cells.
Introduction
Colorimetric sensors based on single or coupled plasmonic nanoparticles (NPs) are explored for sensing and point-of-care diagnostics because of their low cost, rapid optical response, ease of manipulation, photostability, and simple data acquisition and analysis. Plasmonic NPs exhibit unique optical properties arising from their localized surface plasmon resonance (LSPR). Upon interaction with light, the free electrons on the surface of the NP undergo a collective coherent oscillation, leading to an enhancement of the electromagnetic field near the NP surface and strong light scattering and absorption. The LSPR depends on the size, shape, and the refractive index at the metal-dielectric interface. A spectral shift of plasmon resonance driven by refractive index changes underpins the main mechanism employed in many sensing applications.1,2 Furthermore, extending LSPR-based sensing platforms from bulk colloidal solutions3,4 and films to discrete individual nanostructures5,6 yields several advantages, including high sensitivity, low sample volume, and low detection limit.7–10 Chip-based sensors are also desirable for multiplexing and portability.11In NP assemblies or complex nanostructures, the LSPR of individual building blocks can couple, creating new plasmon modes12 that yield electromagnetic field hot spots and shifts in the LSPR peak. The plasmonic coupling can be described by the plasmon hybridization model, pioneered by Nordlander and coworkers,13 where plasmons of individual NPs can hybridize antisymmetrically or symmetrically. The energy of hybridized plasmon depends on the interparticle distance, thereby giving rise to the concept of plasmon ruler14 for monitoring biomolecular interactions.
Besides simple multimers (e.g. dimers or trimers), several complex nanostructures, such as core-satellite assemblies, have been explored for sensing. Recently, we reported core-satellite assemblies with a tunable number of conventional solid Au nanoparticles (AuNPs) functionalized with reconfigurable DNA linkers.15 The AuNP assemblies exhibited a red-shifted LSPR (ca. 600 nm) and high scattering intensity due to the coupled plasmon modes16 and changes in the dielectric environment.17–19 The LSPR of assemblies depends not only on the interparticle separation distance20,21 and the number of NPs (i.e. aggregate size), but also on the LSPR energy of the core and satellite constituents. Previous works on compositionally heterogeneous core-satellite assemblies explored silver and gold NPs.18,21,22 The binary Ag–Au assemblies displayed two distinct plasmon bands due to the off-resonant coupling between the LSPR of AgNP (400 nm) and AuNP (550 nm), in contrast to the broad single resonance observed in Au–Au core-satellite assemblies. The shifts in the second LSPR band (at 560 nm) from the hybridization of the dipolar AgNP and AuNP modes were much less prominent compared with that in the Au–Au system because of the mismatch in LSPR energy.18 For interparticle separation distance of tens of nm where useful sensing modalities can be derived, plasmon hybridization theory23 suggests that a lower energy of the hybridized plasmon mode (>650 nm) may be achieved by coupling with nanoshells that resonate at a lower energy than solid AuNP.
Herein, we investigate a new morphology of NP assemblies comprising building blocks both of gold but with different structures – namely solid AuNP as the core and Au nanoshells as the satellites – with the goal of extending the hybridized plasmon mode to deep red and near-infrared (NIR) wavelengths for sensing applications. We examined the optical response of the assemblies theoretically and experimentally and carried out morphological studies. We used reconfigurable DNA-aptamers as linkers to derive sensing performance where binding of the target (ATP) leads to disassembly and changes in the scattered light, which can be readily captured by darkfield microscopy and rapidly analyzed via image processing. Furthermore, as a proof of concept, we fabricated a duplex sensing chip by constructing NP assemblies that target either ATP24 or a model nucleic acid25 in a common area. In combination with a low-cost portable imaging device and color identification through machine learning, the development of different types of coupled nanostructures may enable cost-effective sensing of multiple targets in small sample volumes.
Results and discussion
Design of core-satellite assemblies with nanoshells on solid core NP
To guide the design of the solid-shell assembly, we employed finite-difference time-domain (FDTD) modelling. FDTD methods have been extensively applied to study the optical properties of materials. The simulations are based on modeling the behavior of the electromagnetic wave by exploiting the time and position dependence of Maxwell's equations in rectangular 3D cells of finite volume (i.e. Yee cells).26 We first examined the optical properties of Au nanoshells intending to achieve an LSPR peak near 700 nm. The LSPR of Au nanoshell can be tuned from visible to IR region by tuning the shell thickness and overall particle size;27,28 experimentally, nanoshells >100 nm in size have been studied extensively, but less so for <50 nm size range which is needed for the proposed core-satellite structure. Fig. S1a† shows the simulated scattering spectra of Au nanoshells of 45 nm in diameter with various shell thicknesses; the LSPR peak red shifts as the shell thickness decreases, in agreement with the structural dimension dependence reported previously for Au shells of 120 nm in size.27 The simulated result suggests a geometry of Au nanoshell with 45 nm in diameter and 4–5 nm in shell thickness as suitable for our goal of obtaining a LSPR at ∼700 nm to provide a large enough spectral shift from that of conventional AuNP assemblies while staying within the responsivity range of a typical Si-based detector with a near-infrared filter, as well as having the structures be synthetically accessible. Fig. 1a shows the simulated scattering spectra of solid-shell assemblies with an incremental number of spherical Au nanoshells randomly placed around the Au core; the LSPR peak red shifts and increases in scattering intensity with an increasing number of satellite particles. Fig. 1b compares the simulated scattering spectra of two types of core-satellite assemblies: both consist of solid 60 nm AuNP as the core but with different types of satellite NPs – solid 30 nm AuNP vs. 45 nm Au nanoshells (5 nm thickness). The two types of structures are referred to as solid–solid vs. solid-shell assemblies, respectively. The solid-shell assemblies exhibit a 130 nm redshift in the LSPR from that of single solid AuNP; in contrast, conventional solid–solid assemblies exhibit a redshift of 50 nm. Notably, the scattering cross-section of the solid-shell assembly is much higher than the solid–solid assembly because of the high quality factor of plasmon resonance strength of Au at long wavelengths. In Au solid–solid assemblies, the redshift of the radiant mode of the LSPR results from the plasmon hybridization between core and satellite NPs.16 Because the LSPR of the Au nanoshell is much lower in energy than solid AuNP, this difference leads to off-resonant coupling, in which the main LSPR energy of the solid-shell assembly is determined by that of the Au nanoshell. The off-resonant coupling with additional small red shifts (Fig. S1b and c†) is similar to the plasmon hybridization between solid NPs of Ag and Au.29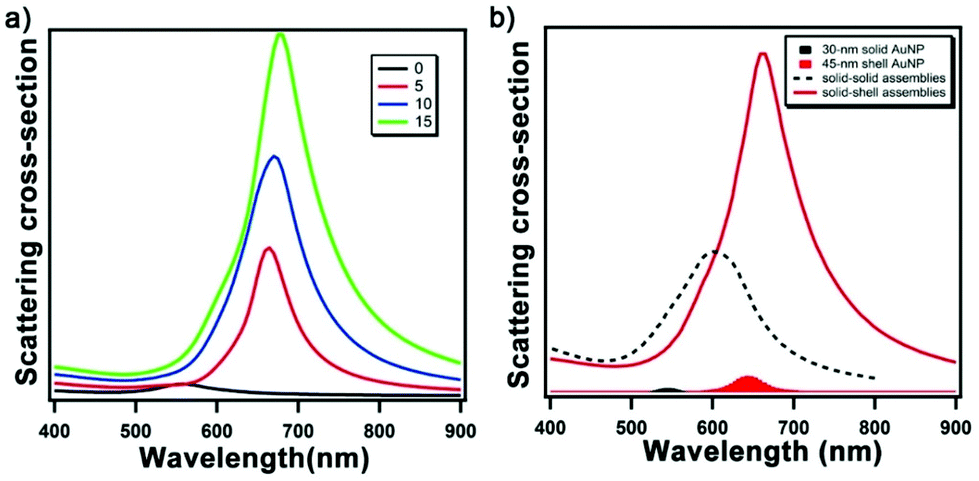 | ||
| Fig. 1 FDTD-simulated scattering spectra of AuNP core-satellite assemblies. (a) Solid-shell assemblies with 0 to 15 satellite nanoshells. (b) Scattering spectra of conventional solid–solid assembly (dashed black line, 40 satellite AuNPs) vs. solid-shell assembly (red line, 15 satellite nanoshells). Scattering spectra of the respective satellite nanoparticles, 30 nm solid AuNP (shaded in black) and 45 nm Au shell with 5.5 nm thickness (shaded in red), are shown for reference. | ||
Synthesis and characterization of gold nanoshells
We synthesized Au nanoshells with the desired geometry identified from the FDTD simulation. The conventional synthesis of spherical Au nanoshells utilizes silica NPs as templates, on top of which gold seeds would be attached as nucleation sites for the further reduction of Au3+ ions to form an Au layer.27 This method in previous reports yielded Au nanoshells of 80 and 150 nm in diameter and thicknesses of >10 nm. However, the desired diameter and thickness of the nanoshell for the assemblies identified by the FDTD simulation proved challenging to achieve using the Au-seeded method. There were limited nucleation sites for the growth of the Au layer that yielded rough and incomplete shelling, and the ineffective charge repulsion of small template particles also led to aggregation.30 Instead, we used AgNPs as templates and carried out a galvanic replacement by gold to yield hollow Au nanoshells. Moreover, decahedral AgNPs were chosen over quasi-spherical particles for templating because of the narrow bandwidth of the plasmon absorption peak, high extinction, uniformity, and monodispersity.31Fig. 2a shows representative TEM images of decahedral Au nanoshells; the average diameter is 44 ± 2 nm with a thickness of 6 ± 1 nm. Colloidal decahedral Au nanoshells exhibit absorbance at 637 nm while the LSPR scattering peaks for individual nanoshells vary between 620–680 nm (Fig. 2b) as measured by single-nanostructure spectroscopy. Fig. 2c shows the distribution of the scattering peaks, which arises from variations in size, shape, roughness, and partial stellation of the shell structure.31 Notably the LSPR of the nanoshell and the assembly are extremely sensitive to the ratio of thickness to the overall size (Fig. S1 and S2†).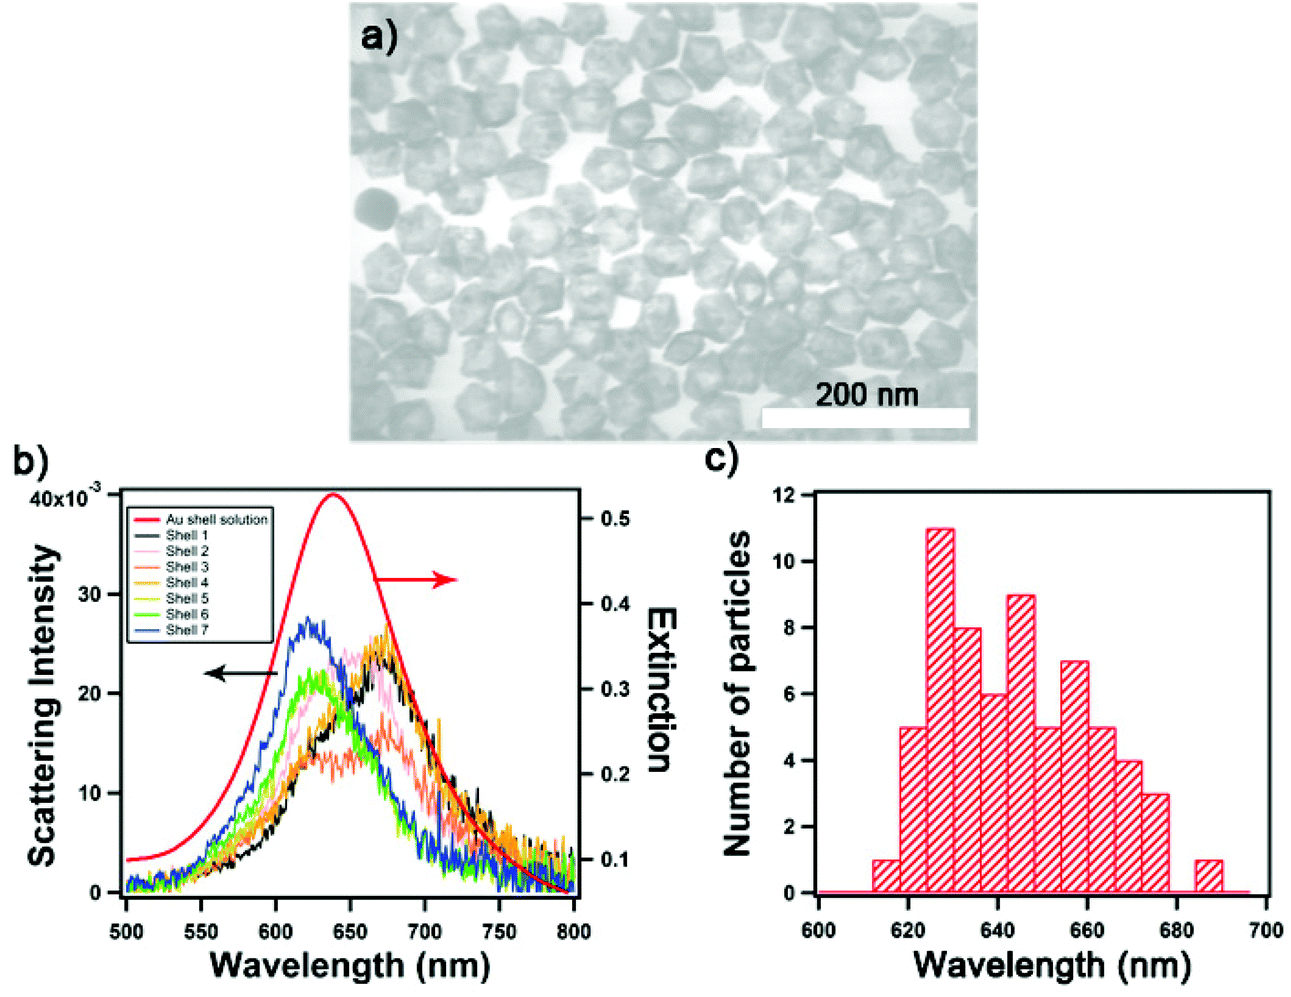 | ||
| Fig. 2 Characterization of decahedral Au nanoshells. (a) Representative TEM image of gold nanoshells, (b) scattering spectra of seven individual Au nanoshells (deposited on a substrate measured in water) overlaid with the extinction spectrum of the colloids (red), and (c) distribution of the LSPR peak values of Au nanoshells obtained from single-nanostructure spectroscopy (N = 60). | ||
We functionalized two samples of decahedral Au nanoshells with DNA sequences denoted as Seq 1 and Seq 2 using the pH-assisted method.32 This method promotes the adsorption of thiolated DNA strands, and was followed by salt aging to maximize the DNA loading. We observed a LSPR redshift of ca. 5 nm for Au nanoshells upon functionalization with thiolated DNA, as shown in Fig. S3,† consistent with a change of the refractive index on the plasmonic NP surface.1,33 We examined the loading of Seq 1 and Seq 2 on Au nanoshells using a fluorescence technique.34 At maximum loading, Seq 2 was more densely packed at 961 strands/NP compared to Seq 1 at 749 strands/NP (Table S1†). The DNA loading on Au nanoshells is much higher than solid 30 nm AuNP (410 Seq 1-strands/NP and 234 Seq 2-strands/NP), more than expected from the difference in size. We hypothesized that Au nanoshells may exhibit a high surface area because of the grains and roughness of the structure and also the accessible internal surface. These DNA-functionalized Au nanoshells were subsequently explored as satellite NPs for the layer-by-layer assembly.
Fabrication of solid-shell assemblies
We fabricated the assemblies via a layer-by-layer process using DNA linkers, as established in the previous work.15 Briefly, 60 nm Au solid NP cores were firstly anchored on a substrate, followed by the layer build-up of Au shell satellites through DNA linkers, which have 9 complementary base pairs between Seq 1 (ATP-aptamer) and Seq 2. The process yielded a tunable number of Au nanoshells surrounding the Au solid core NP. Fig. 3a and b shows the environmental-scanning electron microscopy (E-SEM) images of the assemblies; the 3D core-satellite morphology was evident when imaged under low vacuum. We then performed correlated darkfield optical microscopy and electron microscopy at high manification. Fig. 3c shows SEM images of 5 assemblies with two layers of Au satellite nanoshells. To achieve high imaging resolution, we needed to operate SEM at high-vacuum condition that led to the drying and collapse of the 3D structure, consistent with observations of previous studies.15,24 The collapse of the structures, serendipitously, facilitated the analysis of the number of satellite nanoshells. The corresponding darkfield scattering spectra of the assemblies are shown in Fig. 3d. Fig. S4† shows additional data of 30 solid-shell assemblies where the number of satellite nanoshells varied from 3 to 20. The darkfield scattering spectra of the solid-shell assemblies (Fig. 3d) shows that the LSPR peak red shifts from 562 nm of a solid Au core to 672 nm–850 nm upon assembling with 2 layers of satellite nanoshells. This shift is significantly larger in magnitude than that of solid–solid assemblies, which is in agreement with the simulated data;16,18 however, significantly variable spectral shapes of the LSPR were observed for solid-shell assemblies (Fig. 3d and Fig. S4†). We hypothesized that during DNA hybridization, the unevenly distributed DNA density on the surface of the decahedral shape may affect the cooperativity and repulsion effects, leading to variations in the efficiency of the self-assembly process. The size, shape, clustering, and number of satellite nanoshells lead to differences in plasmon coupling and spectral broadening; notably, the most prominent factor is the uniformity and thickness of the nanoshells. Our FDTD simulations showed that a small difference of 1–2 nm in shell thickness of satellites situated at different positions within an assembly led to significant changes in the scattering spectra (Fig. S2†). Despite the spectral variations, a linear relationship between the spectral-integrated scattering intensity of the assemblies and the number of satellite nanoshells was observed, as shown in Fig. 3e; a similar trend is also observed for scattering intensity extracted from darkfield image pixels Fig. 3f summarizes the ability to tune the scattered intensity by controlling the assembly size through the layer-by-layer process.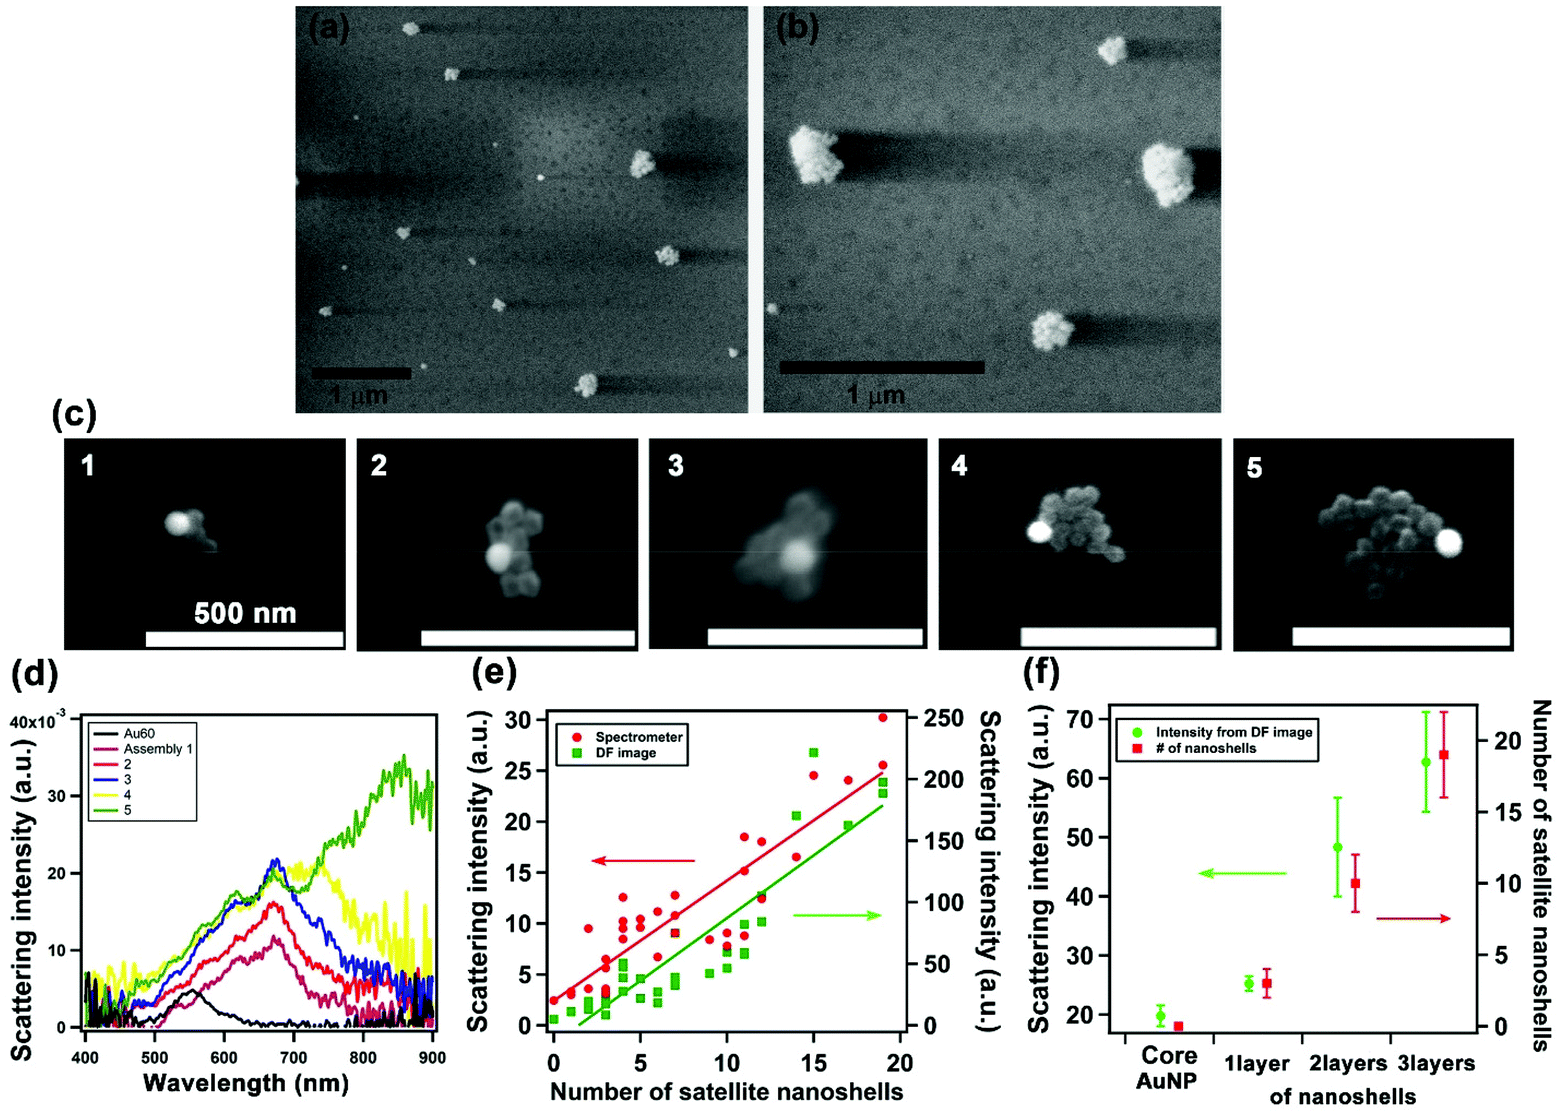 | ||
| Fig. 3 Morphological characterization and correlated SEM and single-nanostructure spectroscopy. (a and b) Environmental SEM images (under low vacuum) of assemblies showing the 3D structures; (c) high-magnification SEM images (under high vacuum) of 5 solid-shell assemblies (scale bar: 500 nm) and (d) their respective scattering spectra with that of 60 nm core AuNP shown in black. (e) Linear relationship between the scattering intensity and the number of Au satellite nanoshells for 31 assemblies: data from integrated scattering spectra (400–900 nm) shown in red and that from darkfield image analysis shown in green; (f) summary of average scattering intensity from darkfield images and number of satellite nanoshells with respect to the layer-by-layer assembly process (errors are standard deviations). | ||
Darkfield imaging and color analysis
Next, we compare the colorimetric optical response of solid-shell vs. solid–solid assemblies in the darkfield images. For solid–solid assemblies, the darkfield images evolve from dimly green scatterers (Fig. 4a and b), corresponding to single solid core AuNPs (60 nm), to bright yellow scatterers upon the attachment of solid satellite NPs (Fig. 4c), consistent with previous reports.15,24 In contrast, bright reddish scatterers were observed upon hybridizing with Au nanoshells (Fig. 4d). The assemblies with two layers of Au satellite nanoshells were most distinguishable in darkfield images. We extrapolated the scattering intensity of each assembly from darkfield images, which enable high-throughput analysis. Fig. 4e shows the distribution of the scattering intensities of 645 assemblies with solid satellite NPs and 661 assemblies with Au satellite nanoshells. Because of the limited sensitivity of the camera at the long wavelengths (see Fig. S5†), the intensity of the solid-shell assemblies captured was low. We analyzed the scattering light color of single plasmonic assemblies using the HSI (hue, saturation, intensity) model,35 where the hue value describes the color in the form of an angle ranging from 0 to 360 degrees corresponding to the color wheel that spans from red (0 degrees) to magenta (300 degrees). The distributions of the color, expressed in hue, for 750 solid–solid assemblies and 735 solid-shell assemblies are shown in Fig. 4f. When fitted to Gaussian distributions, the hue value of the solid–solid assemblies is centered at 68 degrees scattering yellow compared with 46 degrees for the solid-shell assemblies scattering reddish color. With the hue value of the core AuNP centered at 84 degrees, a greater color change, as indicated by a larger magnitude in ΔHue, between the assembled and disassembled (i.e. core AuNP) structures is obtained for the solid-shell assemblies (|ΔHue| = 49 degrees) in comparison with solid–solid assemblies (|ΔHue| = 27 degrees). The difference in the colorimetric response of solid–solid vs. solid-shell assemblies opens the opportunity for the development of color-coded multiplexed chip-based sensors.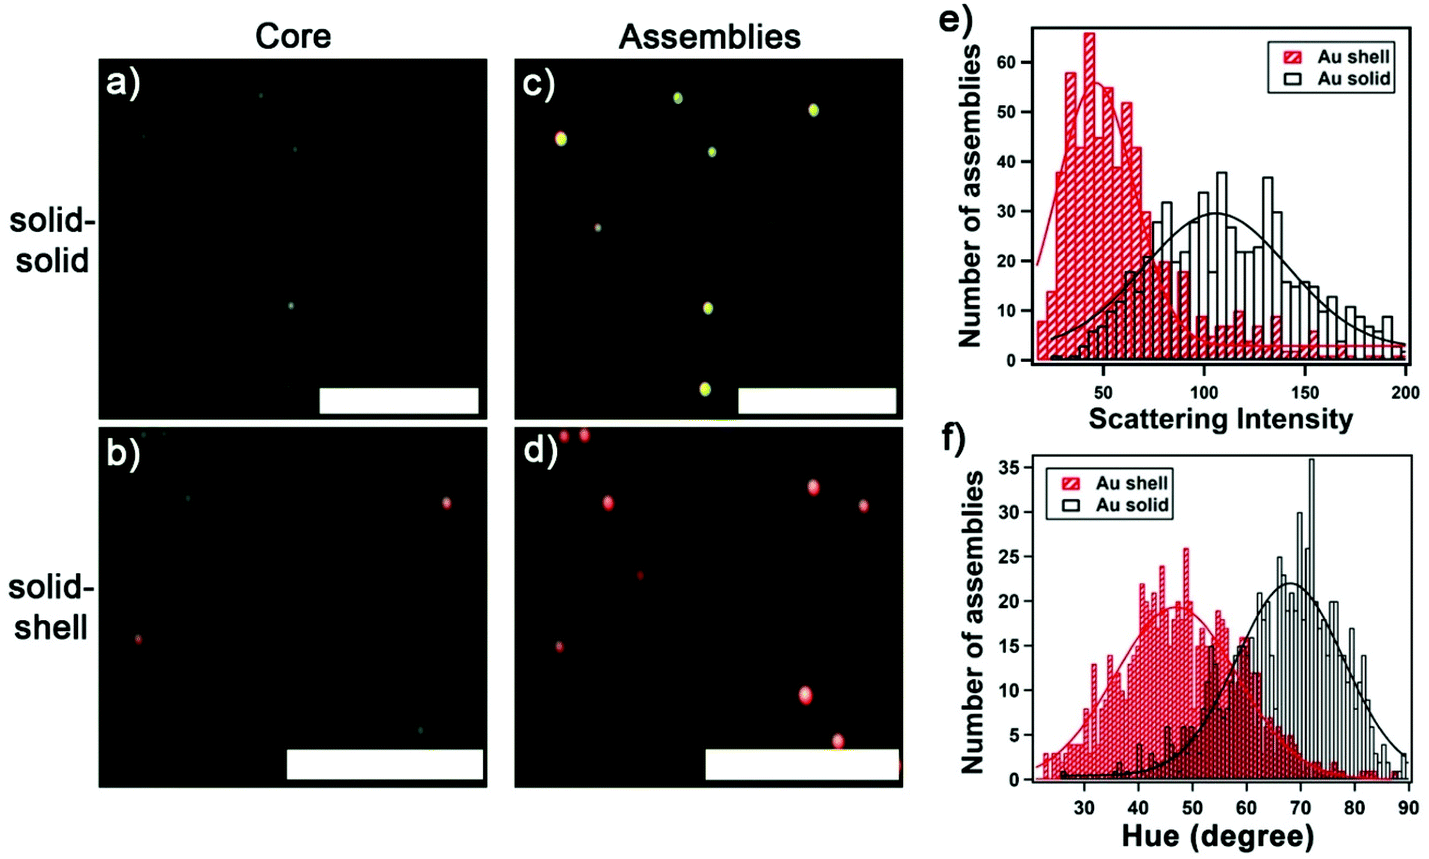 | ||
| Fig. 4 Darkfield microscopy characterization of solid–solid vs. solid-shell assemblies. Darkfield images of 60 nm core AuNP (a and b) and after three cycles of layer-by-layer assembly with (c) 30 nm solid AuNP, or (d) 45 nm decahedral nanoshells. (e) Distribution of scattering intensity of solid–solid (N = 645) vs. solid-shell (N = 641) assemblies obtained from darkfield image extrapolation. (f) Color distribution, expressed as hue in degrees, of light scattered by solid–solid (N = 750) vs. solid-shell (N = 735) assemblies. Distributions were obtained from three independent samples and fits are Gaussian distributions. Scale bar: 10 μm. | ||
Sensing ATP via disassembly
We examined the detection of the model target ATP using the solid-shell assemblies. All sensing data were obtained from darkfield image analysis. Fig. 5a and b shows the darkfield images of solid-shell assemblies in the buffer and 200 mM of ATP, respectively. The aptamer undergoes a structural change upon ATP binding, leading to the dehybridization of the linkers, the disassembly of the structure, and a decrease in the scattering intensity.15,24 Notably, the color of the scattered light changes from red to green for the solid-shell assemblies upon disassembly, which is more prominent than the solid–solid assemblies (i.e. yellow to green). We examined both the scattering intensity and the hue values of the assemblies at various concentrations of ATP from the pixels of darkfield images to establish the calibration curves in Fig. 5c. We fitted the calibration curves to a one-site binding hyperbola model, assuming that the two binding sites of the aptamer are equal, to obtain apparent dissociation constants (Kd) of 14 ± 2 mM and 18 ± 3 mM for detection based on intensity and hue, respectively (see Table S2† for parameters). The apparent dissociation constant of solid-shell assemblies is higher than that of solid–solid assemblies (1.9 ± 0.3 mM, see Fig. S6†). This difference may have arisen because of the higher loading of DNA on nanoshells, where we measured a 2.3- and 3.2-fold increase for Seq 1 and Seq 2, respectively (see Table S1†). The limit of detection (LOD) for solid-shell assemblies, calculated from three times the standard deviation of either the scattering intensity or hue of the blank, is 3.2 mM and 3.7 mM respectively. Analysis based on intensity over hue is preferred because it is faster, has higher sensitivity, and is more straightforward. Additionally, using scattering intensity as the detection signal further eliminates potential redshift effects arising from molecular adsorption (i.e. refractive index changes). The physiological level of ATP of interest is in the range of 0.1 to 3.0 mM,36 which coincides with the most sensitive part of the calibration curve. Further improvements on the detection limit may be achieved by tuning buffer composition and DNA density,37 splitting nucleic fragments,38 or modifying the target binding site.39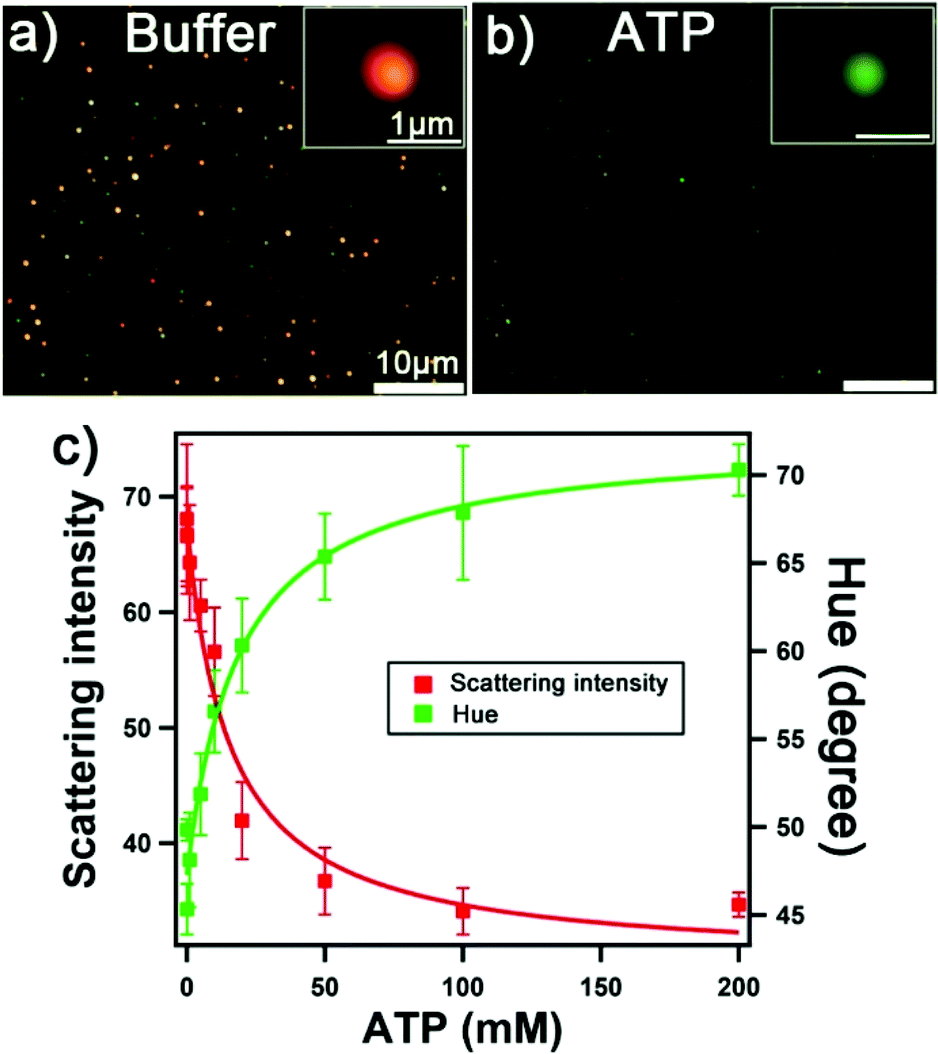 | ||
| Fig. 5 Disassembly process for sensing ATP monitored by darkfield microscopy. Darkfield images of solid-shell assemblies in (a) buffer and (b) with 200 mM ATP. (c) Concentration dependence of scattering intensity and hue. Error bars are standard deviations of triplicate samples. | ||
Multiplexing
Next we demonstrate the incorporation of different types of assemblies (i.e. solid–solid and solid-shell), and therefore different colored scatterers, for multiplexing. We fabricated a mixture of NP assemblies on a common sensing area for two different target biomolecules: ATP and the deoxy analog of microRNA-210 (denoted as DNA-210). MicroRNA-210-3p (hsa-miR-210-3p) is a regulator for numerous biological processes including cell proliferation, apoptosis, differentiation, angiogenesis, and mitochondrial metabolism.40 It is also a biomarker for hypoxia-related diseases such as preeclampsia. MiRNA-210 can be detected using core-satellite assemblies by incorporating DNA linkers that undergo the strand displacement reaction, as demonstrated previously.25Scheme 1 depicts the duplexed NP assemblies of different morphology. We first constructed the DNA-210-targeting solid–solid assemblies followed by ATP-targeting solid-shell assemblies. The optical response of two different assemblies is distinguishable and can be visualized in darkfield microscopy as shown in Fig. 6a (see also Fig. S7†). The green and red circles outline the assemblies targeting DNA-210 and ATP, respectively. Because of the spectral sensitivity of the color camera (peak sensitivity at 550 nm), the signals at >700 nm were poorly captured. A NIR-sensitive camera would improve the signal intensity when different types of assemblies are co-employed. Nevertheless, the discernible difference in the scattered color between solid–solid and solid-shell assemblies is supported by the color-code analysis shown in Fig. S6.† The initial hue values were 72 ± 4 degrees for solid–solid assemblies and 55 ± 3 degrees for solid-shell assemblies obtained from the replicate samples. This color difference in the initial scattering can be used as a color code to identify the analyte targets in a mixture of NP assemblies. The optical response of two different assemblies was subsequently used for multiplexed sensing.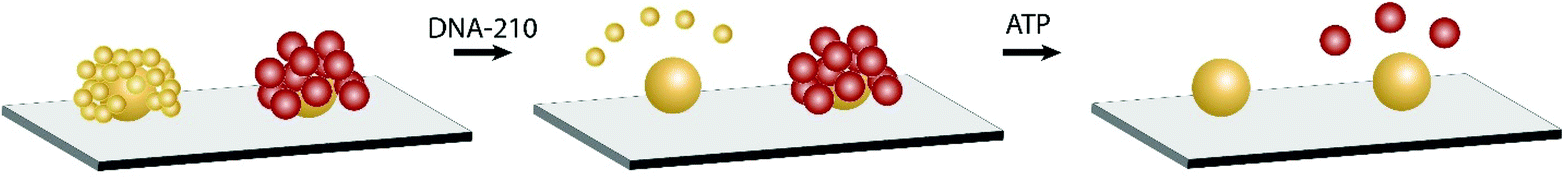 | ||
| Scheme 1 Selective disassembly of duplexed nanosensors comprising DNA-210- and ATP-targeting assemblies. | ||
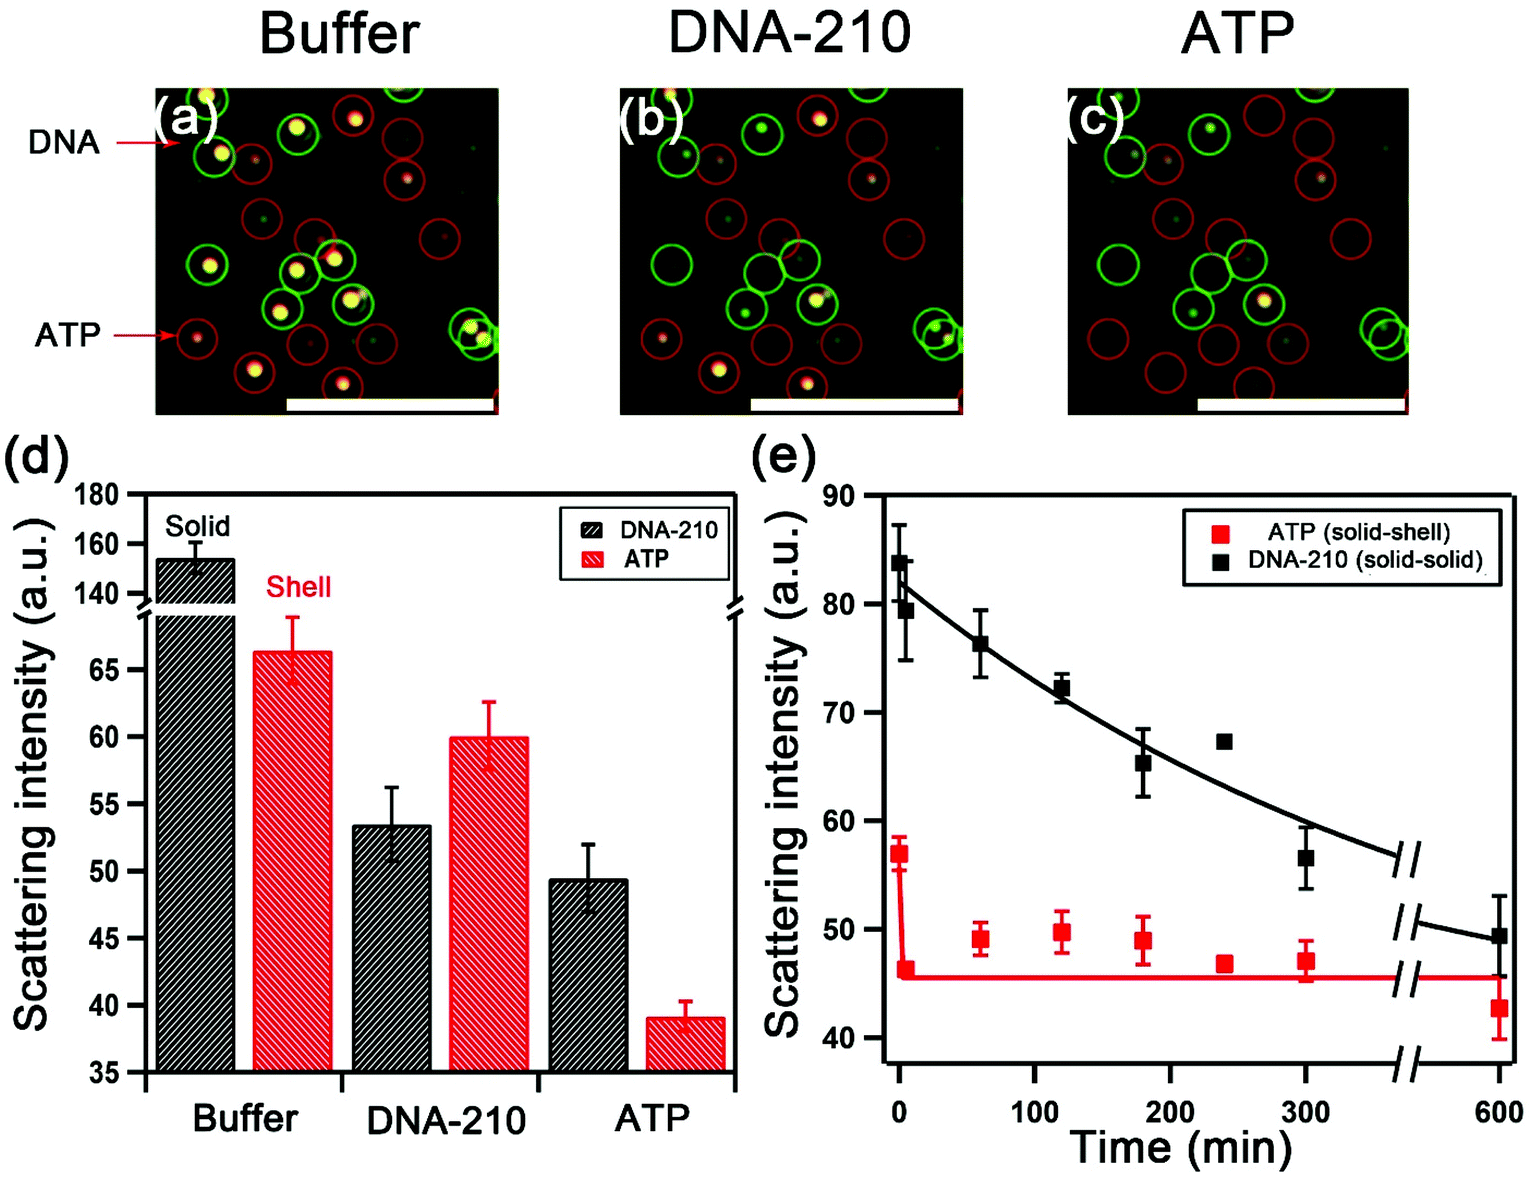 | ||
| Fig. 6 Duplexed sensing platform comprising DNA-210 (solid–solid) and ATP-targeting (solid-shell) assemblies. Darkfield images of sensing experiment: (a) duplexed assemblies in the buffer; (b) after incubation with excess DNA-210; and (c) after addition of excess ATP. Scale bar: 10 μm. (d) Scattering intensity of the two classes of assemblies in buffer and upon the sequential addition of DNA-210 followed by ATP (at 0.12 M NaCl phosphate buffer). Error bars are standard deviations of triplicate samples. (e) Kinetics of disassembly of the duplex assemblies in 0.10 M NaCl phosphate buffer containing a mixture of the targets. | ||
We examined the selectivity of the duplexed sensors. Fig. 6a shows the darkfield images of DNA-210- and ATP-targeting assemblies in the optimized buffer condition in the same sensing area. The introduction of DNA-210 only led to the disassembly of DNA-210-targeting solid–solid assemblies (outlined in green) with a decrease in their scattering intensity from 154 to 53, but a negligible change in the scattering intensity of ATP-targeting Au shell assemblies was detected (Fig. 6b). The subsequent addition of ATP caused the disassembly of ATP sensors (outlined in red) as shown in Fig. 6c. Fig. 6d summarizes the changes in the scattering intensity of the assemblies demonstrating the selective response to the targets. Furthermore, Fig. 6e shows the time-dependent scattering signal of the duplex sensor in a mixture of ATP and DNA-210 at a buffer composition that maximizes the kinetics difference: the scattering intensity of the ATP solid-shell assemblies exhibited a fast decrease in contrast with the long decay of the DNA-210-targeting solid–solid assemblies. This finding demonstrates that the kinetics of disassembly of the two types of structures by a small molecule ATP compared with a nucleic acid for strand-displacement can provide another path for differentiation. By tuning the optical properties with different morphologies of satellite NPs, the discrete NP assemblies with different colors can serve as barcodes for colorimetric assay. Our work presents the opportunity to develop multiplex chip-based plasmonic sensors combining different morphologies and biomolecular linker design.
Conclusions
We demonstrated tunable optical properties of plasmonic core-satellite NP assemblies by incorporating Au nanoshells as satellites. Plasmon hybridization was tuned by changing the morphology and the number of satellites decorated on a single core, as studied experimentally and theoretically. Plasmon coupling between the Au solid core and Au shell satellites leads to enhanced scattering intensity and LSPR peak beyond 650 nm. The detection of ATP was achieved through target-induced dehybridization of DNA linkers and by analyzing changes in the scattering intensity or color of the plasmonic structures in darkfield images. As a proof of concept, we employed two types of assemblies to color-code the duplexed detection of ATP and a nucleic acid target. We envision that the development of plasmonic sensing chips based on highly scattering single nanostructures, when coupled with the portable imaging system, may enable simple and low-cost bioanalysis. The solid-shell assemblies may also be of interest in other fields that seek to amplify the electromagnetic fields in the red or NIR wavelengths, such as surface-enhanced Raman scattering and solar energy conversion, and for in vivo applications where exploiting the NIR transparent window in biological systems is critical.Methods
Materials
Colloidal solid quasi-spherical AuNP solutions were purchased from BBI Solutions. Illustra NAP-5 columns were purchased from GE Healthcare Life Sciences. Water used for all experiments was deionized to >18 MΩ using a Millipore system. Methoxy polyethylene glycols-succinimidyl valerate (mpeg-SVA) was purchased from LaysanBio. Sulfosuccinimidyl acetate was purchased from Thermo Fisher Scientific. 4-(2-Hydroxyethyl)-1-piperazineethanesulfonic acid (HEPES), silver nitrate (99%), sodium citrate tribasic dihydrate (99.5%), L-arginine (98%), sodium borohydride (>99%), hydrogen peroxide with the potassium stannate inhibitor 30–32 wt%, 99.999% trace metal basis, and tetrachloroauric acid (99%) were purchased from Sigma Aldrich. Poly(vinylpyrrolidone) (PVP, Mw = 40![[thin space (1/6-em)]](https://www.rsc.org/images/entities/char_2009.gif) 000) was supplied by Caledon Chemicals (Caledon, Canada). Oligonucleotides were purchased from Integrated DNA Technologies.
000) was supplied by Caledon Chemicals (Caledon, Canada). Oligonucleotides were purchased from Integrated DNA Technologies.
![[A with combining low line]](https://www.rsc.org/images/entities/char_0041_0332.gif)
![[G with combining low line]](https://www.rsc.org/images/entities/char_0047_0332.gif)
![[T with combining low line]](https://www.rsc.org/images/entities/char_0054_0332.gif)
![[C with combining low line]](https://www.rsc.org/images/entities/char_0043_0332.gif) CA A10 SH-3′ (aptamer)
CA A10 SH-3′ (aptamer)
Seq 2: 5′ – A AAA AAA AAA SH-3′
AC GCA CAG-3′
Seq 4: 5′ – HS AA AAA AAA AAGCA -3′
Seq 5 (cap): – 5′-TGT CAC TGC-3′
DNA-210 (target): 5′-CTG TGC GTG TGA CAG CGG CTG A-3′
Preparation of gold decahedral nanoshells
Gold nanoshells were prepared in a three-stage procedure by coating decahedral AgNPs with gold twice, adapted from the previously reported syntheses.31,41 First, AgNP templates were prepared by combining 1.7 mM tricitrate, 0.05 mM PVP, 0.016 mM arginine, 0.13 mM silver nitrate, and 1.29 mM sodium borohydride in 14 mL of water in a 20 mL borosilicate glass vial under stirring with a magnetic stir bar (12.7 by 3.2 mm). After 1 hour of stirring at 400 rpm, the pale-yellow solution darkened, and 0.2 M hydrogen peroxide was added. Following the hydrogen peroxide addition, the solution bubbled for approximately 10 minutes, the stir bar was removed, the vial was capped, and then exposed to a 450 nm LED for 14 hours. Second, 10 mol% Au plated AgNPs were prepared by adding 3 mL of a 0.013 mM solution of HAuCl4 to 3 mL of the AgNP solution with a syringe pump at a rate of 0.25 mL h−1, under stirring (400 rpm with 12.7 by 3.2 mm stir bar). A 5 mL syringe attached to Teflon tubing (PTFE #18, AWG, Cole Parmer) with ethylene-vinyl acetate hot glue was used to dispense the gold solution from a KD Scientific pump. Finally, gold nanoshells, 80 mol% Au relative to Ag in AgNPs, were prepared by adding the remaining 70 mol% Au (0.09 mM HAuCl4) by syringe under the same conditions as 10 mol% Au coating. LED and syringe pump setups are given in supplementary by Cathcart et al.31Functionalization of nanoshells with DNA
Seq 1- and Seq 2-functionalized 45 nm decahedral Au nanoshells were prepared from previously established method for ATP detection with modifications.24 Briefly, a volume of 10–20 μL of purified oligonucleotides (with ∼0.1 OD at 260 nm) was mixed with 100 μL of Au nanoshells for 30 min on a thermal shaker (40 °C, 650 rpm). A volume of 2 μL of 500 mM citrate buffer (pH 3) was added to lower the pH for 5 minutes and brought back to neutral by adding 20 μL of 500 mM HEPES (pH 7.4).32 The NaCl concentration was slowly increased to 0.3 M at 0.1 M interval every 20 min. The sample was incubated for 4 h at 0.3 M NaCl. The DNA–AuNPs were washed three times with 0.01% SDS and stored in a buffer (0.01 M phosphate buffer (PB), 0.05 M NaCl, 0.01% sodium dodecyl sulfate (SDS), and 0.01% sodium azide) at 4 °C. Seq 3- and Seq 4-functionalized 30 nm AuNPs were prepared for DNA-210 detection as previously established.25Fabrication of core-satellite assemblies as chip-based sensors
The procedure was adapted from previous work15 and briefly described below.To prevent non-specific binding of the satellite NPs on the amino-modified glass coverslip, the remaining amino groups were passivated using 5 mM mPEG-succinimidyl valerate solution in 0.1 M bicarbonate buffer (pH of 8.3) for 4 hours. Then the coverslip was treated with a 0.2 M solution of sulfo-NHS-acetate (sulfosuccinimidyl acetate, Thermo Scientific) in 0.1 M bicarbonate buffer (pH 8.3) for 4 hours. The sample was rinsed with water and dried with compressed air.
Fabrication of core-satellite assemblies as chip-based duplexed sensors
Darkfield imaging, spectroscopy and analysis
Nanostructures in the sample area (100 × 100 μm2) were visualized under darkfield using a Nikon TE-2000U inverted microscope fitted with a darkfield condenser at 60× objective magnification with an optional 1.5× lens. The microscope was connected to a CCD camera (Jenoptik) and a portable spectrometer (USB2000, Ocean Optics) via an optical fiber (diameter 100 μm). For single-nanostruscture scattering spectroscopy, a lamp reference spectrum was obtained by measuring defocused, scattered white light from a piece of kimwipe. The raw scattered spectrum of a nanostructure was measured at 90× magnification using custom Labview software and a PInano positioning stage (P-545, Physik Instrumente). The raw spectrum was subtracted by the dark spectrum and subsequently divided by the reference spectrum to yield the processed data. Darkfield images were captured at 60× magnification with an integration time of 200 ms and converted to 8-bit JPEG grayscale for intensity analysis. All image analysis was carried out using Igor as established previously. Briefly, the coordinates of the center of the assemblies were identified by using the Localizer toolkit in Igor and the intensity of the surrounding 81 pixels for each assembly was averaged. For color-code analysis, the RGB intensity was extrapolated from the original color darkfield images. The hue value of a pixel was calculated from RGB information using the equation35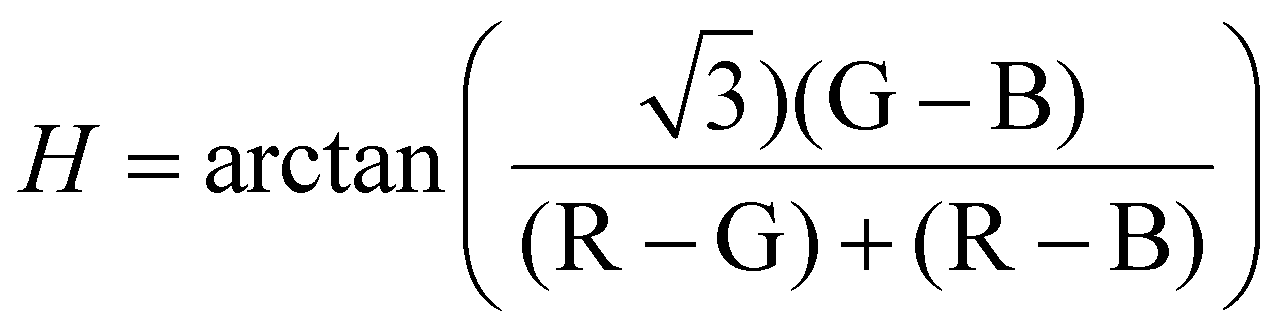 . The average hue value of 81 pixels was calculated.
Finite-difference time-domain simulation
Theoretical modeling of the optical properties of the assembly was simulated using a three-dimensional finite-difference time-domain (FDTD) method with commercially available software (Lumerical FDTD Solutions, Ansys Lumerical Software ULC). All calculations were performed using a mesh size of 1 nm. The structures of the nanoshells were created by using a spherical Au particle overlaid with an etch material. Assemblies were created by randomly positioning 45 nm nanoshells of Au (with various shell thicknesses from 3 nm to 7 nm) around the top of a 60 nm diameter Au sphere. The distance between the closest particles was 10 nm.15 Scattering spectra were simulated with a total-field scattered-field source for linearly polarized incident plane wave. Unpolarized spectra were obtained from the sum of the spectra with 0- and 90-degree polarizations. The background index was set to 1.33 simulating water.Morphological characterization
A Quanta FEG 250 electron microscope operating at 10.0 kV at low vacuum (E-SEM mode) was used to obtained images at low magnification, and at high vacuum standard mode for correlative SEM-darkfield microscopy study. The assemblies were fabricated on an indium tin oxide-coated (ITO) substrate. The approximate locations of the solid-shell assemblies were identified via conductive ink markings at the edge of the substrate, and a collage of darkfield optical images was captured for correlating the structures found in the SEM.Conflicts of interest
There are no conflicts to declare.Acknowledgements
Funding is supported by NSERC Discovery Grant, Accelerator Supplement and Research Tool Infrastructure to JILC, NSERC postdoctoral fellowship to NC, and NSERC Discovery Grant and CFI JELF to VK. The authors thank I. Gourevich (University of Toronto) and M. Jaklewicz for technical support with SEM imaging.References
- K. A. Willets and R. P. Van Duyne, Annu. Rev. Phys. Chem., 2007, 58, 267–297 CrossRef CAS.
- N. Cathcart and J. I. L. Chen, Anal. Chem., 2020, 92, 7373–7381 CrossRef CAS PubMed.
- R. Elghanian, J. J. Storhoff, R. C. Mucic, R. L. Letsinger and C. A. Mirkin, Science, 1997, 277, 1078–1081 CrossRef CAS.
- J. Liu and Y. Lu, Angew. Chem., Int. Ed., 2006, 45, 90–94 CrossRef CAS PubMed.
- J. R. Waldeisen, T. Wang, B. M. Ross and L. P. Lee, ACS Nano, 2011, 5, 5383–5389 CrossRef CAS PubMed.
- Y. Jun, S. Sheikholeslami, D. R. Hostetter, C. Tajon, C. S. Craik and A. P. Alivisatos, Proc. Natl. Acad. Sci. U. S. A., 2009, 106, 17735–17740 CrossRef CAS.
- T. Xie, C. Jing and Y. T. Long, Analyst, 2017, 142, 409–420 RSC.
- M. A. Van Dijk, A. L. Tchebotareva, M. Orrit, M. Lippitz, S. Berciaud, D. Lasne, L. Cognet and B. Lounis, Phys. Chem. Chem. Phys., 2006, 8, 3486–3495 RSC.
- M. D. Sonntag, J. M. Klingsporn, A. B. Zrimsek, B. Sharma, L. K. Ruvuna and R. P. Van Duyne, Chem. Soc. Rev., 2014, 43, 1230–1247 RSC.
- L. B. Sagle, L. K. Ruvuna, J. A. Ruemmele and R. P. Van Duyne, Nanomedicine, 2011, 6, 1447–1462 CrossRef CAS PubMed.
- J.-F. Masson, Analyst, 2020, 145, 3776–3800 RSC.
- E. Prodan and P. Nordlander, J. Chem. Phys., 2004, 120, 5444–5454 CrossRef CAS PubMed.
- P. Nordlander, C. Oubre, E. Prodan, K. Li and M. I. Stockman, Nano Lett., 2004, 4, 899–903 CrossRef CAS.
- C. Sönnichsen, B. M. Reinhard, J. Liphardt, A. P. Alivisatos, C. Sonnichsen, B. M. Reinhard, J. Liphard and A. P. Alivisatos, Nat. Biotechnol., 2005, 23, 741–745 CrossRef PubMed.
- N. H. Le, B. K. Nguyen, G. Ye, C. Peng and J. I. L. Chen, ACS Sens., 2017, 2, 1578–1583 CrossRef CAS PubMed.
- R. P. M. Höller, M. Dulle, S. Thomä, M. Mayer, A. M. Steiner, S. Förster, A. Fery, C. Kuttner and M. Chanana, ACS Nano, 2016, 10, 5740–5750 CrossRef PubMed.
- D. S. Sebba, J. J. Mock, D. R. Smith, T. H. LaBean and A. A. Lazarides, Nano Lett., 2008, 8, 1803–1808 CrossRef CAS PubMed.
- D. S. Sebba, T. H. Labean and A. A. Lazarides, Appl. Phys. B: Lasers Opt., 2008, 93, 69–78 CrossRef CAS.
- I. Choi, H. D. Song, S. Lee, Y. I. Yang, T. Kang and J. Yi, J. Am. Chem. Soc., 2012, 134, 12083–12090 CrossRef CAS.
- J. J. Storhoff, A. A. Lazarides, R. C. Mucic, C. A. Mirkin, R. L. Letsinger and G. C. Schatz, J. Am. Chem. Soc., 2000, 122, 4640–4650 CrossRef CAS.
- J. H. Yoon, J. Lim and S. Yoon, ACS Nano, 2012, 6, 7199–7208 CrossRef CAS PubMed.
- J. H. Yoon, Y. Zhou, M. G. Blaber, G. C. Schatz and S. Yoon, J. Phys. Chem. Lett., 2013, 4, 1371–1378 CrossRef CAS.
- E. Prodan, C. Radloff, N. J. Halas and P. Nordlander, Science, 2003, 302, 419–422 CrossRef CAS PubMed.
- N. H. Le, G. Ye, C. Peng and J. I. L. Chen, Analyst, 2020, 145, 2586–2594 RSC.
- G. Ghotra, N. H. Le, H. Hayder, C. Peng and J. I. L. Chen, Can. J. Chem., 2021, 99, 585–593 CrossRef CAS.
- J. Zhao, A. O. Pinchuk, J. M. McMahon, S. Li, L. K. Ausman, A. L. Atkinson and G. C. Schatz, Acc. Chem. Res., 2008, 41, 1710–1720 CrossRef CAS PubMed.
- S. J. Oldenburg, R. D. Averitt, S. L. Westcott and N. J. Halas, Chem. Phys. Lett., 1998, 288, 243–247 CrossRef CAS.
- S. J. Oldenburg, J. B. Jackson, S. L. Westcott and N. J. Halas, Appl. Phys. Lett., 1999, 75, 2897–2899 CrossRef CAS.
- S. Sheikholeslami, Y. W. Jun, P. K. Jain and A. P. Alivisatos, Nano Lett., 2010, 10, 2655–2660 CrossRef CAS PubMed.
- M. R. Rasch, K. V. Sokolov and B. A. Korgel, Langmuir, 2009, 25, 11777–11785 CrossRef CAS PubMed.
- N. Cathcart, J. I. L. Chen and V. Kitaev, Langmuir, 2018, 34, 612–621 CrossRef CAS PubMed.
- X. Zhang, M. R. Servos and J. Liu, J. Am. Chem. Soc., 2012, 134, 10–13 Search PubMed.
- P. K. Jain, W. Huang and M. A. El-sayed, Nano Lett., 2007, 7, 2080–2088 CrossRef CAS.
- L. M. Demers, C. A. Mirkin, R. C. Mucic, R. A. Reynolds, R. L. Letsinger, R. Elghanian and G. Viswanadham, Anal. Chem., 2000, 72, 5535–5541 CrossRef CAS PubMed.
- J. Zhou, G. Lei, L. L. Zheng, P. F. Gao and C. Z. Huang, Nanoscale, 2016, 8, 11467–11471 RSC.
- T. W. Traut, Mol. Cell. Biochem., 1994, 140, 1–22 CrossRef CAS PubMed.
- G. Ghotra, B. K. Nguyen and J. I. L. Chen, ACS Appl. Nano Mater., 2020, 3, 10123–10132 CrossRef CAS.
- C. Zhu, Y. Zhao, M. Yan, Y. Huang, J. Yan, W. Bai and A. Chen, Anal. Bioanal. Chem., 2016, 408, 4151–4158 CrossRef CAS PubMed.
- Z. Zhang, O. Oni and J. Liu, Nucleic Acids Res., 2017, 4567, 2–10 Search PubMed.
- A. Bavelloni, G. Ramazzotti, A. Poli, M. Piazzi, E. Focaccia, W. Blalock and I. Faenza, Anticancer Res., 2017, 37, 6511–6521 CAS.
- N. Murshid, D. Keogh and V. Kitaev, Part. Part. Syst. Charact., 2014, 31, 178–189 CrossRef CAS.
Footnote |
| † Electronic supplementary information (ESI) available: FDTD simulations, SEM and darkfield images, sensing data and fitting parameters. See DOI: 10.1039/d1an01421h |
| This journal is © The Royal Society of Chemistry 2022 |