The application of Ni and Cu-MOFs as highly efficient catalysts for visible light-driven tetracycline degradation and hydrogen production†
Received
6th October 2020
, Accepted 15th November 2020
First published on 16th November 2020
Abstract
Two coordination polymers, {[Cu3(tib)4(NO3)4(H2O)]·2NO3·2.96H2O}n (1) and {[Ni(tib)2]·2NO3}n (2), were synthesized by a solvothermal reaction using a flexible tripodal ligand, 1,3,5-tris(imidazol-1-ylmethyl)benzene (TIB), and metal salts; the polymers were characterized by X-ray diffraction, Fourier transform infrared spectroscopy, thermogravimetric analysis, X-ray photoelectron spectroscopy and UV-vis diffuse reflectance spectra. The two complexes exhibited excellent active performance for photodegradation of tetracycline (TC) and photocatalytic hydrogen evolution under visible light. Control experiments revealed clearly that the pH value plays an important role in TC degradation, especially in alkaline solution; 93.21% of tetracycline was degraded by complex 1 within 60 min. In addition, using a Pt cocatalyst, the visible-light-driven photocatalytic H2 evolution rate of complex 2 reached 681.66 μmol h−1 g−1. Moreover, the photocatalysts can remain stable and retain high photocatalytic activity after several cycles of reuse. These MOF-based photocatalysts will provide new efforts for environmental purification and hydrogen evolution.
Introduction
In the process of tackling the problems of environmental remediation and energy crisis, to enable the practical use of photocatalysts in environmental and clean energy areas, one of the most significant missions is finding efficient photocatalysts that operate well under solar light.1 Therefore, nanostructured semiconductors have been attracting tremendous attention. Common semiconductors such as TiO2, ZnO, ZnS, and CdS have demonstrated to be active catalysts for the photodegradation of organic pollutants and photocatalytic H2 production; however, their photocatalytic properties are limited by their photo-corrosion and large band gaps. The band gaps of TiO2, ZnO and ZnS are 3.2 eV, 3.2 eV and 3.6 eV, respectively, and their utilization of solar energy is greatly limited because ultraviolet light accounts only 3–5% of the composition of sunlight.2 Although the gap width (2.42 eV) of CdS is narrow and has good absorption in the visible region, its photocatalytic activity is worse because of its strong photo-corrosion.3 Recently, noble metals such as Pt, Pd, Ag, Ce and Au have been deposited on the surface of these semiconductors to improve these shortcomings.4–8 However, the cost of these catalysts is much higher, and they can cause some pollution of the environment. Notably, modified carbon nanomaterials (CNMs), such as fullerenes, carbon nanotubes, graphene, carbon nanofibers and carbon quantum dots, have been widely reported as photocatalysts owing to their stability and abundance in nature.9–14 Presently, the development of stable, highly efficient and low-cost photocatalysts is still a great challenge.
Metal–organic frameworks (MOFs) are crystalline porous materials with periodic network structures formed by the self-assembly of inorganic metal centers (metal ions or metal clusters) and bridged organic ligands.15,16 Owing to their advantages of diverse synthesis methods, large specific surface areas, multi-channels and adjustable chemical properties, MOFs have received great attention in gas storage, drug transport, fluorescent probes, separation and catalysis.17–21 Compared with traditional inorganic semiconductor photocatalysts (TiO2, ZnO, CdS, WO3, etc.), photoactive MOFs have the following advantages: (1) the intrinsic porosity can facilitate the diffusion of organic pollutants and products through the open channels, which is essential for high photocatalytic reaction efficiency; (2) the modular nature of the synthesis of the MOFs allows the rational design and fine tuning of this new class of photocatalysts at the molecular level, hence the electronic structure of MOF photocatalysts is easily tuned; (3) versatile synthetic strategies, including solvothermal, vapor diffusion, emulsion-assistant precipitation, and ultrasonication, allow a high degree of crystalline quality and numerous morphologies of MOF photocatalysts.22 Since the year 2007 when Garcia et al. first discovered that MOF-5 had the property of photocatalytic degradation of phenol,23 increasing numbers of MOF-based photocatalysts have been invented and reported; for example, Cu, Zn, Co and Cd-MOFs were used as photocatalysts to degrade organic pollutants and produce hydrogen.24–30 Although these reported results are impressive and attest that the photocatalytic properties of MOFs can solve environmental pollution and energy problems, the development and investigation of the multifunctional MOFs is still in the initial stage.
Although some MOFs using TIB ligand have been reported, research of their photocatalytic properties is limited. In this work, the new coordination polymers {[Cu3(tib)4(NO3)4(H2O)]·2NO3·2.96H2O}n (1) and {[Ni(tib)2]·2NO3}n (2) were obtained and fully characterized. The optical properties of complexes 1 and 2 indicated that they have semiconductor-like properties, and the matched conduction and valence bands are suitable for photocatalysis. TC was used as a target pollutant to explore the photocatalytic performance of complexes 1 and 2, and their various influencing factors and catalytic mechanisms were studied in depth. In addition, the complexes exhibited excellent photocatalytic activity for H2 production from water splitting under visible light.
Experimental section
Materials and methods
Cu(NO3)2·2H2O, Ni(NO3)2·6H2O, CH3CH2OH, CH3OH, C2H3N, C14H10O4(BPO), CHCl3, C4H4BrNO2(NBS), C6H15O3N(TEOA), C4H10O(t-BuOH), C6H14, HCl and NaOH were purchased from Sinopharm Chemical Reagent Co., Ltd, (China). Imidazole, C40H30N10O6·2Cl (NBT) and 1,3,5-trimethylbenzene were purchased from Aladdin (Shanghai, China). Methylene blue was purchased from Merck (India). All the reagents used for the syntheses and analyses were purchased from commercial sources, and the solvents were dried with molecular sieves before being used. The ligand 1,3,5-tris(imidazole-1-yl-methyl) benzene was synthesized by referring to reported procedures.31,32
Synthesis
Synthesis of {[Cu3(tib)4(NO3)4(H2O)]·2NO3·2.96H2O}n, 1.
A mixture containing Cu(NO3)2·2H2O (24.2 mg, 0.1 mmol), TIB (31.8 mg, 0.1 mmol), MeOH (3.0 mL), and H2O (2.0 mL) was sealed into a 25.0 mL Teflon-lined autoclave and heated at 120 °C for 24 h, then cooled to 25 °C slowly. The green cube crystals of complex 1 were collected, washed with water and MeOH three times, and dried in a vacuum, with a yield of 80%. Calcd for C72H81.93N30O22.96Cu3: C, 45.02; H, 4.29; N, 21.83%. Found: C, 44.87; H, 4.03; N, 21.51%. IR (KBr pellet cm−1): 3411.08(s), 3126.29(s), 1614.24(m), 1525.33(s), 1378.87(s), 1299.90(s), 1101.82(s), 1034.19(m), 948.66(w), 865.03(m), 742.13(s), 661.49(m) (Fig. S1, ESI†).
Synthesis of {[Ni(tib)2]·2NO3}n, 2.
A mixture containing Ni(NO3)2·6H2O (29.1 mg, 0.1 mmol), TIB (31.8 mg, 0.1 mmol), MeOH (2.5 mL) and H2O (2.5 mL) was sealed into a 25.0 mL Teflon-lined autoclave and heated at 120 °C for 24 h, then cooled to room temperature slowly. The regular hexagonal pale green flaky crystals of complex 2 were collected, washed with water and MeOH three times and dried in a vacuum, with a yield of 90% based on TIB. Anal. calcd for C36H36N16O6Ni (819.48): C, 52.89; H, 4.43; N, 27.35%. Found: C, 52.66; H, 4.21; N, 27.01%. IR (KBr pellet cm−1): 3427.09(m), 3127.26(s), 3009.62(m), 1610.08(m), 1524.69(s), 1448.18(m), 1336.25(s), 1240.67(s), 1093.27(s), 1034.48(w), 991.87(w), 935.02(m), 844.20(m), 740.40(s), 665.39(s), 632.96(m) (Fig. S2, ESI†).
Photocatalytic reactions
The photocatalytic activities of the two MOF-based catalysts were investigated by the photocatalytic degradation of tetracycline (TC) under visible light. In detail, 50.0 mL of 30 mg L−1 TC solution was used along with 10.0 mg MOF-based catalyst. In order to investigate the influence of the pH value on the photocatalytic efficiency, the original pH was adjusted to 3, 5, 7, 9 and 11 with NaOH and HCl. The solution was magnetically stirred in a 200 mL beaker in the dark for one hour at room temperature to establish an adsorption–desorption equilibrium. After that, the suspension was irradiated under a 300 W ceramic metal halide lamp (PerkinElmer) with a 420 nm optical filter. Then, 3.0 mL of sample was withdrawn at scheduled time intervals, purified by centrifugation, and analysed by UV-visible spectrophotometry at the absorption wavelength of 357 or 378 nm. The degradation efficiency of the TC was estimated by the following equation:| |  | (1) |
where C and C0 are the apparent and initial concentrations of TC, respectively.
The photocatalytic H2 production experiments were carried out in a sealable quartz reactor with an external-irradiation Pyrex cell. The visible light source was a 300 W xenon lamp (PLS-SXE300C) with a cutoff filter (λ > 420 nm). Typically, 50.0 mg of the as-prepared sample was dispersed in 100 mL aqueous solution containing 50 vol% MeOH. 5.0 mL H2PtCl6 (Pt content: 0.1 mg mL−1) and 15.0 mL triethanolamine (TEOA) were introduced as a cocatalyst and sacrificial agent, respectively. Before light irradiation, the mixture solution was ultrasonicated for 10 min and continuously stirred by a magnetic stirrer. Then, the reactant system was purged with N2 for 20 min to remove air. The amount of hydrogen evolution was analyzed by a gas chromatograph (GC9700, Techcomp) equipped with a thermal conductivity detector (TCD).
Results and discussion
Crystal structure of 1, {[Cu3(tib)4(NO3)4(H2O)]·2NO3·2.96H2O}n
The crystal structure of complex 1 with the numbering scheme is shown in Fig. 1(a). The X-ray diffraction analysis revealed that 1 crystallizes in the triclinic space group P![[1 with combining macron]](https://www.rsc.org/images/entities/char_0031_0304.gif) , and the structure unit contains two Cu2+ (Cu1 and Cu2) ions, two TIBs, one coordination water molecule and two nitrate anions, as well as one free water molecule and one free nitrate anion in the lattice. Each TIB ligand is a tridentate ligand with two different spatial structures (cis, trans, trans; trans). Ligand TIB1 (N10, N12, N14) is only coordinated with Cu1 atom; however, ligand TIB2 (N4, N6, N8) is coordinated with both Cu1 and Cu2 atoms. Each Cu atom is hexacoordinated and adopts a distorted octahedral geometry. Cu1 atom is coordinated with four nitrogen atoms from different TIB ligands (Fig. 1b), and the four nitrogen atoms are in the same plane, with Cu1–N bond distances in the range of 1.99(3)–2.03(3) Å and N–Cu1–N bond angles varying from 87.68(12)° to 177.36(12)°. The apical positions are occupied by two oxygen atoms with Cu1–O10 and Cu1–O4 bond distances of 2.33(3) and 2.733 Å,33 respectively (Table S2, ESI†). Cu2 ion is hexa-coordinated with a heavily elongated octahedron geometry (Fig. 1c), in which the apical positions are occupied by the oxygen atoms arising from two different nitrate anions [Cu(2)–O(1) 2.639 Å]. The basal plane is formed by the four nitrogen atoms from four different TIB ligands with Cu2–N6 and Cu2–N8 bond distances of 1.98(3) and 1.99(3) Å, respectively. The N–Cu2–N bond angles vary from 89.19(1) to 180.00(3)°. In the direction shown in Fig. 1d, TIB1 is connected by Cu2 while TIB2 is connected by Cu1, both of which form two separate 1D chains containing two kinds of 24-membered macrocyclic rings. These two chains are linked by Cu1 to form a 3D structure. In this structure, the relative distribution of TIB1 is shown in Fig. 1e. The distances of Cu1⋯Cu1 are 8.57(8) Å and 12.36(8) Å, respectively. It can be seen clearly that the two benzene ring planes are strictly parallel to each other, and the distance of the two benzene ring planes is 4.98(4) Å (Fig. 1e). Alternatively, the two TIB2 ligands are in a centrally symmetrical position. The distance of Cu2⋯Cu2 is 12.93(6) Å. Due to the coordination interaction of N4 with Cu1, the two kinds of 1D chains are connected alternately, forming a 3D network. To reveal the network clearly, topological analysis was performed (Fig. 1f). The Cu2+ centers are connected by four ligands, which can be considered as 4-connected nodes. The cluster was represented with stoichiometry (3-c)2(3-c)2(4-c)2(4-c), and the point symbol for the net is {4·122}2{42·124}{42·6·123}2{42·6}2{4·122}2{42·124} {42·6·123}2 {42·6}2.
, and the structure unit contains two Cu2+ (Cu1 and Cu2) ions, two TIBs, one coordination water molecule and two nitrate anions, as well as one free water molecule and one free nitrate anion in the lattice. Each TIB ligand is a tridentate ligand with two different spatial structures (cis, trans, trans; trans). Ligand TIB1 (N10, N12, N14) is only coordinated with Cu1 atom; however, ligand TIB2 (N4, N6, N8) is coordinated with both Cu1 and Cu2 atoms. Each Cu atom is hexacoordinated and adopts a distorted octahedral geometry. Cu1 atom is coordinated with four nitrogen atoms from different TIB ligands (Fig. 1b), and the four nitrogen atoms are in the same plane, with Cu1–N bond distances in the range of 1.99(3)–2.03(3) Å and N–Cu1–N bond angles varying from 87.68(12)° to 177.36(12)°. The apical positions are occupied by two oxygen atoms with Cu1–O10 and Cu1–O4 bond distances of 2.33(3) and 2.733 Å,33 respectively (Table S2, ESI†). Cu2 ion is hexa-coordinated with a heavily elongated octahedron geometry (Fig. 1c), in which the apical positions are occupied by the oxygen atoms arising from two different nitrate anions [Cu(2)–O(1) 2.639 Å]. The basal plane is formed by the four nitrogen atoms from four different TIB ligands with Cu2–N6 and Cu2–N8 bond distances of 1.98(3) and 1.99(3) Å, respectively. The N–Cu2–N bond angles vary from 89.19(1) to 180.00(3)°. In the direction shown in Fig. 1d, TIB1 is connected by Cu2 while TIB2 is connected by Cu1, both of which form two separate 1D chains containing two kinds of 24-membered macrocyclic rings. These two chains are linked by Cu1 to form a 3D structure. In this structure, the relative distribution of TIB1 is shown in Fig. 1e. The distances of Cu1⋯Cu1 are 8.57(8) Å and 12.36(8) Å, respectively. It can be seen clearly that the two benzene ring planes are strictly parallel to each other, and the distance of the two benzene ring planes is 4.98(4) Å (Fig. 1e). Alternatively, the two TIB2 ligands are in a centrally symmetrical position. The distance of Cu2⋯Cu2 is 12.93(6) Å. Due to the coordination interaction of N4 with Cu1, the two kinds of 1D chains are connected alternately, forming a 3D network. To reveal the network clearly, topological analysis was performed (Fig. 1f). The Cu2+ centers are connected by four ligands, which can be considered as 4-connected nodes. The cluster was represented with stoichiometry (3-c)2(3-c)2(4-c)2(4-c), and the point symbol for the net is {4·122}2{42·124}{42·6·123}2{42·6}2{4·122}2{42·124} {42·6·123}2 {42·6}2.
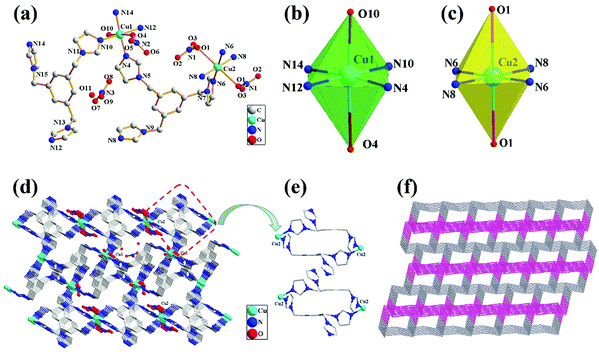 |
| | Fig. 1 (a) Crystal structure of 1 with the atom numbering scheme; (b) the coordination environment of Cu1(II) ions; (c) the coordination environment of Cu2(II) ions; (d) the 3D net structure; (e) the ligand space position of the coordination with Cu2(II) ions; (f) the topological net of complex 1. | |
Crystal structure of 2, {[Ni(tib)2]·2NO3}n
The X-ray diffraction analysis revealed that complex 2 crystallizes in the triclinic space group P![[1 with combining macron]](https://www.rsc.org/images/entities/char_0031_0304.gif) , and the structure unit contains one Ni2+ ion, one TIB, and one nitrate anion in the lattice. The crystal structure of 2 with the numbering scheme is shown in Fig. 2a. The ligand TIB3(N2⋯N4⋯N6) has only one spatial configuration. As shown in Fig. 2b, the Ni center is hexacoordinated and adopts a distorted octahedral geometry; the four nitrogen atoms are in the same plane, and the apical positions are occupied by two nitrogen atoms with Ni–N bond distances in the range of 2.12(4) to 2.13(3) Å and N–Ni–N bond angles varying from 86.44(14)° to 180.00°. Each TIB ligand adopts a cis, cis, cis-conformation coordinating with three Ni atoms and forming a 2D brick network (Fig. 2c). The distance of Ni⋯Ni is 9.71(1) Å, as shown in Table S2 (ESI†). It is interesting that all the benzene ring planes are strictly parallel to each other (Fig. 2c). There are numerous nitrate anions between the 2D brick networks (Fig. 2d), and the 2D brick networks are connected together alternately by hydrogen bond interactions: C–H⋯O–N–O⋯H–C. All of the H-bonding acceptors are from the oxygen atoms of nitrate anions, and the H-bonding donors are from the carbon atoms of the methylene of the ligand. Finally, a 3D network structure is formed.
, and the structure unit contains one Ni2+ ion, one TIB, and one nitrate anion in the lattice. The crystal structure of 2 with the numbering scheme is shown in Fig. 2a. The ligand TIB3(N2⋯N4⋯N6) has only one spatial configuration. As shown in Fig. 2b, the Ni center is hexacoordinated and adopts a distorted octahedral geometry; the four nitrogen atoms are in the same plane, and the apical positions are occupied by two nitrogen atoms with Ni–N bond distances in the range of 2.12(4) to 2.13(3) Å and N–Ni–N bond angles varying from 86.44(14)° to 180.00°. Each TIB ligand adopts a cis, cis, cis-conformation coordinating with three Ni atoms and forming a 2D brick network (Fig. 2c). The distance of Ni⋯Ni is 9.71(1) Å, as shown in Table S2 (ESI†). It is interesting that all the benzene ring planes are strictly parallel to each other (Fig. 2c). There are numerous nitrate anions between the 2D brick networks (Fig. 2d), and the 2D brick networks are connected together alternately by hydrogen bond interactions: C–H⋯O–N–O⋯H–C. All of the H-bonding acceptors are from the oxygen atoms of nitrate anions, and the H-bonding donors are from the carbon atoms of the methylene of the ligand. Finally, a 3D network structure is formed.
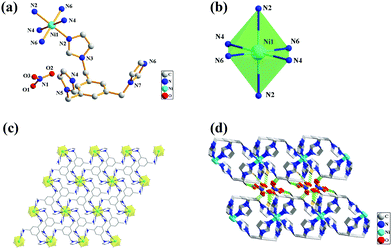 |
| | Fig. 2 (a) Crystal structure of 2 with the atom numbering scheme; (b) the coordination environment of Ni(II) ions; (c) the 2D net structure of the coordination environment of Ni(II) and linkage modes of the ligands; (d) the 3D net structure. | |
Thermal analyses
Thermogravimetric analysis (TGA) was carried out under nitrogen conditions at a heating rate of 10 °C min to estimate the thermal decomposition behavior of complexes 1 and 2 in the temperature range of 30–900 °C (Fig. S3 and S4, ESI†). For complex 1, it was found that there was no significant weight loss up to 248 °C. As the temperature increased, the structure further decomposed until the weight became stable at 760 °C and led to the formation of CuO (experimental 12.46%; calculated 12.03%). For complex 2, there was no obvious weight loss before 354 °C. As the temperature increased, the first weight loss of 89.68% appeared when the sample was heated to 763 °C, and the final 10.32% residue may be NiO (calculated 9.11%).
Photoelectrochemical analyses
In order to better demonstrate the effects of the charge transfer properties of the complexes on their photocatalytic activities, it was necessary to investigate the intrinsic electronic properties and photoelectronic properties of the complexes. As shown in Fig. 3(a), the fast photoelectronic responses illustrate the migration and separation of photoinduced electrons and holes. This result showed that the rate of charge transfer of complex 1 is faster than that of complex 2. Meanwhile, electrochemical impedance spectroscopy (EIS) can illustrate the separation of photogenerated electron–hole pairs and interfacial charge transfer resistance.34 The EIS Nyquist plot presents an arc shape in the measurement results, stimulated by charge migration. A smaller arc radius in the plot suggests that the charge transfer capability is superior. As shown in Fig. 3(b), the arc radius of complex 1 is smaller than that of complex 2.
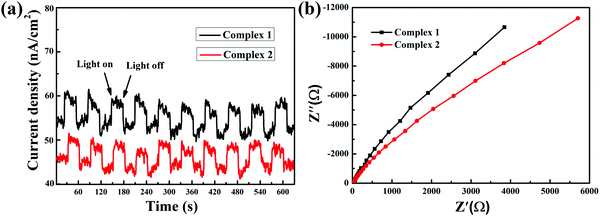 |
| | Fig. 3 (a) Transient photocurrent responses and (b) EIS changes of all the as-prepared samples. | |
BET surface areas and pore structures
N2 adsorption–desorption isotherms (77 K) of all the as-prepared samples are shown in Fig. 4a; the complexes have type III isotherms according to the Brunauer–Deming–Deming–Teller (BDDT) classification.35 Because photocatalysis is a surface-dependent phenomenon, the Brunauer–Emmett–Teller (BET) surface area and total pore volume have a great influence on the photocatalytic activity.36 At low relative pressures (below 0.2), the isotherms showed relatively low adsorption, indicating that there were a few micropores in the complexes. At high relative pressures (above 0.8), the isotherm curves contain hysteresis loops characteristic of type III isotherms, suggesting the presence of mesopores. The corresponding pore size distributions show wide distributions ranging from 2 to 30 nm, as shown in Fig. 4b. Such porous structures are useful in photocatalysis because they can provide efficient transport pathways for reactant molecules and products. The Brunauer–Emmett–Teller (BET) surface areas of complexes 1 and 2 were calculated to be 5.49 and 8.54 m2 g−1, respectively. The pore volumes of complexes 1 and 2 were 0.015 and 0.013 m3 g−1, respectively. The corresponding specific areas and the pore volumes of 1 and 2 are given in Table S3 (ESI†).
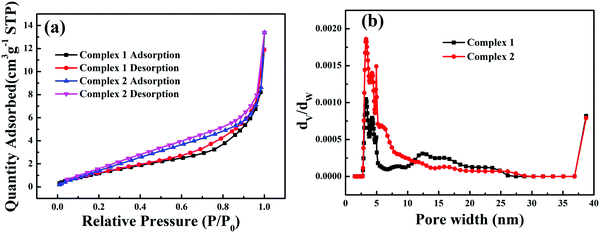 |
| | Fig. 4 N2 adsorption–desorption isotherms (a) and pore size-distribution curves (b) of the complexes. | |
UV-Vis diffuse reflectance spectroscopy (DRS) and X-ray photoelectron spectra (XPS)
The optical properties of the catalysts were studied with XPS and DRS. UV-vis diffuse reflectance spectra (UV-vis DRS) of the complexes in the range of 200–800 nm were measured using a UV-2700 instrument with BaSO4 as a reference. As reported previously, the optical band gaps (HOMO/LUMO) (Eg) of the semiconductor were calculated by the following equation:37where α, h, ν, Eg and A are the absorption coefficient, Planck constant, light frequency, band gap and a constant, respectively. The value of n is determined by the type of optical transition (n = 1 for direct transition and n = 4 for indirect transition). The Eg value was determined by measuring the x-axis intercept of an extrapolated tangential line from the linear regime of the curve. As Fig. 5 shows, the UV-visible absorption spectra reveal that in addition to the absorption edges around 372 and 353 nm, other absorption bands in the regions of 426–800 and 484–724 nm for complexes 1 and 2 can be detected, respectively.38,39 This indicates that the MOFs-based photocatalysts have strong visible light harvesting capacity. Also, the band gaps of complexes 1 and 2 were calculated using the Tauc plot to be 3.19 eV and 2.88 eV, respectively (see the insert in Fig. 5).
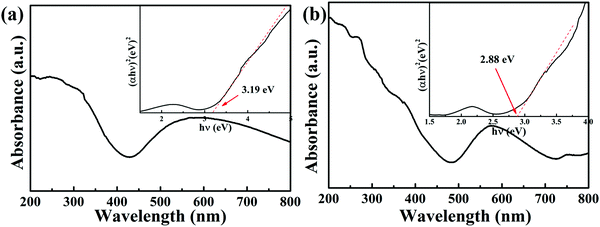 |
| | Fig. 5 The UV-visible absorption spectra of complexes 1 (a) and 2 (b). | |
In addition to the low band gap, appropriate matching of the conduction band (Ec) (vs. NHE) and valence band (Ev) (vs. NHE) sites is also significant for estimating photocatalysis. The Ev positions of the complexes are determined by linear extrapolation of the leasing edges of VB-XPS spectra to the baseline (Fig. 6). The valence band (Ev) positions of complexes 1 and 2 are 1.33 eV and 1.62 eV, respectively. Then, we can obtain the conduction band levels of the two complexes (−1.86 eV for 1 and −1.26 eV for 2) from the equation Ec = (Ev − Eg).40
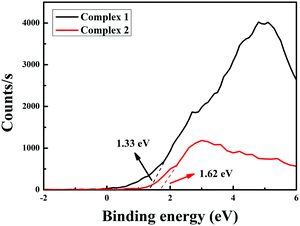 |
| | Fig. 6 The valence band XPS patterns of complexes 1 and 2. | |
Photocatalytic activities
TC was chosen as a degradation substrate to investigate the photocatalytic activities of the catalysts at room temperature. The form of the pollutants and the surface charge of the photocatalysts could be varied by changing the pH value. Especially, TC is amphoteric, with three pKa values of 3.32, 7.78 and 9.58, respectively, as shown in Scheme 1.41 Therefore, the effects of the pH value on photocatalytic degradation efficiency were studied, and the initial pH values of the reactant mixtures were 3, 5, 7, 9 and 11. As Fig. 7a and c show, the degradation efficiencies of photocatalysts 1 and 2 are different. With increasing pH value, the photocatalytic efficiency improved. For complexes 1 and 2, about 93.21% and 91.36% TC were degraded after 60 min under visible light, respectively, when the initial pH value of the solution was 11. Also, the efficiency of the degradation of TC was about 40.35 and 39.55 times that under the same conditions without photocatalyst for complexes 1 and 2, respectively. The results showed that the degradation of TC was due to the MOF photocatalysts. Compared with other photocatalysts, the complexes have the great advantage of high photocatalytic efficiency with lower dosage and shorter time for catalytic degradation without H2O2. Some of these photocatalysts are listed in Table 1, which shows a comparison of the photocatalytic performance of complexes 1 and 2 with other reported photocatalysts for the degradation of TC.
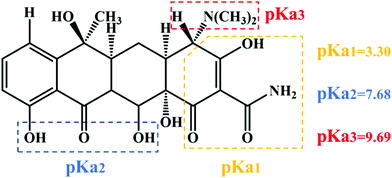 |
| | Scheme 1 Chemical structure and pKa values of TC. | |
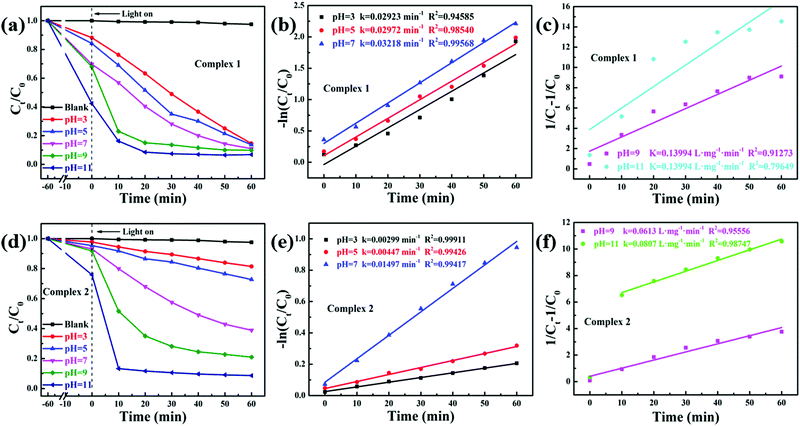 |
| | Fig. 7 Influence on the degradation of different pH values in complexes 1 (a) and 2 (d); pseudo-first-order kinetics curves of the photocatalytic degradation of TC with complexes 1 (b) and 2 (e) at pH 3, 5 and 7; pseudo-second-order kinetics curves of the photocatalytic degradation of TC with complexes 1 (c) and 2 (f) at pH 9 and 11. Reaction conditions: 10 mg of the catalyst, 50 mL 30 mg L−1 TC. Light source: Xe lamp (300 W). | |
Table 1 Comparison of the TC degradation capacities of complexes 1 and 2 with those of other photocatalysts
| Photocatalysts |
Irrigation |
Pollution, mg L−1 |
K |
TOF, h−1 |
Ref. |
| Complex 1 |
Vis |
TC/30 |
0.2117 |
0.1398 |
This work |
| Complex 2 |
Vis |
TC/30 |
0.0807 |
0.1371 |
This work |
| α-Fe2O3/d-C3N4-1 |
Vis |
TC/20 |
0.0202 |
0.0372 |
42
|
| APMO70 |
Vis |
TC/40 |
0.3555 |
0.0256 |
43
|
| CInS-2 |
Vis |
TC/30 |
0.0248 |
0.0500 |
44
|
| γ-In2Se3 |
Vis |
TC/20 |
0.0083 |
0.0092 |
45
|
| NM-Ag-5 |
Vis |
TC/20 |
0.0092 |
0.0037 |
46
|
| N-TiO2 |
Vis |
TC/10 |
0.0380 |
0.0189 |
47
|
| MIL-88A/PS |
Vis |
TC/200 |
0.0396 |
0.0599 |
48
|
| CaCu3Ti4O12 |
Vis |
TC/4.4 |
0.1100 |
0.0131 |
49
|
| AgBr/BiWO6 |
Vis |
TC/20 |
0.0049 |
0.0175 |
50
|
| 5% RCNL |
Vis |
TC/20 |
0.0078 |
0.0334 |
51
|
| WO3/g-C3N4/Bi2O3 |
Vis |
TC/10 |
0.0237 |
0.0080 |
52
|
| MoO3/g-C3N4 |
Vis |
TC/10 |
0.0233 |
0.0076 |
53
|
| WO3/g-C3N4 |
Vis |
TC/20 |
0.0378 |
0.0181 |
54
|
| CQDs/α-FeOOH + H2O2 |
Vis |
TC/20 |
0.1525 |
0.0756 |
55
|
In order to better investigate the photocatalytic efficiencies of the two complexes, the pseudo-first-order and pseudo-second-order models were analysed with the Langmuir–Hinshelwood model (eqn (3) and (4)).
where
k1 (min
−1) and
k2 (L mg
−1 min
−1) are the pseudo-first-order and pseudo-second-order kinetic rate constants, respectively.
C0 and
Ct are the initial and apparent concentrations of the TC, as shown in
Fig. 7. When the solution initial pH value is 11, the rate constants for the TC photodegradation of complexes
1 and
2 are 0.2117 and 0.0807 L mg
−1 min
−1 under visible light, respectively. Therefore, the results show that complexes
1 and
2 are efficient photocatalysts for TC degradation.
The influence of the pH value on the photodegradation of TC is shown in Fig. 7. The photodegradation efficiency varied with the pH value, and the higher the pH value, the higher the catalytic efficiency. Based on previous reports, TC shows protonation–deprotonation changes as the pH values range from 3 to 11. TC is an amphoteric antibiotic, which has three pKa values of 3.32, 7.78 and 9.58, respectively, as shown in Scheme 1.56 When the pH value of the solution is 3.3, TC is positively charged (TCH3+). When the pH is 3.3–7.7, the TC molecules are present as zwitterionic species (TCH02). When the pH is higher than 7.7, the TC molecules appear as anionic species (TCH−/TC2−).57 At lower and higher pH values, the surface of the MOF photocatalysts may be positively or negatively charged due to the surface adsorption of H+ or OH− ions, respectively.58 However, it was clearly observed that more than 55% and 20% TC could be adsorbed by complexes 1 and 2 at pH 11 after 60 min, respectively (Fig. 7a and d). These results confirmed that it was not the coulombic force interaction but surface complexation that played a decisive role in the adsorption capability of the TC molecules.57 In addition, the photocatalytic removal efficiencies of TC showed a negligible change at pH 11 without photocatalyst, which suggests that the MOF photocatalysts played a vital role in TC removal. Meanwhile, the results demonstrated that the pH value played a significant role in the photocatalytic efficiency of TC.
In addition to the photocatalytic degradation of tetracycline under visible light irradiation, the photocatalytic activity of the complexes was evaluated for photocatalytic hydrogen production. Fig. 8a displays the hydrogen production yields under the irradiation of visible light for 4 h, and the photocatalytic H2 evolution of complexes 1 and 2 was 2349.58 μmol g−1 and 2726.63 μmol g−1, respectively. Obviously, both complexes showed excellent hydrogen production activity. As shown in Fig. 8b, complexes 1 and 2 exhibited high activity, with hydrogen production rates of 587.39 and 681.66 μmol g−1 h−1 in 4 hours, respectively; these rates are superior to those of most reported MOF-based photocatalysts. Some MOFs with photocatalytic hydrogen production activity reported in recent years are listed in Table 2.
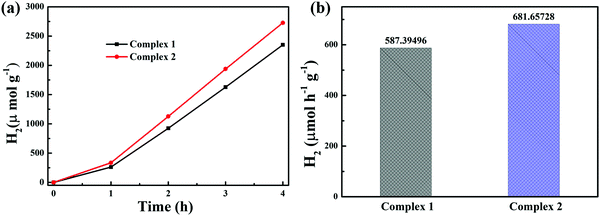 |
| | Fig. 8 (a) Photocatalytic H2 evolution and (b) H2 evolution rates of complexes 1 and 2. Reaction conditions: 100 mg of the catalyst, 50 mL MeOH, 50 mL water, 5 ml H2PtCl6, 15 ml TEOA. Light source: Xe lamp (300 W). | |
Table 2 Summary of the H2 evolution activity of MOF photocatalytic systems
| Photocatalysts |
Band gap (eV) |
Irrigation |
Sacrificial agents |
Cocatalysts |
Activity, μmol g−1 h−1 |
Ref. |
| Complex 1 |
1.67 |
Vis |
TEOA |
Pt |
587.39 |
This work |
| Complex 2 |
1.83 |
Vis |
TEOA |
Pt |
681.66 |
This work |
| PCN-415-NH2 |
1.99 |
Vis |
TEOA |
Pt |
594.00 |
59
|
| H2TCPP[AlOH]2·3DMF·2H2O |
— |
Vis |
EDTA |
Pt |
200.00 |
60
|
| [Al3(OH)3(HTCS)2] |
2.59 |
Vis |
TEOA |
— |
50.00 |
61
|
| {[CuICuII2(DCTP)2]NO3·1.5DMF}n |
2.10 |
UV-Vis |
MeOH |
Pt |
32.00 |
62
|
| USTC-8(In) |
1.79 |
Vis |
TEA |
Pt |
341.30 |
63
|
| [CuI12(trz)8(H2O)2] [a-SiW12O40]·2H2O |
2.11 |
Vis |
MeOH |
Pt |
192.20 |
64
|
| UiO-66 |
3.50 |
Vis |
L-Ascorbic |
Pt |
460.00 |
65
|
| [Dy2(abtc)(H2O)2(OH)2]·2H2O |
2.17 |
UV-Vis |
TEOA |
Pt |
21.53 |
66
|
| Pt@NH2-UiO-66 |
2.76 |
Vis |
TEOA |
— |
257.38 |
67
|
| Al-TCPP-Pt |
— |
Vis |
TEOA |
— |
129.00 |
68
|
| Pt/PCN-777 |
3.67 |
Vis |
TEOA |
— |
586.00 |
69
|
| Pt/MIL-100(Fe) |
— |
Vis |
MeOH |
— |
109.00 |
70
|
| UCNPs-Pt@MOF/Au |
— |
UV-Vis |
TEOA |
— |
280.00 |
71
|
| Co(II)@MIL-125-NH2 |
2.40 |
Vis |
TEOA |
— |
553.00 |
72
|
| 1Co0.5Ni@NH2BDC |
2.20 |
Sunlight |
TEOA/ACN |
— |
148.75 |
73
|
| [Ni(H4ttbmp)(H2O)2]·H2O |
2.83 |
UV-Vis |
MeOH |
— |
100.00 |
74
|
| Al-ATA-Ni |
2.17 |
Vis |
— |
— |
1200.00 |
75
|
Reaction mechanisms of the photocatalysis
The mechanisms of the photodegradation of TC and photocatalytic hydrogen production were investigated based on semiconductor theory. Upon irradiation by visible light, once the energy of the electrons (e−) is equal to or greater than the band gap of the MOF, the electrons will be excited from the VBs at the ligands to the CBs at the metal ions and also generate holes (h+) (eqn (5)), corresponding to ligand-to-metal charge transfer (LMCT). The adsorbed TC molecules can be oxidized directly due to the strong oxidant ability of the photoexcited holes, and the excited electrons can be captured by oxygen molecules to from superoxide radicals (˙O2−) (eqn (6)), which also have strong ability to oxidize TC molecules (eqn (7)).
Several controlled capture experiments were carried out to identify the main active species and investigate the photocatalytic mechanism. Tertiary butanol (t-BuOH), triethanolamine (TEOA) and nitrotetrazolium blue chloride (NBT) were used as scavengers for hydroxyl radicals (·OH),40 holes (h+)76 and superoxide radicals (˙O2−)77 during the TC photodegradation. The results are shown in Fig. 9. The photocatalysis efficiency of the complexes was not influenced when t-BuOH (4 mmol L−1) was added, which indicates that ˙OH is not the main active substance or that these complexes do not produce ˙OH under visible light, as confirmed by the VB-XPS spectrum, because its VB values are lower than the redox potential of ˙OH/OH− (2.38 V vs. NHE). The rates of photodegradation were affected slightly when TEOA (2 mmol L−1) was added; the removal ratios of complexes 1 and 2 were reduced by 11.4% and 0.01%, respectively. It is clear that the degradation efficiency decreased little when TEOA was added to the system, suggesting that h+ plays a small role in the TC photodegradation. In contrast, the photocatalysis was greatly inhibited when NBT (10 mmol L−1) was added to the system; the catalytic efficiency decreased by 70.6% and 62.9% for complexes 1 and 2, respectively. These results reveal that ˙O2− is the main active substance rather than ˙OH and h+. The conduction bands (CBs) of complexes 1 and 2 are −1.86 eV and −1.26 eV vs. NHE, respectively, which are more negative than the redox potential of O2/˙O2− (−0.33 eV vs. NHE); this benefits the photogenerated electron transfer from the catalyst to the adsorbed molecular oxygen.
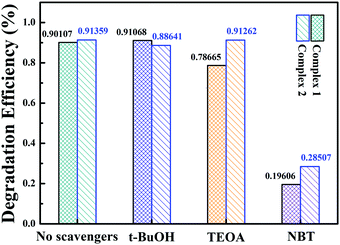 |
| | Fig. 9 Effects on the photocatalytic reaction of adding different trapping agents to the systems with 1 and 2. | |
The possible mechanism of the photocatalytic H2 production of the complexes is illustrated in Scheme S1 (ESI†). When visible light is absorbed by the organic ligands, the excited photoelectron is formed and transfers to the metal ion center. At that moment, TEOA  acts as a sacrificial electron donor, which donates electrons to the VB to eliminate holes generated by visible light to improve the efficiency of charge separation. The protons which gather on the surface of the MOFs by hydrogen bonding are transferred to the Pt center by water and react with the photoelectrons to produce H2.78 In this system, the Pt center is a good electron trap which can inhibit the recombination of photogenerated electrons and holes, providing redox reaction sites and lowering the overpotential for hydrogen production.
| | | {MOFs} + hν → {MOFs}(h+ + e−) | (5) |
| | | h+/˙O2− + TC → Products | (7) |
To confirm the existence of ˙O
2−, the electron spin resonance (ESR) spin-trap technique (with DMPO) was used to obtain information on the active radicals involved in the nanojunction dispersion of the irradiated or unirradiated complexes. As shown in
Fig. 10a and b, both the complexes have six ESR characteristic signals only under visible-light irradiation, and the signal intensity remains stable during the irradiation time, attributable to the DMPO–˙O
2− adducts; also, no ˙O
2− signal was detected in the dark under other identical conditions. This result indicates that the ˙O
2− dose plays a key role in the photocatalytic degradation process.
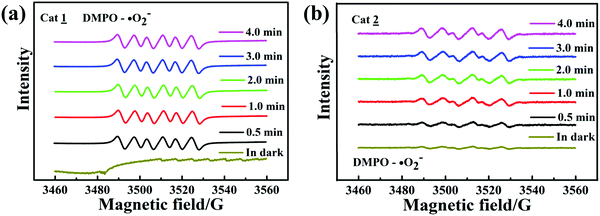 |
| | Fig. 10 ESR spectra of complexes 1 (a) and 2 (b) for DMPO–˙O2−. | |
Stability and reusability
Reusability and stability are significant factors for a photocatalyst; these properties of the two complexes were evaluated by recycling the catalyst for repeated treatment of TC photodegradation under identical reaction conditions (pH 11). In each cycle of photodegradation, to collect the photocatalyst more conveniently, the catalyst was encapsulated in a dialysis bag (MD25) allowing free penetration of liquid and molecules with molecular weights under 500. Four successive cycles with visible light were tested, as shown in Fig. 11a. It is likely that the mass loss of the catalyst during the treatment process after each cycling experiment caused the slight decrease of the efficiency of the photocatalyst with recycling time. After four cycles, the photocatalytic efficiencies of complexes 1 and 2 were still as high as 89.63% and 91.53%, respectively. The PXRD of the photocatalysts was compared before and after the photocatalytic reaction. As shown in Fig. 11b, it was clearly revealed that the structures of these complexes were unchanged after several cycles of the photocatalytic reaction. The removal of metal ions from the MOFs after four runs of photocatalytic reaction (240 min) experiments was quantified by inductively coupled plasma optical emission spectrometry (ICP-OES). The concentrations of Cu(II) and Ni(II) in the TC aqueous solution were 1.94 mg L−1 and 0.02 mg L−1, respectively. Accordingly, the removal rates of metal ions from complexes 1 and 2 are 1.96% and 0.02%, respectively, and the results listed in Table S4 suggest that the complexes remain stable during TC photodegradation. TC mineralization with complex 2 was detected by TOC measurements. After 60 min degradation, about 17.33% TC was mineralized by complex 2, which was much lower than the degradation efficiency. It can be rationally concluded that the intermediate products can retard the mineralization.50
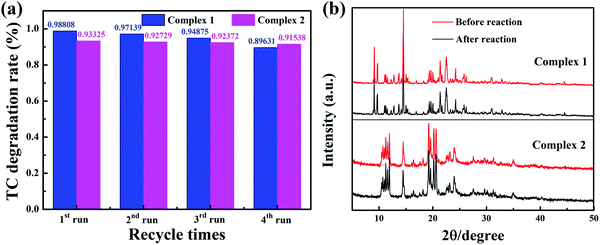 |
| | Fig. 11 The photocatalytic TC degradation during four consecutive runs over complexes 1 and 2 (a); the PXRD patterns of the complexes before and after TC degradation (b) (pH 11). | |
A cyclic photocatalytic hydrogen evolution experiment was carried out to study the stability of complex 2. After each cycle, the reaction mixture was bubbled with N2 and then used for subsequent runs. Fig. 12 displays the successive H2 production with high efficiency in the four subsequent runs.
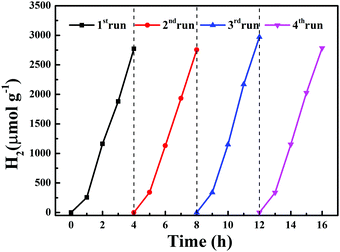 |
| | Fig. 12 Four cycles of photocatalytic H2 production using complex 2. | |
Conclusion
In summary, two metal–organic frameworks based on TIB ligand were synthesized by a general hydrothermal method with high crystallinity and yield and were then structurally characterized. The experimental results indicated that the photocatalytic efficiencies of the complexes are great. Both complexes could degrade TC efficiently and showed high hydrogen production activity. The two MOF-based photocatalysts can be excited easily to form h+ and e− under visible light due to their narrow band gaps; meanwhile, h+ and e− will diffuse to the surface of the catalysts and conduct redox reactions with the electron acceptor or electron donor adsorbed on the surface of the catalyst, forming the active group in the photocatalytic reaction to initiate a series of chemical reactions. For the degradation of TC, ˙O2− is the main active substance. The pH value of the solution is a significant factor, and the catalyst surface may be positively or negatively charged due to the surface adsorption of H+ or OH− ions and TC molecules. TC exhibits protonation–deprotonation behavior in the pH value range from 3 to 11. The adsorption and degradation rates of TC increased with increasing pH, which confirms that it was not coulombic force interactions but surface complexation that played a decisive role in the adsorption capability of TC molecules. Once superoxide radicals were produced under visible light, the TC molecules could be degraded immediately. In addition, complexes 1 and 2 exhibited excellent photocatalytic H2 production activity under visible light with the assistance of the Pt co-catalyst. In general, the photocatalytic activity and stability of the two complexes indicate that they have potential applications in environmental remediation and the energy crisis.
Conflicts of interest
There are no conflicts to declare.
Acknowledgements
This work was supported by the open fund of Engineering Research Center of Nano-Geo Materials of Ministry of Education, China University of Geosciences (Wuhan) (NGM2016KF013).
References
- G. Liu, P. Niu, L. Yin and H. M. Cheng, J. Am. Chem. Soc., 2012, 134, 9070–9073 CrossRef.
- M. R. Hoffmann, S. T. Martin, W. Choi and D. W. Bahnemannt, Chem. Rev., 1995, 95, 69–96 CrossRef.
- H. Zhang and Y.f. Zhu, J. Phys. Chem. C, 2010, 114, 5822–5826 CrossRef.
- X. Li, H. Liu, S. Liu, J. Zhang, W. Chen, C. Huang and L. Mao, Int. J. Hydrogen Energy, 2016, 41, 23015–23021 CrossRef.
- Q. Liu, E. Liu, J. Li, Y. Qiu and R. Chen, Catal. Today, 2020, 339, 391–402 CrossRef CAS.
- O. Sacco, V. Vaiano, D. Sannino, R. A. Picca and N. Cioffi, J. Colloid Interface Sci., 2019, 537, 671–681 CrossRef CAS.
- B. Subash, B. Krishnakumar, R. Velmurugan, M. Swaminathan and M. Shanthi, Catal. Sci. Technol., 2012, 2, 2319–2326 RSC.
- K. Kim, J. Park, H. Kim, G. Y. Jung and M.-G. Kim, ACS Catal., 2019, 9, 9206–9211 CrossRef CAS.
- H. Yi, D. Huang, L. Qin, G. Zeng, C. Lai, M. Cheng, S. Ye, B. Song, X. Ren and X. Guo, Appl. Catal., B, 2018, 239, 408–424 CrossRef CAS.
- Q. Han, B. Wang, J. Gao and L. Qu, Angew. Chem., Int. Ed., 2016, 55, 10849–10853 CrossRef CAS.
- J. Di, J. Xia, H. Li and Z. Liu, Nano Energy, 2017, 35, 79–91 CrossRef CAS.
- A. K. Vorobiev, R. R. Gazizov, A. Y. Borschevskii, V. Y. Markov, V. A. Ioutsi, V. A. Brotsman and L. N. Sidorov, J. Phys. Chem. A, 2017, 121, 113–121 CrossRef CAS.
-
T. A. Saleh, The Role of Carbon Nanotubes in Enhancement of Photocatalysis, 2013, vol. 479, pp. 479–493 Search PubMed.
- P. Yadav, S. T. Nishanthi, B. Purohit, A. Shanavas and K. Kailasam, Carbon, 2019, 152, 587–597 CrossRef CAS.
- O. M. Yaghi, G.m. Li and H.l. Li, Nature, 1995, 378, 703–706 CrossRef CAS.
- Q. L. Zhu and Q. Xu, Chem. Soc. Rev., 2014, 43, 5468–5512 RSC.
- L. J. Murray, M. Dinca and J. R. Long, Chem. Soc. Rev., 2009, 38, 1294–1314 RSC.
- X. Gao, X. Hai, H. Baigude, W. Guan and Z. Liu, Sci. Rep., 2016, 6, 37705 CrossRef CAS.
- A. Dhakshinamoorthy, A. M. Asiri and H. Garcia, Chem. Commun., 2014, 50, 12800–12814 RSC.
- Y. Ye, Z. Ma, R. B. Lin, R. Krishna, W. Zhou, Q. Lin, Z. Zhang, S. Xiang and B. Chen, J. Am. Chem. Soc., 2019, 141, 4130–4136 CrossRef CAS.
- L. Li, S. Shen, R. Lin, Y. Bai and H. Liu, Chem. Commun., 2017, 53, 9986–9990 RSC.
- W. T. Xu, L. Ma, F. Ke, F. M. Peng, G. S. Xu, Y. H. Shen, J. F. Zhu, L. G. Qiu and Y. P. Yuan, Dalton Trans., 2014, 43, 3792–3798 RSC.
- F. X. Xamena, A. Corma and H. Garcia, J. Phys. Chem. C, 2007, 111, 80–85 CrossRef.
- T. Wen, D. X. Zhang, J. Liu, R. Lin and J. Zhang, Chem. Commun., 2013, 49, 5660–5662 RSC.
- M. C. Das, H. Xu, Z. Wang, G. Srinivas, W. Zhou, Y. F. Yue, V. N. Nesterov, G. Qian and B. Chen, Chem. Commun., 2011, 47, 11715–11717 RSC.
- J. Guo, J.-F. Ma, J.-J. Li, J. Yang and S.-X. Xing, Cryst. Growth Des., 2012, 12, 6074–6082 CrossRef CAS.
- A. K. Paul, G. Madras and S. Natarajan, Phys. Chem. Chem. Phys., 2009, 11, 11285–11296 RSC.
- B. Pattengale, S. Yang, S. Lee and J. Huang, ACS Catal., 2017, 7, 8446–8453 CrossRef CAS.
- X. Y. Dong, M. Zhang, R. B. Pei, Q. Wang, D. H. Wei, S. Q. Zang, Y. T. Fan and T. C. Mak, Angew. Chem., Int. Ed., 2016, 55, 2073–2077 CrossRef.
- Y. Xiao, Y. Qi, X. Wang, X. Wang, F. Zhang and C. Li, Adv. Mater., 2018, 30, e1803401 CrossRef.
- J. Li, D. Liu, Y. Q. Li, C. S. Lee, H. Kwong and S. Lee, Chem. Mater., 2005, 17, 1208–1212 CrossRef.
- F. D'Anna, H. Q. Gunaratne, G. Lazzara, R. Noto, C. Rizzo and K. R. Seddon, Org. Biomol. Chem., 2013, 11, 5836–5846 RSC.
- N. S. Begum, M. D. Poojary and H. Manohar, Dalton Trans., 1989, 1507–1512 RSC.
- M. Zhang, Q. Shang, Y. Wan, Q. Cheng, G. Liao and Z. Pan, Appl. Catal., B, 2019, 241, 149–158 CrossRef.
- J. Zhang, S. Liu, J. Yu and M. Jaroniec, J. Mater. Chem., 2011, 21, 14655 RSC.
- X. Xiao, W. Zhang, J. Yu, Y. Sun, Y. Zhang and F. Dong, Catal. Sci. Technol., 2016, 6, 5003–5010 RSC.
- Y. Zhang and S.-J. Park, Appl. Catal., B, 2019, 240, 92–101 CrossRef CAS.
- S. Yan, S. Ouyang, H. Xu, M. Zhao, X. Zhang and J. Ye, J. Mater. Chem. A, 2016, 4, 15126–15133 RSC.
- X. Yu, W. Li, Z. Li, J. Liu and P. Hu, Appl. Catal., B, 2017, 217, 48–56 CrossRef CAS.
- M. Zhang, L. Wang, T. Zeng, Q. Shang, H. Zhou, Z. Pan and Q. R. Cheng, Dalton Trans., 2018, 47, 4251–4258 RSC.
- R. Hailili, Z.-Q. Wang, Y. Li, Y. Wang, V. K. Sharma, X.-Q. Gong and C. Wang, Appl. Catal., B, 2018, 221, 422–432 CrossRef CAS.
- S. Wang, Z. Teng, Y. Xu, M. Yuan, Y. Zhong, S. Liu, C. Wang, G. Wang and T. Ohno, Appl. Catal., B, 2020, 260, 118145 CrossRef CAS.
- C. Chen, H. Zeng, M. Yi, G. Xiao, S. Xu, S. Shen and B. Feng, Appl. Catal., B, 2019, 252, 47–54 CrossRef CAS.
- Y. Pi, S. Jin, X. Li, S. Tu, Z. Li and J. Xiao, Appl. Catal., B, 2019, 256, 117882 CrossRef CAS.
- X. Wei, H. Feng, L. Li, J. Gong, K. Jiang, S. Xue and P. K. Chu, Appl. Catal., B, 2020, 260, 118218 CrossRef CAS.
- S. Kumar Ray, D. Dhakal, G. Gyawali, B. Joshi, A. Raj Koirala and S. Wohn Lee, Chem. Eng. J., 2019, 373, 259–274 CrossRef CAS.
- S. Wu, H. Hu, Y. Lin, J. Zhang and Y. H. Hu, Chem. Eng. J., 2020, 382, 122842 CrossRef CAS.
- Y. Zhang, J. Zhou, X. Chen, L. Wang and W. Cai, Chem. Eng. J., 2019, 369, 745–757 CrossRef CAS.
- R. Hailili, Z.-Q. Wang, Y. Li, Y. Wang, V. K. Sharma, X.-Q. Gong and C. Wang, Appl. Catal., B, 2018, 221, 422–432 CrossRef.
- D. Huang, J. Li, G. Zeng, W. Xue, S. Chen, Z. Li, R. Deng, Y. Yang and M. Cheng, Chem. Eng. J., 2019, 375, 121991 CrossRef.
- L. Jing, Y. Xu, J. Liu, M. Zhou, H. Xu, M. Xie, H. Li and J. Xie, Appl. Catal., B, 2020, 277, 119245 CrossRef.
- L. Jiang, X. Yuan, G. Zeng, J. Liang, X. Chen, H. Yu, H. Wang, Z. Wu, J. Zhang and T. Xiong, Appl. Catal., B, 2018, 227, 376–385 CrossRef.
- Z. Xie, Y. Feng, F. Wang, D. Chen, Q. Zhang, Y. Zeng, W. Lv and G. Liu, Appl. Catal., B, 2018, 229, 96–104 CrossRef.
- T. Pan, D. Chen, W. Xu, J. Fang, S. Wu, Z. Liu, K. Wu and Z. Fang, J. Hazard. Mater., 2020, 393, 122366 CrossRef.
- S. Huang, Q. Zhang, P. Liu, S. Ma, B. Xie, K. Yang and Y. Zhao, Appl. Catal., B, 2020, 263, 118336 CrossRef CAS.
- W. Fei, Y. Song, N. Li, D. Chen, Q. Xu, H. Li, J. He and J. Lu, Environ. Sci.: Nano, 2019, 6, 3123–3132 RSC.
- J. Lyu, Z. Hu, Z. Li and M. Ge, J. Phys. Chem. Solids, 2019, 129, 61–70 CrossRef.
- Q. Shang, T. Zeng, K. Gao, N. Liu, Q. Cheng, G. Liao, Z. Pan and H. Zhou, New J. Chem., 2019, 43, 16595–16603 RSC.
- S. Yuan, J. S. Qin, H. Q. Xu, J. Su, D. Rossi, Y. Chen, L. Zhang, C. Lollar, Q. Wang, H. L. Jiang, D. H. Son, H. Xu, Z. Huang, X. Zou and H. C. Zhou, ACS Cent. Sci., 2018, 4, 105–111 CrossRef.
- A. Fateeva, P. A. Chater, C. P. Ireland, A. A. Tahir, Y. Z. Khimyak, P. V. Wiper, J. R. Darwent and M. J. Rosseinsky, Angew. Chem., Int. Ed., 2012, 51, 7440–7444 CrossRef.
- Y. Guo, J. Zhang, L. Z. Dong, Y. Xu, W. Han, M. Fang, H. K. Liu, Y. Wu and Y. Q. Lan, Chemistry, 2017, 23, 15518–15528 CrossRef.
- Z. L. Wu, C. H. Wang, B. Zhao, J. Dong, F. Lu, W. H. Wang, W. C. Wang, G. J. Wu, J. Z. Cui and P. Cheng, Angew. Chem., Int. Ed., 2016, 55, 4938–4942 CrossRef.
- F. Leng, H. Liu, M. Ding, Q.-P. Lin and H.-L. Jiang, ACS Catal., 2018, 8, 4583–4590 CrossRef CAS.
- X. Zhao, S. Zhang, J. Yan, L. Li, G. Wu, W. Shi, G. Yang, N. Guan and P. Cheng, Inorg. Chem., 2018, 57, 5030–5037 CrossRef CAS.
- Y. Yuan, L. Yin, S. Cao, G. Xu, C. Li and C. Xue, Appl. Catal., B, 2015, 168-169, 572–576 CrossRef CAS.
- Q. Yu, H. Dong, X. Zhang, Y. Zhu, J. Wang, F. Zhang and X. J. Sun, CrystEngComm, 2018, 20, 3228–3233 RSC.
- J. Xiao, Q. Shang, Y. Xiong, Q. Zhang, Y. Luo, S. Yu and H. Jiang, Angew. Chem., Int. Ed., 2016, 55, 1–6 CrossRef.
- X. Fang, Q. Shang, Y. Wang, L. Jiao, T. Yao, Y. Li, Q. Zhang, Y. Luo and H. L. Jiang, Adv. Mater., 2018, 30, 1705112 CrossRef.
- H. Liu, C. Xu, D. Li and H. Jiang, Angew. Chem., Int. Ed., 2018, 57, 5379–5383 CrossRef CAS.
- D. Wang, Y. Song, J. Cai, L. Wu and Z. Li, New J. Chem., 2016, 40, 9170–9175 RSC.
- D. Li, S. H. Yu and H. L. Jiang, Adv. Mater., 2018, 30, 1707377 CrossRef.
- Z. Li, J.-D. Xiao and H.-L. Jiang, ACS Catal., 2016, 6, 5359–5365 CrossRef CAS.
- P. C. Meenu, M. A. Sha, R. Pavithran, V. S. Dilimon and S. M. A. Shibli, Int. J. Hydrogen Energy, 2020, 45, 24582–24594 CrossRef CAS.
- P. Salcedo-Abraira, S. M. F. Vilela, A. A. Babaryk, M. Cabrero-Antonino, P. Gregorio, F. Salles, S. Navalón, H. García and P. Horcajada, Nano Res., 2020 DOI:10.1007/s12274-020-3056-6.
- Y. An, Y. Y. Liu, P. F. An, J. C. Dong, B. Y. Xu, Y. Dai, X. Y. Qin, X. Y. Zhang, M. H. Whangbo and B. B. Huan, Angew. Chem., Int. Ed., 2017, 56, 3036–3040 CrossRef CAS.
- L. Wang, T. Zeng, G. Liao, Q. Cheng and Z. Pan, Polyhedron, 2019, 157, 152–162 CrossRef CAS.
- T. Zeng, L. Wang, L. Feng, H. Xu, Q. Cheng and Z. Pan, Dalton Trans., 2019, 48, 523–534 RSC.
- Z. L. Wu, C. H. Wang, B. Zhao, J. Dong, F. Lu, W. H. Wang, W. C. Wang, G. J. Wu, J. Z. Cui and P. Cheng, Angew. Chem., 2016, 55, 4938–4942 CrossRef CAS.
Footnote |
| † Electronic supplementary information (ESI) available. CCDC 1882306 and 1882332. For ESI and crystallographic data in CIF or other electronic format see DOI: 10.1039/d0tc04733c |
|
| This journal is © The Royal Society of Chemistry 2021 |
Click here to see how this site uses Cookies. View our privacy policy here.  *a,
Guiying
Liao
b and
Zhiquan
Pan
a

![[1 with combining macron]](https://www.rsc.org/images/entities/char_0031_0304.gif) , and the structure unit contains two Cu2+ (Cu1 and Cu2) ions, two TIBs, one coordination water molecule and two nitrate anions, as well as one free water molecule and one free nitrate anion in the lattice. Each TIB ligand is a tridentate ligand with two different spatial structures (cis, trans, trans; trans). Ligand TIB1 (N10, N12, N14) is only coordinated with Cu1 atom; however, ligand TIB2 (N4, N6, N8) is coordinated with both Cu1 and Cu2 atoms. Each Cu atom is hexacoordinated and adopts a distorted octahedral geometry. Cu1 atom is coordinated with four nitrogen atoms from different TIB ligands (Fig. 1b), and the four nitrogen atoms are in the same plane, with Cu1–N bond distances in the range of 1.99(3)–2.03(3) Å and N–Cu1–N bond angles varying from 87.68(12)° to 177.36(12)°. The apical positions are occupied by two oxygen atoms with Cu1–O10 and Cu1–O4 bond distances of 2.33(3) and 2.733 Å,33 respectively (Table S2, ESI†). Cu2 ion is hexa-coordinated with a heavily elongated octahedron geometry (Fig. 1c), in which the apical positions are occupied by the oxygen atoms arising from two different nitrate anions [Cu(2)–O(1) 2.639 Å]. The basal plane is formed by the four nitrogen atoms from four different TIB ligands with Cu2–N6 and Cu2–N8 bond distances of 1.98(3) and 1.99(3) Å, respectively. The N–Cu2–N bond angles vary from 89.19(1) to 180.00(3)°. In the direction shown in Fig. 1d, TIB1 is connected by Cu2 while TIB2 is connected by Cu1, both of which form two separate 1D chains containing two kinds of 24-membered macrocyclic rings. These two chains are linked by Cu1 to form a 3D structure. In this structure, the relative distribution of TIB1 is shown in Fig. 1e. The distances of Cu1⋯Cu1 are 8.57(8) Å and 12.36(8) Å, respectively. It can be seen clearly that the two benzene ring planes are strictly parallel to each other, and the distance of the two benzene ring planes is 4.98(4) Å (Fig. 1e). Alternatively, the two TIB2 ligands are in a centrally symmetrical position. The distance of Cu2⋯Cu2 is 12.93(6) Å. Due to the coordination interaction of N4 with Cu1, the two kinds of 1D chains are connected alternately, forming a 3D network. To reveal the network clearly, topological analysis was performed (Fig. 1f). The Cu2+ centers are connected by four ligands, which can be considered as 4-connected nodes. The cluster was represented with stoichiometry (3-c)2(3-c)2(4-c)2(4-c), and the point symbol for the net is {4·122}2{42·124}{42·6·123}2{42·6}2{4·122}2{42·124} {42·6·123}2 {42·6}2.
, and the structure unit contains two Cu2+ (Cu1 and Cu2) ions, two TIBs, one coordination water molecule and two nitrate anions, as well as one free water molecule and one free nitrate anion in the lattice. Each TIB ligand is a tridentate ligand with two different spatial structures (cis, trans, trans; trans). Ligand TIB1 (N10, N12, N14) is only coordinated with Cu1 atom; however, ligand TIB2 (N4, N6, N8) is coordinated with both Cu1 and Cu2 atoms. Each Cu atom is hexacoordinated and adopts a distorted octahedral geometry. Cu1 atom is coordinated with four nitrogen atoms from different TIB ligands (Fig. 1b), and the four nitrogen atoms are in the same plane, with Cu1–N bond distances in the range of 1.99(3)–2.03(3) Å and N–Cu1–N bond angles varying from 87.68(12)° to 177.36(12)°. The apical positions are occupied by two oxygen atoms with Cu1–O10 and Cu1–O4 bond distances of 2.33(3) and 2.733 Å,33 respectively (Table S2, ESI†). Cu2 ion is hexa-coordinated with a heavily elongated octahedron geometry (Fig. 1c), in which the apical positions are occupied by the oxygen atoms arising from two different nitrate anions [Cu(2)–O(1) 2.639 Å]. The basal plane is formed by the four nitrogen atoms from four different TIB ligands with Cu2–N6 and Cu2–N8 bond distances of 1.98(3) and 1.99(3) Å, respectively. The N–Cu2–N bond angles vary from 89.19(1) to 180.00(3)°. In the direction shown in Fig. 1d, TIB1 is connected by Cu2 while TIB2 is connected by Cu1, both of which form two separate 1D chains containing two kinds of 24-membered macrocyclic rings. These two chains are linked by Cu1 to form a 3D structure. In this structure, the relative distribution of TIB1 is shown in Fig. 1e. The distances of Cu1⋯Cu1 are 8.57(8) Å and 12.36(8) Å, respectively. It can be seen clearly that the two benzene ring planes are strictly parallel to each other, and the distance of the two benzene ring planes is 4.98(4) Å (Fig. 1e). Alternatively, the two TIB2 ligands are in a centrally symmetrical position. The distance of Cu2⋯Cu2 is 12.93(6) Å. Due to the coordination interaction of N4 with Cu1, the two kinds of 1D chains are connected alternately, forming a 3D network. To reveal the network clearly, topological analysis was performed (Fig. 1f). The Cu2+ centers are connected by four ligands, which can be considered as 4-connected nodes. The cluster was represented with stoichiometry (3-c)2(3-c)2(4-c)2(4-c), and the point symbol for the net is {4·122}2{42·124}{42·6·123}2{42·6}2{4·122}2{42·124} {42·6·123}2 {42·6}2.
![[1 with combining macron]](https://www.rsc.org/images/entities/char_0031_0304.gif) , and the structure unit contains one Ni2+ ion, one TIB, and one nitrate anion in the lattice. The crystal structure of 2 with the numbering scheme is shown in Fig. 2a. The ligand TIB3(N2⋯N4⋯N6) has only one spatial configuration. As shown in Fig. 2b, the Ni center is hexacoordinated and adopts a distorted octahedral geometry; the four nitrogen atoms are in the same plane, and the apical positions are occupied by two nitrogen atoms with Ni–N bond distances in the range of 2.12(4) to 2.13(3) Å and N–Ni–N bond angles varying from 86.44(14)° to 180.00°. Each TIB ligand adopts a cis, cis, cis-conformation coordinating with three Ni atoms and forming a 2D brick network (Fig. 2c). The distance of Ni⋯Ni is 9.71(1) Å, as shown in Table S2 (ESI†). It is interesting that all the benzene ring planes are strictly parallel to each other (Fig. 2c). There are numerous nitrate anions between the 2D brick networks (Fig. 2d), and the 2D brick networks are connected together alternately by hydrogen bond interactions: C–H⋯O–N–O⋯H–C. All of the H-bonding acceptors are from the oxygen atoms of nitrate anions, and the H-bonding donors are from the carbon atoms of the methylene of the ligand. Finally, a 3D network structure is formed.
, and the structure unit contains one Ni2+ ion, one TIB, and one nitrate anion in the lattice. The crystal structure of 2 with the numbering scheme is shown in Fig. 2a. The ligand TIB3(N2⋯N4⋯N6) has only one spatial configuration. As shown in Fig. 2b, the Ni center is hexacoordinated and adopts a distorted octahedral geometry; the four nitrogen atoms are in the same plane, and the apical positions are occupied by two nitrogen atoms with Ni–N bond distances in the range of 2.12(4) to 2.13(3) Å and N–Ni–N bond angles varying from 86.44(14)° to 180.00°. Each TIB ligand adopts a cis, cis, cis-conformation coordinating with three Ni atoms and forming a 2D brick network (Fig. 2c). The distance of Ni⋯Ni is 9.71(1) Å, as shown in Table S2 (ESI†). It is interesting that all the benzene ring planes are strictly parallel to each other (Fig. 2c). There are numerous nitrate anions between the 2D brick networks (Fig. 2d), and the 2D brick networks are connected together alternately by hydrogen bond interactions: C–H⋯O–N–O⋯H–C. All of the H-bonding acceptors are from the oxygen atoms of nitrate anions, and the H-bonding donors are from the carbon atoms of the methylene of the ligand. Finally, a 3D network structure is formed.


 acts as a sacrificial electron donor, which donates electrons to the VB to eliminate holes generated by visible light to improve the efficiency of charge separation. The protons which gather on the surface of the MOFs by hydrogen bonding are transferred to the Pt center by water and react with the photoelectrons to produce H2.78 In this system, the Pt center is a good electron trap which can inhibit the recombination of photogenerated electrons and holes, providing redox reaction sites and lowering the overpotential for hydrogen production.


