Carbon dots with positive surface charge from tartaric acid and m-aminophenol for selective killing of Gram-positive bacteria†
Huibo
Wang‡
ab,
Fang
Lu‡
*a,
Chongqing
Ma
b,
Yurong
Ma
b,
Mengling
Zhang
b,
Bo
Wang
b,
Yue
Zhang
a,
Yang
Liu
*b,
Hui
Huang
 *b and
Zhenhui
Kang
 b
b
aSchool of Life Sciences, Beijing University of Chinese Medicine, Beijing, 100029, China. E-mail: lufang@bucm.edu.cn
bInstitute of Functional Nano & Soft Materials (FUNSOM), Jiangsu Key Laboratory for Carbon-Based Functional Materials & Devices, Soochow University, 199 Ren’ai Road, Suzhou, 215123, Jiangsu, P. R. China. E-mail: yangl@suda.edu.cn; hhuang0618@suda.edu.cn
First published on 3rd November 2020
Abstract
Gram-positive bacteria are one of the most common pathogens causing severe and acute infection, and hospital infection caused by Gram-positive bacteria have increased significantly. Also, as antibiotics have been widely used, abusing of antibiotics is becoming an increasingly serious problem which is followed by dangerous drug resistance. Here, we developed a series of cationic carbon dots (CDs) with high-performance as antibacterial agents by using tartaric acid and m-aminophenol as precursors. The surface charge of these CDs can be regulated from +4.5 ± 0.42 mV to +33.2 ± 0.99 mV by increasing the contents of pyridine N and pyrrolic N in CDs. Further antibacterial experiments show that 250 μg mL−1 of CDs with +33.2 ± 0.99 mV can selectively kill Gram-positive bacteria and the antibacterial efficiency can reach approximately >99%. These CDs with positive surface charge can be selectively absorbed on the cell walls of Staphylococcus aureus (S. aureus) via electrostatic interaction and then disturb their physiological metabolism, eventually leading to bacterial death. The present work provides a novel method to adjust the surface charge of CDs and apply these CDs as alternative antibacterial agents.
1. Introduction
Bacterial infection threatens human lives and health and millions of people suffer gravely every year. Current therapies to prevent infections from getting worse are heavily dependent on antibiotics,1 however, antibiotics have lost their effectiveness as drug resistant bacteria have developed. It is urgent to find an alternative therapeutic option against bacterial infection. Recent investigations on the employment of nanomaterials involving antimicrobial peptides,2 noble metal nanoparticles,3 semiconductor nanoparticles,4 and carbon-based nanomaterials5–8 as antibacterial agents have proved their great potential for the remedy of bacterial infection. However, the clinical applications of these nanomaterials, especially metal-based nanomaterials, are hindered by many issues, such as bio-toxicity and high cost.3 In contrast, carbon-based nanomaterials, due to their outstanding physical and chemical properties, tunable surface modification and relatively good biocompatibility, have aroused wide concern.9Carbon dots (CDs) have many advantages, such as good water dispersibility, various precursors,10,11 multiple synthesis methods,12 excellent biocompatility and bioactivity. Recently, much effort has been paid to the antibacterial activity of CDs. Various CDs synthesized from epoxy ethane derivatives,13 quaternary ammonium salt derivatives,14,15 spermidine,16 carbon nitride,5 and ascorbic acid,17 function as antibacterial agents through oxidative stress, metabolism inhibition by electrostatic effect, photocatalytic effect and interaction with DNA to inhibit bacterial growth or kill bacteria directly. Among them, positively charged CDs have attracted much attention due to their strong inhibitory effect on bacterial growth by combining with the negative charged part of bacteria cell walls via electrostatic interaction.18 To date, most positively charged CDs have been obtained by using cationic precursors or further surface modification. It is an urgent challenge to realize the surface charge modulation and structure design of positively charged CDs.
In this work, we show the fabrication of a series of cationic CDs with tunable charge from tartaric acid and m-aminophenol via a one-step hydrothermal method. The surface positive charge of CDs can be adjusted by using different ratios of reaction precursors. As the proportion of tartaric acid in the precursor increases, the zeta potential of CDs increases from +4.5 ± 0.42 mV to +33.2 ± 0.99 mV. All these cationic CDs can both penetrate into the interior of S. aureus (Gram-positive bacteria) and Escherichia coli (E. coli, Gram-negative bacteria), but only the cell walls of S. aureus were damaged after CD treatment. These CDs with different positive surface charge also show different levels of inhibiting effects on the growth of S. aureus and the antibacterial activity on S. aureus is increased with the increase of zeta potential of the CDs. The antibacterial efficiency of CDs (+33.2 ± 0.99 mV) on S. aureus at 250 μg mL−1 can be as high as >99%.
2. Experimental
2.1 Materials
Tartaric acid and m-aminophenol were purchased from Amethyst and Aladdin Industrial Corporation. Sodium chloride, yeast extract, tryptone and agar were bought from Sinopharm Chemical Reagent, Oxoid, Beijing Solarbio Science & Technology and Shanghai yuanye Bio-Technology, respectively. Cell counting kit-8 was obtained from Beyotime Biotechnology.2.2 Characterization methods
The morphology of CDs was carried out by using a Tecnai G2 F20 transmission electron microscope. Fourier transform infrared spectra were recorded using a Hyperion Fourier transform infrared spectrometer. Zeta potential and dynamic light scattering were recorded by a ZEN 3690 Zetasizer Nano ZS. The X-ray photoelectron spectroscopy studies of CDs were obtained using an Axis Ultra DLD Kratos AXIS SUPRA X-ray photoelectron spectrometer. The ultraviolet-visible absorption spectra were measured by using an evolution 220 ultraviolet-visible absorption spectrometer. The fluorescence spectra of CDs were measured by using a FluoroMax 4 luminescence spectrometer. Confocal images were obtained by using a LSM 800 Zeiss confocal microscope. A Zeiss Supra55 scanning electron microscope (SEM) was used to acquire the morphology of bacteria. The laser-scanning confocal microscopy images were obtained by using a Leica laser-scanning confocal microscope (TCS-SP5).2.3 The preparation of CDs
CDs were fabricated by a one-step hydrothermal method using m-aminophenol and tartaric acid. Briefly, the mixture of 0.1 g of different molar ratios (0.2, 0.5 and 1.0) of tartaric acid and m-aminophenol and 8 mL of ultrapure water was added into a 15 mL Teflon-lined autoclave, and then kept at 180 °C for 2 h. After that, the product was filtered to remove insoluble impurities, which was followed by a final dialysis process with a semipermeable membrane (MWCO 1000) against the ultrapure water. A series of CDs were obtained and named by CDs-1, CDs-2 and CDs-3 according to the molar ratio of tartaric acid to m-aminophenol from 0.1 to1.0, respectively.2.4 Cytotoxicity test
HeLa cells were used as the model to identify the cytotoxicity of CDs. HeLa cells were incubated in a 96-well plate and cultured for 24 h. Then, the old medium was replaced by the fresh medium containing different concentrations (0–400 μg mL−1) of CDs and the cells were cultured for another 24 h. The cell viability was measured by a cell counting kit-8 (CCK8) assay, which can be evaluated by the absorbance at 450 nm. The tests were repeated three times to ensure the accuracy of the experiments.2.5 Antibacterial activity test
S. aureus and E. coli were chosen as the model to assess the antibacterial activity. Those bacteria were cultured in Luria-Bertan (LB) liquid medium, containing 10.0 g of sodium chloride, 5.0 g of yeast extract powder and 10.0 g of tryptone per litre, at 37 °C in a constant temperature incubator. Before experiments, all appliances and reagents were treated at 121 °C for 20 min in an autoclave to ensure the sterility. To determinate the minimal inhibitory concentration (MIC) of CDs, the same amount of bacterial suspension was dispersed in 5 mL of LB medium with different concentrations of CDs-3 (0–250 μg mL−1). After 12 h of shake cultivation, the bacterial growth was assessed by monitoring the optical density 600 (OD600) of bacterial suspension. The MIC values were confirmed when the bacterial growth treated with CDs was absent. Furthermore, the minimal bactericidal concentration (MBC) of CDs were evaluated by using a plate counting method. Bacterial suspension was smeared on the LB agar medium containing different concentrations of CDs. After another cultivation for 24 h, the colony forming units (CFUs) of bacteria were detected. The MBC values were the lowest concentration of CDs at which no colony was found. These tests were repeated three times to ensure the accuracy of the experiments.2.6 Confocal images of bacteria
S. aureus and E. coli were cultured with CDs for 30 min, respectively. Before imaging, these bacteria were washed with phosphate buffered solution (PBS, pH = 7.4). Then, the bacterial suspensions were imaged by confocal microscopy.2.7 Bacteria morphology study
The morphology of the bacteria was obtained by using a Zeiss Supra55 scanning electron microscope. First, the bacteria are incubated with or without CDs (250 μg mL−1) at 37 °C. After centrifugation, the bacterial cells are fixed in 5% glutaraldehyde solution overnight. Then, these bacteria are treated with different concentrations of alcohol solution (30%, 50%, 70%, 85%, 95%, 100%) step by step. Finally, the dehydrated bacterial suspensions are dropped on a silicon slice. Then, SEM images of the bacteria are acquired.3. Results and discussion
3.1 CD synthesis and characterization
As shown in Fig. 1a, CDs with different positive charges were synthesized from m-aminophenol and tartaric acid by a hydrothermal method at 180 °C for 2 h. As the molar ratio of tartaric acid increases in the precursors, the obtained CDs are noted as CDs-1, CDs-2 and CDs-3, respectively. The three as-synthesized CDs have good water solubility. Fig. 1b–d show transmission electron microscopy (TEM) images of these CDs with the representative nearly spherical morphology. Besides, the dynamic light scattering (DLS) analysis as shown in Fig. S1 (ESI†) exhibits the size distribution of these CDs as 1–3 nm, 2–6 nm and 5–9 nm, revealing a similar rising tendency in size distribution from CDs-1 to CDs-3. According to the TEM and DLS results, the sizes of these CDs see a slight rise when the ratio of tartaric acid increases in the precursors, possibly caused by the higher proportion of tartaric acid producing larger carbon cores. We speculate that CDs derived from tartaric acid and m-aminophenol form polymer-like nanodots and the introduction of tartaric acid facilitates the formation of a carbon core. Corresponding high-resolution TEM (HRTEM) images of these CDs (inset in Fig. 1b–d) all display 0.21 nm of inter-planar spacing attributed to the (100) facet of graphene,19 revealing that a typical graphite-like structure is formed during the hydrothermal reaction.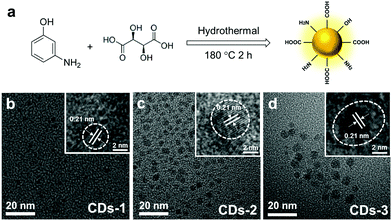 | ||
| Fig. 1 (a) Schematic diagram of the synthesis steps of CDs. (b), (c) and (d) TEM images of CDs-1, CDs-2, and CDs-3 (inset: the corresponding HRTEM images). | ||
The zeta potential (Fig. 2a) of these CDs was measured to be +4.5 ± 0.42 mV, +12.2 ± 0.14 mV and +33.2 ± 0.99 mV, respectively. The increase of positive charge of these CDs is mainly caused by the nitrogenous functional groups of CDs, which will be discussed in the following sections.
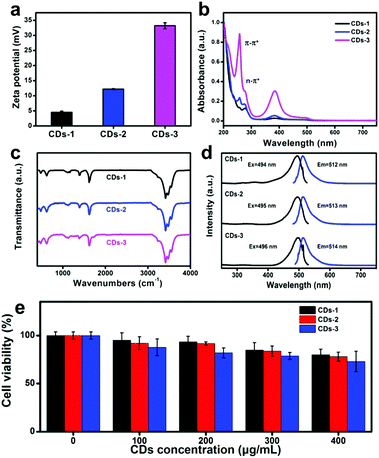 | ||
| Fig. 2 Zeta potential (a), UV-Vis absorption spectra (b), FTIR spectra (c), fluorescence spectra, including PL excitation/emission spectra (d) and cell viability (e) of CDs-1, CDs-2 and CDs-3. | ||
To explore the structure and the functional groups in these CDs, UV-vis absorption spectra and FTIR spectra were collected. The UV-vis absorption spectra (Fig. 2b) illustrate that all of the CDs exhibit similar absorption bands at 250 and 280 nm, which belong to the π–π* transition of the sp2 C structure and the n–π* transition of the surface functional groups, respectively. Obviously, the peak at 250 nm is increasingly stronger from CDs-1 to CDs-3, indicating that more and more benzene ring structures appear in the CDs with the increase of the content of tartaric acid in the precursor.
Fig. 2c shows the FTIR spectra of CDs-1 (black line), CDs-2 (blue line) and CDs-3 (pink line), exhibiting that there are abundant functional groups in these CDs. Taking CDs-3 as an example, the peaks at 3479 and 3549 cm−1, 3357 and 3410 cm−1 belong to the N–H and O–H groups.20 The peak at 1744 cm−1 is caused by the O–C![[double bond, length as m-dash]](https://www.rsc.org/images/entities/char_e001.gif) O groups.21 After the hydrothermal reaction, there is no O–C
O groups.21 After the hydrothermal reaction, there is no O–C![[double bond, length as m-dash]](https://www.rsc.org/images/entities/char_e001.gif) O group peak in CDs-1 and CDs-2, which confirms that the O–C
O group peak in CDs-1 and CDs-2, which confirms that the O–C![[double bond, length as m-dash]](https://www.rsc.org/images/entities/char_e001.gif) O group may participate in the formation of CD. For CDs-3, a peak appears at 1737 cm−1, indicating that the peak belongs to the two possibilities of the unreacted O–C
O group may participate in the formation of CD. For CDs-3, a peak appears at 1737 cm−1, indicating that the peak belongs to the two possibilities of the unreacted O–C![[double bond, length as m-dash]](https://www.rsc.org/images/entities/char_e001.gif) O group.
O group.
Fig. S2 (ESI†) shows the photographs of the CD solutions under daylight and ultraviolet lamp, indicating the strong yellow fluorescence of CDs. To better investigate the fluorescence property of CDs, fluorescence excitation and emission spectra were determined. As shown in Fig. 2d, these CDs have displayed similar fluorescence excitation spectra and emission spectra. The optimal fluorescence emission wavelength of these CDs are located at 512, 513 and 514 nm and the optimal fluorescence excitation wavelength of these CDs are at 494, 495, and 496 nm, respectively.
Before antibacterial experiments, the cell viability of these CDs was evaluated by CCK8 assay. As shown in Fig. 2e, all of these CDs show low toxicity on the HeLa cells. At even 400 μg mL−1 of these CDs, the cell viability of HeLa cells exceeds 70%, which are 80%, 78% and 73%, respectively.
To better understand the elementary composition, structure and the relationship between the bonding modes and surface charge, the XPS of these CDs were performed. Fig. 3a–c are the full-scan XPS spectra of these CDs, confirming that all of the CDs contain three elements involving carbon, nitrogen and oxygen and the corresponding atom ratio (Table S1, ESI†) of C![[thin space (1/6-em)]](https://www.rsc.org/images/entities/char_2009.gif) :
:![[thin space (1/6-em)]](https://www.rsc.org/images/entities/char_2009.gif) N
N![[thin space (1/6-em)]](https://www.rsc.org/images/entities/char_2009.gif) :
:![[thin space (1/6-em)]](https://www.rsc.org/images/entities/char_2009.gif) O in the CDs are 56.66%
O in the CDs are 56.66%![[thin space (1/6-em)]](https://www.rsc.org/images/entities/char_2009.gif) :
:![[thin space (1/6-em)]](https://www.rsc.org/images/entities/char_2009.gif) 7.08%
7.08%![[thin space (1/6-em)]](https://www.rsc.org/images/entities/char_2009.gif) :
:![[thin space (1/6-em)]](https://www.rsc.org/images/entities/char_2009.gif) 36.26% (CDs-1), 60.12%
36.26% (CDs-1), 60.12%![[thin space (1/6-em)]](https://www.rsc.org/images/entities/char_2009.gif) :
:![[thin space (1/6-em)]](https://www.rsc.org/images/entities/char_2009.gif) 6.56%
6.56%![[thin space (1/6-em)]](https://www.rsc.org/images/entities/char_2009.gif) :
:![[thin space (1/6-em)]](https://www.rsc.org/images/entities/char_2009.gif) 33.33% (CDs-2) and 69.62%
33.33% (CDs-2) and 69.62%![[thin space (1/6-em)]](https://www.rsc.org/images/entities/char_2009.gif) :
:![[thin space (1/6-em)]](https://www.rsc.org/images/entities/char_2009.gif) 3.81%
3.81%![[thin space (1/6-em)]](https://www.rsc.org/images/entities/char_2009.gif) :
:![[thin space (1/6-em)]](https://www.rsc.org/images/entities/char_2009.gif) 26.57% (CDs-3), respectively. Obviously, the proportion of C is increased and the proportion of N is decreased from CDs-1 to CDs-3.
26.57% (CDs-3), respectively. Obviously, the proportion of C is increased and the proportion of N is decreased from CDs-1 to CDs-3.
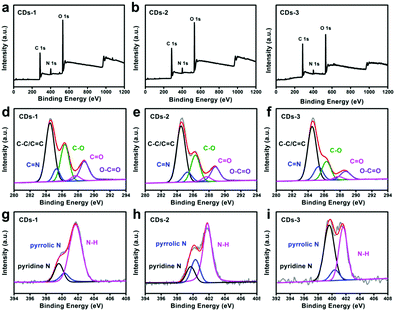 | ||
| Fig. 3 (a)–(c) The full-scan XPS spectra, (d)–(f) the high-resolution C 1s XPS spectra, and (g)–(i) the high-resolution N 1s XPS spectra of CDs-1, CDs-2 and CDs-3. | ||
As shown in Fig. 3d–f, the high-resolution C 1s spectra of CDs-1 and CDs-2 show five peaks including 284.6 (C–C/C![[double bond, length as m-dash]](https://www.rsc.org/images/entities/char_e001.gif) C bonds), 285.5 eV (C
C bonds), 285.5 eV (C![[double bond, length as m-dash]](https://www.rsc.org/images/entities/char_e001.gif) N bonds), 286.5 eV (C–O bonds), 287.8 eV (C
N bonds), 286.5 eV (C–O bonds), 287.8 eV (C![[double bond, length as m-dash]](https://www.rsc.org/images/entities/char_e001.gif) O bonds) and 288.7 eV (O–C
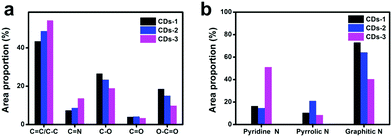
O bonds) and 288.7 eV (O–C![[double bond, length as m-dash]](https://www.rsc.org/images/entities/char_e001.gif) O bonds).22 As shown in Fig. 3g–i, the N 1s spectra of these CDs involve three peaks at 399.7 eV, 400.3 eV and 401.7 eV, which belong to pyridine N, pyrrolic N and N–H,23 respectively. To compare the change of bond modes in the CDs, the proportion of each peak in the C 1s and N 1s spectra was calculated and depicted in Fig. 4a and b. For the C 1s spectra, from CDs-1 to CDs-3, more C–C/C
O bonds).22 As shown in Fig. 3g–i, the N 1s spectra of these CDs involve three peaks at 399.7 eV, 400.3 eV and 401.7 eV, which belong to pyridine N, pyrrolic N and N–H,23 respectively. To compare the change of bond modes in the CDs, the proportion of each peak in the C 1s and N 1s spectra was calculated and depicted in Fig. 4a and b. For the C 1s spectra, from CDs-1 to CDs-3, more C–C/C![[double bond, length as m-dash]](https://www.rsc.org/images/entities/char_e001.gif) C (from 43.43% to 54.29%) and C
C (from 43.43% to 54.29%) and C![[double bond, length as m-dash]](https://www.rsc.org/images/entities/char_e001.gif) N bonds (from 7.41% to 13.66%) appear and the content of C–O bonds, C
N bonds (from 7.41% to 13.66%) appear and the content of C–O bonds, C![[double bond, length as m-dash]](https://www.rsc.org/images/entities/char_e001.gif) O bonds and O–C
O bonds and O–C![[double bond, length as m-dash]](https://www.rsc.org/images/entities/char_e001.gif) O bonds all decrease, suggesting that more sp2 C and C
O bonds all decrease, suggesting that more sp2 C and C![[double bond, length as m-dash]](https://www.rsc.org/images/entities/char_e001.gif) N structures are formed and a part of the carboxyl groups are involved in the formation of CDs. For the N 1s spectra, the level of pyridine N of CDs-3 is increased to 51.11% than 16.48% of CDs-1, meanwhile the level of N–H bonds in CDs-3 is decreased to 40.38% compared to the CDs-1 (73.04%), implying that the pyridine N structure is increased. These results reveal that the rise of surface charge is possibly a result of the formation of the pyrrolic N and pyridine N.
N structures are formed and a part of the carboxyl groups are involved in the formation of CDs. For the N 1s spectra, the level of pyridine N of CDs-3 is increased to 51.11% than 16.48% of CDs-1, meanwhile the level of N–H bonds in CDs-3 is decreased to 40.38% compared to the CDs-1 (73.04%), implying that the pyridine N structure is increased. These results reveal that the rise of surface charge is possibly a result of the formation of the pyrrolic N and pyridine N.
3.2 Antibacterial activity of the CDs
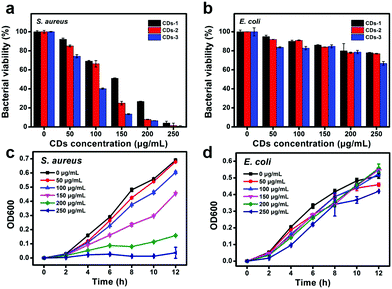
As shown above, three kinds of cationic CDs prepared from different molar ratios of m-aminophenol and tartaric acid exhibit low toxicity and positive surface charge. In the next study, the antibacterial activity of the CDs was investigated with Gram-positive bacteria, such as S. aureus, and Gram-negative bacteria, such as E. coli, as the model microorganisms to explore the antibacterial activity of these CDs. To explore the antibacterial behavior among the three CDs, equal amounts of bacterial suspension were treated with different concentrations (0, 50, 100, 150, 200, and 250 μg mL−1) of these CDs under the same conditions for 12 h. Then, the bacterial viability was assessed by comparing OD600 values of the bacterial suspension. Fig. 5a is the bacterial viability of S. aureus. It can be observed that the bacterial viability drops to 51.3%, 24.9% and 13.8% when these CDs are at 150 μg mL−1, indicating that the growth of bacteria is inversely proportional to the surface charge of CDs, and that CDs-3 has the optimal inhibitory effect on S. aureus. When the concentration of these CDs is up to 250 μg mL−1, the bacterial viability reduces to 4.4%, 1.6% and 0.7%, indicating that the antibacterial efficiency of CDs-1, CDs-2 and CDs-3 exceeds approximately 95.6%, 98.4% and 99.3% and the MIC value of CDs-3 on S. aureus is 250 μg mL−1. Next, the antibacterial activity of these CDs on E. coli is also carried out. As shown in Fig. 5b, the bacterial viability of E. coli is nearly 78.0%, 77.1% and 66.7% when treated with 250 μg mL−1 of CDs-1, CD-2 and CDs-3, revealing that none of these CDs possess an inhibitory effect on E. coli. To explore whether CDs can inhibit other Gram-positive bacteria, the antibacterial effect of CDs-3 on the Bacillus subtilis (B. subtilis) was carried out by an OD600 method. As shown in Fig. S3 (ESI†), CDs-3 can also inhibit the growth of B. subtilis and the inhibition effect gradually gets better with the increase of concentration from 50 to 250 μg mL−1 and the MIC values of CDs-3 on B. subtilis is 250 μg mL−1. These results indicate that CDs have a dose-dependent effect on the bacterial viability of S. aureus and B. subtilis but have little or no antibacterial activity towards E. coli. In the following test, CDs-3 is taken as an example to evaluate the time-dependent antibacterial tests and antibacterial mechanism of the CDs because of the strongest antibacterial activity. Fig. 5c and d are the time-dependent bacterial growth curve of S. aureus and E. coli incubated with different concentrations of CDs-3 by recording OD600 values, depicting that CDs-3 from 50 to 250 μg mL−1 inhibit the growth of S. aureus to different degrees, and in contrast, CDs-3 has little impact on E. coli.Besides, the colony forming unit (CFU) counting method was used to further evaluate the MBC of CDs-3. As shown in Fig. 6, when CDs-3 reached 250 μg mL−1, the CFU of S. aureus obviously dropped down to naught within 12 h compared to the CFU of the control group (5.31 × 10⁶), indicating a prominent inhibitory effect of CDs-3 on S. aureus. In contrast, the CFU of E. coli treated with CDs-3 decrease to 2.84 × 10⁶ in comparison to the control group (4.30 × 10⁶).
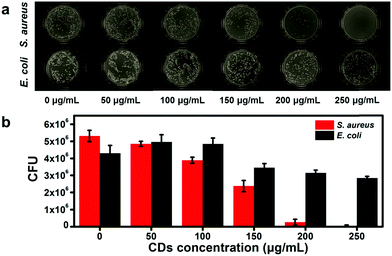 | ||
| Fig. 6 (a) and (b) Colony formation evaluation of S. aureus and E. coli treated with different concentrations of CDs-3. | ||
3.3 Antibacterial mechanism of CDs
To understand the selective inactivation on S. aureus, the difference between Gram-positive and Gram-negative bacteria in the composition of cell walls need to be taken into consideration.14,15 In the case of Gram-positive bacteria, S. aureus, for example, much of the anionic components like teichoic acids are rich on their cell walls, contributing to the combination of positively charged CDs and S. aureus. As for E. coli, a Gram-negative bacteria, their cell wall consists of multiple layers including peptidoglycan, lipoprotein, phospholipid layer and lipopolysaccharide. Although some negatively charged components will be combined with some CDs, the multilayer membrane structure of E. coli still restrains the penetration of CDs. Therefore, the difference in cell walls may result in the selective inactivation of CDs on S. aureus.Fig. S4 (ESI†) is the confocal image of S. aureus and E. coli incubated with CDs-3 for 30 min. S. aureus treated with CDs-3 shows green fluorescence and is well-overlaid with the bright field channel, but no fluorescence appeared in the green channel of E. coli treated with CDs, indicating that CDs can selectively enter into S. aureus but not E. coli. Zeta potential analysis (Fig. 7a) further proved that S. aureus (−30.5 ± 2.8 mV) have more negative charge than E. coli (−16.2 ± 1.6 mV). The potential was also measured after the bacteria bonded to the CDs, and the results (Fig. 7a) showed that S. aureus/CDs was slightly more positive (−10.2 ± 2.5 mV) than that of E. coli/CDs (−15 ± 2.2 mV). This may be because the surface of Staphylococcus aureus bonded to more CDs, leading to an increase of zeta potential. Thus, positively charged CDs are more likely to combine with the teichoic acid on the surface of S. aureus by electrostatic interaction, and then the cell membrane permeability and the exchange of substances between S. aureus and the environment will be disturbed and ultimately lead to the death of S. aureus. To prove the above-mentioned assumption, the effect of CDs on the morphology of two types of bacteria was obtained by using SEM analysis. It can be observed in Fig. 7b that the cell walls of S. aureus treated with CDs-3 are leaking and broken, in contrast, those of E. coli exposed to the same concentration of CDs-3 have only slightly shrunk, indicating that CDs can selectively damage the cell walls of S. aureus by electrostatic interaction.
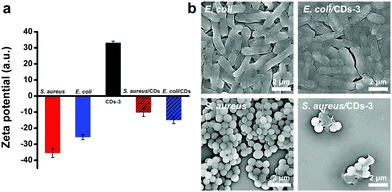 | ||
| Fig. 7 (a) Zeta potential of S. aureus, E. coli, CDs-3, S. aureus/CDs, and E. coli/CDs. (b) Bacterial morphology of E. coli and S. aureus treated with or without CDs-3. | ||
4. Conclusions
A series of low toxic CDs with different positive-surface charge were prepared by a hydrothermal method. The surface charge of these CDs can be regulated from +4.5 ± 0.42 mV to +33.2 ± 0.99 mV by increasing the content of nitrogenous functional groups. In addition, CDs can selectively kill S. aureus but not E. coli. The morphology study of bacteria shows that only the cell walls of S. aureus treated with CDs were broken. This work provides a new synthesis route of cationic CDs and a novel method to adjust the surface charge of CDs, which will promote their great bio-application as promising alternative antibacterial agents.Conflicts of interest
There are no conflicts to declare.Acknowledgements
This work is supported by the National MCF Energy R&D Program (2018YFE0306105), the Innovative Research Group Project of the National Natural Science Foundation of China (51821002), the National Natural Science Foundation of China (51725204, 21771132, 51972216, 52041202) at the Natural Science Foundation of Jiangsu Province (BK20190041), the Key-Area Research and Development Program of GuangDong Province (2019B010933001), the Collaborative Innovation Center of Suzhou Nano Science & Technology, the Priority Academic Program Development of Jiangsu Higher Education Institutions (PAPD), and the 111 Project.Notes and references
- J. Davies and D. Davies, Microbiol. Mol. Biol. Rev., 2010, 74, 417–433 CrossRef CAS.
- A. Marr, W. Gooderham and R. Hancock, Curr. Opin. Pharmacol., 2006, 6, 468–472 CrossRef CAS.
- P. V. Asharani, Y. Lian Wu, Z. Gong and S. Valiyaveettil, Nanotechnology, 2008, 19, 255102 CrossRef CAS.
- H. M. Yadav, J.-S. Kim and S. H. Pawar, Korean J. Chem. Eng., 2016, 33, 1989–1998 CrossRef CAS.
- L. Wang, X. Zhang, X. Yu, F. Gao, Z. Shen, X. Zhang, S. Ge, J. Liu, Z. Gu and C. Chen, Adv. Mater., 2019, 31, 1901965 CrossRef.
- M. J. Meziani, X. Dong, L. Zhu, L. P. Jones, G. E. LeCroy, F. Yang, S. Wang, P. Wang, Y. Zhao, L. Yang, R. A. Tripp and Y.-P. Sun, ACS Appl. Mater. Interfaces, 2016, 8, 10761–10766 CrossRef CAS.
- H. Chen, B. Wang, D. Gao, M. Guan, L. Zheng, H. Ouyang, Z. Chai, Y. Zhao and W. Feng, Small, 2013, 9, 2735–2746 CrossRef CAS.
- L. Shi, J. Chen, L. Teng, L. Wang, G. Zhu, S. Liu, Z. Luo, X. Shi, Y. Wang and L. Ren, Small, 2016, 12, 4165–4184 CrossRef CAS.
- Q. Xin, H. Shah, A. Nawaz, W. Xie, M. Z. Akram, A. Batool, L. Tian, S. U. Jan, R. Boddula, B. Guo, Q. Liu and J. R. Gong, Adv. Mater., 2019, 31, 1804838 CrossRef CAS.
- F. Arcudi, L. Đorđević and M. Prato, Acc. Chem. Res., 2019, 52, 2070–2079 CrossRef CAS.
- Y. Choi, X. T. Zheng and Y. N. Tan, Mol. Syst. Des. Eng., 2020, 5, 67–90 RSC.
- H. Li, Z. Kang, Y. Liu and S.-T. Lee, J. Mater. Chem., 2012, 22, 24230 RSC.
- X. Chen, X. Zhang, F. Lin, Y. Guo and F. Wu, Small, 2019, 15, 1901647 CrossRef.
- J. Yang, G. Gao, X. Zhang, Y.-H. Ma, X. Chen and F.-G. Wu, Carbon, 2019, 146, 827–839 CrossRef CAS.
- X. Zhang, X. Chen, J. Yang, H.-R. Jia, Y.-H. Li, Z. Chen and F.-G. Wu, Adv. Funct. Mater., 2016, 26, 5958–5970 CrossRef CAS.
- Y.-J. Li, S. G. Harroun, Y.-C. Su, C.-F. Huang, B. Unnikrishnan, H.-J. Lin, C.-H. Lin and C.-C. Huang, Adv. Healthcare Mater., 2016, 5, 2545–2554 CrossRef CAS.
- H. Li, J. Huang, Y. Song, M. Zhang, H. Wang, F. Lu, H. Huang, Y. Liu, X. Dai, Z. Gu, Z. Yang, R. Zhou and Z. Kang, ACS Appl. Mater. Interfaces, 2018, 10, 26936–26946 CrossRef CAS.
- W. Bing, H. Sun, Z. Yan, J. Ren and X. Qu, Small, 2016, 12, 4713–4718 CrossRef CAS.
- H. Li, Z. Kang, Y. Liu and S.-T. Lee, J. Mater. Chem., 2012, 22, 24230 RSC.
- H. Wang, M. Zhang, Y. Song, H. Li, H. Huang, M. Shao, Y. Liu and Z. Kang, Carbon, 2018, 136, 94–102 CrossRef CAS.
- R. Ludmerczki, S. Mura, C. M. Carbonaro, I. M. Mandity, M. Carraro, N. Senes, S. Garroni, G. Granozzi, L. Calvillo, S. Marras, L. Malfatti and P. Innocenzi, Chem. – Eur. J., 2019, 25, 11963–11974 CrossRef CAS.
- S. Ratso, I. Kruusenberg, A. Sarapuu, P. Rauwel, R. Saar, U. Joost, J. Aruväli, P. Kanninen, T. Kallio and K. Tammeveski, J. Power Sources, 2016, 332, 129–138 CrossRef CAS.
- S. Wu, R. Zhou, H. Chen, J. Zhang and P. Wu, Nanoscale, 2020, 12, 5543–5553 RSC.
Footnotes |
| † Electronic supplementary information (ESI) available. See DOI: 10.1039/d0tb02332a |
| ‡ H. B. Wang and F. Lu contributed equally to this work. |
| This journal is © The Royal Society of Chemistry 2021 |

