Enhanced electrical properties and restrained thermal transport in p- and n-type thermoelectric metal–organic framework hybrids†
Xia
Qi
a,
Yizhuo
Wang
a,
Kuncai
Li
a,
Jing
Wang
a,
Hao-Li
Zhang
 c,
Choongho
Yu
 d and
Hong
Wang
 *abe
*abe
aFrontier Institute of Science and Technology, Xi'an Jiaotong University, Xi'an, 710054, China. E-mail: hong.wang@xjtu.edu.cn
bState Key Laboratory of Multiphase Flow in Power Engineering, Xi'an Jiaotong University, Xi'an, 710054, China
cState Key Laboratory of Applied Organic Chemistry (SKLAOC), College of Chemistry and Chemical Engineering, Lanzhou University, Lanzhou, 730000, China
dMechanical Engineering Department, Texas A&M University, College Station, Texas 77843, USA
eZhejiang Yunfeng New Materials Technology Co., Ltd., No. 755 Hongji Street, Jindong District, Jinhua, Zhejiang 321015, China
First published on 25th November 2020
Abstract
Making organic devices with a single material is very challenging although single material devices have been considered as the next generation device for organic electronics. Here we report an effective approach to improve the thermoelectric (TE) performance of p- and n-type metal–organic framework (MOF) based hybrids. The polarity of the mixed-carrier hybrids was demonstrated to be determined by the component with a higher carrier concentration. A selective increase in the three key TE parameters was observed, leading to a dramatic enhancement in ZT. The maximum ZT value was boosted up to ∼270 times compared with the ZT of a pristine MOF , which is over 7 times higher than the previously reported ZT record for MOFs. Charge transport mechanism analysis reveals that a parallel transport model fits well with the change of the three TE parameters as a function of the CNT fillers. An all-MOF device was fabricated to show the energy conversion performance of this single-material TE device. Selective improvement in electrical properties and restraint in thermal conductivity present an efficient approach of developing MOF based TE materials. The study of the mixed carrier in a hybrid may lay a foundation for developing single-material organic electronics for various applications such as single material solar cells.
Introduction
Thermoelectric (TE) materials can directly convert waste heat to electricity without emitting greenhouse or/and hazardous gases.1,2 This green energy material has attracted much attention due to global warming and environmental pollution. In order to have a high heat-to-electricity conversion efficiency, TE materials should have low thermal conductivity (κ), high electrical conductivity (σ), and a high Seebeck coefficient (S) at their working temperature (T),3 which comprises the TE figure of merit called ZT (=S2σT/κ). For example, introducing porosity into materials can be an effective strategy to improve the TE performance by lowering their thermal conductivity.4–6 Metal–organic frameworks (MOFs) are microporous crystalline materials formed by connecting metal atoms with organic ligands via coordination bonds. Despite the presence of metals, they typically have a low thermal conductivity lower than 0.4 W m−1 K−1 because the metals are connected by organic ligands.7–11 The low thermal conductivity and tailorable functionality make MOFs promising candidates for lightweight thermoelectrics.12Nevertheless, the low electrical conductivity of MOFs largely inhibits the development of high-performance TE materials. MOFs often have poor electrical conductivity lower than 10−3 S cm−1, which results in very low ZT values.13,14 For instance, Cu3(benzene-1,3,5-tricarboxylate)2 doped with 7,7,8,8-tetracyanoquinodimethane (TCNQ) (Cu3(BTC)2-TCNQ) has a low ZT value of 7 × 10⁻⁵ at room temperature because its electrical conductivity is only 0.07 S cm−1, despite a favorable thermal conductivity and Seebeck coefficient, 0.27 W m−1 K−1 and 375 μV K−1, respectively.8,15 This ZT value was the highest recorded for MOFs in 2015.8
It is obvious that improving electrical conductivity is crucial to have a viable thermoelectric performance from MOFs. Over recent years, it has been reported that MOFs can have electrical conductivity over 1 S cm−1 by promoting metal–ligand charge transfer or introducing redox-active guest molecules to create a new pathway for charge transfer.10,16–22 This improvement has encouraged further development of MOF-based TE materials. For example, Zhu et al. reported that a highly conducting MOF, copper bis(dithiolene) complex (Cu–BHT) has an electrical conductivity of 1580 S cm−1 and a Seebeck coefficient in the range of −4 μV K−1 to −10 μV K−1.16 The power factor (PF, S2σ) of Cu–BHT is about 2.6 to 16 times higher than that of the previously reported electrically resistive Cu3(BTC)2-TCNQ. Recently, a new ZT record of MOF-based TE materials that Ni(2,3,6,7,10,11-hexaiminotriphenylene)2 (Ni3(HITP)2) showed a high electrical conductivity of 62 S cm−1 and low thermal conductivity of 0.21 W m−1 K−1 at 25 °C was reported by Dinca et al.10. Despite the low Seebeck coefficient, −11.9 μV K−1, the ZT value of Ni3(HITP)2 reached up to 1.19 × 10⁻³, which is 17 times higher than that of Cu3(BTC)2-TCNQ.8,10
However, MOFs with high TE performance are still very rare, which could be mainly attributed to the following reasons. Firstly, it remains very challenging to design MOFs with high electrical conductivity due to insufficient understanding of the transport mechanism in MOFs to date.23,24 This causes not only low electrical conductivity but also large variations even when there are minor differences in synthesis conditions and morphologies in the samples. Taking Ni3(HITP)2 as an example, the electrical conductivity of its films is 40 S cm−1, which is 20 times higher than those of pellets.20 For pellets prepared with similar methods, different electrical conductivities such as 2 S cm−1,13 59 S cm−1,10 and 0.7 S cm−1, 25 were reported at room temperature by different authors since electrical conductivity is sensitive to many factors such as the crystallinity and crystallite size of MOFs, trace amount elements in MOFs, etc.25 Secondly, improving the electrical conductivity of MOFs often reduces the Seebeck coefficient too much, preventing the improvement of ZT values.10,16 Therefore, it is necessary to attempt new strategies to obtain reliable and better TE performance of MOF-based materials.
Carbon nanotubes (CNTs) can provide highly conducting channels to increase the electrical conductivity of MOF-based composites due to their high carrier mobility.26,27 CNTs have been used to synthesize composites to enhance TE performance as well as decouple σ and S. For example, Wang et al. reported that both electrical conductivity and the Seebeck coefficient can be simultaneously enhanced by making polyaniline–CNT composites.28 This approach has been employed in various polymer composites to seek high TE performance.29–31 The TE performance of multi-walled CNTs has been dramatically enhanced recently, which could be largely scalable at a low cost.32 This research may reduce the cost of CNT based TE composites. The high carrier mobility of CNTs can improve electrical conductivity while the reduction in the Seebeck coefficient is minimized. In the meantime, the junction between the CNTs could impede the transport of low energy electronic carriers, leading to a high Seebeck coefficient.27,33–37
CNTs are typically used as p-type materials29,38 although it is possible to convert them into n-type materials with n-type dopants such as polyethyleneimine (PEI) through physical absorption.39,40 When CNTs are exposed to air, oxygen doping causes p-type doping on CNTs39,41 so n-type CNTs typically lack long term stability. The reason could be attributed to weak and non-covalent bonding between dopants and CNTs, which could reverse the n-type CNT back into p-type. Another approach for making n-type composites is to mix p-type CNTs with n-type TE materials.42 This approach may cause mixed carrier issues, which may change the n-type properties of the material into p-type.43 For example, Toshima et al. introduced p-type CNTs into an n-type coordination polymer, poly(nickel 1,1,2,2-ethenetetrathiolate) (PETT), to increase the electrical conductivity of these n-type TE materials. The mixed carriers in the composite, however, lead to a p-type Seebeck coefficient of 30 μV K−1 with a relatively low CNT concentration of 13%.43 Singe material devices have been considered as the next-generation device in photovoltaics. The concept may arouse interest in studying mixed carrier organic composites.
Herein, we used a conducting n-type MOF, Ni3(HITP)2, and single-walled CNTs with/without PEI and synthesized three different types of n-type or p-type MOF–CNT composites (Scheme 1). To the best of our knowledge, the hybridization of MOFs and CNTs for improving TE performances has never been reported before. When pristine p-type CNTs were mixed with the MOF, the hybrid exhibited p-type properties like in a previously reported study by Toshima et al.43 The ZT value obtained for the p-type MOF hybrids with 30-wt% CNT is 8.77 × 10⁻³, which is dramatically increased up to two orders of magnitude in comparison to ZT of pristine Ni3(HITP)2. This value, to the best of our knowledge, is ∼7.4 times higher than that of the newly reported ZT record of MOFs by Dinca and co-workers.10 The remarkable improvement in ZT can be attributed to the large increase in electrical conductivity from 3.6 S cm−1 to 150 S cm−1 and the p-type Seebeck coefficient up to 40 μV K−1. The hybrid of Ni3(HITP)2 and CNT cannot be directly converted from p-type to n-type by PEI as shown in Scheme 1.
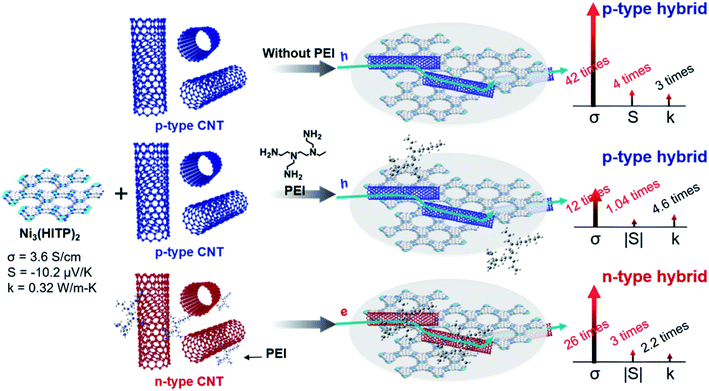 | ||
| Scheme 1 Three different preparation methods of MOF–CNT hybrids and the corresponding changes in thermoelectric properties. | ||
On the other hand, when n-type PEI-CNTs were mixed with the MOF, the hybrid exhibited n-type properties. The ZT of our n-type hybrid is 3.63 × 10⁻³, which is increased by over 69 times in comparison to that of the pristine Ni3(HITP)2 and ∼3 times larger than the highest ZT of previously reported MOFs.10,25,44,45 Both the n-type and p-type hybrids showed great stability over 28 days in an air environment. This work provides insight into how to utilize MOFs for TE applications as well as performance improvement by hybridization of MOFs with CNTs, which may also apply to other applications such as electronic and optoelectronic applications, sensors, electrochemical catalysts, etc.46,47
Results and discussion
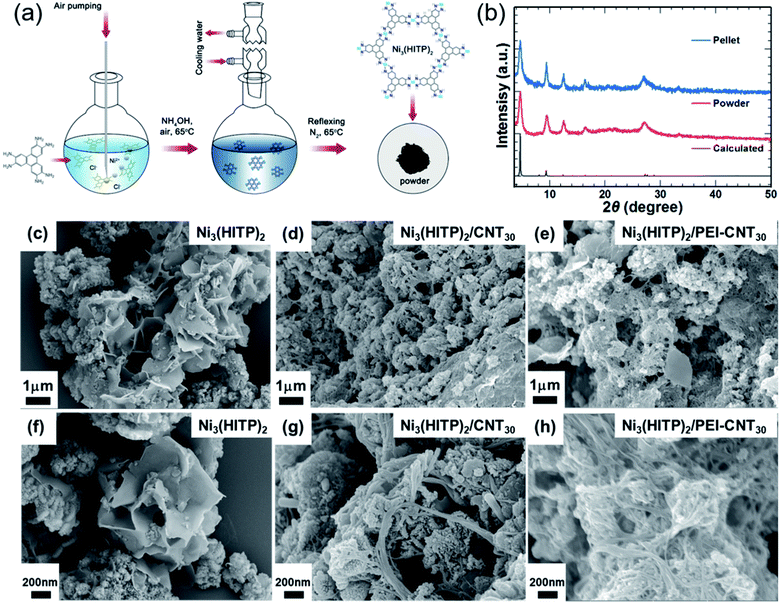
Ni3(HITP)2 was synthesized according to a previously reported procedure, as shown in Fig. 1a.20 Typically, 2,3,6,7,10,11-hexaaminotriphenylene hexahydrochloride (HATP·6HCl) and NiCl2·6H2O were dissolved in deionized water. The mixture was reacted at 65 °C under continuous air bubbling for 45 min and then N2 for 2 h at 65 °C. Then, the obtained black precipitates were washed with water, ethanol, and acetone, and dried in a vacuum at 40 °C. According to elemental analysis, C, H, N, and Ni concentrations are 51.24%, 3.78%, 19.41%, and 25.57% of the total weight, respectively, which is similar to the results reported by Sun et al.10 The molecular structure is expected to be Ni3(C18H12N6)1.9·2(C3H6O)·2H2O. Grazing-incidence wide-angle X-ray scattering has shown the layered structure of Ni3(HITP)2 (shown in Fig. S1†), and powder X-ray diffraction (PXRD) identified the structure of Ni3(HITP)2 (Fig. 1b). Prominent peaks appeared at 2θ = 4.7°, 9.5°, 12.6°, 16.5°, and 27.3°, which are consistent with the previously reported crystal structure of Ni3(HITP)2.10,19,20 Scanning electron microscopy (SEM) indicates that Ni3(HITP)2 powders contain two distinct morphological components: nanoparticles and nano-flakes (Fig. 1c and f). The nanoparticles and nano-flakes are considered to form in the solution and at the air-solution interface, respectively, as reported previously for related 2D MOFs.17,19The MOF hybrids were then prepared by mixing Ni3(HITP)2 with pristine CNTs and PEI-CNTs. Firstly, pristine CNTs were dispersed in dimethyl sulfoxide (DMSO) with sodium dodecylbenzenesulfonate at a weight ratio of 1![[thin space (1/6-em)]](https://www.rsc.org/images/entities/char_2009.gif) :
:![[thin space (1/6-em)]](https://www.rsc.org/images/entities/char_2009.gif) 5. The well-dispersed CNT solution could be used as a p-type filler or it was used as an n-type filler after adding a certain amount of PEI. Then, the as-synthesized Ni3(HITP)2 powder was added to the prepared pristine CNT solution or PEI-CNT solution. The mixture was sonicated for 5 min before being filtered. Black Ni3(HITP)2/CNT and Ni3(HITP)2/PEI-CNT powders were obtained after washing thoroughly with DMSO and ethanol and then dried in a vacuum oven at 40 °C. Fourier-transform infrared spectroscopy (FTIR) and X-ray diffraction (XRD) indicated that the CNTs and Ni3(HITP)2 were well mixed together, as shown in Fig. S2 and S3.†
5. The well-dispersed CNT solution could be used as a p-type filler or it was used as an n-type filler after adding a certain amount of PEI. Then, the as-synthesized Ni3(HITP)2 powder was added to the prepared pristine CNT solution or PEI-CNT solution. The mixture was sonicated for 5 min before being filtered. Black Ni3(HITP)2/CNT and Ni3(HITP)2/PEI-CNT powders were obtained after washing thoroughly with DMSO and ethanol and then dried in a vacuum oven at 40 °C. Fourier-transform infrared spectroscopy (FTIR) and X-ray diffraction (XRD) indicated that the CNTs and Ni3(HITP)2 were well mixed together, as shown in Fig. S2 and S3.†
The morphologies of Ni3(HITP)2 with 30 wt% of CNT hybrids (Ni3(HITP)2/CNT30) and Ni3(HITP)2 with 30 wt% of PEI-CNT hybrids (Ni3(HITP)2/PEI-CNT30) are shown in Fig. 1c–h at two different magnifications. Both Ni3(HITP)2/CNT30 and Ni3(HITP)2/PEI-CNT30 hybrids are composed of irregular shaped nanoparticles/nanoflakes and nanowires. The nanoparticles/nanoflakes are Ni3(HITP)2 and nanowires are CNT bundles that are covered by Ni3(HITP)2. It is observed that the diameter of PEI-CNT bundles in Ni3(HITP)2/PEI-CNT30 was larger than that of pristine CNT bundles in Ni3(HITP)2/CNT30, suggesting that the dispersion of CNTs in Ni3(HITP)2/CNT30 is better than that of PEI-CNTs in Ni3(HITP)2/PEI-CNT30. This could be attributed to a stronger electrostatic interaction between n-type Ni3(HITP)2 and p-type pristine CNTs than that between n-type Ni3(HITP)2 and n-type PEI-CNTs. This result is consistent with previously reported work by Toshima and co-workers, which stated that p-type CNTs can be well dispersed with n-type poly(nickel 1,1,2,2-ethenetetrathiolate) (n-PETT) but not with p-type Cu-containing PETT.43
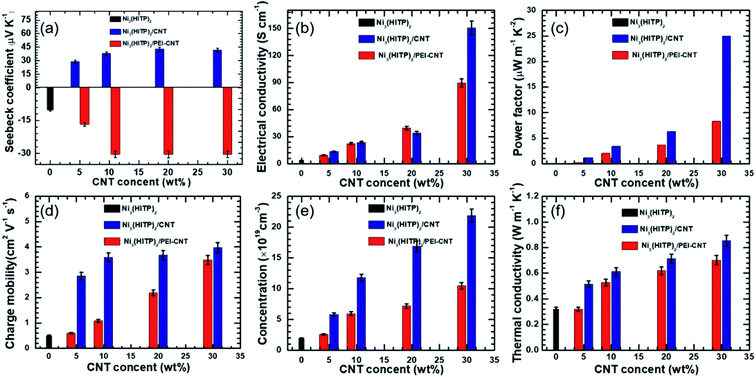
The thermoelectric properties of Ni3(HITP)2 and its hybrids were measured in the form of pressed pellets. Original Ni3(HITP)2 shows a negative Seebeck coefficient of −10.2 μV K−1 (Fig. 2a), demonstrating that Ni3(HITP)2 is an n-type material. When it was mixed with pristine CNTs or PEI-CNTs, the absolute values of the Seebeck coefficient of the hybrids increased with more CNTs. The maximum p-type and n-type Seebeck coefficients were found to be 40.7 μV K−1 and −30.5 μV K−1 for Ni3(HITP)2/CNT30 and Ni3(HITP)2/PEI-CNT30, respectively. It was difficult to obtain pellets when the CNT concentration was greater than 30 wt%. The positive Seebeck coefficients from Ni3(HITP)2/CNT hybrids and negative Seebeck coefficients from Ni3(HITP)2/PEI-CNT hybrids indicate that the majority carriers are holes and electrons, respectively. It is hypothesized that there should be a charge transfer interaction between the p-type CNTs and n-type Ni3(HITP)2, which results in p-type properties from Ni3(HITP)2/CNT hybrids.
The electrical conductivity of a Ni3(HITP)2 pellet was measured to be 3.6 S cm−1, which is in the range of the electrical conductivities (0.7–58 S cm−1) for Ni3(HITP)2.10,20,25 The absolute values of the Seebeck coefficient and electrical conductivity of the hybrids increased with a higher CNT concentration (Fig. 2a and b). The maximum electrical conductivities are 150 S cm−1 and 90 S cm−1 for the p-type hybrid, Ni3(HITP)2/CNT30, and the n-type hybrid, Ni3(HITP)2/PEI-CNT30, respectively. The higher electrical conductivity of Ni3(HITP)2/CNT30 is attributed to the better dispersion of CNTs in Ni3(HITP)2/CNT30. The simultaneous improvements in both electrical conductivity and the Seebeck coefficient resulted in relatively high power factors of 24.86 μW m−1 K−2 and 8.37 μW m−1 K−2 for the p-type Ni3(HITP)2/CNT30 and n-type Ni3(HITP)2/PEI-CNT30, respectively (Fig. 2c). The simultaneous enhancement in the electrical conductivity and Seebeck coefficient should be derived from the CNT fillers. CNTs and PEI-CNTs have high electrical conductivities of 700 S cm−1 and 735 S cm−1, respectively, and high Seebeck coefficients of 54 μV K−1 and −32 μV K−1, respectively. The power factor was enhanced by ∼6 × 10² and ∼2 × 10² times for p-type Ni3(HITP)2/CNT30 and n-type Ni3(HITP)2/PEI-CNT30 in comparison to that of pristine Ni3(HITP)2, respectively. It is noticed that the p-type Ni3(HITP)2/CNT hybrid cannot be converted into n-type by PEI which might be due to the coverage of Ni3(HITP)2 on the surface of the CNTs that prohibits n-type dopants from approaching CNTs. The ZT values of Ni3(HITP)2 hybrids as a function of the CNT (or PEI-CNT) concentration have been shown in Fig. S5 in the ESI,† which increase with the rise of the concentration of the fillers.
The Hall measurement results (Fig. 2d and e) showed that the carrier concentration and charge mobility of pristine Ni3(HITP)2 at room temperature are 2.6 × 1019 cm−3 and 0.5 cm2 V−1 s−1, respectively, which were increased as a function of the CNT concentration increase and their CNT hybrids have higher carrier concentrations and mobilities. The higher carrier concentration with a higher number of CNTs can be ascribed to the high carrier concentration (as high as 1021 cm−3)38 of the CNTs. The mobility of CNTs varies widely depending on the junction between the CNTs unless individual CNTs are separately measured. When electrically insulating amorphous molecules are between CNTs, mobility can be as low as ∼0.4 cm2 V−1 s−1.38 When electrically conducting and more crystalline polymers are used together with CNTs, mobility can be as high as 19 cm2 V−1 s−1.48 This suggests that the conducting and crystalline MOF helps to promote carrier mobility, which is ideal in improving electrical conductivity without sacrificing the Seebeck coefficient.28,49
Fig. 2f shows the thermal conductivities of Ni3(HITP)2 and its hybrids at room temperature. Pristine Ni3(HITP)2 has a low thermal conductivity of 0.32 W m−1 K−1, which increases with the increase of the CNT concentration. The maximum thermal conductivities are 0.85 W m−1 K−1 and 0.69 W m−1 K−1 for Ni3(HITP)2/CNT30 and Ni3(HITP)2/PEI-CNT30, respectively. The higher thermal conductivity of Ni3(HITP)2/CNT30 compared with Ni3(HITP)2/PEI-CNT30 should be attributed to the better dispersion of CNTs in Ni3(HITP)2/CNT30. For the hybrids, a parallel model (eqn (1)) may be used to calculate their thermal conductivities.50
| k = kCNT-fillerVCNT-filler + kMOFVMOF | (1) |
The volume fractions of CNT fillers are ∼28% for both Ni3(HITP)2/PEI-CNT30 and Ni3(HITP)2/CNT30. Hence, the thermal conductivity of CNT fillers is calculated to be 2.2 W m−1 K−1 and 1.65 W m−1 K−1 for Ni3(HITP)2/CNT30 and Ni3(HITP)2/PEI-CNT30, respectively, which are much lower than the intrinsic thermal conductivity of individual CNTs (∼103 W m−1 K−1).51
The discrepancy is likely due to the thermal resistance between CNTs as well as CNTs and MOF junctions.51 Assuming that the CNT formed random three-dimensional networks, the thermal conductance between CNTs (G) in Ni3(HITP)2/CNT30 and Ni3(HITP)2/PEI-CNT30 can be calculated with eqn (2) as follows:50,52
 | (2) |
| n = ρ/2πRLnσm | (3) |
The energy filtering effect often exists in composites for TE materials. However, it is interesting to find that the Seebeck coefficients and electrical conductivity of Ni3(HITP)2/CNT30 and Ni3(HITP)2/PEI-CNT30 fit well with the parallel model, which indicates that the energy filtering effect is negligible in our composites. In 2009, Gelbstein55 suggested that the Seebeck coefficient and electrical conductivity can be defined by using parallel and series models in a composite with two components by assuming that the interface effects between the two components are neglected. The Seebeck coefficient is given by eqn (4) for the parallel mode and eqn (5) for the series model as follows:
 | (4) |
 | (5) |
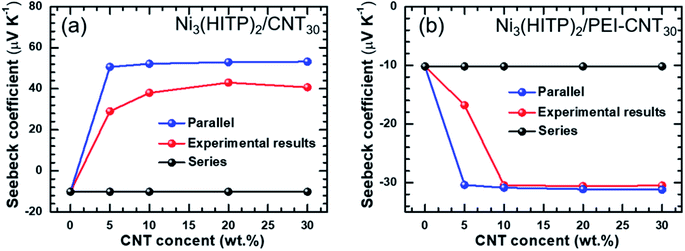 | ||
| Fig. 3 The comparison of theoretical Seebeck coefficients obtained from a parallel model with the experimental values: (a) Ni3(HITP)2/CNT30; (b) Ni3(HITP)2/PEI-CNT30. | ||
Temperature-dependent thermoelectric properties were also measured, as shown in Fig. 4 and S6–S8.† The ZT values of Ni3(HITP)2/CNT30 and Ni3(HITP)2/PEI-CNT30 as a function of temperature have been shown in Fig. S6 in the original ESI.† The temperature range was selected according to thermogravimetric analysis (TGA) of Ni3(HITP)2 (Fig. S9†). The Seebeck coefficient and electrical conductivity at room temperature of the p-type hybrid Ni3(HITP)2/CNT30 and n-type Ni3(HITP)2/PEI-CNT30 are between those of the individual components Ni3(HITP)2, CNTs (p-type), and PEI-CNTs (n-type), which is typical according to the general rule of mixture for composites, suggesting that CNTs and PEI-CNTs play a dominant role in the electrical transport properties of the hybrid. The electrical conductivities and the Seebeck coefficients of Ni3(HITP)2/CNT30, Ni3(HITP)2/PEI-CNT30, and Ni3(HITP)2 exhibit typically semiconducting properties that the electrical conductivities increase and the Seebeck coefficients decrease when increasing the temperature. The thermal conductivity of all samples does not change with temperature much, indicating that the samples have good thermal stability, as shown in Fig. 4d.
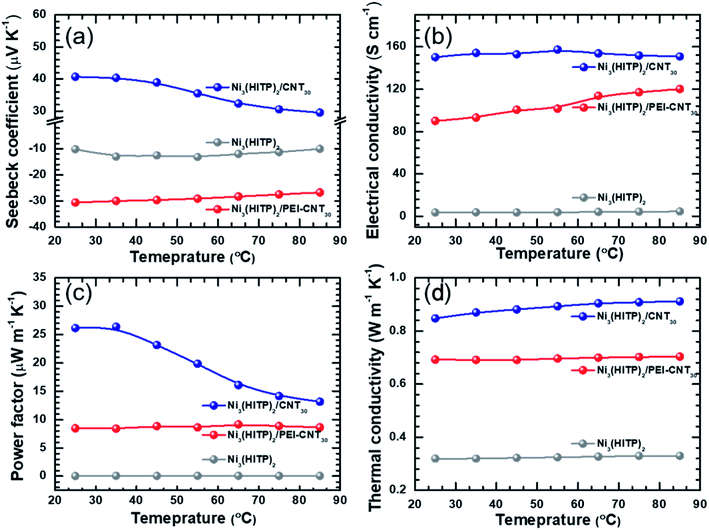 | ||
| Fig. 4 Temperature-dependent (a) Seebeck coefficient; (b) electrical conductivity; (c) power factor; (d) thermal conductivity of Ni3(HITP)2, Ni3(HITP)2/PEI-CNT and Ni3(HITP)2/CNT30. | ||
The electronic and lattice contribution to the total thermal conductivity could be estimated from the measurement results. Fig. S7† shows the electronic thermal conductivity (κele) and lattice thermal conductivity of Ni3(HITP)2, Ni3(HITP)2/CNT30 and Ni3(HITP)2/PEI-CNT30 as a function of temperature. The total thermal conductivity of Ni3(HITP)2 is 0.32 W m−1 K−1 with a low electronic thermal conductivity of 0.0026 W m−1 K−1 due to its low electrical conductivity and a low lattice thermal conductivity of 0.317 W m−1 K−1 due to its porous structure. After introducing conducting fillers, both the electronic thermal conductivity and the lattice thermal conductivity increase. The electronic thermal conductivities increase to 0.13 W m−1 K−1 and 0.06 W m−1 K−1 for Ni3(HITP)2/CNT30 and Ni3(HITP)2/PEI-CNT30, respectively while the lattice thermal conductivities increase to 0.72 W m−1 K−1 and 0.63 W m−1 K−1 for Ni3(HITP)2/CNT30 and Ni3(HITP)2/PEI-CNT30, respectively. Ni3(HITP)2/CNT30 has a higher electronic thermal conductivity due to its higher electrical conductivity compared to Ni3(HITP)2/PEI-CNT30. It also has a higher lattice thermal conductivity compared to Ni3(HITP)2/PEI-CNT30, which should be attributed to the stronger electrostatic interaction between n-type Ni3(HITP)2 and p-type pristine CNTs than between n-type Ni3(HITP)2 and n-type PEI-CNTs. The stronger electrostatic interaction leads to better dispersion of CNTs in the hybrid of Ni3(HITP)2/CNT30 as identified in Fig. 1e. The total thermal conductivity of the hybrids is dominated by the lattice thermal conductivity for both Ni3(HITP)2/CNT30 and Ni3(HITP)2/PEI-CNT30 since their electrical conductivities are not high, which are 150 S cm−1 and 90 S cm−1, respectively. According to the Wiedemann–Franz law, κele = LσT, where L is the Lorenz numbers, which can be estimated from a measured Seebeck coefficient based on a simplified model L = 1.5 + exp(−S/116).57 The calculated Lorenz numbers of Ni3(HITP)2, Ni3(HITP)2/CNT30 and Ni3(HITP)2/PEI-CNT30 are 2.41 × 10⁻⁸ W Ω K−2, 2.92 × 10⁻⁸ W Ω K−2, and 2.27 × 10⁻⁸ W Ω K−2, which agree well with the Lorenz number used in previous studies for electronic thermal conductivity evaluation of organic thin films.58 No obvious evidence was found for the phonon scattering of CNTs to reduce the total thermal conductivity. The thermal conductivity of the composites has been analyzed with a parallel model which indicates that the low thermal conductivity of the hybrids is mainly derived from the low thermal conductivity of the MOFs rather than the CNT–MOF–CNT junctions.
We compared the power factor and ZT values of p-type Ni3(HITP)2/CNT30 and n-type Ni3(HITP)2/PEI-CNT30 with those of previously reported MOFs as shown in Fig. 5a.10,16,25,44 For example, in 2015, the highest ZT value of MOFs reported was 7 × 10⁻⁵ for Cu3(BTC)2–TCNQ with a low electrical conductivity of 0.07 S cm−1 and a decent Seebeck coefficient of 375 μV K−1 (PF about 1 μW m−1 K−2).8,15 Two years later, the ZT value was enhanced to be ∼1.3 × 10⁻³ for Ni3(HITP)2 at 45 °C (PF about 0.9 μW m−1 K−2) by Dinca et al.10 In this paper, the power factors were found to be 24.8 μW m−1 K−2 and 8.4 μW m−1 K−2 for p-type Ni3(HITP)2/CNT30 and n-type Ni3(HITP)2/PEI-CNT30 at room temperature. According to the measured thermal conductivities shown in Fig. 2f, the ZT values are ∼7.4 times for p-type Ni3(HITP)2/CNT30 and ∼3 times for n-type Ni3(HITP)2/PEI-CNT30 higher than the lately reported ZT record (ZT = 1.2 × 10⁻³)10 at room temperature.
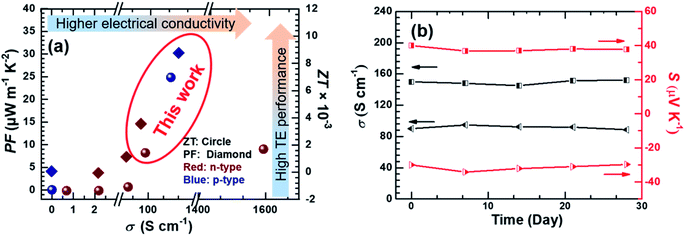 | ||
| Fig. 5 (a) The PF and ZT of n-type Ni3(HITP)2/PEI-CNT30 and p-type Ni3(HITP)2/CNT30 compared with those of previously reported MOF based TE materials;8,10,15,16,20,25 (b) the air stability of Ni3(HITP)2/PEI-CNT30 and Ni3(HITP)2/CNT30 modules exposed to ambient conditions at room temperature. | ||
Both p-type Ni3(HITP)2/CNT30 and n-type Ni3(HITP)2/PEI-CNT30 exhibited good stability in air at room temperature (Fig. 5b). Electrical properties were almost constant for p-type Ni3(HITP)2/CNT30, which maintained 98.3% and 98.5% for electrical conductivity and the Seebeck coefficient after 28 days, respectively while the electrical conductivity and Seebeck coefficient of n-type Ni3(HITP)2/PEI-CNT30 maintained 98.4% and 99%, respectively.
TE modules were fabricated by connecting p-type Ni3(HITP)2/CNT30 and n-type Ni3(HITP)2/PEI-CNT30 in series, as shown in Fig. 6a. A couple of p–n junctions were connected electrically in series and thermally in parallel by sandwiching them between two parallel ceramic plates, the “cold side” and the “hot side” of the TE module. Each of the TE legs was made of the optimized composite pellets (n-type Ni3(HITP)2/PEI-CNT30 and p-type Ni3(HITP)2/CNT30) with widths of 8 mm, lengths of 19 mm, and thicknesses of 1.5 mm, compressed under 20 MPa. In this system, one side of the TE module was heated by applying an electrical current through a hot Peltier plate; simultaneously, the other side was maintained at constant room temperature (nearly 20 °C).
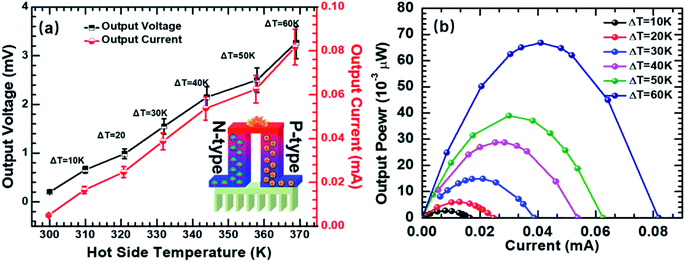 | ||
| Fig. 6 (a) Open-circuit voltage and short-circuit current as a function of different temperature gradients; (b) the output power–current curves of the TE device. | ||
The open-circuit voltages and the short-circuit currents of the TE modules were measured as a function of temperature difference (ΔT: 0–60 K) (Fig. 6a). The tested TE modules produced 0.66 mV, 0.98 mV, 1.55 mV, 2.15 mV, 2.5 mV, and 3.27 mV at ΔT of 10 K, 20 K, 30 K, 40 K, 50 K, and 60 K, respectively, with one p–n couple of the hybrid pellets (p-type Ni3(HITP)2/CNT30 and n-type Ni3(HITP)2/PEI-CNT30). Fig. 6b shows the relationship between the output current and output power of the TE modules at temperature differences of 10 K, 20 K, 30 K, 40 K, 50 K, and 60 K. The maximum output power (Pmax) is obtained when the external resistance matched the internal resistance of modules. The resistance of each n-type and p-type TE leg was measured to be 0.39 Ω and 0.53 Ω, respectively. The total internal resistance (Rint) of the as-fabricated TE device was 40 Ω, which is much higher than that of the theoretical one. The high resistance of the TE device can be attributed to the contact resistance between the TE legs. Pmax was measured to be 0.067 μW for the TE module at ΔT = 60 K when the load resistance is 40 Ω.
Conclusion
MOFs have low thermal conductivity due to their microporous structures, thus making them a promising candidate for high-performance thermoelectrics. However, the low electrical conductivity of MOFs has been the major hurdle in overcoming the low TE performance of MOFs. Herein, we have demonstrated that a new strategy, hybridization of MOFs and CNTs, could significantly improve the TE performance. Both p-type and n-type hybrid TE materials were synthesized by introducing p-type pristine CNTs and n-type PEI-CNTs into Ni3(HITP)2, respectively. It was found that the charge carrier types were determined by CNTs. Hall measurements proved that it is because the CNT has higher carrier concentrations than Ni3(HITP)2. The maximum ZT values for the p-type Ni3(HITP)2/CNT hybrid and n-type Ni3(HITP)2/PEI-CNT hybrid were remarkably increased by up to 2 orders of magnitude in comparison to the ZT of pristine Ni3(HITP)2, which are ∼7.4 and ∼3 times higher than the highest ZT value of MOFs previously reported, respectively.10 Theoretical analysis demonstrated that the charge carriers hop between the CNTs and the energy filtering effect can be negligible. The electrical properties and thermal conductivity of the hybrids match with a parallel model. These results suggest a new approach for pursuing high-performance MOF based TE materials with high electrical conductivity and low thermal conductivity, which may boost the interest of making conducting MOF hybrids for innovative electronic applications, such as organic thermoelectrics, electrical sensors, electrochemical catalysts, etc.46,47 The polarity controlling results may lay a foundation for developing single-material organic devices such as single-material organic cells59 and single-material organic diodes.60Conflicts of interest
There are no conflicts of interest to declare.Acknowledgements
H. W. acknowledges financial support from the National Natural Science Foundation of China (grant number: 51876151), the Key Research and Development Program in Shangxi Province of China (grant number: 2019GY-194), the Fundamental Research Funds for the Central Universities, the World-Class Universities (Disciplines) and the Characteristic Development Guidance Funds for the Central Universities (grant number: PY3A010) and the start-up funding from Xi'an Jiaotong University (grant number: QY1J003). This work is also supported by the HPC platform and the Instrument Analysis Center, Xi'an Jiaotong University. C. Y. acknowledges support from the Creative Materials Discovery Program through the National Research Foundation of Korea (NRF) funded by the Ministry of Science and ICT (2018M3D1A1057844).References
- H. Wang and C. Yu, Joule, 2019, 3, 53–80 CrossRef CAS
.
- X. Wang, H. Wang and B. Liu, Polymers, 2018, 10, 1196 CrossRef
.
- K. Biswas, J. He, Q. Zhang, G. Wang, C. Uher, V. P. Dravid and M. G. Kanatzidis, Nat. Chem., 2011, 3, 160–166 CrossRef CAS
.
- H. Lee, D. Vashaee, D. Z. Wang, M. S. Dresselhaus, Z. F. Ren and G. Chen, J. Appl. Phys., 2010, 107, 094308 CrossRef
.
- X. Wang, P. Liu, Q. Jiang, W. Zhou, J. Xu, J. Liu, Y. Jia, X. Duan, Y. Liu, Y. Du and F. Jiang, ACS Appl. Mater. Interfaces, 2019, 11, 2408–2417 CrossRef CAS
.
- A. S. Tazebay, S.-I. Yi, J. K. Lee, H. Kim, J.-H. Bahk, S. L. Kim, S.-D. Park, H. S. Lee, A. Shakouri and C. Yu, ACS Appl. Mater. Interfaces, 2016, 8, 7003–7012 CrossRef CAS
.
- B. L. Huang, A. J. H. McGaughey and M. Kaviany, Int. J. Heat Mass Transfer, 2007, 50, 393–404 CrossRef CAS
.
- K. J. Erickson, F. Léonard, V. Stavila, M. E. Foster, C. D. Spataru, R. E. Jones, B. M. Foley, P. E. Hopkins, M. D. Allendorf and A. A. Talin, Adv. Mater., 2015, 27, 3453–3459 CrossRef CAS
.
- D. Liu, J. J. Purewal, J. Yang, A. Sudik, S. Maurer, U. Mueller, J. Ni and D. J. Siegel, Int. J. Hydrogen Energy, 2012, 37, 6109–6117 CrossRef CAS
.
- L. Sun, B. Liao, D. Sheberla, D. Kraemer, J. Zhou, E. A. Stach, D. Zakharov, V. Stavila, A. A. Talin, Y. Ge, M. D. Allendorf, G. Chen, F. Léonard and M. Dincă, Joule, 2017, 1, 168–177 CrossRef CAS
.
- F. Jeremias, D. Fröhlich, C. Janiak and S. K. Henninger, RSC Adv., 2014, 4, 24073–24082 RSC
.
- H. Babaei, M. E. DeCoster, M. Jeong, Z. M. Hassan, T. Islamoglu, H. Baumgart, A. J. H. McGaughey, E. Redel, O. K. Farha, P. E. Hopkins, J. A. Malen and C. E. Wilmer, Nat. Commun., 2020, 11, 4010 CrossRef CAS
.
- I. Stassen, N. Burtch, A. Talin, P. Falcaro, M. Allendorf and R. Ameloot, Chem. Soc. Rev., 2017, 46, 3185–3241 RSC
.
- P. D. C. Dietzel, Y. Morita, R. Blom and H. Fjellvåg, Angew. Chem., 2005, 117, 6512–6516 CrossRef
.
- A. A. Talin, A. Centrone, A. C. Ford, M. E. Foster, V. Stavila, P. Haney, R. A. Kinney, V. Szalai, F. El Gabaly, H. P. Yoon, F. Léonard and M. D. Allendorf, Science, 2014, 343, 66–69 CrossRef CAS
.
- X. Huang, P. Sheng, Z. Tu, F. Zhang, J. Wang, H. Geng, Y. Zou, C.-a. Di, Y. Yi, Y. Sun, W. Xu and D. Zhu, Nat. Commun., 2015, 6, 7408 CrossRef CAS
.
- T. Kambe, R. Sakamoto, K. Hoshiko, K. Takada, M. Miyachi, J.-H. Ryu, S. Sasaki, J. Kim, K. Nakazato, M. Takata and H. Nishihara, J. Am. Chem. Soc., 2013, 135, 2462–2465 CrossRef CAS
.
- T. Kambe, R. Sakamoto, T. Kusamoto, T. Pal, N. Fukui, K. Hoshiko, T. Shimojima, Z. Wang, T. Hirahara, K. Ishizaka, S. Hasegawa, F. Liu and H. Nishihara, J. Am. Chem. Soc., 2014, 136, 14357–14360 CrossRef CAS
.
- G. Wu, J. Huang, Y. Zang, J. He and G. Xu, J. Am. Chem. Soc., 2017, 139, 1360–1363 CrossRef CAS
.
- D. Sheberla, L. Sun, M. A. Blood-Forsythe, S. Er, C. R. Wade, C. K. Brozek, A. Aspuru-Guzik and M. Dincă, J. Am. Chem. Soc., 2014, 136, 8859–8862 CrossRef CAS
.
- B. Bhattacharya, A. Layek, M. Mehboob Alam, D. K. Maity, S. Chakrabarti, P. P. Ray and D. Ghoshal, Chem. Commun., 2014, 50, 7858–7861 RSC
.
- Z. Yang, F. E. Oropeza and K. H. L. Zhang, APL Mater., 2020, 8, 060901 CrossRef CAS
.
- A. J. Clough, J. M. Skelton, C. A. Downes, A. A. de la Rosa, J. W. Yoo, A. Walsh, B. C. Melot and S. C. Marinescu, J. Am. Chem. Soc., 2017, 139, 10863–10867 CrossRef CAS
.
- L. Sun, M. G. Campbell and M. Dincă, Angew. Chem., Int. Ed., 2016, 55, 3566–3579 CrossRef CAS
.
- Y. Nonoguchi, D. Sato and T. Kawai, Polymers, 2018, 10, 962 CrossRef
.
- H. Wang, J.-H. Hsu, S.-I. Yi, S. L. Kim, K. Choi, G. Yang and C. Yu, Adv. Mater., 2015, 27, 6855–6861 CrossRef CAS
.
- H. Wang, S.-i. Yi and C. Yu, Polymer, 2016, 97, 487–495 CrossRef CAS
.
- H. Wang, S.-i. Yi, X. Pu and C. Yu, ACS Appl. Mater. Interfaces, 2015, 7, 9589–9597 CrossRef CAS
.
- X. Wang, H. Wang and B. Liu, Polymers, 2018, 10, 1196 CrossRef
.
- Z. Y. Xu, R. Z. Wang and C. Yang, Energy, 2019, 176, 1037–1043 CrossRef
.
- S. Hata, T. Mihara, M. Shiraishi, Y. Yamaguchi, Y. Du, Y. Shiraishi and N. Toshima, Jpn. J. Appl. Phys., 2020, 59, SDDD05 CrossRef CAS
.
- Q. Hu, Z. Lu, Y. Wang, J. Wang, H. Wang, Z. Wu, G. Lu, H.-L. Zhang and C. Yu, J. Mater. Chem. A, 2020, 8, 13095–13105 RSC
.
- M. He, J. Ge, Z. Lin, X. Feng, X. Wang, H. Lu, Y. Yang and F. Qiu, Energy Environ. Sci., 2012, 5, 8351–8358 RSC
.
- J.-H. Hsu and C. Yu, Nano Energy, 2020, 67, 104282 CrossRef CAS
.
- N. E. Coates, S. K. Yee, B. McCulloch, K. C. See, A. Majumdar, R. A. Segalman and J. J. Urban, Adv. Mater., 2013, 25, 1629–1633 CrossRef CAS
.
- S. K. Yee, J. A. Malen, A. Majumdar and R. A. Segalman, Nano Lett., 2011, 11, 4089–4094 CrossRef CAS
.
- H. Park, Y. Eom, D. Lee, J. Kim, H. Kim, G. Park and W. Kim, Energy, 2019, 187, 115935 CrossRef
.
- S. L. Kim, K. Choi, A. Tazebay and C. Yu, ACS Nano, 2014, 8, 2377–2386 CrossRef CAS
.
- C. Yu, A. Murali, K. Choi and Y. Ryu, Energy Environ. Sci., 2012, 5, 9481–9486 RSC
.
- D. D. Freeman, K. Choi and C. Yu, PLoS One, 2012, 7, e47822 CrossRef CAS
.
- G. U. Sumanasekera, C. K. W. Adu, S. Fang and P. C. Eklund, Phys. Rev. Lett., 2000, 85, 1096–1099 CrossRef CAS
.
- Q. Jin, S. Jiang, Y. Zhao, D. Wang, J. Qiu, D.-M. Tang, J. Tan, D.-M. Sun, P.-X. Hou, X.-Q. Chen, K. Tai, N. Gao, C. Liu, H.-M. Cheng and X. Jiang, Nat. Mater., 2019, 18, 62–68 CrossRef CAS
.
- N. Toshima, K. Oshima, H. Anno, T. Nishinaka, S. Ichikawa, A. Iwata and Y. Shiraishi, Adv. Mater., 2015, 27, 2246–2251 CrossRef CAS
.
- K. J. Erickson, F. Leonard, V. Stavila, M. E. Foster, C. D. Spataru, R. E. Jones, B. M. Foley, P. E. Hopkins, M. D. Allendorf and A. A. Talin, Adv. Mater., 2015, 27, 3453–3459 CrossRef CAS
.
- D. Sheberla, L. Sun, M. A. Blood-Forsythe, S. Er, C. R. Wade, C. K. Brozek, A. Aspuru-Guzik and M. Dinca, J. Am. Chem. Soc., 2014, 136, 8859–8862 CrossRef CAS
.
- R. Liu, Y. Liu, S. Yu, C. Yang, Z. Li and G. Li, ACS Appl. Mater. Interfaces, 2019, 11, 1713–1722 CrossRef CAS
.
- G. S. Mohammad-Pour, K. O. Hatfield, D. C. Fairchild, K. Hernandez-Burgos, J. Rodríguez-López and F. J. Uribe-Romo, J. Am. Chem. Soc., 2019, 141, 19978–19982 CrossRef CAS
.
- J.-H. Hsu, W. Choi, G. Yang and C. Yu, Org. Electron., 2017, 45, 182–189 CrossRef CAS
.
- K. Choi, S. L. Kim, S.-i. Yi, J.-H. Hsu and C. Yu, ACS Appl. Mater. Interfaces, 2018, 10, 23891–23899 CrossRef CAS
.
- C. Yu, K. Choi, L. Yin and J. C. Grunlan, ACS Nano, 2011, 5, 7885–7892 CrossRef CAS
.
- C. Yu, S. Saha, J. Zhou, L. Shi, A. M. Cassell, B. A. Cruden, Q. Ngo and J. Li, J. Heat Transfer, 2005, 128, 234–239 CrossRef
.
- A. N. Volkov and L. V. Zhigilei, Phys. Rev. Lett., 2010, 104, 215902 CrossRef
.
- W.-J. Kim, N. Nair, C. Y. Lee and M. S. Strano, J. Phys. Chem. C, 2008, 112, 7326–7331 CrossRef CAS
.
- R. S. Prasher, X. J. Hu, Y. Chalopin, N. Mingo, K. Lofgreen, S. Volz, F. Cleri and P. Keblinski, Phys. Rev. Lett., 2009, 102, 105901 CrossRef
.
- Y. Gelbstein, J. Appl. Phys., 2009, 105, 023713 CrossRef
.
- Z. Liang, M. J. Boland, K. Butrouna, D. R. Strachan and K. R. Graham, J. Mater. Chem. A, 2017, 5, 15891–15900 RSC
.
- H. S. Kim, W. Liu, G. Chen, C. W. Chu and Z. Ren, Proc. Natl. Acad. Sci. U. S. A., 2015, 112, 8205–8210 CrossRef CAS
.
- J. Liu, X. Wang, D. Li, N. E. Coates, R. A. Segalman and D. G. Cahill, Macromolecules, 2015, 48, 585–591 CrossRef CAS
.
- J. Roncali, Adv. Energy Mater., 2011, 1, 147–160 CrossRef CAS
.
- H. Wang, J.-H. Hsu, G. Yang and C. Yu, Adv. Mater., 2016, 28, 9545–9549 CrossRef CAS
.
Footnote |
| † Electronic supplementary information (ESI) available. See DOI: 10.1039/d0ta10051j |
| This journal is © The Royal Society of Chemistry 2021 |

