Mo2B2 MBene-supported single-atom catalysts as bifunctional HER/OER and OER/ORR electrocatalysts†
Received
2nd September 2020
, Accepted 1st December 2020
First published on 8th December 2020
Abstract
Searching for highly efficient and cost-effective bifunctional electrocatalysts for the oxygen evolution reaction (OER), oxygen reduction reaction (ORR) and hydrogen evolution reaction (HER), which can be applied to water splitting, fuel cells and metal–air batteries, is critical for developing clean and renewable energies. Yet it remains a great challenge. By means of first-principles calculations, we have studied the OER, ORR and HER catalytic activity of Mo2B2 MBene-supported single-atom catalysts (SACs) by embedding a series of transition metal atoms in the Mo vacancy (TM@Mo2B2, TM = Ti, V, Cr, Mn, Fe, Co, Ni and Cu) as electrocatalysts. All TM@Mo2B2 SACs show excellent metallic conductivity, which would be favorable for the charge transfer in electrocatalytic reactions. Importantly, Ni@Mo2B2 can be used as a HER/OER bifunctional electrocatalyst with a lower |ΔGH| (−0.09 eV) for the HER under 1/4H coverage and a lower overpotential (ηOER = 0.52 V) than that of IrO2 (ηOER = 0.56 V) for the OER, while Cu@Mo2B2 can be used as an OER/ORR bifunctional electrocatalyst with a lower overpotential (ηOER = 0.31 V) than that of IrO2 (ηOER = 0.56 V) and RuO2 (ηOER = 0.42 V) for the OER and a lower overpotential of 0.34 V than that of Pt (ηORR = 0.45 V) for the ORR, for both of which the transition metal atoms serve as the active sites. This work could open up an avenue for the development of non-noble-metal-based bifunctional MBene electrocatalysts.
1. Introduction
Clean and renewable energy technologies, such as water splitting, fuel cells and metal–air batteries, are crucial to mitigate environmental pollution and the energy crisis.1–10 The bases of these technologies are the oxygen evolution reaction (OER), oxygen reduction reaction (ORR) and hydrogen evolution reaction (HER), the efficiency of which mainly depends on the performance of the catalysts. Currently, the most effective catalysts are Pt (for the ORR and HER) and IrO2/RuO2 (for the OER).11–14 However, the scarcity and high price prevent their large-scale usage. Although great effort has been made in the research on OER, ORR and HER catalysts, such as nanostructured metal carbides,15–17 graphene doped with heteroatoms,18,19 carbon-based hybrids,20–22 and transition metal chalcogenides,23,24 searching for non-noble metal catalysts with high catalytic performance comparable to that of the above-mentioned Pt and IrO2/RuO2 is still a great challenge. In addition, compared with two separate unifunctional catalysts, for which the optimal working conditions are not always the same, bifunctional catalysts operating under optimal and identical conditions have many obvious advantages,25 such as reducing costs and simplifying the systems.5 According to previous work,3,26,27 HER/OER bifunctional catalysts and OER/ORR bifunctional catalysts have attracted widespread attention because HER/OER bifunctional catalysts can be used for water splitting and OER/ORR bifunctional catalysts be used in fuel cells and metal–air batteries.
On account of the special physical and chemical properties and the large specific area, two-dimensional (2D) materials have been highly attractive in the past few years.28,29 Recently, 2D transition metal borides, known as MBenes, have been extensively studied.30–35 MBenes can be obtained by selectively removing the A atomic layer in MAB phases experimentally, where A represents aluminum in most cases, M represents a transition metal and B represents boron. So far, some MBenes including Mo2B2,33 Cr2B2 (ref. 31) and Ti2B2 (ref. 35) have been experimentally produced. Importantly, according to previous work,30,32,35 all the reported MBenes show good metallic conductivity to ensure electron transfer efficiency as electrodes and electrocatalysts. In addition, with the exploration and development of materials synthesis methods, the rational design of catalysts with high efficiency has become more intriguing. Among various catalyst designs, single-atom catalysts (SACs) have attracted significant attention, due to the unique electronic structure originating from the strong interaction and large charge transfer between the single metal atoms and the coordination species of the supports.36–38 Moreover, SACs have fully exposed and dispersed active sites.39–42 The unique electronic-structural properties and the exposure of the active sites make SACs exhibit remarkable enhancements in the catalytic performance in a variety of reactions.36 Inspired by the good metallic conductivity and the large specific area of MBenes and the advantages of SACs, it is of significance to investigate MBene-supported SACs.
In this work, we rationally embedded transition metal atoms in the Mo vacancies of Mo2B2 MBenes (TM@Mo2B2) to construct SACs to study their OER, ORR and HER performance at different surface active sites by first-principles calculations, where the transition metals refer to Ti, V, Cr, Mn, Fe, Co, Ni and Cu. With good structural stability and metallic conductivity, Ni@Mo2B2 and Cu@Mo2B2 can be used as bifunctional HER/OER and OER/ORR catalysts, respectively.
2. Computational methods
In this work, all the first-principles calculations were performed using spin-polarized density-functional theory (DFT) as implemented in the Vienna ab-initio simulation package (VASP) code.43 The generalized gradient approximation (GGA) in the form of the Perdew–Burke–Ernzerhof (PBE) functional44 was applied to describe the electron exchange–correlation interactions. To describe the long-range van der Waals interactions, the DFT+D2 method was used in this work.45 The DFT+U correction was considered during the electronic structure calculations for the systems. The cut-off energy was set to 500 eV and 4 × 4 supercells were used. The structural optimizations and electronic properties were all studied with the energy converged to 1.0 × 10⁻⁴ eV per atom and the force converged to 0.01 eV Å−1. In addition, the Brillouin zones were sampled with a 4 × 4 × 1 k-point grid for structural optimizations, a 7 × 7 × 1 k-point grid for static self-consistent calculations and a denser 11 × 11 × 1 k-point grid for the density of states (DOS) calculations. To evaluate the stability of the catalysts, ab initio molecular dynamics (AIMD) simulations were performed. The AIMD simulations lasted for 10 ps with a time step of 2.0 fs at 300 K. The climbing-image nudged elastic band (NEB) method was used to investigate the diffusion pathway and energy barrier of intermediates for the OER and ORR, respectively.
The formation energy of Mo vacancies in Mo2B2 is calculated using the following equation:
| | | Ef(VMo) = EMo2B2–VMo − EMo2B2 + nμMo | (1) |
where
EMo2B2–VMoand
EMo2B2 represent the total energy of the Mo
2B
2 monolayer with and without Mo vacancies, respectively,
μMo is the chemical potential of a Mo atom, and
n stands for the number of Mo vacancies, which is 1 here to study the formation energy of a monovacancy.
The binding energy (Eb) of transition metal atoms (TM = Ti, V, Cr, Mn, Fe, Co, Ni and Cu) embedded in the Mo monovacancy of Mo2B2 was calculated according to the equation:
where
ETM+S and
ES represent the total energy of the defective Mo
2B
2 with and without the embedded transition metal atoms, respectively, and
ETM represents the total energy of the transition metal atom from its most stable bulk phase.
The pathways of the OER, ORR and HER have been summarized in detail. In an acid electrolyte, the OER can be decomposed into the following elementary steps:
| | | H2O(l) + * → OH* + H+ + e− | (3) |
| | | O* + H2O(l) → OOH* + H+ + e− | (5) |
| | | pOOH* → * + O2(g) +H+ + e− | (6) |
where * represents the active site on the surfaces of the catalysts and l and g represent the liquid phase and the gas phase, respectively.
The ORR process can be regarded as the inverse of the OER process, which proceeds via the four-electron-transfer pathway as shown below:
| | | * + O2(g) + H+ + e− → OOH* | (7) |
| | | OOH* + H+ + e− → O* + H2O(l) | (8) |
| | | OH* + H+ + e− → H2O(l) + * | (10) |
For each elementary step of the OER and ORR, the free energies have been calculated according to the method proposed by Norskov et al.12 The free energy change from the initial state to the final state of the reaction is defined as:
| | | ΔG = ΔE + ΔEZPE − TΔS + ΔGU + ΔGpH | (11) |
where Δ
E, Δ
EZPE and Δ
S are the differences in the total energy obtained from DFT calculations, zero-point energy and entropy between the reactants and the products, respectively.
T represents temperature (298.15 K). Δ
GU = −
neU, where
U is the applied electrode potential,
e is the charge transferred and
n is the number of proton–electron transferred pairs. In addition, Δ
GpH = −
kBTln[H
+] = pH ×
kBTln
![[thin space (1/6-em)]](https://www.rsc.org/images/entities/char_2009.gif)
10, where
kB is the Boltzmann constant.
The free energy change for the four elementary OER steps can be obtained as: ΔG1 = ΔGOH*, ΔG2 = ΔGO* − ΔGOH*, ΔG3 = ΔGOOH* − ΔGO* and ΔG4 = 4.92 − ΔGOOH*. For the ORR steps: ΔGa = −ΔG4, ΔGb = −ΔG3, ΔGc = −ΔG2 and ΔGd = −ΔG1. Therefore, the overpotential that evaluates the performance of the OER and ORR is applied according to the following equations:
| | | ηOER =max{ΔG1, ΔG2,ΔG3, ΔG4}/e − 1.23 | (12) |
| | | ηORR = max{ΔGa, ΔGb, ΔGc, ΔGd}/e + 1.23 | (13) |
where 1.23 represents the equilibrium potential.
11
Under acidic conditions, the overall reaction scheme of the HER can be written as:
The HER catalytic activity is described using the computed Gibbs free energy change of (14), which was obtained by using the equation:
| | | ΔGH = ΔEH + ΔEZPE − TΔS | (16) |
where Δ
EH is the adsorption energy of hydrogen and Δ
EZPE and Δ
S are the differences in the zero-point energy and entropy between the adsorbed hydrogen and the gas phase hydrogen.
3. Results and discussion
3.1 Stability and active sites
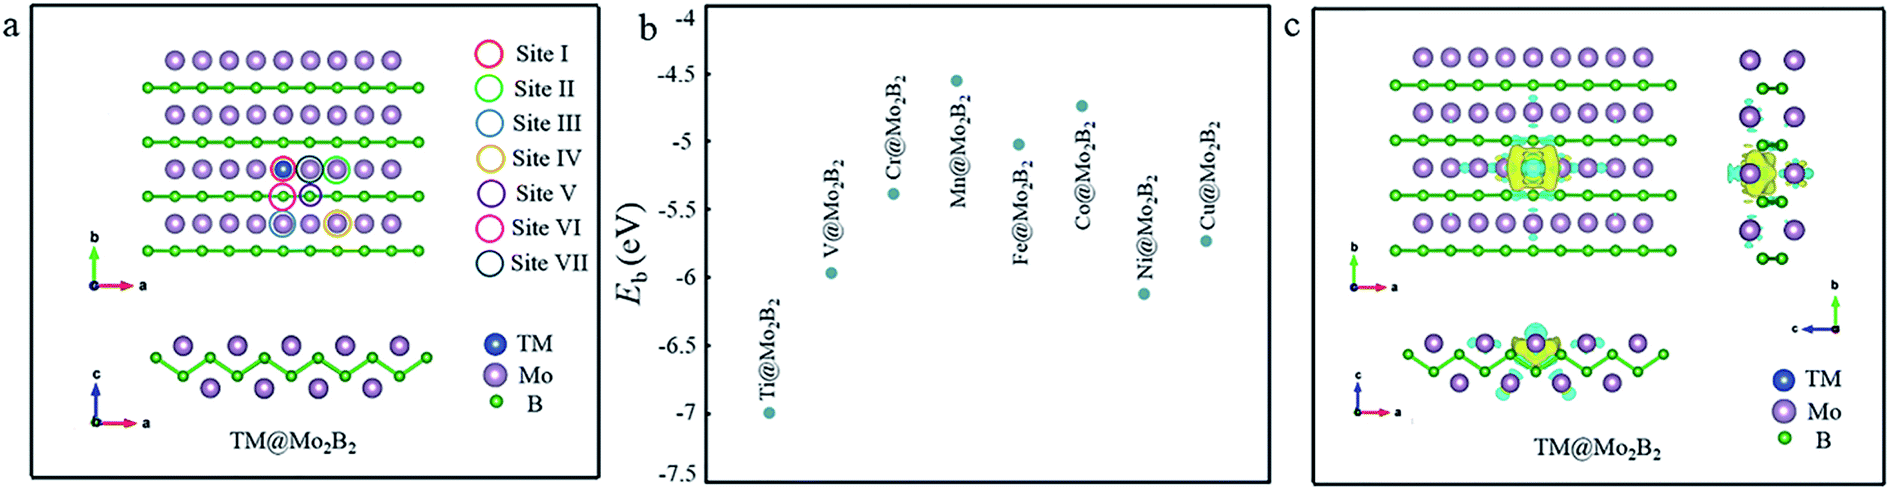
First of all, the structural stability of TM@Mo2B2 was studied. The atomic structure of TM@Mo2B2 is shown in Fig. 1a. We calculated the vacancy formation energy of the Mo monovacancy of Mo2B2, Ef(VMo), which is 0.98 eV. Generally, the smaller the value of the vacancy formation energy, the more possible the formation of the vacancy. Comparing the vacancy formation energy of MoS2 (5.85 eV for the S monovacancy)46 and graphene (7.69 eV for the C monovacancy),47 it is evident that Mo2B2 MBene shows greater possibility to form the Mo monovacancy with a relatively low vacancy formation energy. Besides, the vacancy formation energy of Mo2B2 MBene is comparable to that of M2C-type MXenes ranging from 0.96 to 2.85 eV, which make it easy to form vacancies.48 Then, the binding energy (Eb) of the transition metal atoms in TM@Mo2B2 was calculated, and the results are depicted in Fig. 1b and Table S1.† As is well-known, the negative Eb indicates the high stability of the recombinant systems. The binding energy of Ti@Mo2B2, V@Mo2B2, Cr@Mo2B2, Mn@Mo2B2, Fe@Mo2B2, Co@Mo2B2, Ni@Mo2B2 and Cu@Mo2B2 is −6.99, −5.97, −5.38, −4.55, −5.02, −4.74, −6.12 and −5.73 eV, respectively, implying that all the studied materials possess excellent structural stability. In addition, as shown in Fig. 1c, the charge accumulation between TM and B atoms indicates the formation of TM-B bonds, which is consistent with the above-mentioned negative binding energy. In addition, we performed AIMD simulations and the result is shown in Fig. S1,† indicating that Ni@Mo2B2 and Cu@Mo2B2 are both thermally stable.
 |
| | Fig. 1 (a) The structure and seven possible active sites of TM@Mo2B2. (b) The binding energy diagram of different TM@Mo2B2 (TM = Ti, V, Cr, Mn, Fe, Co, Ni and Cu). (c) The charge density difference of TM@Mo2B2, where yellow and blue regions indicate the charge density accumulation and depletion, respectively. | |
Next, the active sites for the OER, ORR, and HER need to be studied. In Mo2B2 MBenes, embedding the transition metal atoms in the Mo vacancies causes changes in the chemical environment around the embedded transition metal atoms. As shown in Fig. 1a, seven possible active sites of TM@Mo2B2 are marked. According to previous work,28,30 the HER always occurs on the metal atoms instead of boron atoms of MBenes. Hence, the Mo atoms (including the Mo atoms on the surface and Mo atom on the bridge sites) and TM atoms are selected to be the possible active sites for the HER, including sites I, II, III, IV and VII. For the OER and ORR, apart from the above active sites, the B atoms on the bridge sites are also included. Therefore, we studied the OER, ORR and HER catalytic activity of TM@Mo2B2 at the embedded transition metal site (site I), Mo atoms on the surface around the TM (site II, III and IV), B atoms on the bridge sites (site V and VI) and Mo atom on the bridge sites (site VII).
3.2 Electronic properties
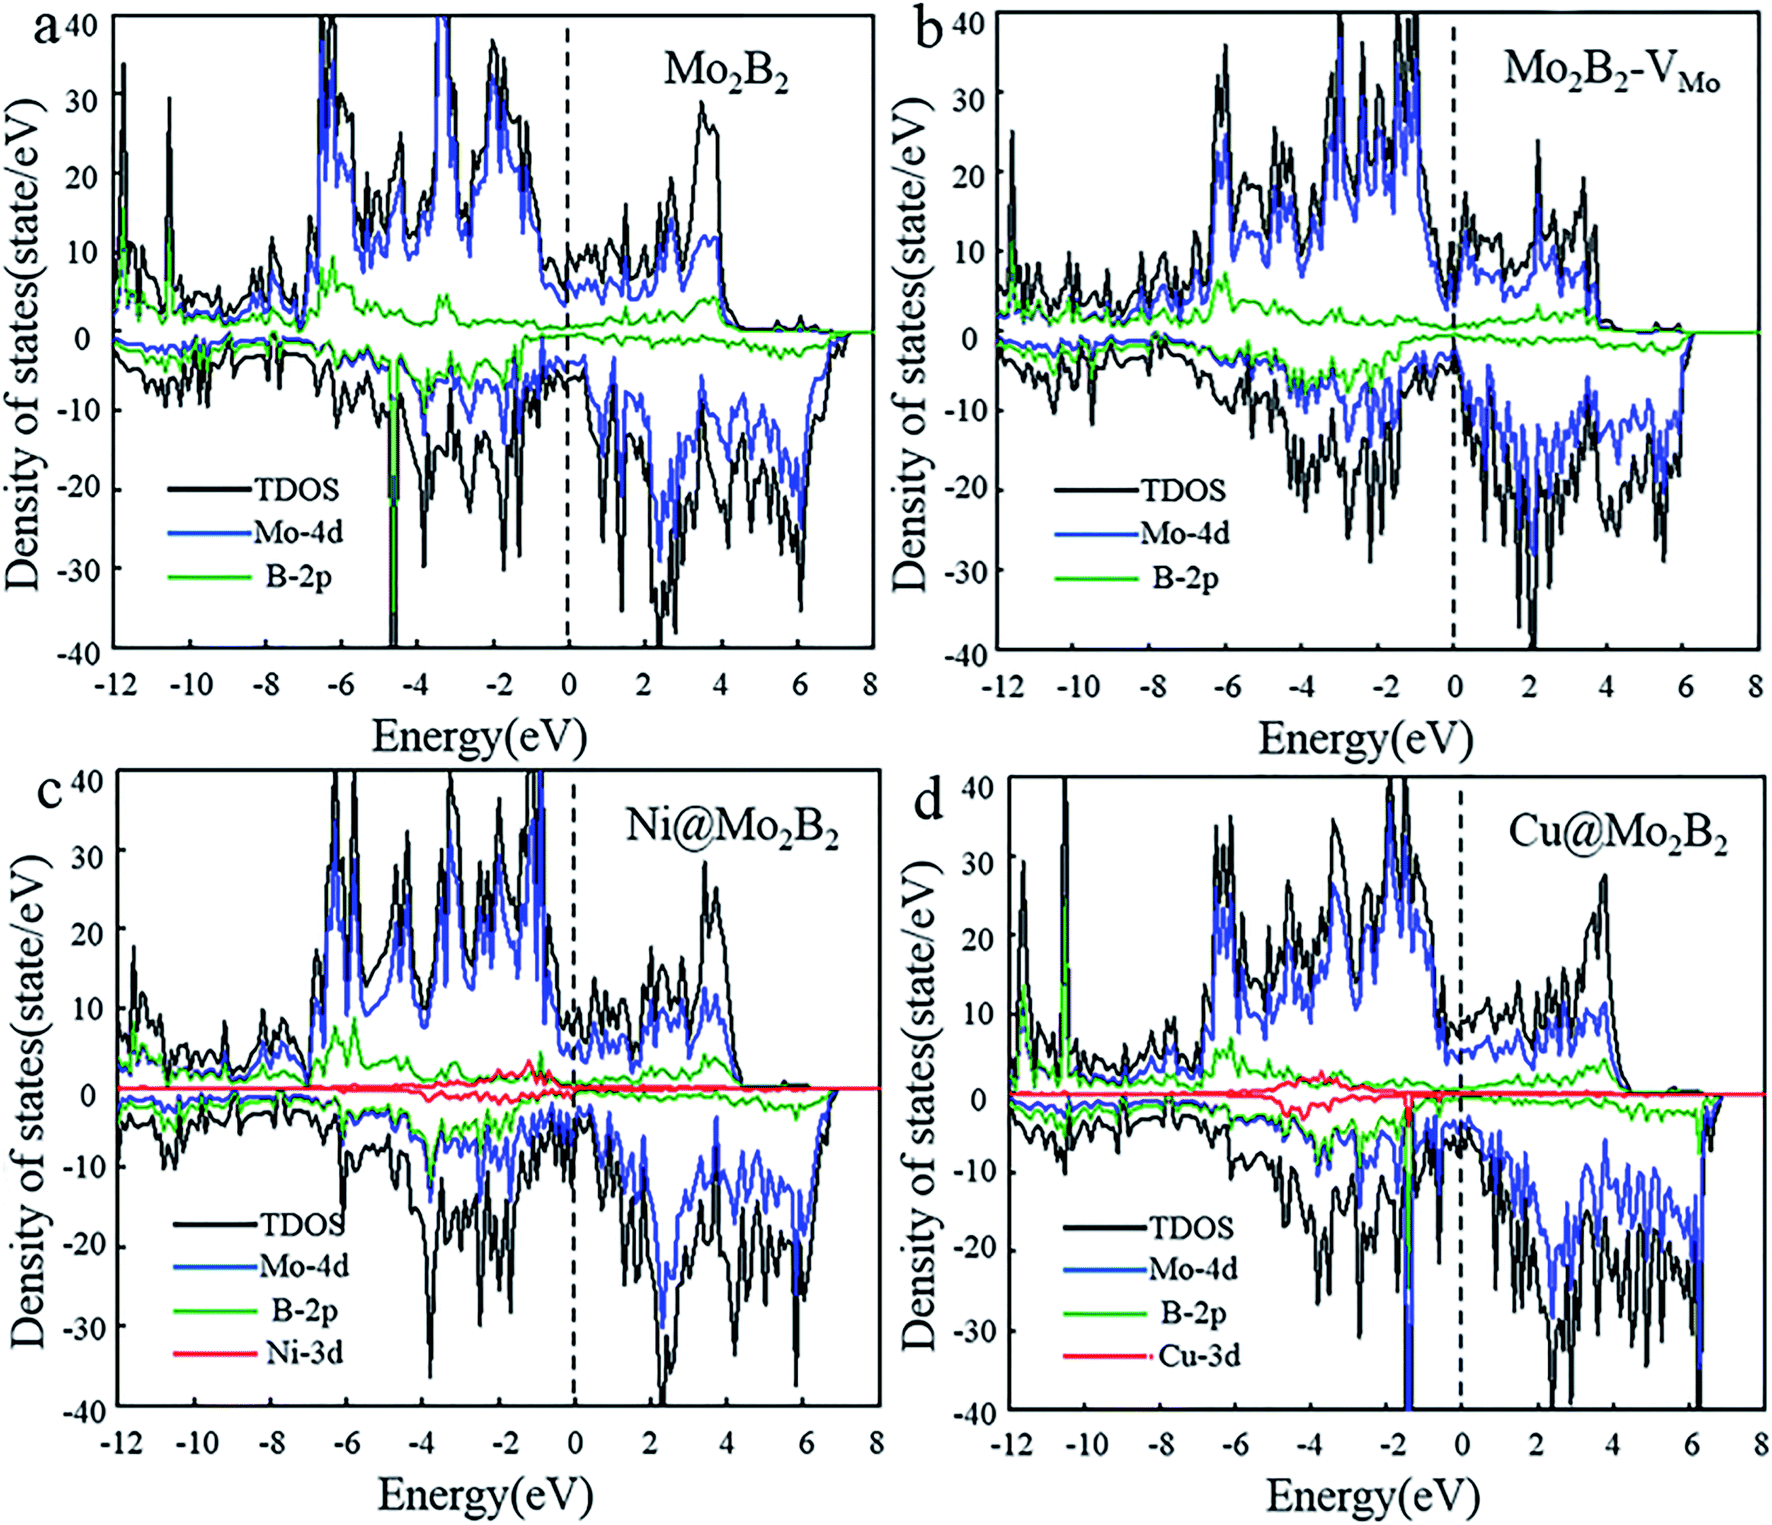
Electrical conductivity is vital for electrocatalysts to guarantee electron transfer efficiency during the electrocatalytic reactions. On account of this, the electronic properties of the pristine Mo2B2, Mo2B2 with Mo monovacancies (Mo2B2–VMo) and TM@Mo2B2 were investigated. Fig. 2 shows the total density of states (TDOS) and projected density of states (PDOS), of Mo2B2, Mo2B2–VMo, Ni@Mo2B2 and Cu@Mo2B2 (the other TM@Mo2B2 are depicted in Fig. S2†). Obviously, the pristine Mo2B2 exhibits metallic conductivity with the Fermi energy falling into a continuum of energy states, which is consistent with previous work.30 Meanwhile, Mo2B2–VMo, Ni@Mo2B2, Cu@Mo2B2 and all the TM@Mo2B2 are metallic. According to the projected density of states (PDOS), the metallic conductivity of the studied materials is mainly contributed by the Mo-4d orbitals near their Fermi levels.
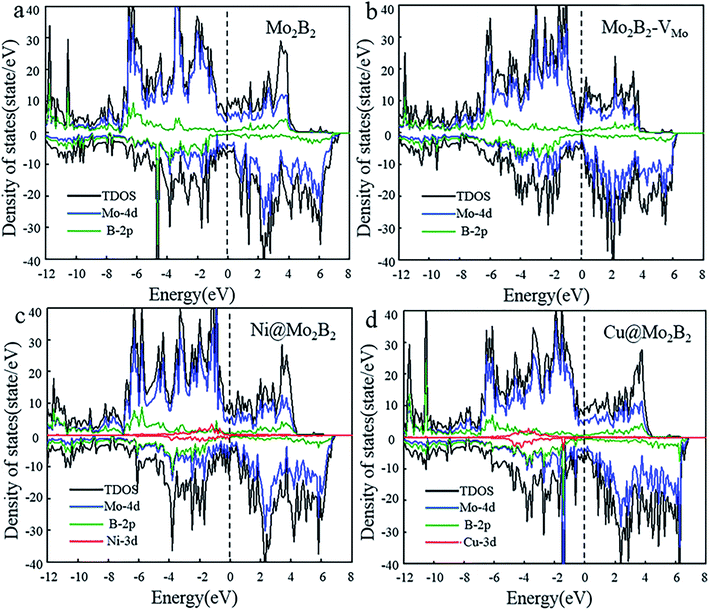 |
| | Fig. 2 The total density of states (TDOS) and the projected density of states (PDOS) of (a) pristine Mo2B2, (b) Mo2B2–VMo, (c) Ni@Mo2B2 and (d) Cu@Mo2B2, where the Fermi level is set to 0 eV. | |
3.3 OER and ORR catalytic activity
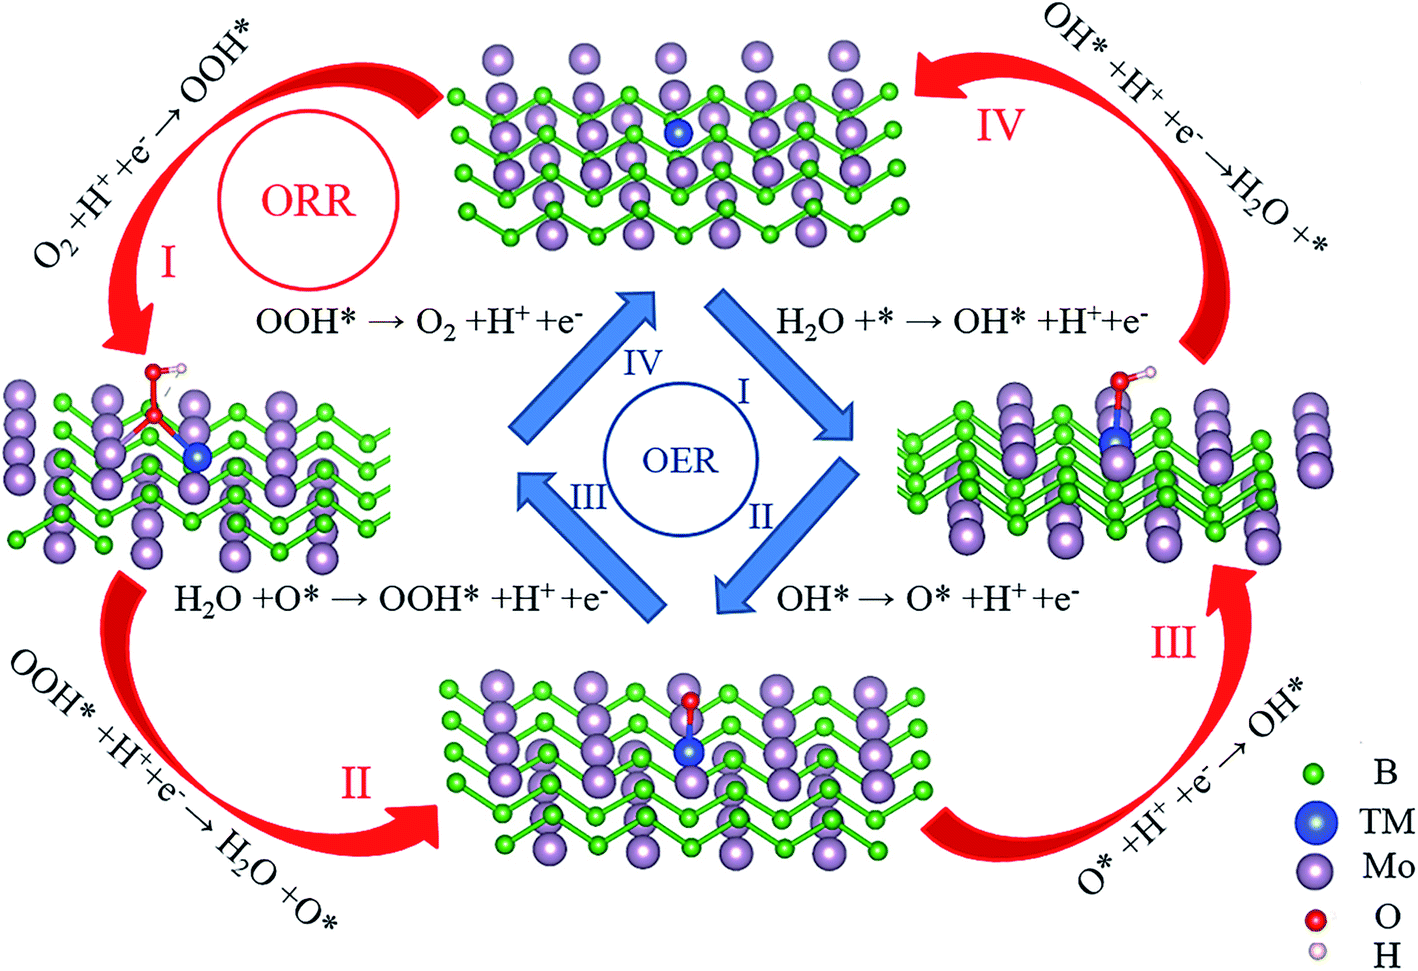
After verifying the stability and electrical conductivity of TM@Mo2B2, we studied the catalytic activity of TM@Mo2B2 for the OER and ORR. As depicted in Fig. 3, there are four elementary steps of the OER, which is also the inverse process of the ORR. Firstly, we studied which of the four sites mentioned above is the active site for the OER and ORR. As listed in Tables S2–S15†, for Ti@Mo2B2, V@Mo2B2, Fe@Mo2B2, Co@Mo2B2, Ni@Mo2B2 and Cu@Mo2B2 in the OER, site I is the optimal active site with a lower overpotential than that of the other six sites, while for Cr@Mo2B2 and Mn@Mo2B2 in the OER, site III is the optimal active site with a lower overpotential than that of the other six sites. In addition, for Co@Mo2B2, Ni@Mo2B2 and Cu@Mo2B2 in the ORR, site I is the optimal active site with a lower overpotential than that of the other six sites, while for Ti@Mo2B2, V@Mo2B2 and Cr@Mo2B2 in the ORR, site IV is the optimal active site with a lower overpotential than that of the other six sites, and for Mn@Mo2B2 and Fe@Mo2B2 in the ORR, site VI is the optimal active site with a lower overpotential than that of the other six sites.
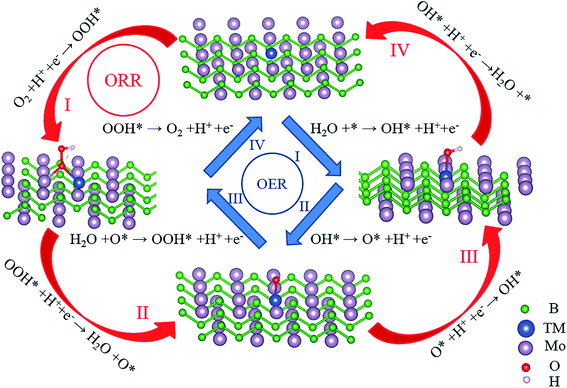 |
| | Fig. 3 Elementary reaction steps of the OER and ORR process for TM@Mo2B2 at site I. | |
For the OER, we calculated the Gibbs free energy change for each elementary reaction to draft the Gibbs free energy diagrams, as shown in Fig. 4 and Fig. S3.† From the free energy diagrams, we can see that for Ti@Mo2B2, V@Mo2B2, Cr@Mo2B2, Mn@Mo2B2, Fe@Mo2B2, Co@Mo2B2 and Ni@Mo2B2, the third step of O* reacting with H2O to form OOH* is the most energy-consuming step of the entire OER with ΔG3 values of 3.86, 3.80, 3.32, 2.84, 2.26, 2.13 and 1.75 eV, respectively. In the OER process with Cu@Mo2B2 as the catalyst, the step of OH* dissociating to H+ and O* (the second step), is the most energy-consuming step and ΔG2 is 1.54 eV. In addition, we calculated the overpotential for TM@Mo2B2 which is the most important indicator to determine the OER performance. Ni@Mo2B2 (ηOER = 0.52 V) has better catalytic performance for the OER with a lower overpotential than that of IrO2 (ηOER = 0.56 V).49 It is worth noting that the overpotential for Cu@Mo2B2 (ηOER = 0.31 V) is the lowest in this work, even lower than that of the state-of-the-art IrO2 (ηOER = 0.56 V) and RuO2 (ηOER = 0.42 V),49 indicating that the OER catalytic activity of Cu@Mo2B2 is better than that of IrO2 and RuO2. Furthermore, it is notable that for the pristine Mo2B2, ηOER was calculated to be 2.67 V, as listed in Table S16.† Based on the above results, we can conclude that the OER catalytic activity of Mo2B2 MBene is significantly improved after embedding with the above transition metal atoms.
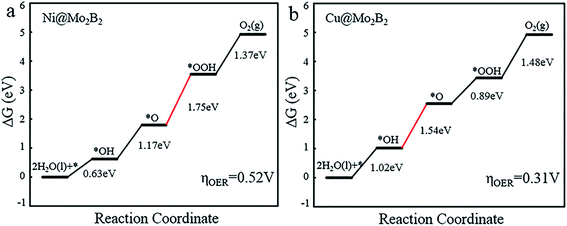 |
| | Fig. 4 The Gibbs free energy diagrams for the OER pathway of (a) Ni@Mo2B2 and (b) Cu@Mo2B2 at site I, where the red lines represent the most energy-consuming step of the OER. | |
Next, we further evaluated the reaction mechanism for the ORR. Generally, there are two possible reaction mechanisms for the ORR in acidic media, i.e., the associative and dissociative mechanism, the difference of which depends on whether the adsorbed O2 molecule on the catalytic site can be dissociated into two separate O atoms. If so, it is the dissociative pathway, otherwise it is the associative pathway. Before calculating the dissociation barrier, we studied the most stable O2 adsorption configuration. It is found that the O2 adsorption energy for the end-on configuration is 7.93 eV lower than that for the side-on configuration, indicating that O2 prefers to adsorb on Cu@Mo2B2 with the end-on configuration. As shown in Fig. S7,† by calculating the dissociation barrier of the adsorbed O2 molecule at site I of Cu@Mo2B2 to form two separate O*, we can find that the dissociation process for Cu@Mo2B2 would overcome a large energy barrier of 7.94 eV, which is higher than the associative barrier (0.07 eV, Fig. S6 (a)†). Therefore, in this work, we research the associative pathway for the ORR, rather than the dissociative pathway.
The Gibbs free energy diagrams of the ORR process are presented in Fig. 5 and Fig. S4.† It is obvious that for Ti@Mo2B2, V@Mo2B2, Cr@Mo2B2, Mn@Mo2B2, Fe@Mo2B2, Co@Mo2B2 and Ni@Mo2B2 at site I, the fourth step of OH* reacting with H+ to form H2O is the most energy-consuming step of the entire ORR with ΔGd values of 1.32, 0.98, 1.29, −0.44, 0.45, −0.16 and −0.63 eV, respectively, while for Cu@Mo2B2, the most energy-consuming step is the second step, that is, the step of OOH* reacting with H+ to form H2O and O* (ΔGb are −0.89 eV). Importantly, Cu@Mo2B2 has the lowest overpotential (ηORR = 0.34 V) for the ORR among all the studied TM@Mo2B2, which is even lower than that of Pt (ηORR = 0.45 V). Hence, Cu@Mo2B2 also exhibits good ORR catalytic activity apart from OER activity. Similarly, we computed the overpotential of pristine Mo2B2 for the ORR, as listed in Table S16,† and the result (ηORR = 1.50 V) indicates that the ORR performance for pristine Mo2B2 is greatly improved by embedding Mn, Co, Ni and Cu. In terms of kinetics, for the four elementary steps of the ORR proceeding on Cu@Mo2B2, the whole process is kinetically favorable, as shown in Fig. S6.† The third electron transfer step (O* reacting with H+ to form OH*) is the rate-limiting step with a moderate activation energy barrier of 0.75 eV. For the reverse process of the ORR, i.e., the OER, the third electron transfer step (O* reacting with H2O to form OOH* and H+) is the rate-limiting step with an activation energy barrier of 1.04 eV.
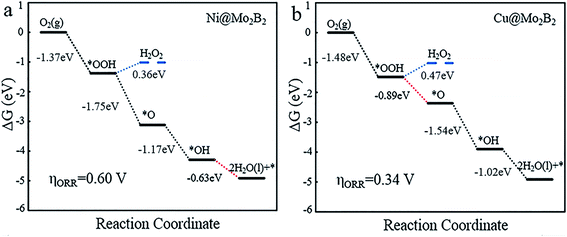 |
| | Fig. 5 The Gibbs free energy diagrams for the 4e− and 2e− ORR processes of (a) Ni@Mo2B2 and (b) Cu@Mo2B2 at site I, where the blue lines represent the 2e− ORR process, the black lines represent the 4e− ORR process, and the red dashed lines represent the most energy-consuming step of the ORR. | |
The most energy-consuming steps of the OER and ORR are both the third steps (ΔG3 = 3.9 eV, ΔGc = 0.27 eV) for Mo2B2. However, ΔG3 decreases to 1.75 and 0.89 eV while ΔGc decreases to −1.17 and −1.54 eV for Ni@Mo2B2 and Cu@Mo2B2, respectively, indicating that the catalytic activity of Mo2B2 is enhanced after embedding Ni or Cu. It is found that the valence state of Mo atoms is +0.61 in bare Mo2B2, while the valence states of Ni and Cu are only +0.22 and +0.20 in Ni@Mo2B2 and Cu@Mo2B2, respectively. The large positive net charges (high valence states) of Mo atoms result in strong adsorption between *O and the adjacent Mo atom in bare Mo2B2, leading to large ΔG3 and ΔGc. However, the bonding strength between *O and Ni/Cu atoms is moderate due to the relatively small positive net charges (low valence states) of Ni/Cu, contributing to decreased ΔG3 and ΔGc in Ni@Mo2B2 and Cu@Mo2B2.
In addition, from *OOH, there are several pathways to proceed, such as to form *O, HOOH or *OH + *OH. Notably, in acidic media, the 2e− reduction process forming HOOH is the competitive side reaction of the 4e− reduction process, which consists of the following steps:
| | | O2 + H+ + e− + * → OOH* | (17) |
| | | OOH* + H+ + e− → H2O2 | (18) |
To reveal the competitive relationship between the 4e− and 2e− processes, we plotted the Gibbs free energy diagrams of the two different processes for Ni@Mo2B2 and Cu@Mo2B2. As shown in Fig. 5, in the 2e− process, ΔG of the second elementary reaction of the 2e− reduction process (eqn (18)) is 0.36 and 0.47 eV for Ni@Mo2B2 and Cu@Mo2B2, respectively, which are both positive. However, in the 4e− process, the ΔGb values are −1.75 and −0.89 eV for Ni@Mo2B2 and Cu@Mo2B2, respectively, which are both negative. Therefore, Ni@Mo2B2 and Cu@Mo2B2 are highly selective for the 4e− process forming H2O rather than the 2e− process forming H2O2. Furthermore, as displayed in Fig. S5,† for Ni@Mo2B2, ΔG values from *OOH to *OH + *OH (0.29 eV) or *OH + *O (0.17 eV) are all positive. However, ΔGb is −1.75 eV for Ni@Mo2B2. Hence, Ni@Mo2B2 tends to the pathway from *OOH to *O rather than from *OOH to *OH + *OH or *OH + *O. For Cu@Mo2B2, ΔG from *OOH to *OH + *OH (−0.20 eV) is negative, but ΔGb from *OOH to *O (−0.89 eV) is more negative. In addition, ΔG from *OOH to *OH + *O (7.19 eV) is positive. Based on this, Cu@Mo2B2 is highly selective for the pathway from *OOH to *O rather than that from *OOH to *OH + *OH. Thus, Ni@Mo2B2 and Cu@Mo2B2 also possess high selectivity for the process of forming *O from *OOH.
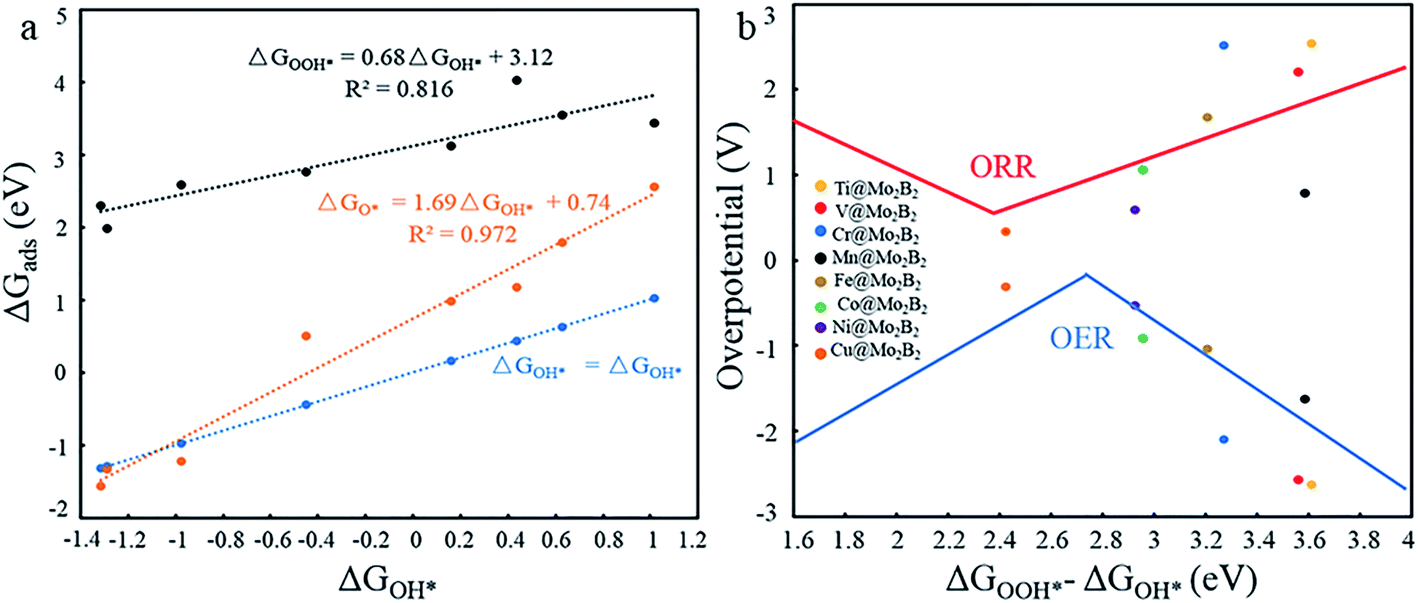
In previous work,5,14,26 the Gibbs free energies (ΔGOH*, ΔGO* and ΔGOOH*) of three intermediates have been considered as the possible descriptors for the binding strength between the active atoms of the catalyst and the intermediates. During the construction of free energy diagrams for TM@Mo2B2, a linear scaling relationship between ΔGOH* and ΔGO*, ΔGOOH* was observed. As shown in Fig. 6a, ΔGO* showed strong linear correlation with ΔGOH*, which can be described by the following expressions: ΔGO* = 1.69ΔGOH* + 0.74 eV with a coefficient of determination (R2) of 0.972. However, the linear relationship between ΔGOOH* and ΔGOH* is not strong. Therefore, ΔGOH* and ΔGOH* can be adopted as the descriptor for the binding strength between the active atoms of the catalyst and the intermediates. Based on the above relationship, a dual volcano plot for the ORR and OER was constructed, as shown in Fig. 6b. The dual volcano plot has unique advantages in describing the bifunctional activity for reversible OER/ORR processes (the strategy of the dual volcano plot is shown in the ESI†). When the OER and ORR locate more to the right on the branch of the volcano plot, the OH* binding strength is weaker. Located near the top of the OER volcano plot, Ni@Mo2B2 possesses good OER catalytic activity. Also, it is worth mentioning that Cu@Mo2B2 is at the top of both the OER and ORR volcano diagrams, indicating that Cu@Mo2B2 possesses outstanding OER/ORR bifunctional catalytic activity. Based on the values of overpotential and the dual volcano plot for the OER and ORR, Ni@Mo2B2 exhibits excellent OER (ηOER = 0.52 V) catalytic performance at site I, while Cu@Mo2B2 possesses superb catalytic activity for both the OER (ηOER = 0.31 V) and ORR (ηORR = 0.34 V), which can be applied in fuel cells and metal–air batteries.
 |
| | Fig. 6 (a) Scaling relationship between the ΔGOH* and ΔGO*, ΔGOOH* at site I. (b) Dual volcano plot for the OER and ORR for TM@Mo2B2 at site I. | |
3.4 HER catalytic activity
Generally, the entire HER process can be formularized by a three-state diagram, which consists of the initial state H+ + e−, the intermediate state H* and the final product H2. Herein, we study the HER catalytic activity of TM@Mo2B2 at four different sites by calculating the Gibbs free energy difference of the intermediate state H* and the final product H2 (ΔGH), which is considered to be the most important descriptor of the HER catalytic activity. Generally, the HER catalytic activity is considered to be high if |ΔGH| < 0.2 eV. The closer the value of |ΔGH| is to 0, the higher the HER catalytic activity is. ΔGH values of all the studied TM@Mo2B2 at different sites under 1/16 hydrogen coverage conditions are listed in Table S18†. As shown in Fig. 7, the HER performance of TM@Mo2B2 with high OER or ORR catalytic activity (Ni@Mo2B2 and Cu@Mo2B2) under 1/16 hydrogen coverage conditions was studied. We can conclude that Cu@Mo2B2 shows poor HER catalytic activity at site I, site II, site IV and site VII, while Ni@Mo2B2 exhibits high HER catalytic activity at site I, site II and site IV. For comparison, we also conducted the HER catalytic activity test of the pristine Mo2B2, and its |ΔGH| is 0.37 eV, indicating that embedding Ni in Mo vacancies of Mo2B2 MBenes improves the HER catalytic activity of Mo2B2. In addition, we further calculated the ΔGH of Ni@Mo2B2 under different H coverage at site I, as shown in Table S20†. The calculated ΔGH for Ni@Mo2B2 is −0.09 and 0.12 eV for hydrogen coverages of 1/4 and 1/9, respectively, indicating that under higher hydrogen coverages, Ni@Mo2B2 still exhibits high HER catalytic activity at site I. Among them, under 1/4 hydrogen coverage conditions, Ni@Mo2B2 exhibits high HER catalytic activity compared with Pt (0.09 eV).11 Considering the values of ΔGH and overpotential, Ni@Mo2B2 possesses excellent HER and OER (ηOER = 0.52 V) catalytic activity at site I and can be applied in water splitting.
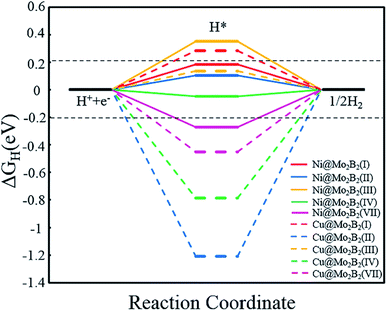 |
| | Fig. 7 Calculated Gibbs free energy diagram for the HER at different sites for Ni@Mo2B2 and Cu@Mo2B2 for a hydrogen coverage of 1/16. The two horizontal black dashed lines correspond to |ΔGH| = 0.2 eV. | |
Based on the above research, we can conclude that Ni@Mo2B2 and Cu@Mo2B2 possess high catalytic activity with lower overpotential than the traditional catalysts for a single reaction. In addition, the two electrocatalysts in our work have exhibited extremely high bifunctional catalytic activity so far. For Ni@Mo2B2, the overpotential of the HER/OER is −0.09/0.52 V, respectively, indicating better HER/OER catalytic performance than that of Cu3(HITP)2 (−0.02/0.75 V)14 and Mn-anchored C2N (−0.15/0.67 V).5 In particular, the overpotential of the OER/ORR for Cu@Mo2B2 (0.31/0.34 V) is much lower than that for Co3(HITP)2, Fe3(HITP)2, Zn3(HITP)2 (0.36/0.73 V, 0.83/0.59 V, and 0.89/0.52 V, respectively),14 Co-doped g-C3N4 (0.53/0.67 V),26 Fe-based covalent organic framework (0.38/0.48 V)50 and MoC2 (0.45/0.47 V).9 Therefore, Ni@Mo2B2 and Cu@Mo2B2 reported in this work are the best HER/OER and OER/ORR bifunctional catalysts so far.
4. Conclusions
In summary, we have demonstrated the feasibility of using TM@Mo2B2 as HER/OER and OER/ORR bifunctional electrocatalysts by means of first-principles computations. With good structural stability and metallic conductivity, the OER, ORR and HER catalytic activity of TM@Mo2B2 can be tailored by embedding different transition metals. In particular, Ni@Mo2B2 is a promising HER/OER bifunctional electrocatalyst for overall water splitting with a low |ΔGH| (−0.09 eV) for the HER under 1/4 H coverage and overpotential (0.52 V) for the OER. Meanwhile, Cu@Mo2B2 has the potential to be an OER/ORR bifunctional electrocatalyst characterized by low overpotentials for the OER and ORR (0.31 and 0.34 V, respectively) and can be compared with the best-known noble electrocatalysts. Our results indicate that TM@Mo2B2 MBenes are expected to be economical and efficient candidates for HER/OER and OER/ORR bifunctional electrocatalysts applied in water splitting, fuel cells and metal–air batteries.
Conflicts of interest
There are no conflicts to declare.
Acknowledgements
This work was financially supported by the National Key Research and Development Program of China (No. 2017YFB0701700) and National Natural Science Foundation of China (No. 51871009).
References
- L. Carrette, K. A. Friedrich and U. Stimming, Fuel Cells, 2001, 1, 5–39 CrossRef CAS.
- Z. H. Zhao, M. T. Li, L. P. Zhang, L. M. Dai and Z. H. Xia, Adv. Mater., 2015, 27, 6834–6840 CrossRef CAS.
- T. He, S. K. Matta, G. Will and A. Du, Small Methods, 2019, 3, 1800419 CrossRef.
- Z. W. Seh, J. Kibsgaard, C. F. Dickens, I. B. Chorkendorff, J. K. Norskov and T. F. Jaramillo, Science, 2017, 355, eaad4998 CrossRef PubMed.
- X. Zhang, A. Chen, Z. H. Zhang, M. G. Jiao and Z. Zhou, J. Mater. Chem. A, 2018, 6, 11446–11452 RSC.
- J. X. Gu, S. Magagula, J. X. Zhao and Z. F. Chen, Small Methods, 2019, 3, 1800550 CrossRef.
- Z. P. Cano, D. Banham, S. Y. Ye, A. Hintennach, J. Lu, M. Fowler and Z. W. Chen, Nat. Energy, 2018, 3, 279–289 CrossRef.
- D. Larcher and J. M. Tarascon, Nat. Chem., 2015, 7, 19–29 CrossRef CAS.
- Y. Yu, J. Zhou and Z. Sun, Adv. Funct. Mater., 2020, 2000570 CrossRef CAS.
- M. S. Dresselhaus and I. L. Thomas, Nature, 2001, 414, 332–337 CrossRef CAS PubMed.
- H. X. Xu, D. J. Cheng, D. P. Cao and X. C. Zeng, Nat. Catal., 2018, 1, 339–348 CrossRef CAS.
- J. K. Norskov, J. Rossmeisl, A. Logadottir, L. Lindqvist, J. R. Kitchin, T. Bligaard and H. Jonsson, J. Phys. Chem. B, 2004, 108, 17886–17892 CrossRef CAS.
- T. Reier, M. Oezaslan and P. Strasser, ACS Catal., 2012, 2, 1765–1772 CrossRef CAS.
- J. R. Wang, Y. C. Fan, S. Y. Qi, W. F. Li and M. W. Zhao, J. Phys. Chem. C, 2020, 124, 9350–9359 CrossRef CAS.
- W. F. Chen, C. H. Wang, K. Sasaki, N. Marinkovic, W. Xu, J. T. Muckerman, Y. Zhu and R. R. Adzic, Energy Environ. Sci., 2013, 6, 943–951 RSC.
- L. Liao, S. N. Wang, J. J. Xiao, X. J. Bian, Y. H. Zhang, M. D. Scanlon, X. L. Hu, Y. Tang, B. H. Liu and H. H. Girault, Energy Environ. Sci., 2014, 7, 387–392 RSC.
- Y. Zheng, Y. Jiao, L. H. Li, T. Xing, Y. Chen, M. Jaroniec and S. Z. Qiao, ACS Nano, 2014, 8, 5290–5296 CrossRef CAS PubMed.
- W. F. Chen, J. T. Muckerman and E. Fujita, Chem. Commun., 2013, 49, 8896–8909 RSC.
- B. R. Sathe, X. X. Zou and T. Asefa, Catal. Sci. Technol., 2014, 4, 2023–2030 RSC.
- T. Y. Ma, S. Dai, M. Jaroniec and S. Z. Qiao, Angew. Chem., Int. Ed., 2014, 53, 7281–7285 CrossRef CAS PubMed.
- G. L. Tian, M. Q. Zhao, D. S. Yu, X. Y. Kong, J. Q. Huang, Q. Zhang and F. Wei, Small, 2014, 10, 2251–2259 CrossRef CAS PubMed.
- J. Q. Tian, Q. Liu, A. M. Asiri, K. A. Alamry and X. P. Sun, ChemSusChem, 2014, 7, 2125–2130 CrossRef CAS PubMed.
- T. F. Jaramillo, K. P. Jorgensen, J. Bonde, J. H. Nielsen, S. Horch and I. Chorkendorff, Science, 2007, 317, 100–102 CrossRef CAS PubMed.
- R. Miao, B. Dutta, S. Sahoo, J. K. He, W. Zhong, S. A. Cetegen, T. Jiang, S. P. Alpay and S. L. Suib, J. Am. Chem. Soc., 2017, 139, 13604–13607 CrossRef CAS PubMed.
- H. T. Wang, H. W. Lee, Y. Deng, Z. Y. Lu, P. C. Hsu, Y. Y. Liu, D. C. Lin and Y. Cui, Nat. Commun., 2015, 6, 7261 CrossRef CAS PubMed.
- Y. Zheng, Y. Jiao, Y. H. Zhu, Q. R. Cai, A. Vasileff, L. H. Li, Y. Han, Y. Chen and S. Z. Qiao, J. Am. Chem. Soc., 2017, 139, 3336–3339 CrossRef CAS PubMed.
- C. Y. Ling, L. Shi, Y. X. Ouyang, X. C. Zeng and J. L. Wang, Nano Lett., 2017, 17, 5133–5139 CrossRef CAS PubMed.
- B. K. Zhang, J. Zhou, Z. L. Guo, Q. Peng and Z. M. Sun, Appl. Surf. Sci., 2020, 500, 144248 CrossRef CAS.
- Q. Peng, J. Zhou, J. T. Chen, T. Zhang and Z. M. Sun, J. Mater. Chem. A, 2019, 7, 26062–26070 RSC.
- Z. L. Guo, J. Zhou and Z. M. Sun, J. Mater. Chem. A, 2017, 5, 23530–23535 RSC.
- H. M. Zhang, H. M. Xiang, F. Z. Dai, Z. L. Zhang and Y. C. Zhou, J. Mater. Sci. Technol., 2018, 34, 2022–2026 CrossRef.
- Z. Jiang, P. Wang, X. Jiang and J. J. Zhao, Nanoscale Horiz., 2018, 3, 335–341 RSC.
- L. T. Alameda, P. Moradifar, Z. P. Metzger, N. Alem and R. E. Schaak, J. Am. Chem. Soc., 2018, 140, 8833–8840 CrossRef CAS PubMed.
- L. T. Alameda, R. W. Lord, J. A. Barr, P. Moradifar, Z. P. Metzger, B. C. Steimle, C. F. Holder, N. Alem, S. B. Sinnott and R. E. Schaak, J. Am. Chem. Soc., 2019, 141, 10852–10861 CrossRef CAS PubMed.
- J. J. Wang, T. N. Ye, Y. T. Gong, J. Z. Wu, N. X. Miao, T. Tada and H. Hosono, Nat. Commun., 2019, 10, 2284 CrossRef PubMed.
- S. Ji, Y. Chen, X. Wang, Z. Zhang, D. Wang and Y. Li, Chem. Rev., 2020, 120, 11900–11955 CrossRef CAS PubMed.
- F. Huang, Y. C. Deng, Y. L. Chen, X. B. Cai, M. Peng, Z. M. Jia, J. L. Xie, D. Q. Xiao, X. D. Wen, N. Wang, Z. Jiang, H. Y. Liu and D. Ma, Nat. Commun., 2019, 10, 4431 CrossRef PubMed.
- L. B. Wang, W. B. Zhang, S. P. Wang, Z. H. Gao, Z. H. Luo, X. Wang, R. Zeng, A. W. Li, H. L. Li, M. L. Wang, X. S. Zheng, J. F. Zhu, W. H. Zhang, C. Ma, R. Si and J. Zeng, Nat. Commun., 2016, 7, 14036 CrossRef CAS PubMed.
- Y. T. Shi, C. Y. Zhao, H. S. Wei, J. H. Guo, S. X. Liang, A. Q. Wang, T. Zhang, J. Y. Liu and T. L. Ma, Adv. Mater., 2014, 26, 8147–8153 CrossRef CAS PubMed.
- J. Y. Liu, ACS Catal., 2017, 7, 34–59 CrossRef CAS.
- W. Zhang and W. T. Zheng, Adv. Funct. Mater., 2016, 26, 2988–2993 CrossRef CAS.
- A. Q. Wang, J. Li and T. Zhang, Nat. Rev. Chem., 2018, 2, 65–81 CrossRef CAS.
- G. Kresse and J. Furthmuller, Phys. Rev. B: Condens. Matter Mater. Phys., 1996, 54, 11169–11186 CrossRef CAS PubMed.
- J. P. Perdew, K. Burke and M. Ernzerhof, Phys. Rev. Lett., 1996, 77, 3865–3868 CrossRef CAS PubMed.
- S. Grimme, J. Comput. Chem., 2006, 27, 1787–1799 CrossRef CAS PubMed.
- D. Le, T. B. Rawal and T. S. Rahman, J. Phys. Chem. C, 2014, 118, 5346–5351 CrossRef CAS.
- A. A. El-Barbary, R. H. Telling, C. P. Ewels, M. I. Heggie and P. R. Briddon, Phys. Rev. B, 2003, 68, 144107 CrossRef.
- H. Wu, Z. L. Guo, J. Zhou and Z. M. Sun, Appl. Surf. Sci., 2019, 488, 578–585 CrossRef CAS.
- I. C. Man, H. Y. Su, F. Calle-Vallejo, H. A. Hansen, J. I. Martinez, N. G. Inoglu, J. Kitchin, T. F. Jaramillo, J. K. Norskov and J. Rossmeisl, ChemCatChem, 2011, 3, 1159–1165 CrossRef CAS.
- C. Y. Lin, L. P. Zhang, Z. H. Zhao and Z. H. Xia, Adv. Mater., 2017, 29, 1606635 CrossRef PubMed.
Footnotes |
| † Electronic supplementary information (ESI) available. See DOI: 10.1039/d0ta08630d |
| ‡ These authors contributed equally. |
|
| This journal is © The Royal Society of Chemistry 2021 |
Click here to see how this site uses Cookies. View our privacy policy here. 
 *ab and
Zhimei
Sun
*ab and
Zhimei
Sun