 Open Access Article
Structural analysis of disordered dimer packings
Esma
Kurban
 and
Adrian
Baule
 *
*
School of Mathematical Sciences, Queen Mary University of London, Mile End Road, London E1 4NS, UK. E-mail: a.baule@qmul.ac.uk
First published on 20th September 2021
Abstract
Jammed disordered packings of non-spherical particles show significant variation in the packing density as a function of particle shape for a given packing protocol. Rotationally symmetric elongated shapes such as ellipsoids, spherocylinders, and dimers, e.g., pack significantly denser than spheres over a narrow range of aspect ratios, exhibiting a characteristic peak at aspect ratios of αmax ≈ 1.4–1.5. However, the structural features that underlie this non-monotonic behaviour in the packing density are unknown. Here, we study disordered packings of frictionless dimers in three dimensions generated by a gravitational pouring protocol in LAMMPS. Focusing on the characteristics of contacts as well as orientational and translational order metrics, we identify a number of structural features that accompany the formation of maximally dense packings as the dimer aspect ratio α is varied from the spherical limit. Our results highlight that dimer packings undergo significant structural changes as α increases up to αmax manifest in the reorganisation of the contact configurations between neighbouring dimers, increasing nematic order, and decreasing local translational order. Remarkably, for α > αmax our metrics remain largely unchanged, indicating that the peak in the packing density is related to the interplay of structural rearrangements for α < αmax and subsequent excluded volume effects with unchanged structure for α > αmax.
1 Introduction
Jammed disordered particle packings have been used as a model to understand the structures of liquid crystals, glasses, self-assembly of nanoparticles, biological systems and granular media.1 While there has been considerable recent progress in our understanding of jammed sphere packings,2 the effect of particle shape on the properties of jammed packings has been much less explored.3 Considering one of the simplest macroscopic observables of packings – the packing density – one finds that many non-spherical shapes pack denser than spheres, which achieve maximal packing densities of ϕj ≈ 0.64 for a wide range of packing protocols (although denser packings can also be achieved for specific protocols, see the discussion in ref. 4). For example, many polyhedra,5–9 ellipsoids,10–13 spherocylinders,14–20 and dimers,21,22 as well as irregular shapes such as those composed of a number of overlapping spheres23,24 achieve packing densities ϕj ≥ 0.7, with the densest disordered packings so far found for tetrahedra at ϕj ≈ 0.78.5 Plotting the packing density as a function of a continuous shape descriptor, such as the aspect ratio α (for rotationally symmetric elongated shapes), exhibits a non-monotonic behaviour with a peak at α ≈ 1.4–1.5 for ellipsoids, spherocylinders, and dimers, with some variations due to the packing protocol. For larger aspect ratios, the packing density decreases, following, e.g., an approximate scaling behaviour ϕj ∼ 1/α for spherocylinders.25In this study, we revisit dimer packings simulated with the MD platform LAMMPS using a gravitational pouring protocol. Our goal is to identify structural features that characterize the peak in the packing density by focusing on details of the contact statistics as well as positional and orientational order metrics. In this context, it is important to emphasize the role of the protocol in the packing generation. The interplay between the packing density and the degree of order that arises by tuning the protocol parameters has been widely discussed for spheres, most notably in the critique of the well-posedness of the concept of “random close packing”.26 For non-spherical particles, the protocol dependence is manifest in the relatively large variance of results reported for ϕj for the same shape, e.g., for spherocylinders.14–20 Our viewpoint is thus to focus on packings generated by a specific protocol, namely the widely used pouring under gravity, and understand how shape variation changes the structural features of these packings.
Previous studies of ordering effects in random packings of elongated particles obtained inconsistent results, which might be due to different protocols and boundary conditions used. For example, simulations of prolate ellipsoids by pouring into a container under gravity found considerable nematic order, whereby the ellipsoids’ symmetry axes (the semi-major axes) tend to lie within the plane normal to the gravity direction.10,11,27 This ordering effect has been explained as a result of the particles' tendency to minimize the gravitational potential energy.10 On the other hand, simulations that compress or inflate the non-spherical particles from an initial random state such as the Lubachevsky–Stillinger algorithm (applied to ellipsoids12,28) or a mechanical contraction algorithm (applied to spherocylinders29–31) do not find any significant order as is also observed with other geometric simulation methods.32,33 While 3D experiments of ellipsoids13 and elongated colloids34 did not observe any signatures of order, experiments of asymmetric dumbbells in 2D showed strong orientational correlations between neighbours due to mutual restrictions on positions.35 The order characteristics of dimers in 3D have so far not been investigated to our knowledge.
The remainder of this article is organized as follows: in Section 2 we present the details of our simulation method with LAMMPS. In Section 3, we present results on our analysis of the packing fraction, contact number, and orientational/positional order metrics. Finally, we conclude in Section 4 with a discussion of our results.
2 Simulation method
Disordered packings of monodisperse frictionless symmetric dimers in three dimensions are generated with the molecular dynamics platform LAMMPS.36,37 The dimers are obtained by overlapping two identical spheres with diameter d and mass m. We study dimers with aspect ratios α in the range 1.0005 ≤ α ≤ 2, where α is given as the ratio of the length over the width, see Fig. 1. In this packing protocol, N = 12![[thin space (1/6-em)]](https://www.rsc.org/images/entities/char_2009.gif) 000–15
000–15![[thin space (1/6-em)]](https://www.rsc.org/images/entities/char_2009.gif) 000 monodisperse dimers are poured under gravity into a three-dimensional box of side length ≈20d. The lateral (
000 monodisperse dimers are poured under gravity into a three-dimensional box of side length ≈20d. The lateral (![[x with combining circumflex]](https://www.rsc.org/images/entities/b_char_0078_0302.gif) –ŷ-plane) boundary conditions are chosen to be periodic and the box is bounded in the ẑ-direction by a rough surface at the bottom (implemented by the “fix wall/gran hertz/history” command). During a simulation run, a gravitational force acts on the dimers in the ẑ-direction. The pouring protocol makes use of LAMMPS’ “fix pour” command, which repeatedly inserts particles into the simulation box every few timesteps within a specified insertion region 30–40d above the bottom and releases them until N particles have been added overall. In the insertion region, particles are added with random positions and orientations and without any overlap. Particles are only inserted again after the previously inserted particles have fallen out of the insertion region under the gravitational force.
–ŷ-plane) boundary conditions are chosen to be periodic and the box is bounded in the ẑ-direction by a rough surface at the bottom (implemented by the “fix wall/gran hertz/history” command). During a simulation run, a gravitational force acts on the dimers in the ẑ-direction. The pouring protocol makes use of LAMMPS’ “fix pour” command, which repeatedly inserts particles into the simulation box every few timesteps within a specified insertion region 30–40d above the bottom and releases them until N particles have been added overall. In the insertion region, particles are added with random positions and orientations and without any overlap. Particles are only inserted again after the previously inserted particles have fallen out of the insertion region under the gravitational force.
LAMMPS treats a dimer defined by a fixed distance between its two constituent spheres as an independent rigid body (implemented by the “fix rigid/small” command). The total force and torque on each dimer rigid body are computed as the sum of the forces and torques on its constituent spheres in every time step. The coordinates, velocities, and orientations of the constituent spheres are then updated so that the dimer moves and rotates as a single entity.
LAMMPS can natively implement different models for calculating the contact forces between the spheres. In this study, a Hookean model is chosen because of its convenience to dissipate residual kinetic energy and hence to reach a static state quickly.38 In the Hookean model, when two spheres i and j having positions ri and rj, respectively, are in contact, they experience a relative normal compression with overlap δ = d − rij, where rij = ri − rj and rij = |rij|. The resulting force is Fij = Fnij + Ftij, where Fn,tij are the normal and tangential contact forces, respectively, given as:38
 | (1) |
 | (2) |
Throughout the investigation we set our basic units as d = 1, m = π/6, and g = 1. Distances, times, velocities, forces and elastic constants are then measured in units of d,  ,
,  , mg, mg/d, respectively. We generally use a normal spring constant Kn = 2 × 10⁵mg/d unless otherwise indicated. Additionally, we simulate also harder dimers with Kn = 2 × 10⁶mg/d and softer ones with Kn = 2 × 10⁴mg/d to examine the effect of particle hardness on the contact number of the dimers at small aspect ratios. We set γt = 0 and the remaining parameters used are given in Table 1. The choice of most of these values follows the discussion in ref. 39.
Simulations are run until the system reaches a static equilibrium when the kinetic energy per particle is less than 10−8mgd for small Kn and up to three orders of magnitude less for large Kn. For example, when Kn = 2 × 10⁵mg/d the simulation takes 3–8 × 10⁶Δt to reach equilibrium, which depends on the chosen aspect ratio and also on the random initial configurations when particles are poured into the container. For further details of any of the LAMMPS commands used, we refer the reader to the LAMMPS documentation.37
3 Structural analysis
3.1 Packing fraction
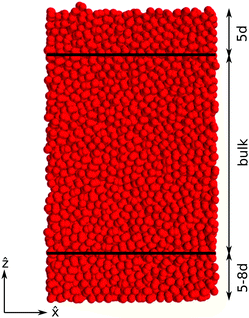
We calculate the packing fraction of the dimer packings for various aspect ratios. The packing density is determined for the bulk region shown in Fig. 2. The particles within 5–8d from the container floor are excluded from the bulk region since they can be highly crystallized. The thickness of this crystallized region depends on many factors such as the box dimension and the pouring height. Excluding the particles within 5–8d provides results that are largely unaffected by the crystallization. The particles within 5d from the upper-most particles have also been excluded from the bulk because their Voronoi volumes can not be decided accurately due to deficiencies in their neighbourhood.In order to determine the packing density in the bulk region, we calculate the Voronoi volume of each dimer in the bulk, which is defined as the space that is closer to the surface of a given dimer than to that of any other dimer. While a formal parametrization of the Voronoi volume of a dimer is analytically tractable,40 a straightforward computational method makes use of LAMMPS’ built-in routine to determine the Voronoi volume of the individual spheres in the packing using a conventional Voronoi tessellation. The Voronoi volume Wi of a dimer is then found by summing the Voronoi volumes of its two constituent spheres. The bulk volume Vb occupied by Nb dimers in the bulk is calculated as  . We then obtain the packing fraction as ϕj = NbVα/Vb where Vα is the volume of a dimer with aspect ratio α. The volume Vα is found by subtracting the overlap volume from the sum of its constituent sphere volumes. The overlap volume contains two equal spherical caps whose volume can be calculated exactly, see Appendix A. Note that a dimer is considered to be part of the bulk region only if the centres of both constituent spheres are within the bulk. All average quantities discussed in the following are calculated for dimers in the bulk only.
We plot the packing fraction ϕj of the dimers as a function of the aspect ratio α in Fig. 3. As can be seen from Fig. 3, the packing fraction ϕj has a non-monotonic relationship with α, i.e., it increases as α increases until reaching a peak at ϕj = 0.707 for α = αmax = 1.4, beyond that it decreases. These results are in agreement with previous studies21,22 and also show reasonably good agreement with results from a mean-field calculation,40 shown in Fig. 3. Systematic deviations between our simulations and the mean field theory are in particular visible in the behaviour for larger aspect ratios α > 1.5, which are likely due to the strong mean-field assumptions. In fact, the mean-field theory relies on a reduction of higher-order positional correlations to pair correlations and also neglects orientational correlations between particles. The latter become more significant for particles of larger aspect ratios, see Section 3.3.1.
3.2 Contact and coordination numbers
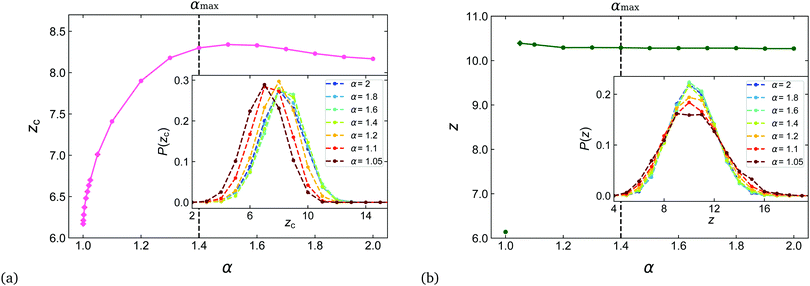
We introduce the contact number z as the average number of contact points of a dimer and the coordination number zc as the average number of neighbours of a dimer, whereby a neighbour is defined as another dimer with which at least one contact point is shared. While z = zc for smooth convex shapes like spheres, ellipsoids, and spherocylinders, z ≥ zc for concave shapes like dimers, since two particles can share more than one contact point. In general, two dimers A and B share a contact point if the separation vector of two spheres i and j, with sphere i in dimer A and sphere j in dimer B, satisfies rij ≤ d, which can be detected with high numerical precision. Two dimers can thus share up to four different contact points. Due to the soft interaction potential the contact “point” is strictly a small overlap region, which creates some complications at small dimer aspect ratios, see below.In Fig. 4(a) we show the behaviour of zc as a function of α and the associated distributions of zc for a set of aspect ratios. We observe a smooth increase of zc(α) for α > 1 with a maximum at zc = 8.34 for α = 1.5 followed by a slight decay. The qualitative behaviour is in line with the results of ref. 22, where dimer packings were generated using an energy minimization protocol, although our values of zc are consistently larger over the range of aspect ratios. The distributions P(zc) are approximately symmetric and Gaussian (Fig. 4(a), inset).
On the other hand, the contact number z does not exhibit such a smooth increase, see Fig. 4(b). First establishing the baseline for sphere packings at α = 1 with our protocol, we find that z = 6.14 for spheres. This value is slightly above the isostatic value of z = 2df = 6, where df denotes the degrees of freedom of a particle, generally found for disordered sphere packings using a variety of packing protocols.4 We suspect that this difference is due to the gravitational packing protocol and the interaction potential with non-zero softness, see also the comparable values found in the studies of sphere packings21,39 using a similar protocol. Deforming spheres into dimers, the smallest aspect ratio of dimers for which we are able to report the contact number reliably is α = 1.05, for which we find z = 10.39. For larger aspect ratios, z decreases slightly, but then remains unchanged at z = 10.28 for α > 1.2. The difference with the isostatic value z = 2df = 10 is approximately of the same magnitude as the difference for spheres using our packing protocol. By comparison, the studies in ref. 22, 41 and 42 find that dimers are almost exactly isostatic, which is thus in line with our findings. The observation of a constant z for all aspect ratios of dimers is an important difference with the behaviour of convex elongated shapes such as ellipsoids and spherocylinders, which are hypostatic (z < 2df) at small aspect ratios and show a smooth increase upon shape deformation from the sphere like the coordination number zc here.28,30
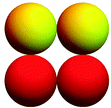
We highlight that for very small aspect ratios α ∈ (1,1.05) the calculation of z is unreliable, since our particle model leads to incorrect contact detections: the overlap regions due to the particle softness can extend far enough into the dimer as to create a contact with an interior sphere as illustrated in Fig. 5.
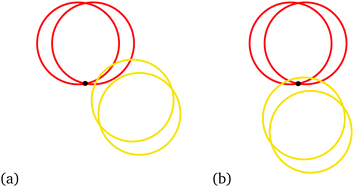 | ||
| Fig. 5 Illustrations of “double” and “cusp” contacts shown in 2D as discussed in ref. 41. (a) Double contact: the yellow sphere is embedded into the red dimer so deeply that it contacts both red spheres. (b) Cusp contact: the yellow sphere contacts both red spheres by covering the cusp point (black point) of the red dimer. | ||
Such problematic contact configurations for dimers were also identified in the recent work by Shiraishi et al.22,41 and separated into “double” and “cusp” contacts, see Fig. 5. Shiraishi et al. investigated the contact number of dimer packings using a compression protocol with soft particle interactions for various packing densities ϕ. For large enough values of the excess packing density Δϕ = ϕ − ϕj, where ϕj denotes the packing density at jamming onset, “double” and “cusp” contacts were observed. In their analysis, these contacts could thus be avoided by setting an upper limit for Δϕ at each aspect ratio studied and they observed that this upper limit approaches zero as α → 1. In our case, the occurrence of these configurations depends on the stiffness value Kn as shown in Fig. 6, where it can be seen that the threshold aspect ratio, at which double and cusp contacts occur, is shifted to smaller aspect ratios for larger Kn. For any value of Kn, double and cusp contacts will occur at sufficiently small aspect ratios and thus the contact number very close to the sphere shape can not be reliably established. For Kn = 2 × 10⁵ we see that double and cusp contacts do not occur for α ≥ 1.05, which is the lower limit of α used in our contact number analysis.
 | ||
| Fig. 6 The fraction of double (solid lines) and cusp contacts (dashed lines) in the dimer packings for small α and three normal spring constants Kn. | ||
In order to refine our analysis of the packing microstructure, we define five distinct contact configurations according to the number of contact points that are shared by two neighbouring dimers, see Table 2. Excluding the regime α ∈ [1,1.05), we determine how the fraction of each configuration type changes as a function of α, see Fig. 7. We see that even though the average number of contacts z is approximately constant over this range of α, the underlying contact configurations change significantly with α. Most notably, the two most common contact configurations, Type 1 and Type 2, increase and decrease, respectively, as α increases up to around αmax and remain approximately unchanged for α > αmax. The remaining contact configurations confirm this trend, showing the strongest variations in the regime α < αmax. Overall, we see that contact configurations, in which spheres of neighbouring dimers only have one contact point (Type 1 and Type 3) increase, while those with multiple contact points (Types 2, 4 and 5) decrease as the packing becomes denser up to the packing density peak at αmax. This trend is somewhat counter-intuitive, since the Types 2, 4 and 5 configurations correspond to more optimal local arrangements between two dimers, which locally reduce the packing density. Similar results for the fractions of these five configuration types have been found for packings of shapes composed of four overlapping spheres.43
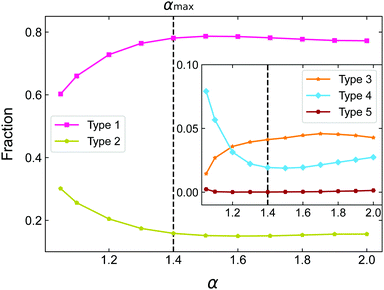 | ||
| Fig. 7 The fractions of the five contact configuration types of Table 2 for packings of dimers with different α. | ||
Rather than excluding the aspect ratio regime where the problematic double and cusp contacts occur it might be tempting to re-assign such contacts and thus infer the properties of the small aspect ratio regime in an ad hoc way. For example, a double contact as in Fig. 5(a), which creates two overlaps of sphere pairs and is thus counted as two contact points, could be counted as only one, effectively ignoring the incorrect overlap with the interior sphere. This can be done likewise for other contact configurations, which require a careful consideration of the relative position and orientation of the overlapping dimer pair, see the full discussion in Appendix D. Re-assigning contacts in this way leads to a rapid but smooth decrease of z to the corresponding value of spheres z ≈ 6 as α → 1 (Fig. 21), but also exhibits seemingly unphysical behaviour, such as sharp peaks in the fractions of the Types 1–5 contact configurations around α ≈ 1.05, i.e., at the aspect ratio where double and cusp contacts start to occur (Fig. 22).
3.3 Order metrics
We employ several order metrics to measure global and local ordering in the dimer packings at various aspect ratios. The nematic orientational order parameter and the orientational pair correlation function are used to evaluate orientational ordering. Translational ordering is investigated with bond orientational order parameters, the radial distribution function and bond angle distributions. All calculations are made for the particles within the bulk volume so as to discard the crystallized region observed at the bottom of the container. | (3) |
 is the second Legendre polynomial and βi the angle between the orientation of dimer i and the so-called director, which specifies the average orientation of the particles. The dimer orientation is described by the unit vector u(i) measured along the dimer's long axis.
We apply this parameter to the dimer packings to quantify the global orientational order. When all u(i) are randomly oriented, S = 0, while if all u(i) are oriented in a plane normal to the director, S = −0.5, which corresponds to a perfect oblate phase. When all u(i) are aligned with the director, we have perfect nematic order with S = 1.
In order to determine the director and S, we first evaluate the tensor Ω defined as:
 | (4) |
Denoting by λmax the eigenvalue of Ω with the largest absolute value, we identify the director as the eigenvector corresponding to λmax. For all aspect ratios, we find that the director is aligned with the ẑ-axis (gravity direction). We then obtain S directly as:
| S = λmax. | (5) |
We also determine the orientational pair correlation function S2 in order to quantify local ordered structures at a radial distance r from a reference particle. S2 is calculated as:
 | (6) |
![[thin space (1/6-em)]](https://www.rsc.org/images/entities/char_2009.gif) βij = u(i)·u(j) and ni(r) denotes the set of particles in a spherical shell of width Δ(r) = 0.025d at a distance r from the centre of dimer i in the bulk. The expression |ni(r)| refers to the size (cardinality) of the set ni(r). We note that the spherical shell considered in S2 can extend into the boundary region beyond the bulk and thus include particles in partially crystallized regions, although the effect on the average should be small. In general, due to the non-periodic boundary conditions in the ẑ-direction our packings are not rotationally invariant and thus the restriction to a radial coordinate is only an approximation.
βij = u(i)·u(j) and ni(r) denotes the set of particles in a spherical shell of width Δ(r) = 0.025d at a distance r from the centre of dimer i in the bulk. The expression |ni(r)| refers to the size (cardinality) of the set ni(r). We note that the spherical shell considered in S2 can extend into the boundary region beyond the bulk and thus include particles in partially crystallized regions, although the effect on the average should be small. In general, due to the non-periodic boundary conditions in the ẑ-direction our packings are not rotationally invariant and thus the restriction to a radial coordinate is only an approximation.
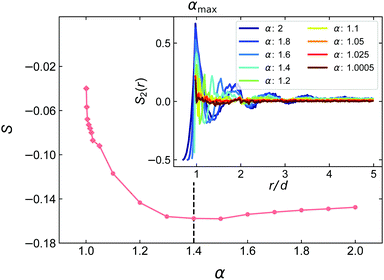
We present the dependence of S and S2(r) on the aspect ratio α in Fig. 8. We see that S changes rapidly as α increases from the sphere value, reaching its minimum at around αmax and remaining approximately constant for α > αmax, in line with the behaviour of zc and the different contact types. Interestingly, the behaviour of S(α) as α → 1 appears almost singular, but the range of values is not sufficient to identify a clear power-law. The minimum of S at ≈−0.16 indicates slight oblate ordering, where the dimers' long axes are oriented close to the horizontal plane normal to the direction of gravity. This ordering is thus in agreement with that observed in simulation studies of prolate ellipsoids using also pouring under gravity.10,11,27 In order to compare the magnitude of the orientational ordering with these studies, we also calculated the order parameter χ used in ref. 10, 11 and 27, which is defined in eqn (17). We find a maximum of χ ≈ 0.32 for α = 1.4. By comparison, in ref. 10 the maximum is χ ≈ 0.4 for α ≈ 1.5, while ref. 11 and 27 find χ ≈ 0.25 and χ ≈ 0.5, respectively, for α ≈ 1.5. Note that in ref. 11 and 27, χ monotonically increases upon further elongation over the observed range of aspect ratios.
The plot of S2 in Fig. 8(inset) demonstrates how orientational correlations become more long-range for larger aspect ratios. For small α, correlations decay rapidly within the first coordination shell, while for large α oscillations in S2 are visible over the whole range of r/d, which is here limited by r/d = 5, i.e., the width of the boundary region on top of the bulk region that restricts the maximum radius of the spherical shell used in eqn (6).
Steinhardt et al.45 associated with every bond joining a particle and its neighbours a set of spherical harmonics:
 | (7) |
The local orientational order parameter ql(i) of particle i is then defined as the following rotational invariant combination of qlm:
 | (8) |
Moreover, the global orientational order parameter Ql is defined as
 | (9) |
 | (10) |
Recently, Eslami et al. introduced the local order parameters  to improve the determination of liquid and different crystallized phases.54 Starting from the qlm of eqn (7), we first determine
 | (11) |
 is the complex conjugate of
 ![[q with combining circumflex]](https://www.rsc.org/images/entities/i_char_0071_0302.gif) lm(j) and
lm(j) and ![[q with combining circumflex]](https://www.rsc.org/images/entities/i_char_0071_0302.gif) lm(i) is defined as follows:
lm(i) is defined as follows: | (12) |
Then the order parameters  are obtained by averaging over the first coordination shell of particle i:
 | (13) |
 over ql is that they can distinguish the liquid phase and different crystalline phases in a more accurate way.54 They indicate in fact the correlation between the order in the first and the second coordination shell of a reference particle.54 It has been observed that
  is large ≈1 for crystalline phases, while
  assumes values close to zero for disordered (liquid) phases, which thus allows to easily discriminate between such phases. On the other hand, the values of
  are sensitive to the crystal type, so
  is able to distinguish bcc, fcc, and hcp crystals.
We display the pairs  for each dimer in the bulk region of the packing in Fig. 10 for various aspect ratios. By comparing these results to empirical data for liquid, bcc, hcp, and fcc phases of Lennard-Jones particles from ref. 54, we observe that the distributions at large aspect ratios (α > 1.4) are quite clearly in a liquid phase where −0.05 <
  < 0.3 and 0 <
  < 0.4. As the aspect ratio decreases, the region occupied by
  and
and  expands and approaches the region occupied by the bcc/hcp crystal phases indicating the presence of a large proportion of dimers exhibiting some local translational order intermediate between a liquid and bcc/hcp crystalline order.
 | ||
Fig. 10 The local order parameters  and and  defined in eqn (13). Every data point corresponds to a dimer in the bulk region of the packing. The sketched regions for bcc, hcp, fcc, and liquid phases of Lennard-Jones particles are taken from ref. 54. defined in eqn (13). Every data point corresponds to a dimer in the bulk region of the packing. The sketched regions for bcc, hcp, fcc, and liquid phases of Lennard-Jones particles are taken from ref. 54. | ||
We also calculate the averages  ,
,  and compare their values with the global order parameters Q4, Q6 for different aspect ratios, see Fig. 11. While Q4 is close to zero for all aspect ratios, there is a slight increase in Q6 for α < 1.4 implying some global ordering at small aspect ratios. In line with the observations in Fig. 10, we see that both
  and
and  are non-zero and monotonically decreasing as α increases, whereby
  varies over a larger range than
  . For small aspect ratios, both averages are considerably larger than the corresponding averages of a fluid phase, which were determined as
  and
and  in ref. 54. Overall, we observe that at large aspect ratios the packing is more translationally disordered than at small aspect ratios.
 | ||
Fig. 11 The global bond orientational order parameters Q4, Q6 and the averages  and and  vs. α. By comparison, vs. α. By comparison,  and and  for the liquid phase of Lennard-Jones particles.54 for the liquid phase of Lennard-Jones particles.54 | ||
 | (14) |
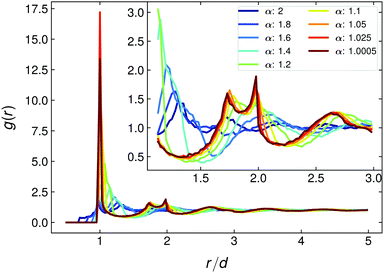 | ||
| Fig. 12 The radial distribution function g(r) of the dimer packings, eqn (14), for different α. Inset: Enlargement of the regime r/d ∈ [1.125,3]. | ||
 | ||
| Fig. 13 PDFs of the polar and azimuthal angles θij, ϕij of the bond vectors rij for all neighbour pairs i, j and different aspect ratios. | ||
To get a better insight into the origin of these structures, the PDFs of θij, ϕij are further refined according to the contact configuration type between neighbouring dimers, see Fig. 14–16. For aspect ratio α = 1.05 (Fig. 14), we see that for Types 2–5 only configurations with θij ≈ 90° are possible due to the geometric constraint of these configuration types. The structure observed in the overall bond diagram at very small aspect ratios (Fig. 13a and b) is thus primarily due to Type 1 configurations and the peak at θij ≈ 90°. For larger aspect ratios α = αmax = 1.4 and α = 2, the bands for Types 2–4 widen due to the increase in possible relative orientations that still satisfy the contact constraint (see Fig. 15 and 16). This excludes Type 5 configurations which are available only in a narrow range of possible polar angles by definition. As expected, Type 1 configurations with only a single contact point between neighbours, which thus least constrains the relative orientations, exhibit a wide band of possible polar angles at all aspect ratios, see Fig. 14(a), 15(a) and 16(a). Interestingly, this band still exhibits some structure, with a main peak at θij = 90° and symmetric secondary peaks at θij = 30° and θij = 150° for both α = 1.05 and α = 1.4, which disappear for α = 2.
 | ||
| Fig. 14 PDFs of the polar and azimuthal angles θij, ϕij of the bond vectors rij for all neighbour pairs i, j with a specific contact type. Aspect ratio: α = 1.05. | ||
 | ||
| Fig. 15 PDFs of the polar and azimuthal angles θij, ϕij of the bond vectors rij for all neighbour pairs i, j with a specific contact type. Aspect ratio: α = αmax = 1.4. | ||
4 Conclusions
One of the main results of our study is the identification of structural features that accompany the formation of the peak in the packing density of jammed dimer particles. In particular, we find that (i) the coordination number zc; (ii) the fractions of Types 1–4 contact configurations; and (iii) the nematic order parameter S undergo rapid changes upon deforming spheres into dimers with aspect ratios up to α ≈ αmax, while further elongation of the dimers leaves these metrics largely unchanged. This highlights that the peak in the packing density of Fig. 3 arises due to microscopic re-arrangements up to α≈ αmax and subsequent excluded volume effects: the contact configurations remain statistically unchanged for α > αmax, but since the particles are longer the packing can sustain more empty space while being mechanically stable, in line with the phenomenological description of spherocylinder packings using the random contact equation, which predicts a decay ϕj ∼ 1/α.56Dimers are a convenient shape model, because their contact interactions can be easily implemented by overlapping spheres. As such they represent one of the simplest non-spherical and concave shapes. However, our analysis shows that such a particle model does not allow to resolve the contact configurations at very small aspect ratios when interactions are not truly hard. As such we are not able to probe in our simulations, e.g., the analytical predictions from effective medium theory on the contact number scaling for very small shape deformations.57 The problematic double and cusp contacts should generally occur for shapes composed of overlapping (soft) spheres as used, e.g., in the optimization studies of ref. 23 and 24, which might prevent a detailed analysis of the contact properties of such simulated packings.
Our investigation highlights the competition between orientational and translational order as a result of elongation. While the translational order is larger for small aspect ratios, the elongation induces the dimers to have both more orientationally ordered local structures (with slight global oblate ordering) and less translational order akin to those of a liquid. Dimers at large aspect ratios thus exhibit structures that resemble a liquid crystal in terms of these metrics. Importantly, the structural features identified here might be specific to the gravitational packing protocol used and might not occur in dimer packings obtained with other packing methods such as energy minimization from a random initial configuration.22 Nevertheless, due to the simplicity of the protocol, which is also relevant in many real world scenarios, we expect our results to be significant to understand the packing density and structural properties of real granular matter composed of non-spherical particles.
Conflicts of interest
There are no conflicts to declare.Appendix
A Calculation of the dimer volume
The overlap volume of the two constituent spheres of a dimer contains two equal spherical caps which lie above/below the plane through the cusp points at the dimer's centre, see Fig. 17. The volume of a spherical cap Vcap of height h is found as: | (15) |
 as:
as:| Vα = 2Vsphere − 2Vcap | (16) |
 | ||
| Fig. 17 The overlap volume of a dimer contains two equal spherical caps of height h (coloured in yellow). | ||
B Algorithm for the identification of double and cusp contacts
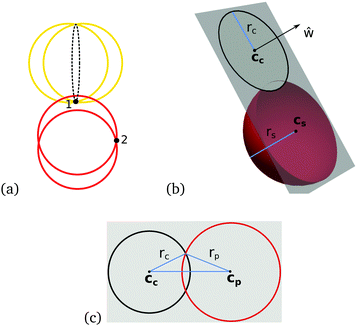
Double and cusp contacts are identified by checking if there is any overlap between the circle enclosing the cusp on the dimer surface and a contacting sphere of its neighbouring dimer, see Fig. 18(a). This circle with centre cc, radius rc and unit normal w and a sphere with centre cs, radius rs are shown in Fig. 18(b). The next steps are followed for the identification:1. The distance dcs = |w·(cc − cs)| between the plane of the circle and the sphere's centre is calculated to check if the plane cuts the sphere or not. If dcs > rs then there is no intersection, so the plane passes above/below the sphere entirely.
2. If there is an intersection, i.e., dcs < rs, it will be between the original circle and a new one formed where this plane meets the sphere, with centre cp = cs + dcsw.
3. If dcs = rs then this is the sole point of intersection with the plane, otherwise a new circle with radius rp occurs as displayed in Fig. 18(c), where  . Then, the problem has been reduced to a circle–circle interaction.
4. If |cp − cc| < rc + rp, then there is overlap between the circle and the sphere, so the contact is identified as a cusp contact. If there is no overlap, then the contact is either a double contact or a Type 2 configuration.
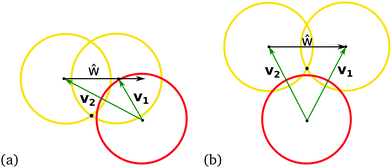
5. To distinguish a double and a Type 2 configuration, two vectors v1 and v2 from the contacting sphere's centre to the centres of the constituting spheres of the reference dimer are determined as illustrated in Fig. 19. The projections of these two vectors onto the unit normal w of the circle enclosing cusp are determined and the directions of these projections are checked. If both of them have the same direction, the contact is identified as a double contact, otherwise it is regarded as a Type 2 configuration.
C The order parameter χ
In ref. 10 the following order parameter has been introduced to measure the orientational order of prolate ellipsoids | (17) |
 | ||
| Fig. 20 The orientational order parameter χ vs. α. Values of χ are shown averaged over 10 independent simulation runs for α ≥ 1.1 (dots), and for a single run for α < 1.1 (diamonds). | ||
D Mapping between different contact configuration types
We introduce a heuristic method to re-assign configurations with double and cusp contacts to one of the Types 1, 2, and 4 configurations. The precise mapping depends on the number and the location of double and cusp contacts as summarized in Table 3. In general, double contacts are mapped to one contact point and cusp contacts to two. For Type 3 configurations, no double or cusp contacts have been found. For Type 5 configurations, two cusp contacts do occur, which leave the configuration as Type 5 after the mapping.With this mapping, we count a smaller number of contact points and thus the average number of contacts z decreases. In fact, we obtain a rapid but smooth decrease of z as α → 1, whereby z approaches the corresponding value of spheres (Fig. 21). Resolving the contact counting by Types 1–5 configurations, we see that, as expected, the fraction of Type 1 configurations now increases for α < 1.05, while the fractions of Types 2, 4 and 5 configurations decreases in the same regime (Fig. 22). In fact, the adjusted counting of contact points leads to sharp peaks at α ≈ 1.05, i.e., at the aspect ratio at which double and cusp contacts start to occur, that appear unphysical.
 | ||
| Fig. 22 The fractions of the contact configurations of Types 1–5 vs. the aspect ratio α. For α ≥ 1.05 the data shown is the same as in Fig. 7, but in the regime α < 1.05 (dashed lines) the contact counting has been adjusted by re-assigning configurations with double and cusp contacts to Types 1, 2, and 4 configurations as summarized in Table 3. | ||
Acknowledgements
This research utilised Queen Mary's Apocrita HPC facility, supported by QMUL Research-IT http://doi.org/10.5281/zenodo.438045. We acknowledge the assistance of the ITS Research team at Queen Mary University of London.Notes and references
- S. Torquato and F. H. Stillinger, Rev. Mod. Phys., 2010, 82, 2633 CrossRef.
- P. Charbonneau, J. Kurchan, G. Parisi, P. Urbani and F. Zamponi, Annu. Rev. Condens. Matter Phys., 2017, 8, 265 CrossRef.
- A. Baule and H. A. Makse, Soft Matter, 2014, 10, 4423 RSC.
- A. Baule, F. Morone, H. J. Herrmann and H. A. Makse, Rev. Mod. Phys., 2018, 90, 015006 CrossRef CAS.
- A. Haji-Akbari, M. Engel, A. S. Keys, X. Zheng, R. G. Petschek, P. Palffy-Muhoray and S. C. Glotzer, Nature, 2009, 462, 773 CrossRef CAS PubMed.
- Y. Jiao and S. Torquato, Phys. Rev. E: Stat., Nonlinear, Soft Matter Phys., 2011, 84, 041309 CrossRef PubMed.
- P. Damasceno, M. Engel and S. Glotzer, Science, 2012, 337, 453 CrossRef CAS PubMed.
- R. Shepherd, J. Conrad, T. Sabuwala, G. Gioia and J. A. Lewis, Soft Matter, 2012, 8, 4795 RSC.
- L. Liu, Z. Li, Y. Jiao and S. Li, Soft Matter, 2017, 13, 748 RSC.
- B. J. Buchalter and R. M. Bradley, Europhys. Lett., 1994, 26, 159 CrossRef CAS.
- G. Delaney, J. Hilton and P. Cleary, Phys. Rev. E: Stat., Nonlinear, Soft Matter Phys., 2011, 83, 051305 CrossRef PubMed.
- A. Donev, I. Cisse, D. Sachs, E. Variano, F. Stillinger, R. Connelly, S. Torquato and P. Chaikin, Science, 2004, 303, 990 CrossRef CAS PubMed.
- W. Man, A. Donev, F. Stillinger, M. Sullivan, W. Russel, D. Heeger, S. Inati, S. Torquato and P. Chaikin, Phys. Rev. Lett., 2005, 94, 198001 CrossRef PubMed.
- S. R. Williams and A. P. Philipse, Phys. Rev. E: Stat., Nonlinear, Soft Matter Phys., 2003, 67, 051301 CrossRef CAS PubMed.
- J. Zhao, S. Li, R. Zou and A. Yu, Soft Matter, 2012, 8, 1003 RSC.
- C. Abreu, F. Tavares and M. Castier, Powder Technol., 2003, 134, 167 CrossRef CAS.
- X. Jia, M. Gan, R. A. Williams and D. Rhodes, Powder Technol., 2007, 174, 10 CrossRef CAS.
- M. Bargiel, Computational Science-ICCS2008, 2008, vol. 5102, p. 126.
- A. Wouterse, S. Luding and A. P. Philipse, Granular Matter, 2009, 11, 169 CrossRef.
- A. V. Kyrylyuk, M. A. van de Haar, L. Rossi, A. Wouterse and A. P. Philipse, Soft Matter, 2011, 7, 1671 RSC.
- S. Faure, A. Lefebvre-Lepot and B. Semin, Esaim: Proceedings, 2009, vol. 28, p. 13.
- K. Shiraishi, H. Mizuno and A. Ikeda, J. Phys. Soc. Jpn., 2020, 89, 074603 CrossRef.
- M. Z. Miskin and H. Jaeger, Soft Matter, 2014, 10, 3708 RSC.
- L. Roth and H. Jaeger, Soft Matter, 2016, 12, 1107 RSC.
- A. Philipse, Langmuir, 1996, 12, 1127 CrossRef CAS.
- S. Torquato, T. M. Truskett and P. G. Debenedetti, Phys. Rev. Lett., 2000, 84, 2064 CrossRef CAS PubMed.
- J. Gan and A. Yu, Powder Technol., 2020, 361, 424 CrossRef CAS.
- A. Donev, R. Connelly, F. Stillinger and S. Torquato, Phys. Rev. E: Stat., Nonlinear, Soft Matter Phys., 2007, 75, 051304 CrossRef PubMed.
- A. Wouterse, S. R. Williams and A. Philipse, J. Phys.: Condens. Matter, 2007, 19, 406215 CrossRef PubMed.
- A. Wouterse, S. Luding and A. Philipse, Granular Matter, 2009, 11, 169 CrossRef.
- C. Ferreiro-Córdova and J. S. V. Duijneveldt, J. Chem. Eng. Data, 2014, 59, 3055 CrossRef.
- J. Zhao, S. Li, R. Zou and A. Yu, Soft Matter, 2012, 8, 1003 RSC.
- L. Meng, Y. Jiao and S. Li, Powder Technol., 2016, 292, 176 CrossRef CAS.
- S. Sacanna, L. Rossi, A. Wouterse and A. Philipse, J. Phys.: Condens. Matter, 2007, 19, 376108 CrossRef.
- Y. Han and M. Kim, Soft Matter, 2012, 8, 9015 RSC.
- S. Plimpton, J. Comput. Phys., 1995, 117, 1 CrossRef CAS.
- LAMMPS, http://lammps.sandia.gov.
- L. Silbert, D. Ertas, G. S. Grest, T. Halsey, D. Levine and S. Plimpton, Phys. Rev. E: Stat., Nonlinear, Soft Matter Phys., 2001, 64, 051302 CrossRef CAS PubMed.
- L. Silbert, D. Ertas, G. S. Grest, T. Halsey and D. Levine, Phys. Rev. E: Stat., Nonlinear, Soft Matter Phys., 2002, 65, 031304 CrossRef PubMed.
- A. Baule, R. Mari, L. Bo, L. Portal and H. Makse, Nat. Commun., 2013, 4, 2194 CrossRef PubMed.
- K. Shiraishi, H. Mizuno and A. Ikeda, Phys. Rev. E: Stat., Nonlinear, Soft Matter Phys., 2019, 100, 012606 CrossRef CAS PubMed.
- C. F. Schreck, N. Xu and C. S. O'Hern, Soft Matter, 2010, 6, 2960 RSC.
- E. Azéma, F. Radja, B. Saint-Cyr, J.-Y. Delenne and P. Sornay, Phys. Rev. E: Stat., Nonlinear, Soft Matter Phys., 2013, 87, 052205 CrossRef PubMed.
- P. G. de Gennes and J. Prost, The Physics of Liquid Crystal, Clarendon Press, 2nd edn, 1995 Search PubMed.
- P. Steinhardt, D. Nelson and M. Ronchetti, Phys. Rev. B: Condens. Matter Mater. Phys., 1983, 28, 784 CrossRef CAS.
- A. Kansal, S. Torquato and F. Stillinger, Phys. Rev. E: Stat., Nonlinear, Soft Matter Phys., 2002, 66, 041109 CrossRef PubMed.
- T. Aste, M. Saadatfar and T. Senden, Phys. Rev. E: Stat., Nonlinear, Soft Matter Phys., 2005, 71, 061302 CrossRef CAS PubMed.
- K. Lochmann, A. Anikeenko, A. Elsner, N. N. Medvedev and D. Stoyan, Eur. Phys. J. B, 2006, 53, 67 CrossRef CAS.
- A. Wouterse and A. Philipse, J. Chem. Phys., 2006, 125, 194709 CrossRef CAS PubMed.
- Y. Jin and H. Makse, Phys. A, 2010, 389, 5362 CrossRef CAS.
- W. Xu, Z.-Y. Sun and L. An, Eur. Phys. J. E: Soft Matter Biol. Phys., 2010, 31, 377 CrossRef CAS PubMed.
- S. Kapfer, W. Mickel, K. Mecke and G. Schröder-Turk, Phys. Rev. E: Stat., Nonlinear, Soft Matter Phys., 2012, 85, 030301 CrossRef PubMed.
- W. Mickel, S. Kapfer, G. Schröder-Turk and K. Mecke, J. Chem. Phys., 2013, 138, 044501 CrossRef PubMed.
- H. Eslami, P. Sedaghat and F. Müller-Plathe, Phys. Chem. Chem. Phys., 2018, 20, 27059 RSC.
- A. Donev, S. Torquato and F. Stillinger, Phys. Rev. E: Stat., Nonlinear, Soft Matter Phys., 2005, 71, 011105 CrossRef PubMed.
- A. Philipse, Langmuir, 1996, 12, 1127 CrossRef CAS.
- C. Brito, H. Ikeda, P. Urbani, M. Wyart and F. Zamponi, Proc. Natl. Acad. Sci. U. S. A., 2018, 115, 11736 CrossRef CAS PubMed.
| This journal is © The Royal Society of Chemistry 2021 |


